
Sliding Mode Control with Sliding Perturbation Observer-Based Strategy for Reducing Scratch Formation in Hot Rolling Process †

Abstract
:1. Introduction
- Flying touch method
- Velocity synchronization method
2. Scratch Formation Reduction Strategy
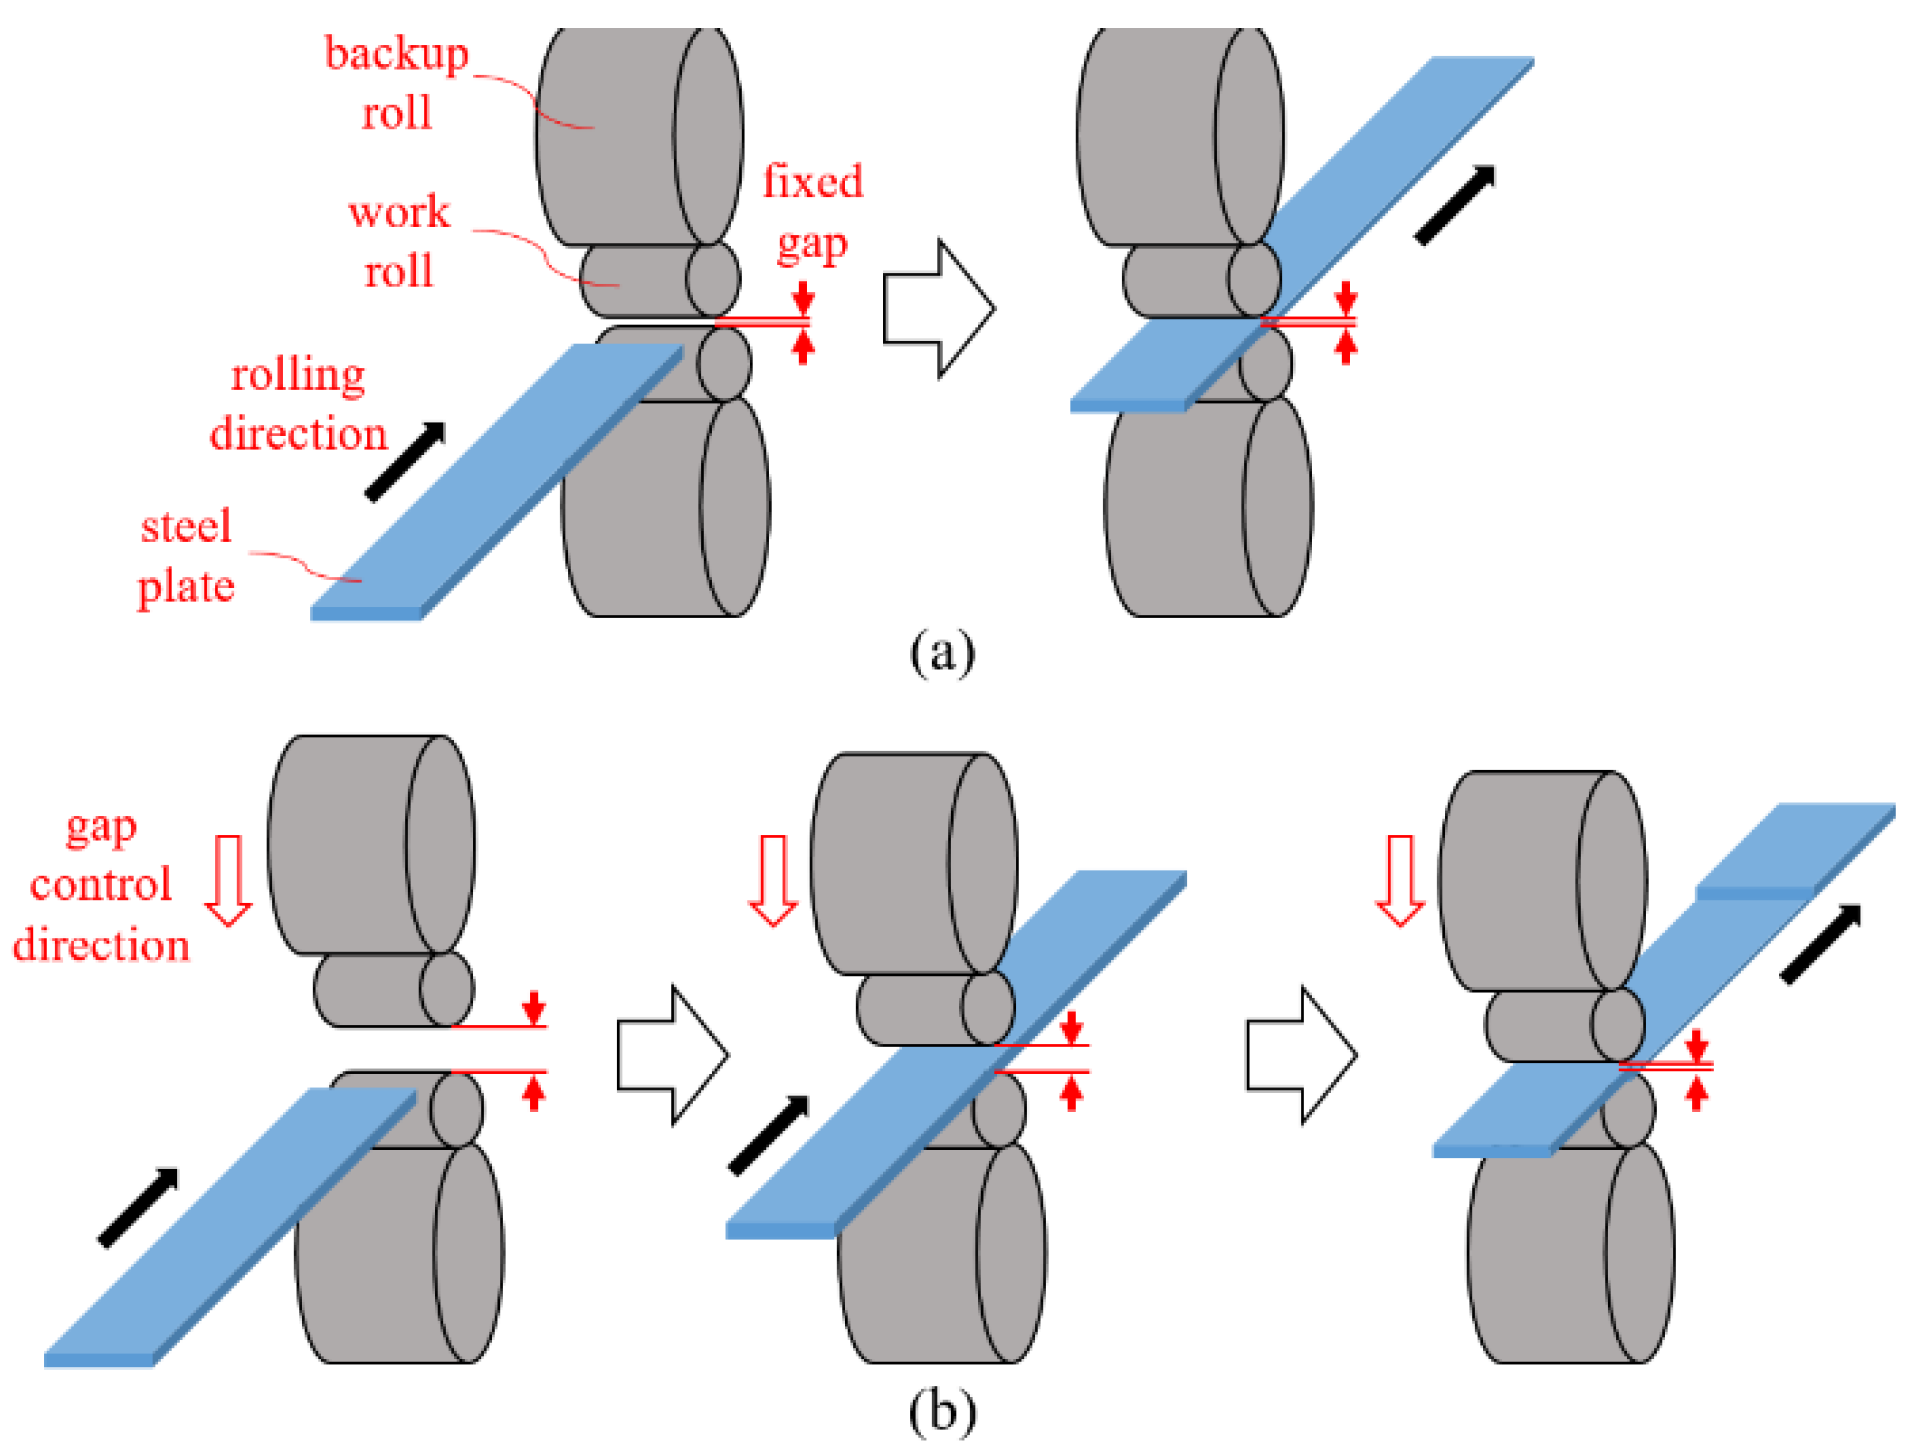
2.1. Flying Touch Method
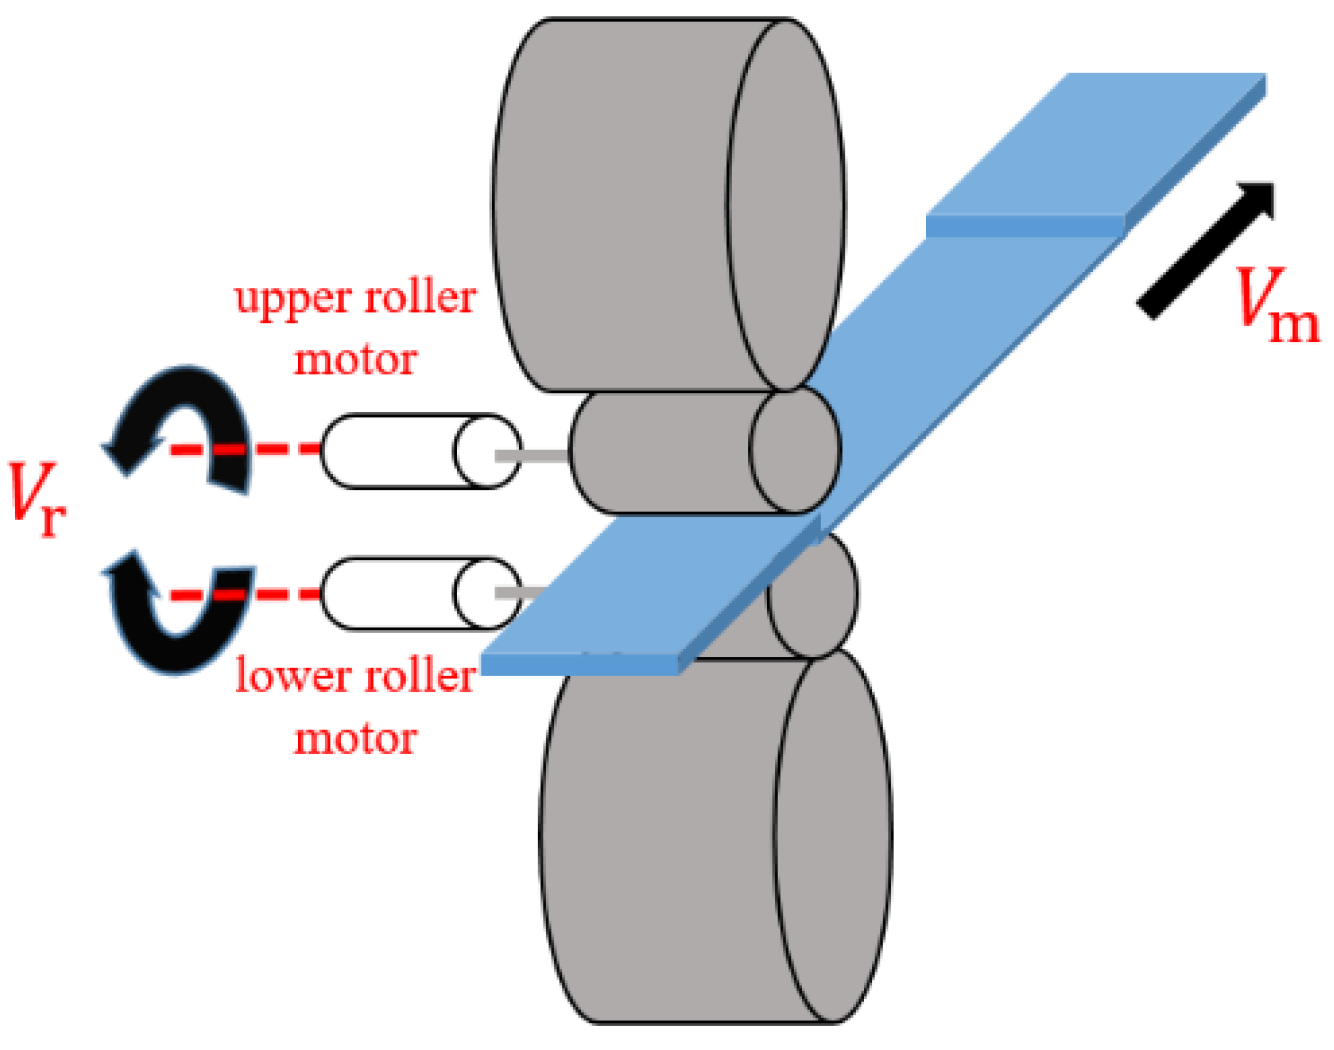
2.2. Velocity Synchronization
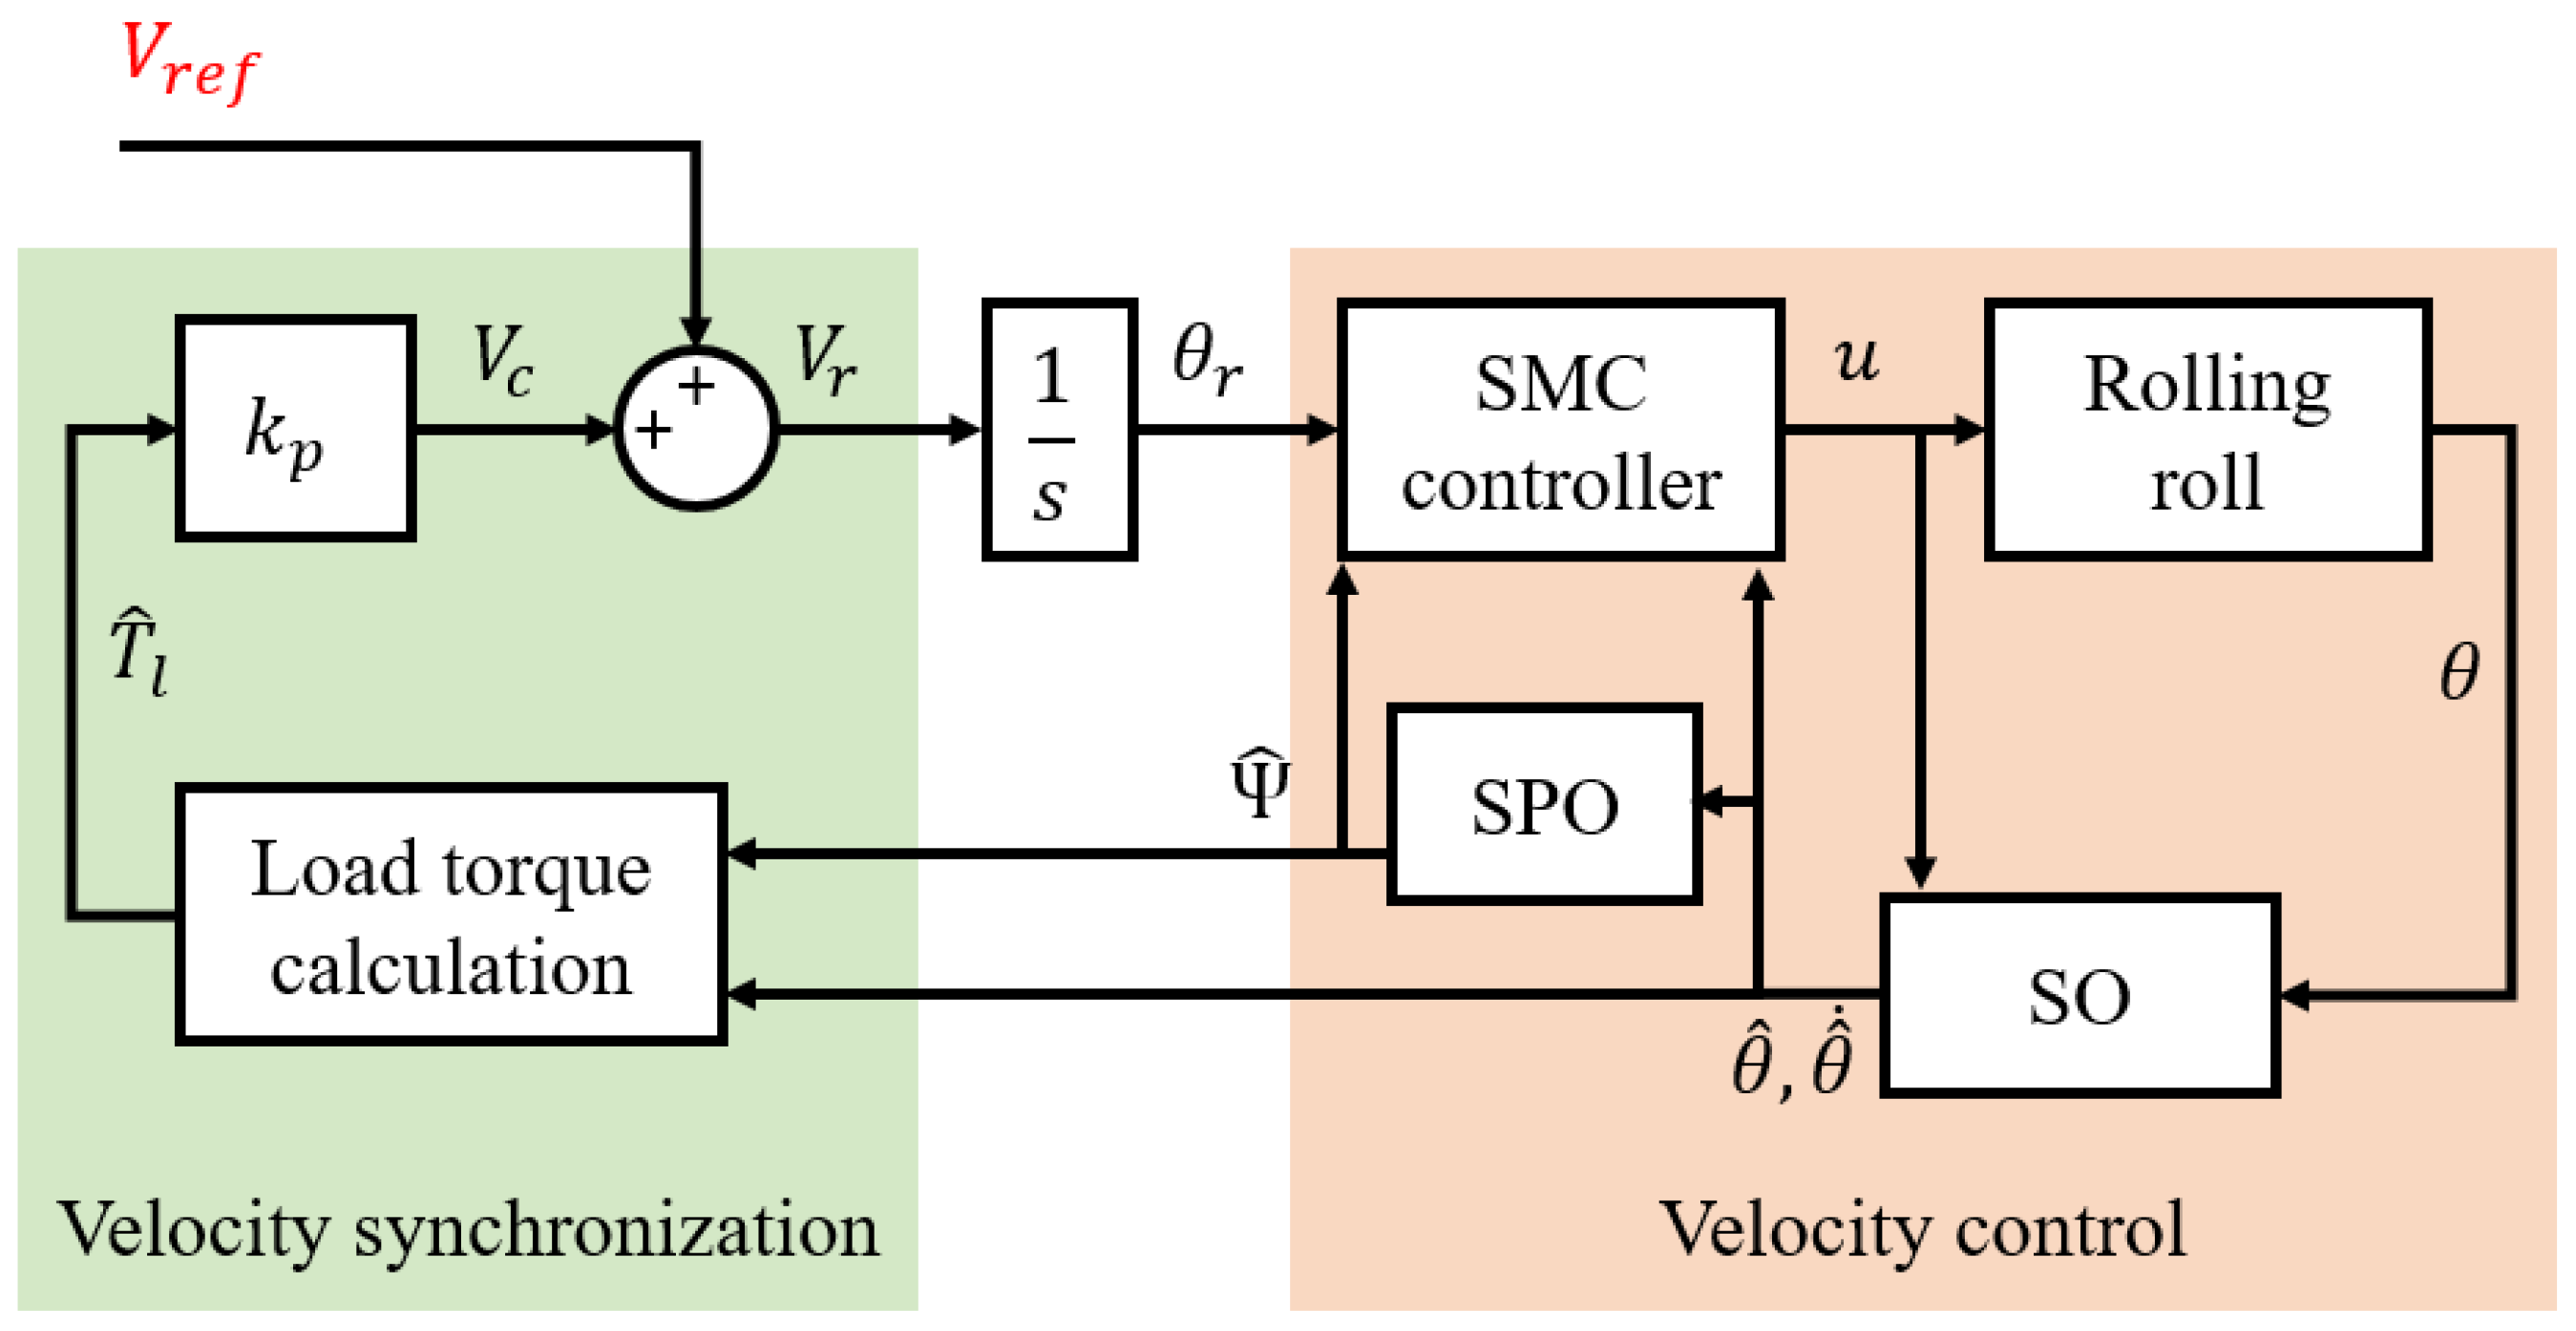
3. Observer and Controller Design for Scratch Formation Reduction
3.1. SPO
3.2. SMCSPO
3.3. Stability Analysis of SPO and SMCSPO
4. Simulation
4.1. Robotics Lab Simulation
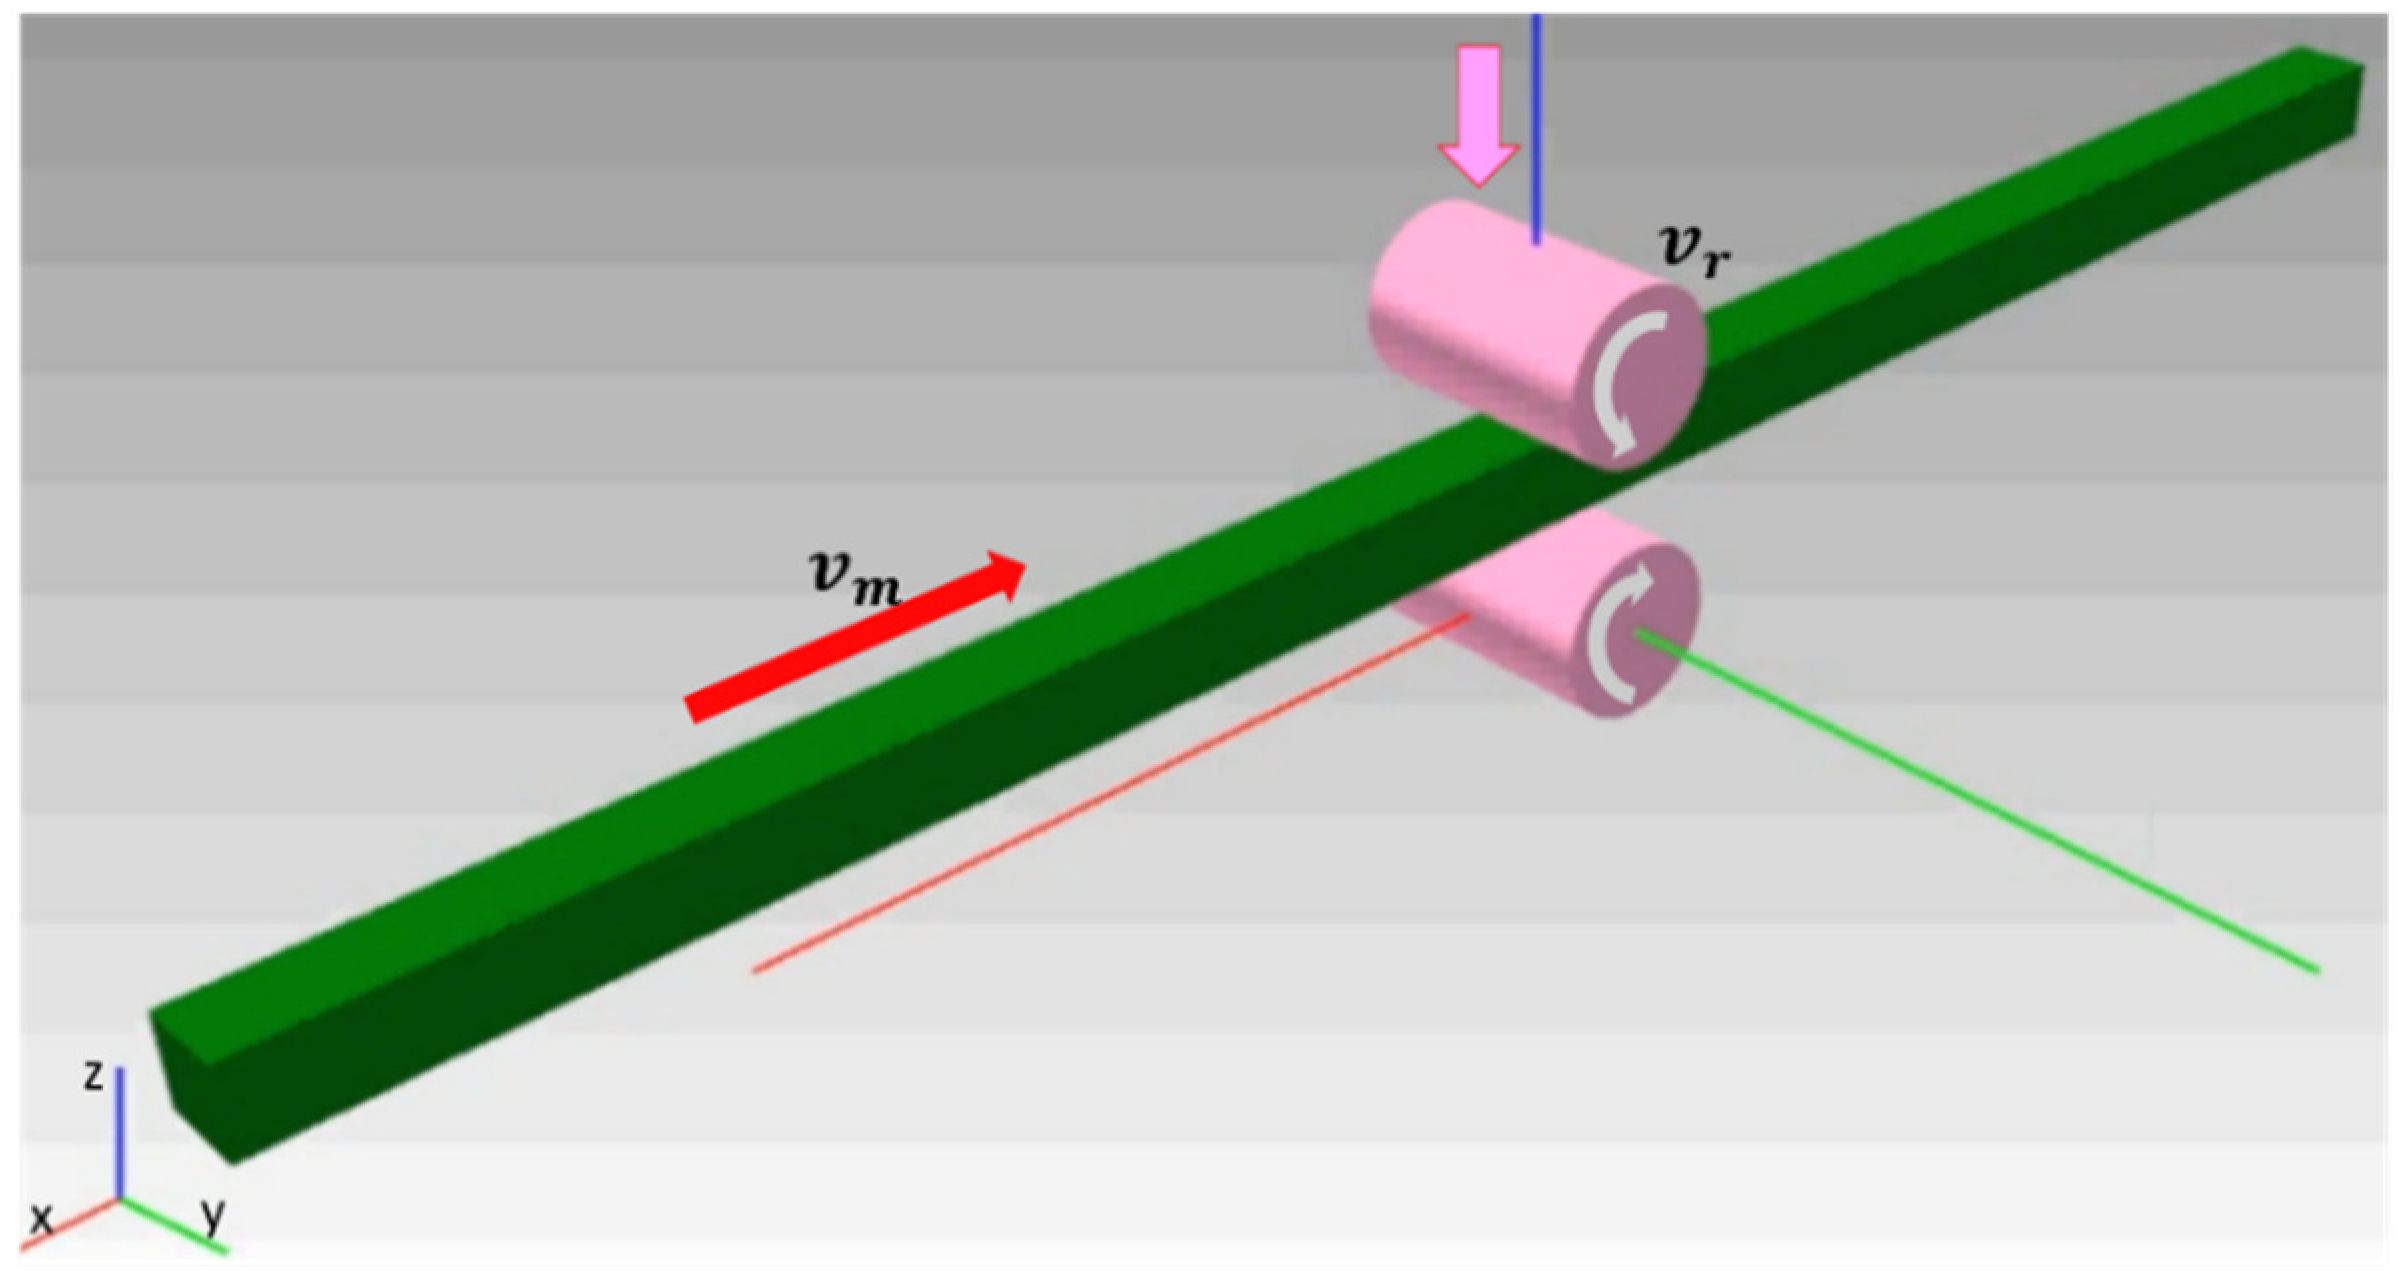
4.2. ANSYS Simulation for Velocity Synchronization
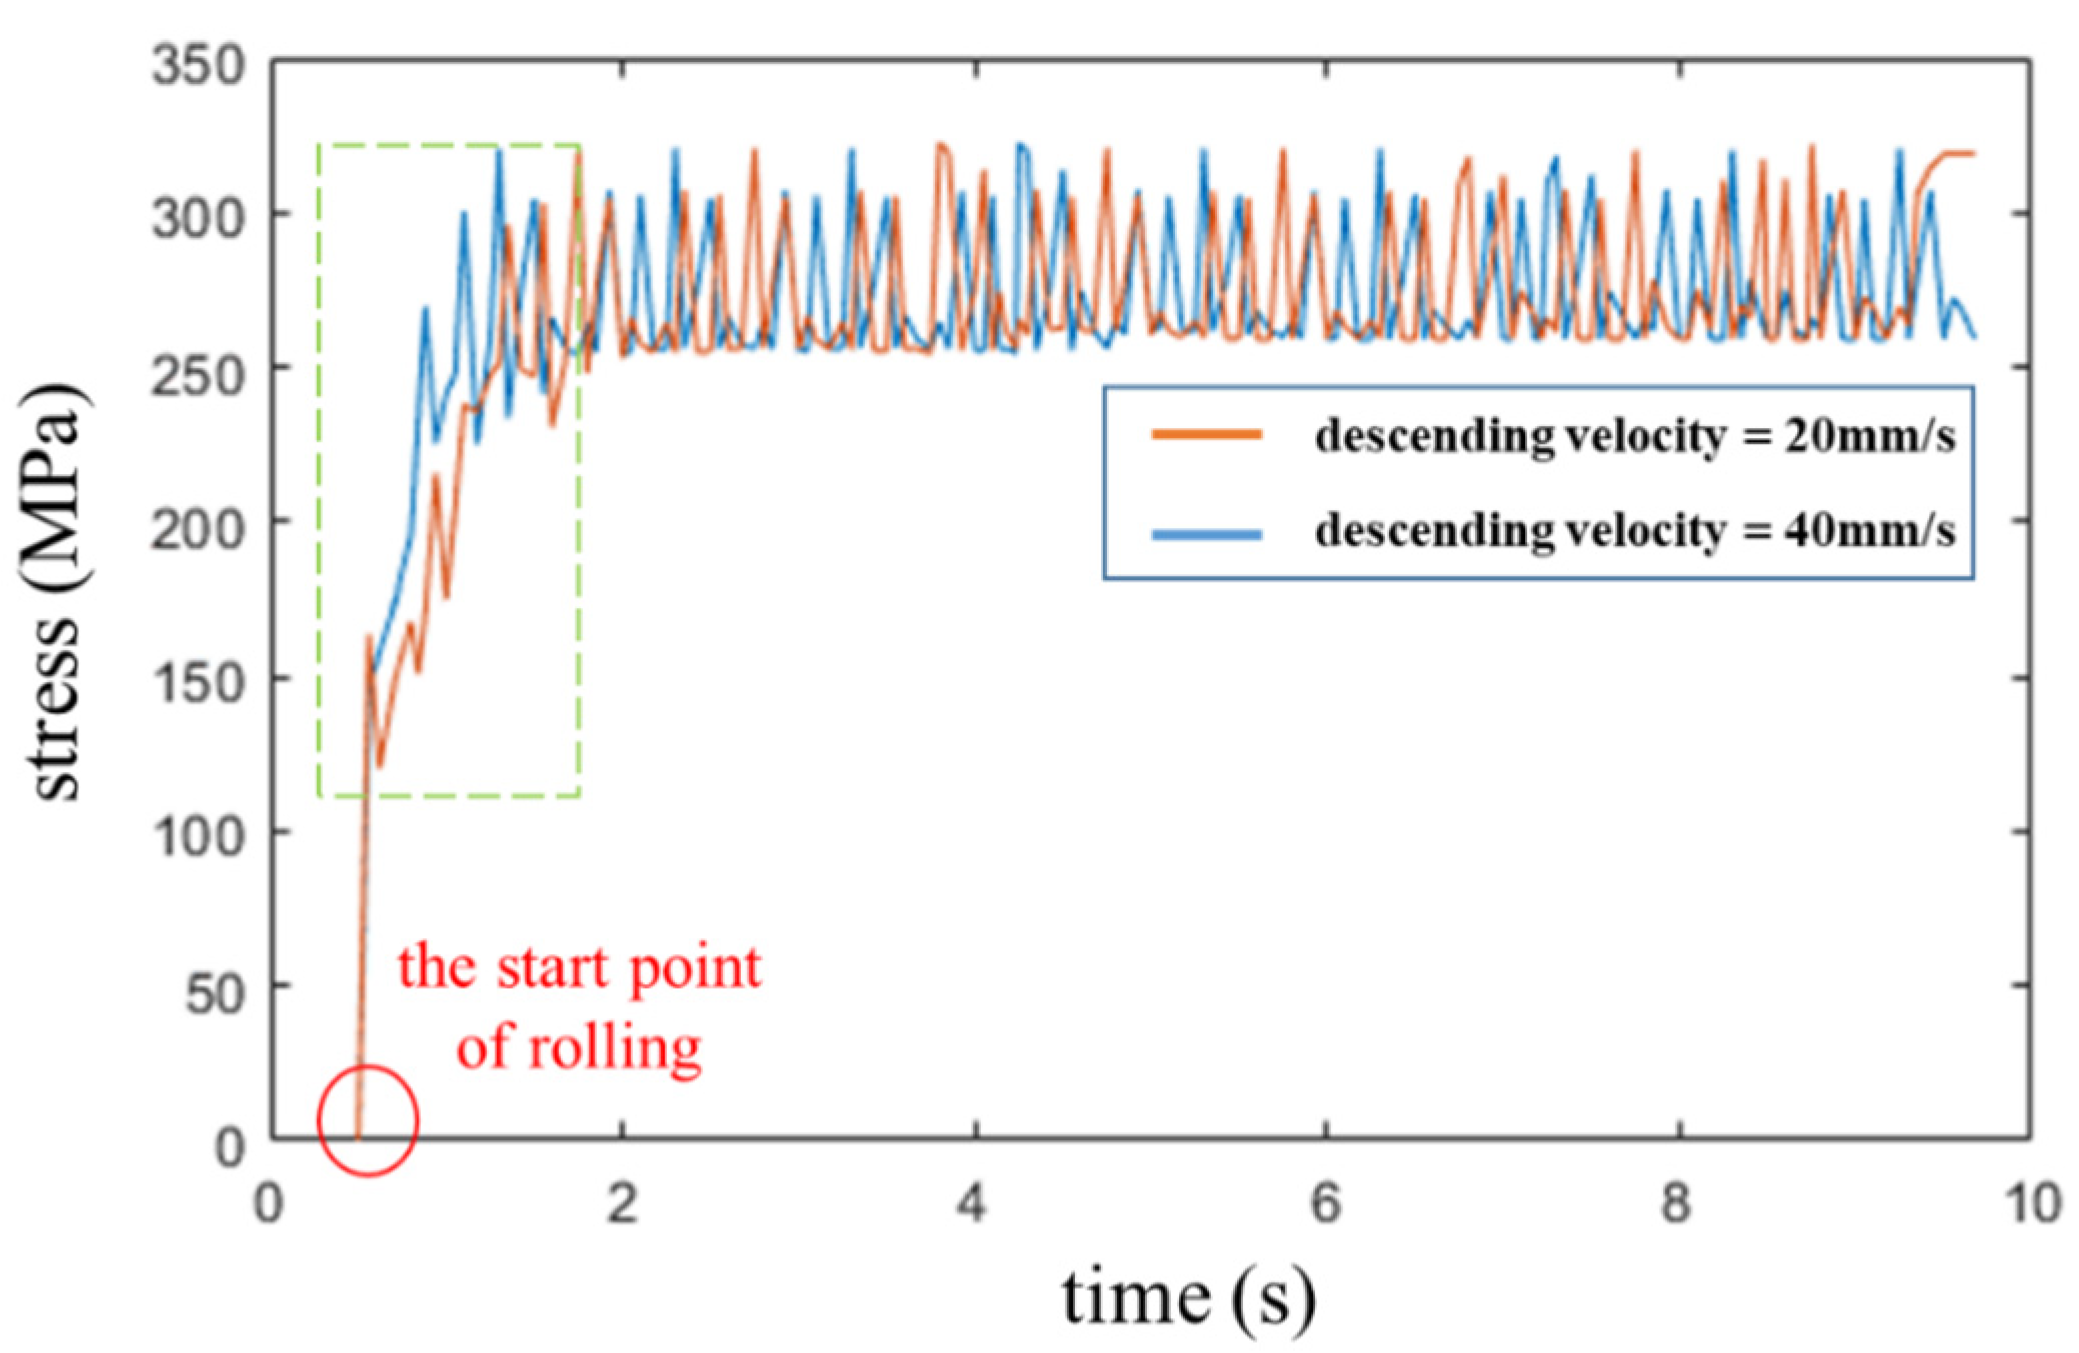
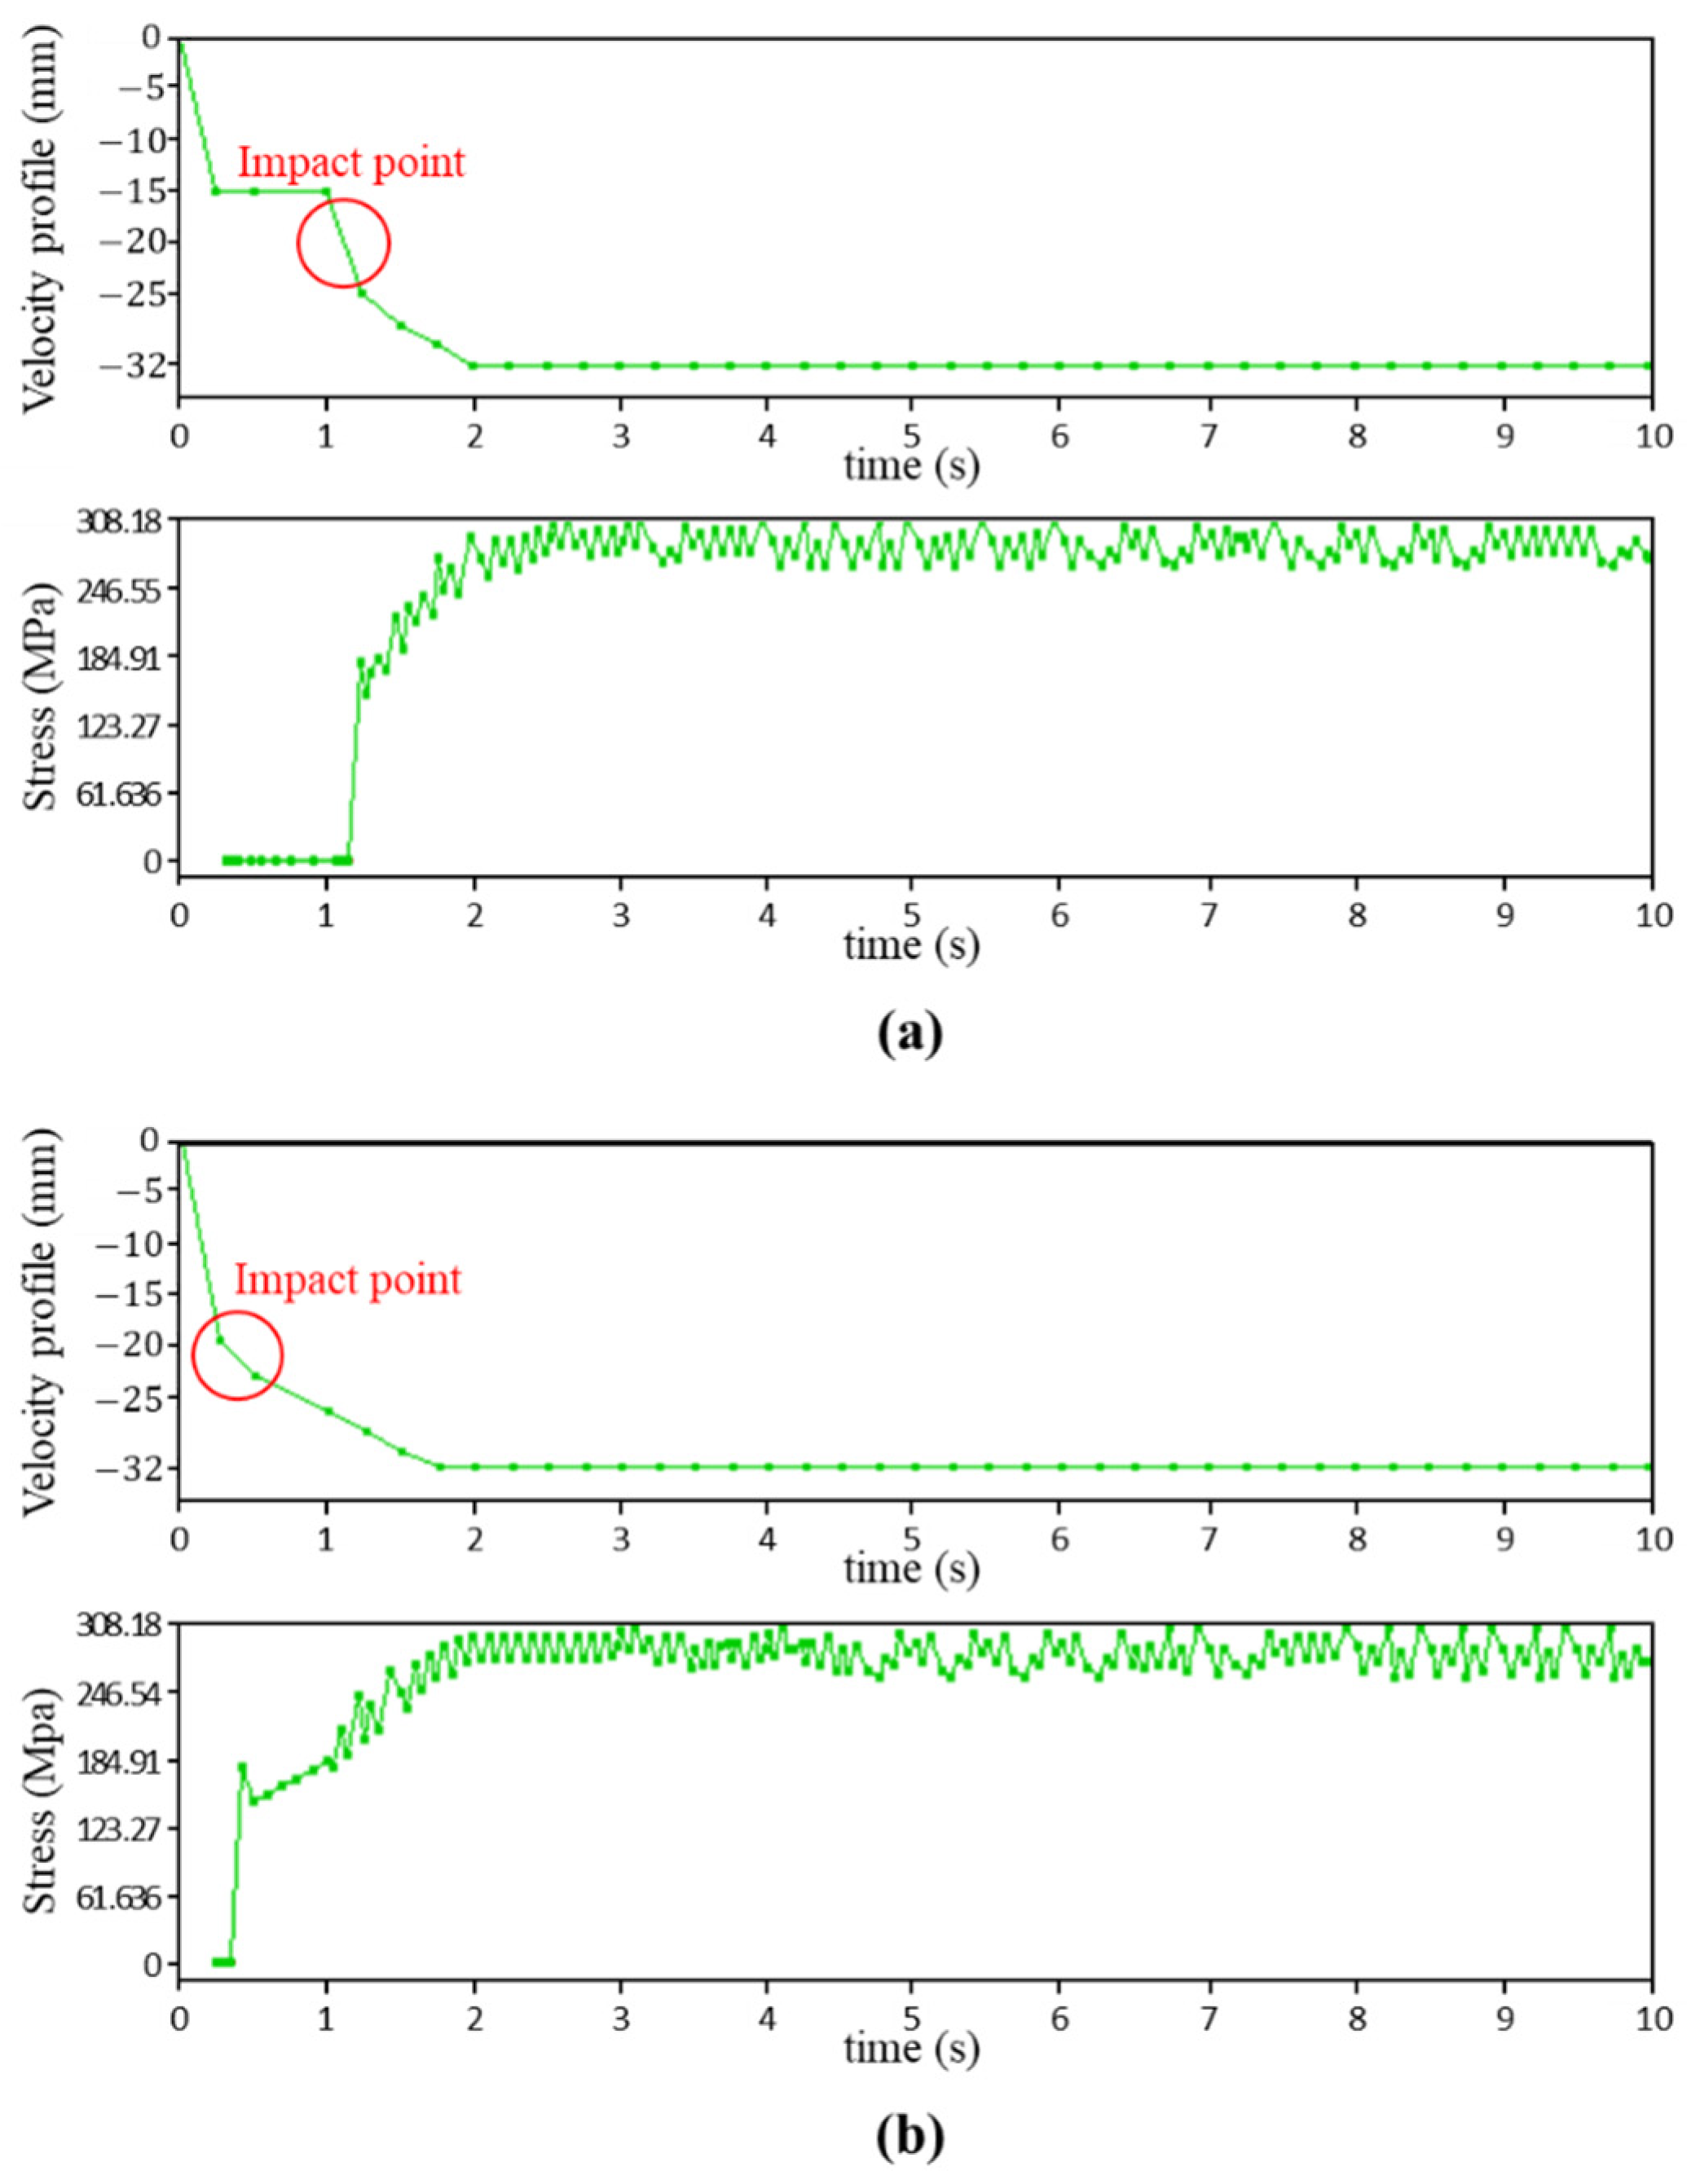
4.3. ANSYS Simulation for Flying Touch
5. Experiment
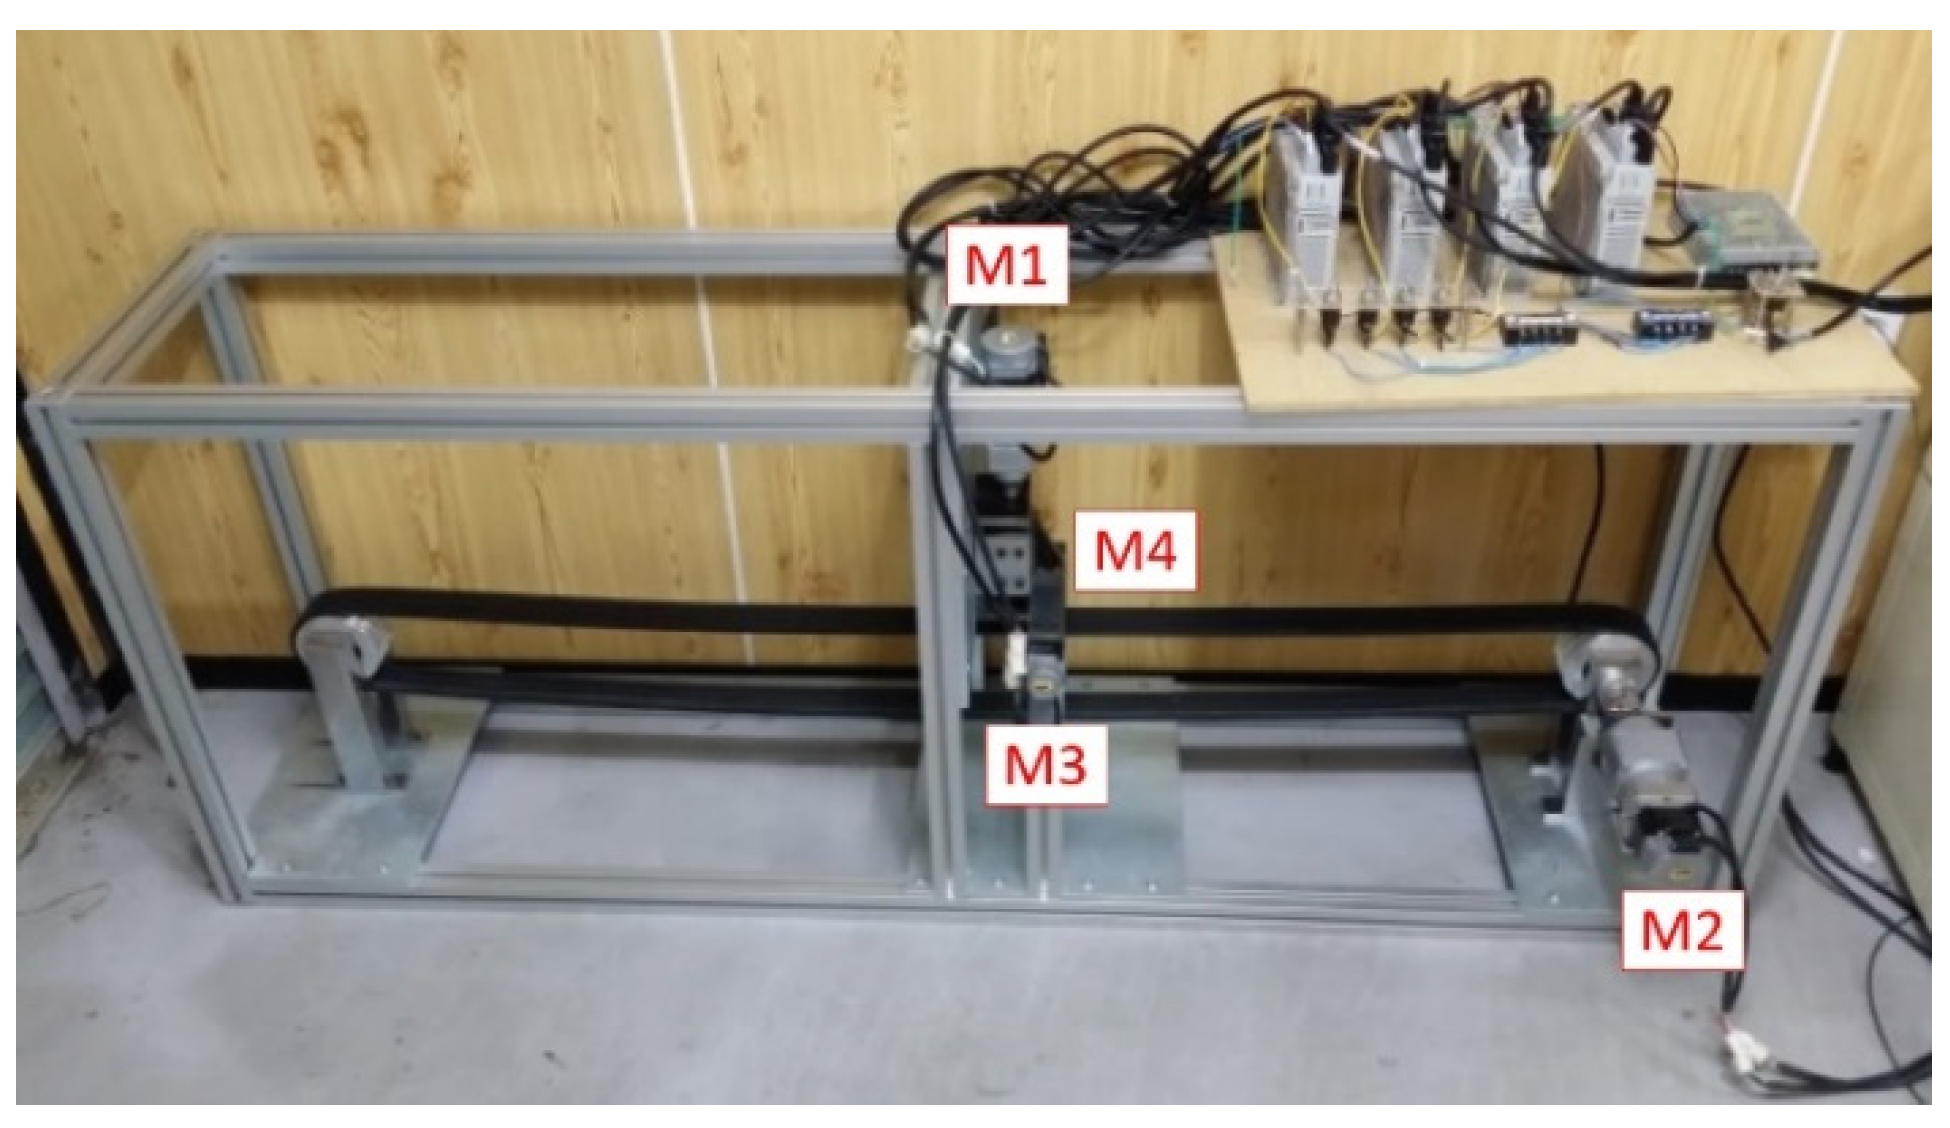
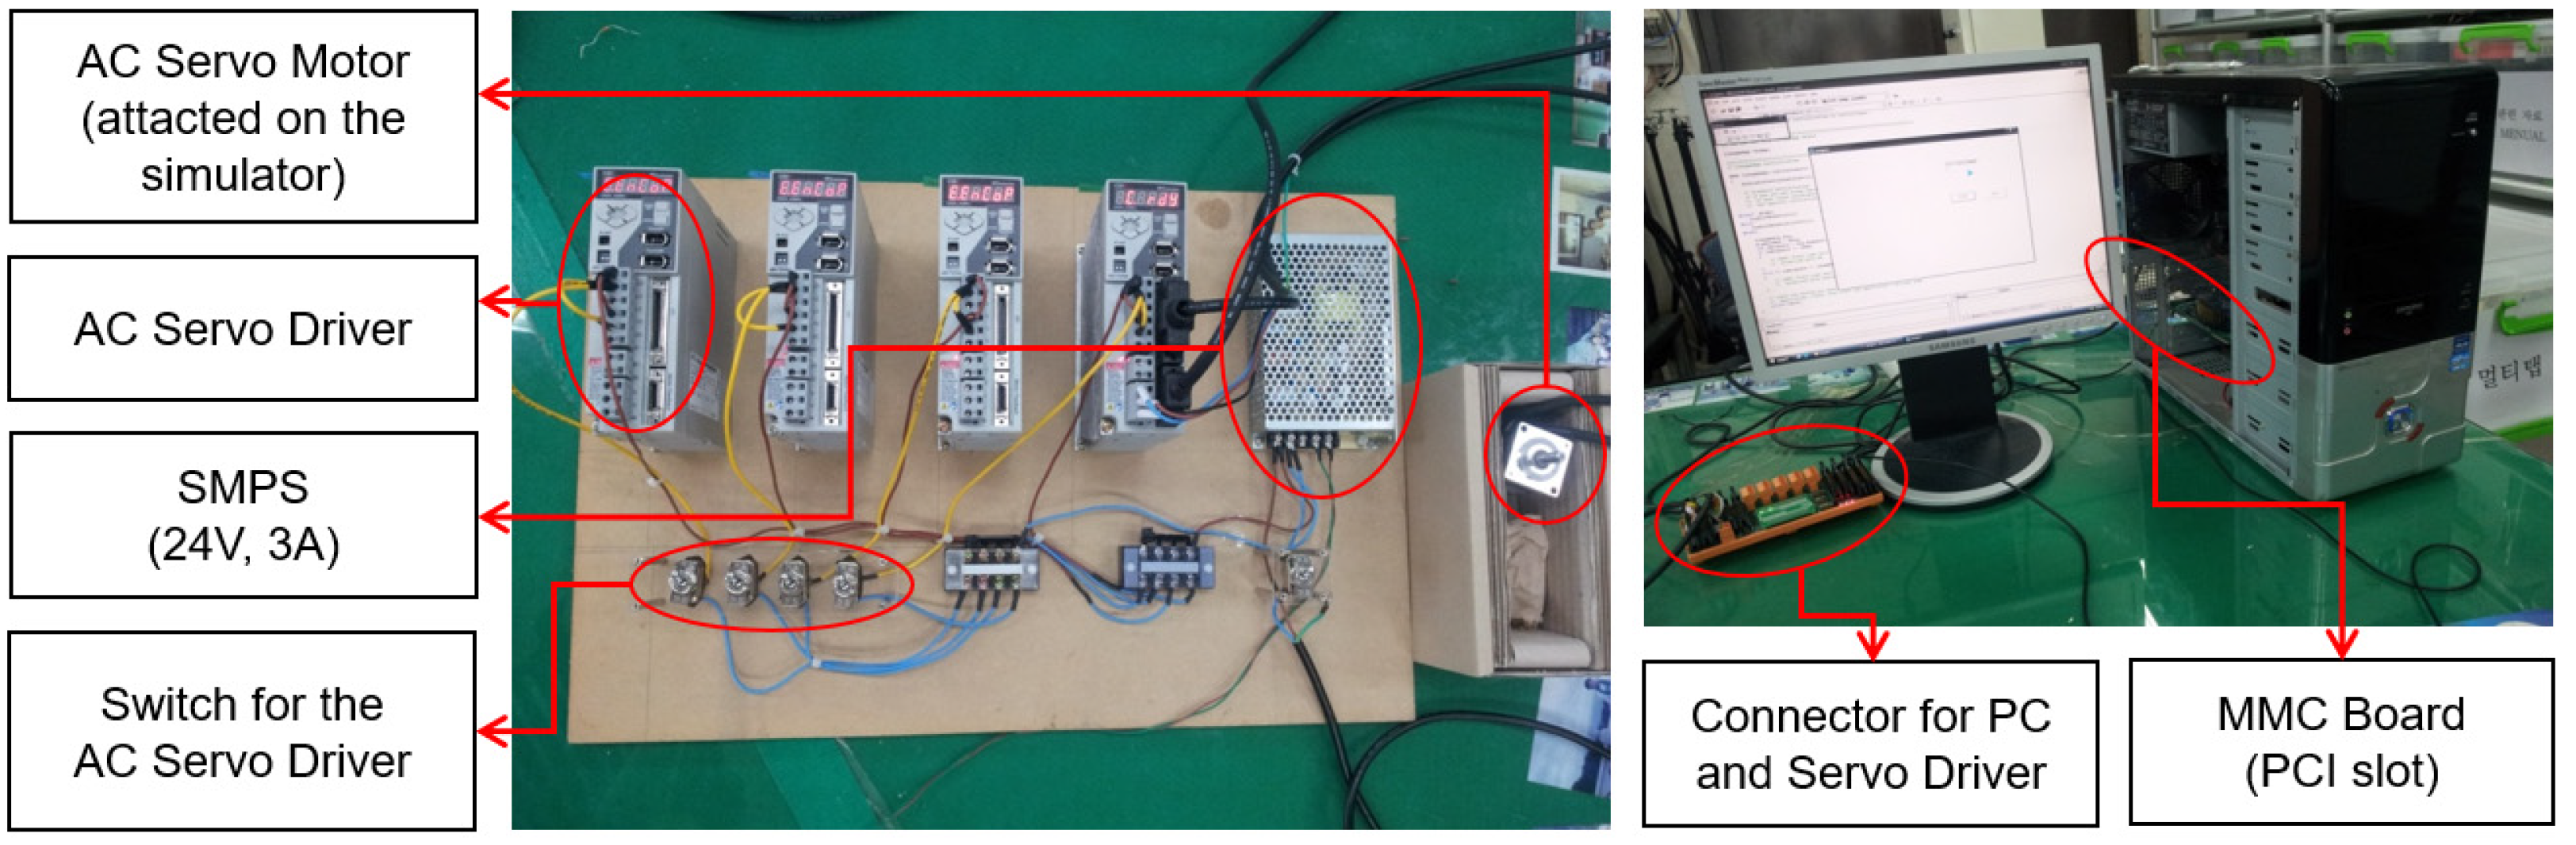
5.1. Experimental System Configuration
5.2. Scratch Formation Reduction Algorithm Experiment
6. Conclusions
Author Contributions
Funding
Institutional Review Board Statement
Informed Consent Statement
Data Availability Statement
Conflicts of Interest
References
- Choi, Y.J. PID Sliding Mode Control Using a Coiler Simulator in Hot Strip Mill. Ph.D. Thesis, Pusan National University, Busan, Korea, 2008. [Google Scholar]
- Sun, J.; Deng, J.; Peng, W.; Zhang, D. Strip Crown Prediction in Hot Rolling Process Using Random Forest. Int. J. Precis. Eng. Manuf. 2021, 22, 1–11. [Google Scholar] [CrossRef]
- Zhang, T.; Sha, H.; Li, L.; Gong, H. Study of Macroscopic Defects of Four-Layer Structure of Ti–6Al–4V During Superplastic Forming/Diffusion Bonding. Int. J. Precis. Eng. Manuf. 2021, 22, 27–39. [Google Scholar] [CrossRef]
- Kim, H.J. Reduction of Burr in Rolling Process through Shear Mechanism Analysis. Int. J. Precis. Eng. Manuf. 2020, 21, 599–612. [Google Scholar] [CrossRef]
- Huang, S.; Liang, W.; Tan, K.K. Intelligent friction compensation: A review. IEEE/ASME Trans. Mechatron. 2019, 24, 1763–1774. [Google Scholar] [CrossRef]
- Kang, D.; Dong, X.; Kim, H.C.; Park, P.W.; Okwudire, C.E. Friction isolated rotary system for high-precision roll-to-roll manufacturing. Precis. Eng. 2020, 68, 358–364. [Google Scholar] [CrossRef]
- Chen, J.S.; Li, C.S. Control of surface thermal scratch of strip in tandem cold rolling. Chin. J. Mech. Eng. 2014, 27, 738–744. [Google Scholar] [CrossRef]
- Zhou, L.; Sun, D.; Liu, C.; Li, C.; Yao, L. Scratch behavior of high speed steels for hot rolls. J. Univ. Sci. Technol. Beijing 2008, 15, 402–406. [Google Scholar] [CrossRef]
- Moura, J.T.; Elmali, H.; Olgac, N. Sliding Mode Control with Sliding Perturbation Observer. J. Dyn. Syst. Meas. Control 1997, 119, 657–665. [Google Scholar] [CrossRef]
- Yoon, S.M.; Kim, W.J.; Lee, M.C. Design of Bilateral Control for Force Feedback in Surgical Robot. Int. J. Control Autom. Syst. 2015, 13, 916–925. [Google Scholar] [CrossRef]
- Rahman, N.; Lee, M.C. Actual Reaction Force Separation Method of Surgical Tool by Fuzzy Logic Based SMCSPO. Int. J. Control Autom. Syst. 2015, 13, 379–389. [Google Scholar] [CrossRef]
- Yoon, S.M.; Lee, M.C.; Kim, C.Y. Sliding Perturbation Observer Based Reaction Force Estimation Method of Surgical Robot Instrument for Haptic Realization. Int. J. Hum. Robot. 2015, 12, 1550013. [Google Scholar] [CrossRef]
- Kallu, K.D.; Jie, W.; Abbasi, S.J.; Lee, M.C. Estimated Reaction Force-Based Bilateral Control between 3DOF Master and Hydraulic Slave Manipulators for Dismantlement. Electronics 2018, 7, 256. [Google Scholar] [CrossRef] [Green Version]
- Wang, J.; Lee, M.C.; Kallu, K.D.; Abbasi, S.J.; Ahn, S. Trajectory Tracking Control of a Hydraulic System Using TSMCSPO based on Sliding Perturbation Observer. Appl. Sci. 2019, 9, 1455. [Google Scholar]
- Kallu, K.D.; Abbasi, S.J.; Hamza, K.M.; Jie, W.; Lee, M.C. Tele-Operated Bilateral Control of Hydraulic Manipulator Using a Robust Controller Based on the Sensorless Estimated Reaction Force. Appl. Sci. 2019, 9, 1995. [Google Scholar] [CrossRef] [Green Version]
- Kallu, K.D.; Abbasi, S.J.; Hamza, K.M.; Jie, W.; Lee, M.C. Implementation of a TSMCSPO Controller on a 3DOF Hydraulic Manipulator for Position Tracking and Sensor-less Force Estimation. IEEE Access 2019, 7, 177035–177047. [Google Scholar] [CrossRef]
- Jie, W.; Yudong, Z.; Yulong, B.; Kim, H.H.; Lee, M.C. Trajectory Tracking Control Using Fractional-Order Terminal Sliding Mode Control with Sliding Perturbation Observer for a 7-DOF Robot Manipulator. IEEE/ASME Trans. Mechatron. 2020, 25, 1886–1893. [Google Scholar] [CrossRef]
- Kim, H.H.; Lee, M.C.; Kyung, J.H.; Do, H.M. Evaluation of Force Estimation Method Based on Sliding Perturbation Observer for Dual-arm Robot System. Int. J. Control Autom. Syst. 2021, 19, 1–10. [Google Scholar] [CrossRef]
- Yildiz, S.K.; Forbes, J.F.; Huang, B.; Zhang, Y.; Wang, F.; Vaculik, V.; Dudzic, M. Dynamic modeling and simulation of a hot strip finishing mill. Appl. Math. Model. 2009, 33, 3208–3225. [Google Scholar] [CrossRef]
- Elmali, H.; Olgac, N. Sliding mode control with perturbation estimation (SMCPE): A new approach. Int. J. Control 1992, 56, 923–941. [Google Scholar] [CrossRef]
- WONIK ROBOTICS. Available online: https://www.wonikrobotics.com/ (accessed on 14 April 2021).
- Kim, S.J.; Kim, H.H.; Yoon, S.M.; Lee, M.C. A Study of a Flying Touch Method to Reduce Slab Scratches in a Hot Rolling Process Using a Simulation System. J. Inst. Control Robot. Syst. 2015, 21, 723–728. [Google Scholar] [CrossRef]


| Properties | Values |
|---|---|
| Thickness of the steel plate (half size) | 200 mm |
| Diameter of the upper roller | 630 mm |
| Transfer velocity of the steel plate | 500 mm/s |
| Rolled thickness of the steel plate | 12 mm |
| Initial gap between the upper roller and the steel plate | 20 mm |
| Simulation duration | 10 s |
| Properties | Constant Velocity of Descending Roller (MPa) | Decelerating Velocity of Descending Roller (Mpa) | ||
|---|---|---|---|---|
| 40 mm/s | 20 mm/s | 40 mm/s | 20 mm/s | |
| Total average stress on the steel plate | 290.24 | 289.47 | 284.80 | 284.29 |
| Maximum stress on the steel plate | 322.53 | 322.53 | 308.13 | 308.13 |
| Standard deviation stress after impact point | 23.29 | 24.40 | 12.46 | 13.54 |
| Stress on the steel plate at the moment of impact | 269.49 | 163.53 | 181.68 | 181.16 |
| Properties | Values | |
|---|---|---|
| Continuous torque of motors (rated power) | M1 | 0.640 Nm (200 W) |
| M2 | 0.640 Nm (200 W) | |
| M3, M4 | 0.318 Nm (100 W) | |
| Size of the simulator | Length (rolling direction) | 1780 mm |
| Width | 410 mm | |
| Height | 700 mm | |
| Material of the simulator | Steel and aluminum | |
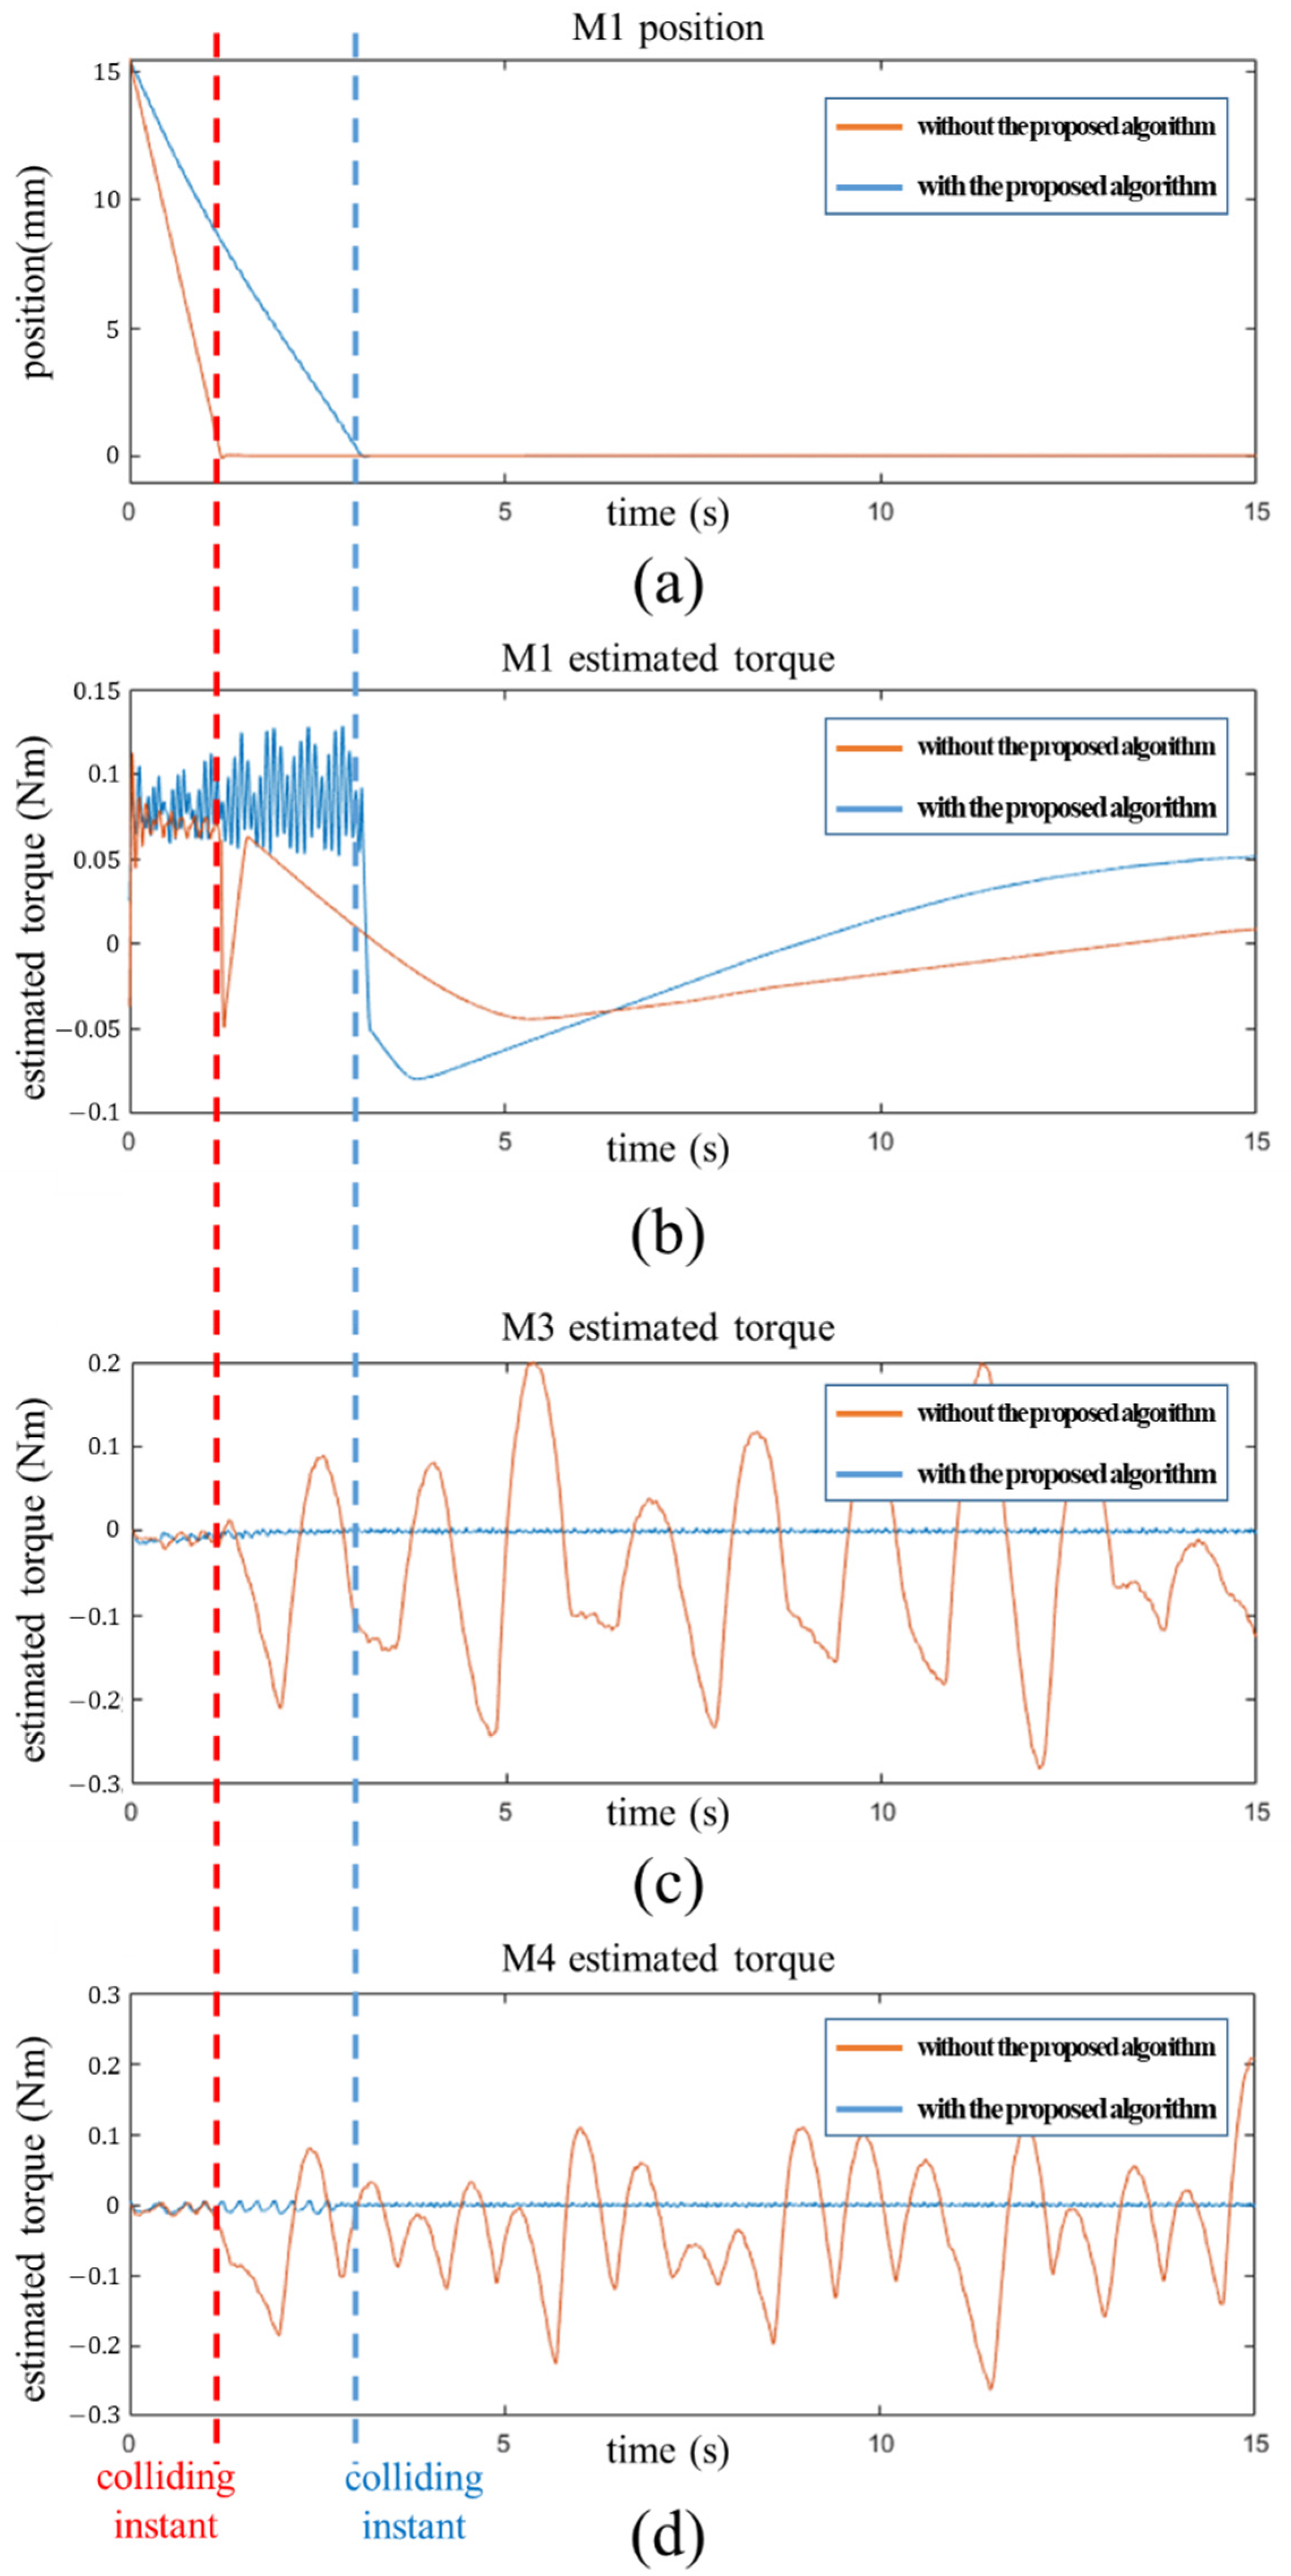
| Properties | With the Proposed Algorithm (Nm) | Without the Proposed Algorithm (Nm) | ||
|---|---|---|---|---|
| M3 | M4 | M3 | M4 | |
| Maximum torque | 0.0057 | 0.0040 | 0.2079 | 0.1997 |
| Mean torque | −0.0012 | −0.0012 | −0.0306 | −0.0360 |
| Standard deviation | 0.0030 | 0.0030 | 0.0795 | 0.1045 |
Publisher’s Note: MDPI stays neutral with regard to jurisdictional claims in published maps and institutional affiliations. |
© 2021 by the authors. Licensee MDPI, Basel, Switzerland. This article is an open access article distributed under the terms and conditions of the Creative Commons Attribution (CC BY) license (https://creativecommons.org/licenses/by/4.0/).
Share and Cite
Kim, H.-H.; Kim, S.-J.; Yoon, S.-M.; Choi, Y.-J.; Lee, M.-C. Sliding Mode Control with Sliding Perturbation Observer-Based Strategy for Reducing Scratch Formation in Hot Rolling Process. Appl. Sci. 2021, 11, 5526. https://doi.org/10.3390/app11125526
Kim H-H, Kim S-J, Yoon S-M, Choi Y-J, Lee M-C. Sliding Mode Control with Sliding Perturbation Observer-Based Strategy for Reducing Scratch Formation in Hot Rolling Process. Applied Sciences. 2021; 11(12):5526. https://doi.org/10.3390/app11125526
Chicago/Turabian StyleKim, Hyun-Hee, Sung-Jin Kim, Sung-Min Yoon, Yong-Joon Choi, and Min-Cheol Lee. 2021. "Sliding Mode Control with Sliding Perturbation Observer-Based Strategy for Reducing Scratch Formation in Hot Rolling Process" Applied Sciences 11, no. 12: 5526. https://doi.org/10.3390/app11125526