1. Introduction
The Unmanned Aerial Vehicle (UAV), as a typical complex electromechanical system, has been used in military and commercial fields widely, but is also accompanied with a high fault rate. Improving the competence of fault diagnosis and ground maintenance, so as to improve the functionality and reliability of UAV, which is as important as exploring the modern UAV control methods such as using a brain–computer interface [
1], has currently become the subject of further research emphasis [
2,
3,
4]. With the continuous development of Prognostics Health Management (PHM) technology, a great quantity of sensors are employed in the new generation of large fixed-wing UAV, bringing the explosive growth of flight data scale [
5]. The data-driven methods, thanks to the growth of the data scale, are gradually replacing the traditional Physics of Failure (PoF) methods [
6], becoming the mainstream for fault diagnosis.
Most of the common faults of current UAVs could be detected and alarmed in real time by the advanced Built-In-Test (BIT) system [
7], but single faults or over-limit states of one component are reflected poorly. In actual test flight activity of UAVs, there are multiple BIT alarms showing at the same time frequently, to the extent that no such “normal” state would appear during a test flight procedure, at the extreme. These BIT records with concurrent alarms are laborious for the ground team to directly use in fault diagnosis and maintenance efficiently in the test flight phase, thus it is worthy to explore utilizing BIT records properly.
In recent years, with a rapid development of artificial intelligence technology, fault diagnosis based on machine learning models has achieved considerable progress. The fault diagnosis process could be abstracted as a classification task in machine learning, including supervised learning classification and unsupervised learning classification. This article mainly discusses the fault diagnosis method based on supervised learning classification. The traditional machine learning methods, Decision Tree [
8], Support Vector Machine [
9], k-Nearest Neighbor [
10], Artificial Neural Network [
11], etc., have been successfully applied in the field of fault diagnosis. These models with simple structure also have the following deficiencies: annoying data preprocessing, insufficient ability to deal with high-dimensional and imbalanced data, maladaptation in multi-class classification and noticeable overfitting.
To a certain extent, applying advanced attractive ensemble learning and deep learning methods in fault diagnosis might avoid these deficiencies. On the premise of the identical meta classifier, the ensemble learning algorithm could improve the performance of classification through bagging or boosting. A Random Forests fault diagnosis model was proposed in rolling bearings [
12]. By negotiation and voting mechanism, the results of multiple multi-layer perceptrons were integrated to construct an ensemble learning model for bearing faults diagnosis of an induction motor [
13]. To boost the performance of the models trained by small-dataset thyroid nodule ultra-sound images, a multi-view ensemble learning method was given based on voting mechanism [
14].
More suitable for processing large-scale data, the deep learning algorithm based on a neural network adopts a deep hierarchy structure to represent abstract features and learns useful features in high-dimensional input automatically, with the powerful ability of multi-layer nonlinear feature learning. Including three stacking AE, a rolling bearing and gear diagnosis, tasks were realized by automatically separating useless health information [
15]. A bearing fault diagnosis method with RNN in the form of an autoencoder was proposed through the multiple vibration value of the rolling bearings in [
16]. To diagnose faults in the aircraft fuel system, a combination of classical Deep Belief Network (DBN) and Quantum-inspired Neural Network was proposed in [
17]. Not requiring any signal transformation or postprocessing, a Recurrent Slice Network (RSNet) based on CNN was presented in the fault diagnosis of a high-speed train bogie [
18].
However, most of the current studies discussed diagnosis methods with clear and definite fault modes, whereas concurrent compound faults are difficult to accurately classify because of the feature combination [
19]. A concurrent fault diagnosis method for a centrifugal multi-level impeller blower with six states was proposed based on Bayesian discriminating [
20]. Using the symplectic geometry mode decomposition method, a compound fault detection was performed [
21]. For gearboxes, wavelet transform combined with a multi-label convolutional neural network was used in compound fault diagnosis [
22]. These studies were still focused on the equipment with simple fault mechanisms, based on the accurate fault label.
Due to the heavy workload of manual data labeling, some automatic methods were tried in practice, effectively with audio signal [
23], still relying on data preprocessing and correction by expert intervention. Utilizing the BIT record to label the flight data might be a feasible approach for UAV compound fault diagnosis in the flight test stage, and would be beneficial. Establishing a compound fault diagnosis model of UAV, facing possible real-time update and online diagnosis requirements in the future, is also a development direction.
To assist the sound and fast ground maintenance, this paper discusses a compound fault labeling and diagnosis method based on machine learning classification. The contributions of this paper are as follows: (1) According to the actual flight data and BIT records of a UAV in test flight, we recombined multiple single-fault alarms at the same time stamp in BIT records into a complicated state. By referring to Failure Mode, Effects and Criticality Analysis (FMECA) and ground maintenance experience, it is possible to correspond these complicated states to compound fault modes after analysis, improving the efficiency and accuracy of flight data labeling. Then, we labeled the flight data with compound fault mode names. (2) Using the labeled flight data, which inherited the original data-driven diagnosis framework (GBDT and FCNN), we proposed an improved compound fault diagnosis method package with an XGBoost-based model, LightGBM-based model and CNN-based model, that achieved a significant performance.
The rest of this article is structured as follows.
Section 2 provides a detailed description of flight data and BIT records of UAV with a practical data assembling and labeling approach, and two ensemble learning-based diagnosis methods (XGBoost, LightGBM) and a deep learning-based diagnosis method (CNN). The application and experiments of the proposed compound fault diagnosis methods are described in
Section 3.
Section 4 presents the comparison of methods applied to the actual UAV test flight data and the discussion. Finally, the conclusions are given in
Section 5.
2. Materials and Methods
A flowchart of the proposed compound fault labeling and diagnosis method based on actual flight data and the BIT record of a UAV is presented (
Figure 1). We exported the raw UAV flight data and BIT records and grabbed the information, to collect the existing complicated states. Referenced to the compound fault dictionary, the compound fault labels were set to label the organized flight data. Then, we used the labeled flight data, and proposed an improved compound fault diagnosis method package, with an XGBoost-based model, LightGBM-based model and CNN-based model, to obtain the diagnosis result.
2.1. Flight Data and BIT Records of a UAV
2.1.1. Flight Data
The flight data of the UAV are a collection of time series data points from self-check before takeoff to landing and shutdown. The numerous sensors for devices are carried in the new generation of UAVs, while recording signals as flight data from these sensors frequently, which describe the health status in detail.
The characteristics of flight data are as follows:
Large-scale. A single flight may record tens of thousands of data instances, that provide an ideal foundation for the data-driven fault diagnosis methods, also bringing a lack of computing memory.
High-dimensional. Attained from the numerous sensors, the actual flight data of a UAV has hundreds of attributes, which may lead to the “Curse of Dimensionality”.
Multi-class. As a typical complex system, a UAV has many types of fault modes, requiring effective multi-class classification technology.
Imbalanced. The amount of flight data in different classes would have such inevitable disparities in the actual operation that the diagnosis model training should pay attention to both the majority and minority classes.
Noisy. The mission conditions of UAV are too complicated, such as the interruption of transmission or electromagnetic interference caused by temperature, to bring serious noise interference. Null and error values are found abundantly in the flight data; as a result of this heterogeneity, data might be missing and corrupt in processing, duplicating, format conversing and secondary storage.
2.1.2. BIT Records
The new generation BIT system of UAVs, based on expert systems, the PoF model and fuzzy logic, etc., could automatically monitor most of the sensor signals or signal combinations that may cause fault, to detect early fault characteristics in a timely manner for effectively reducing the risk of flight, by alarming or even interrupting operation instruction once the signals exceed the preset limit. In actuality, due to the complicated conditions and external interference, combined with the fact that the vast majority of UAV faults are accidental and sudden (especially in avionics system), BIT has the problem of a low fault detection rate but abundant false alarms. In addition, BIT can only detect individual single faults with known features, not the unknown compound faults in the flight test phase. It is still not feasible to rely on the BIT records entirely to guide the ground maintenance team in quick fault diagnosis and troubleshooting today. Therefore, utilizing the BIT records effectively to assist data-driven fault diagnosis is critical in UAV test flight.
2.2. Data Assembling and Labeling
The data-driven fault diagnosis model based on UAV flight data is still a solid choice, considering BIT records with low fault detection rate and abundant false alarms can not diagnose faults properly, at present. The combination sets of concurrent single faults from BIT records might be unknown complicated states for the ground maintenance team in the flight test, so there is a need to determine the specific fault mechanism and effects after the fault analysis program. In most cases, flight data of a new aircraft are labeled manually, which is obviously inefficient. In addition, it is tough to precisely locate the specific time stamp of a fault feature shown by manual labeling, that would affect the performance of the trained diagnosis model. It is necessary to label the flight data efficiently and precisely before improving the diagnosis model.
A data assembling and labeling method based on flight data and BIT records is proposed here, shown in
Figure 2, which could automatically label the flight data, and assist the ground maintenance team to reduce the unnecessary waste of time and human resources.
The implementation steps are as follows:
Export raw UAV flight data with
variables from different devices, and organize the data as
instances by the standard time stamp series . On the time stamp , the -dimensional
feature vector representing UAV operation status is expressed as ;
Export raw UAV BIT records, taking the start time and end time of a recorded single fault with alarm-level sign corresponding to standard time stamp . On the time stamp , single faults are recorded in BIT, expressing the BIT information as , where represents the -th single fault recorded with alarm-level sign . The combination of concurrent single faults is named as the complicated state of UAV at time . When exporting, the will be expressed as a definite description of fault (or over-limit state) by the BIT system;
Grab the information in , and construct a long string containing all the mentioned definite descriptions. With reference to FMECA and the ground maintenance experience, establish a compound fault dictionary . Map the long string into the compound fault mode by matching search, when ;
Convert the long string back to the name of the corresponding compound fault mode , represented as on time stamp ;
Label the organized flight data with according to the standard time stamp series .
2.3. Diagnosis Model Based on XGBoost
XGBoost (eXtreme Gradient Boosting), proposed by [
24], is a highly efficient, flexible and portable distributed ensemble learning algorithm under the Gradient Boosting framework. As an improvement of GBDT (Gradient Boosting Decision Tree), XGBoost has demonstrated its advantages in large-scale data processing; time efficiency in particular. These years, a large number of Kaggle competitors choose XGBoost, ending up with outstanding achievement. In fault diagnosis, XGBoost could be used in discriminating the working states of a sucker rod pump [
25], predicting seam tensile strength for Al–Li alloy in laser welding [
26] and indicating the health conditions of planetary gearboxes [
27].
XGBoost is an excellent diagnosis method in the real world due to its excellent ability to handle overfitting and missing values. The objective function of the XGBoost-based diagnosis model is:
where
is the convex loss function that measures the difference between the prediction
and the target
, for instance
;
penalizes the complexity of the model;
is the prediction of the
-th instance at the
-th iteration;
is needed to minimize the objective; and
is a constant.
Different from GBDT, XGBoost uses the Taylor Expansion to the loss function to optimize the objective quickly, and controls the complexity by adding a regularization term to cost function, ignoring the constant:
where
,
are the first and second order gradient statistics of the loss function;
is the number of leaves;
is the weight of leaf
; and
is the instance set of leaf
.
Assuming
and
are the instance sets of nodes after the split,
, we could choose the best split point by splitting the gain of leaf nodes as:
There are two split methods in building trees that could be selected: a basic exact greedy algorithm with high accuracy, and a quick approximate method with a histogram algorithm (supported afterwards). In our fault diagnosis model, the exact greedy algorithm was chosen to scan all possible splitting points, finding the optimal splitter point with the largest gain. The grid search approach was employed in our model to tune the hyper-parameters of XGBoost.
2.4. Diagnosis Model Based on LightGBM
A fact that cannot be ignored is that the recorder on UAV can generally store more than 20 flight data points per second, which brought us to paying more attention to the performance of the diagnostic model in processing large-scale data. When handling extremely large data dimensions, XGBoost is required to calculate the information gain of each split based on all data to consider all possibilities, but this is highly time consuming. Microsoft proposed LightGBM (Light Gradient Boosting Machine), an exceedingly fast gradient boosting framework, to improve the model training speed in processing large-scale data [
28]. Applied in image recognition recently, as an example, LightGBM has been validated as an effective method for distinguishing COVID-19 from bacterial pneumonia [
29]. In fault diagnosis, LightGBM was used in diagnosing shipboard medium-voltage DC power system faults [
30], and rotating machinery faults [
31].
As another improved method of GBDT, LightGBM employs gradient-based one-side sampling (GOSS) to select data instances according to the weights in determining split values. To reduce the dimension of features, Exclusive Feature Bundling (EFB) technology binds some mutually exclusive features into an exclusive feature bundle, shrinking the original feature matrix as a dense matrix. A histogram-based algorithm, with efficient sparse optimization solutions (GOSS and EFB), is chosen in LightGBM to reduce the cost of calculating the gain, to speed up training and to occupy memory usage less. Furthermore, in order to obtain better accuracy, a level-wise [
32] strategy is used in LightGBM, which chooses the leaf with max delta loss to grow, and limits maximum depth for prevention of overfitting.
The purpose of our use of LightGBM is to train the diagnosis model much faster, so as to adapt to the possible real-time updating requirement of the UAV fault diagnosis model in mission, and for online raw diagnosis. The grid search approach was employed in our model to tune the hyper-parameters of LightGBM.
2.5. Diagnosis Model Based on Modified CNN
As a well-known deep learning method, CNN (Convolutional Neural Network) has been widely utilized in various pattern recognition areas such as medical image analysis [
33], crop mapping [
34], text classification [
35], fraud identification [
36], voice recognition [
37], and so on. CNN has already been used for the sensor faults diagnosis of UAV [
38], rotating machinery [
19] and the multi-operation forging process [
39]. A typical CNN structure in classification, as presented in
Figure 3, generally includes a feature extractor with one input layer and multiple convolutional and pooling layers, along with a classifier with several fully connected layers [
40].
Because the number of variables of the flight data of UAV input may not be decomposable directly, a variables preselection mechanism needs to be added. We used F-value in ANOVA (analysis of variance) as the standard, to eliminate the least important variables, and minimize the loss of data information in preselection.
After preselection, five convolution layers were employed in our modified CNN-based model. The convolution layers, as the key to extract features, use the convolution operator to convert input data into a new feature map (output). For an input
, the feature map
of layer
in CNN can be calculated as
where
is the feature map
of layer
; operator
is the convolution operation;
is the weights of layer
;
is the bias of layer
; and
is a non-linear activation function. Sigmoid, ELU, ReLU, Maxout and tanh are the commonly used activation functions in the CNN model. We chose the tanh function as the activation function in our diagnosis method after the consideration of the actual data, and having ReLU failure.
Pooling layers, which are usually added after the convolutional layer to further fuse the features as a crucial role, were abandoned in our modified CNN model owing to neither the max-pooling or average-pooling producing significant results. Pooling may lead to the increase in error rate, meaning that pooling can be replaced by a higher strides setting and a flatten layer in CNN [
41]. We set the strides of the convolution kernel as two, in the third of five convolution layers, to replace the acceleration effort of the pooling layer.
A batch normalization layer was employed before fully connected layers to improve the robustness and accelerate model training, which could be calculated by:
where
and
are the output and input of the batch normalization layer;
and
are the mean and variance of
;
and
are the parameters to be learned; and
is a constant. A flatten layer was also employed there to make the high-dimensional output from the batch normalization layer into a one-dimensional input of the fully connected layer.
Then, in the classifier, three fully connected layers were used to execute the diagnosis process here. The Softmax function and the Cross Entropy were used as an activation function and loss function in fully connected layers, respectively, to deal with the multi-class classification of mutually exclusive compound faults after labeling.
Using a modified CNN-based fault diagnosis model would solve the obvious defects of FCNN properly, such as the information loss of large-scale data, the difficulty of high-dimensional data training and overfitting, having shown a great performance improvement in actual experiments.
3. Application and Experiments
3.1. Application Description
The flight data and BIT records we focused on were from the TYW-001, a fixed-wing UAV of BHUAS, that had multiple test flights between 2018 and 2019. The endurance of TYW-001 is over 40 h with a ceiling of 8000 m, take-off weight of 1500 kg and external payload of 370 kg. All flight tests have been successfully completed so far. Apart from the fire control system and redundant backups, the flight data of the TYW-001 has a total of 457 variables, including sensor monitoring and operation input. A total of 219 single faults or over-limit states could be detected in BIT, of this amount: 58 navigation and flight control system alarms, 112 electromechanical actuator alarms, 34 aeroengine alarms, 7 equipment condition monitoring system alarms, 7 from transponder alarms and 1 stall warning.
Through the analysis of the BIT records in the early stage, it could be found that there are often multiple concurrent alarms of single faults (or over-limit state) showing during the actual flight test. These faults, mostly, would be directly diagnosed by BIT, although considerable false alarms and omissions would still exist due to external interference, etc. However, BIT cannot diagnose the unknown complicated states found during the flight test, especially the states of concurrent multiple single faults. To deal with the problem, the previous approach was that the ground maintenance team checked all the single faults on record after the test flight, then carried out fault analysis to determine the fault modes for manual labeling of flight data. The original fault diagnosis models based on GBDT and FCNN were trained with these labeled flight data after that, which have been successfully used in the officially verified aircraft. It is tough to label the flight data manually due to the difficulty of locating the precise time stamp of the fault symptoms and huge labeling workload for the UAV in the flight test stage. The demand exists for using more accurately labeled data to improve the fault diagnosis model.
Our experiments selected three flight data sets and BIT record sets, No.18100223 (59,946 instances), No.19012332 (75,724 instances) and No.19012433 (149,447 instances), from the test flight phase of TYW-001 for analysis.
3.2. Experiments Setup
First, we used the method in
Section 2.2 to assemble and label the flight data sets and BIT records from test flight No.18100223, No.19012332 and No.19012433. We randomly sampled 200 instances from the labeled flight data of each test flight, and labeled them manually to verify the accuracy of the labels.
Secondly, in order to indicate the performance of the diagnosis models in all compound fault modes (serious imbalanced), we used the StratifiedShuffleSplit() to set 80% of the labeled data as the training set and 20% as the test set, by stratified sampling. Moreover, the NULL values in data were replaced by the value of the next sample point.
Then, we compared the classification performance of the proposed ensemble learning models, XGBoost (num_leaves = 15, max_depth = 5, subsample = 0.9, random_state = 42) and LightGBM (num_leaves = 15, max_depth = 5, subsample = 0.9, random_state = 42), with the original GBDT model (min_samples_leaf = 20, max_features = ‘sqrt’, subsample = 0.9, random_state = 42). The classification performance of the proposed five-layer modified CNN model (tanh as the activation function of convolution layers, Softmax as the activation function of fully connected layers, Adam as the optimizer, categorical_crossentropy as the loss function, learning_rate = 0.001, iterations = 15) which selected 450 features by Analysis of Variance (ANOVA), was compared with the original three-layer FCNN model (ReLU as the activation function between layers, Sigmoid as the activation function of output layer, Adam as the optimizer, categorical_crossentropy as the loss function, learning_rate = 0.001, iterations = 15). The structure diagrams of modified CNN and FCNN models are shown in
Figure 4a,b, respectively.
Finally, the model training speeds of all the classifiers were compared to consider the feasibility of real-time model updating in future.
4. Results and Discussion
The combination modes of concurrent single fault alarms from BIT records were sorted out by us, and mapped to a variety of complicated states. After data assembling and labeling with the method proposed in
Section 2.2, the total data set had 285,117 instances, including 457 parameters and one label including 98 classes. With reference to the ground maintenance experience and FMECA, we analyzed all the 98 classes of states to ultimately set 49 new compound fault classes including 284,393 cases, through merging some classes corresponding to the same fault mode and deleting a few abnormal instances caused by transmission and storage, etc.
In
Table 1, the count of accurate automatic labeling from manual labeling is shown, randomly sampled from 200 instances from each test flight data set. In general, it shows that our approach achieved considerable success in accurate labeling.
Figure 5 shows the improvement in proposed ensemble learning methods and neural network methods on main performance metrics, respectively. For precision, recall and F1 score, compared with the original GBDT model, the proposed ensemble learning methods, XGBoost in particular, had a significant performance improvement. LightGBM and modified CNN also gained obvious advantages over the original GBDT and FCNN in all metrics. In brief, the proposed methods effectively complement the shortcomings of the original models.
The details of each metric of the diagnosis models’ performance are shown in
Table 2. In terms of the accuracy, precision, recall and F1 score, all the proposed methods could reach the level above 0.82 on the test set, XGBoost even reaching a marvelous level above 0.99, that greatly improves the diagnosis availability of the model.
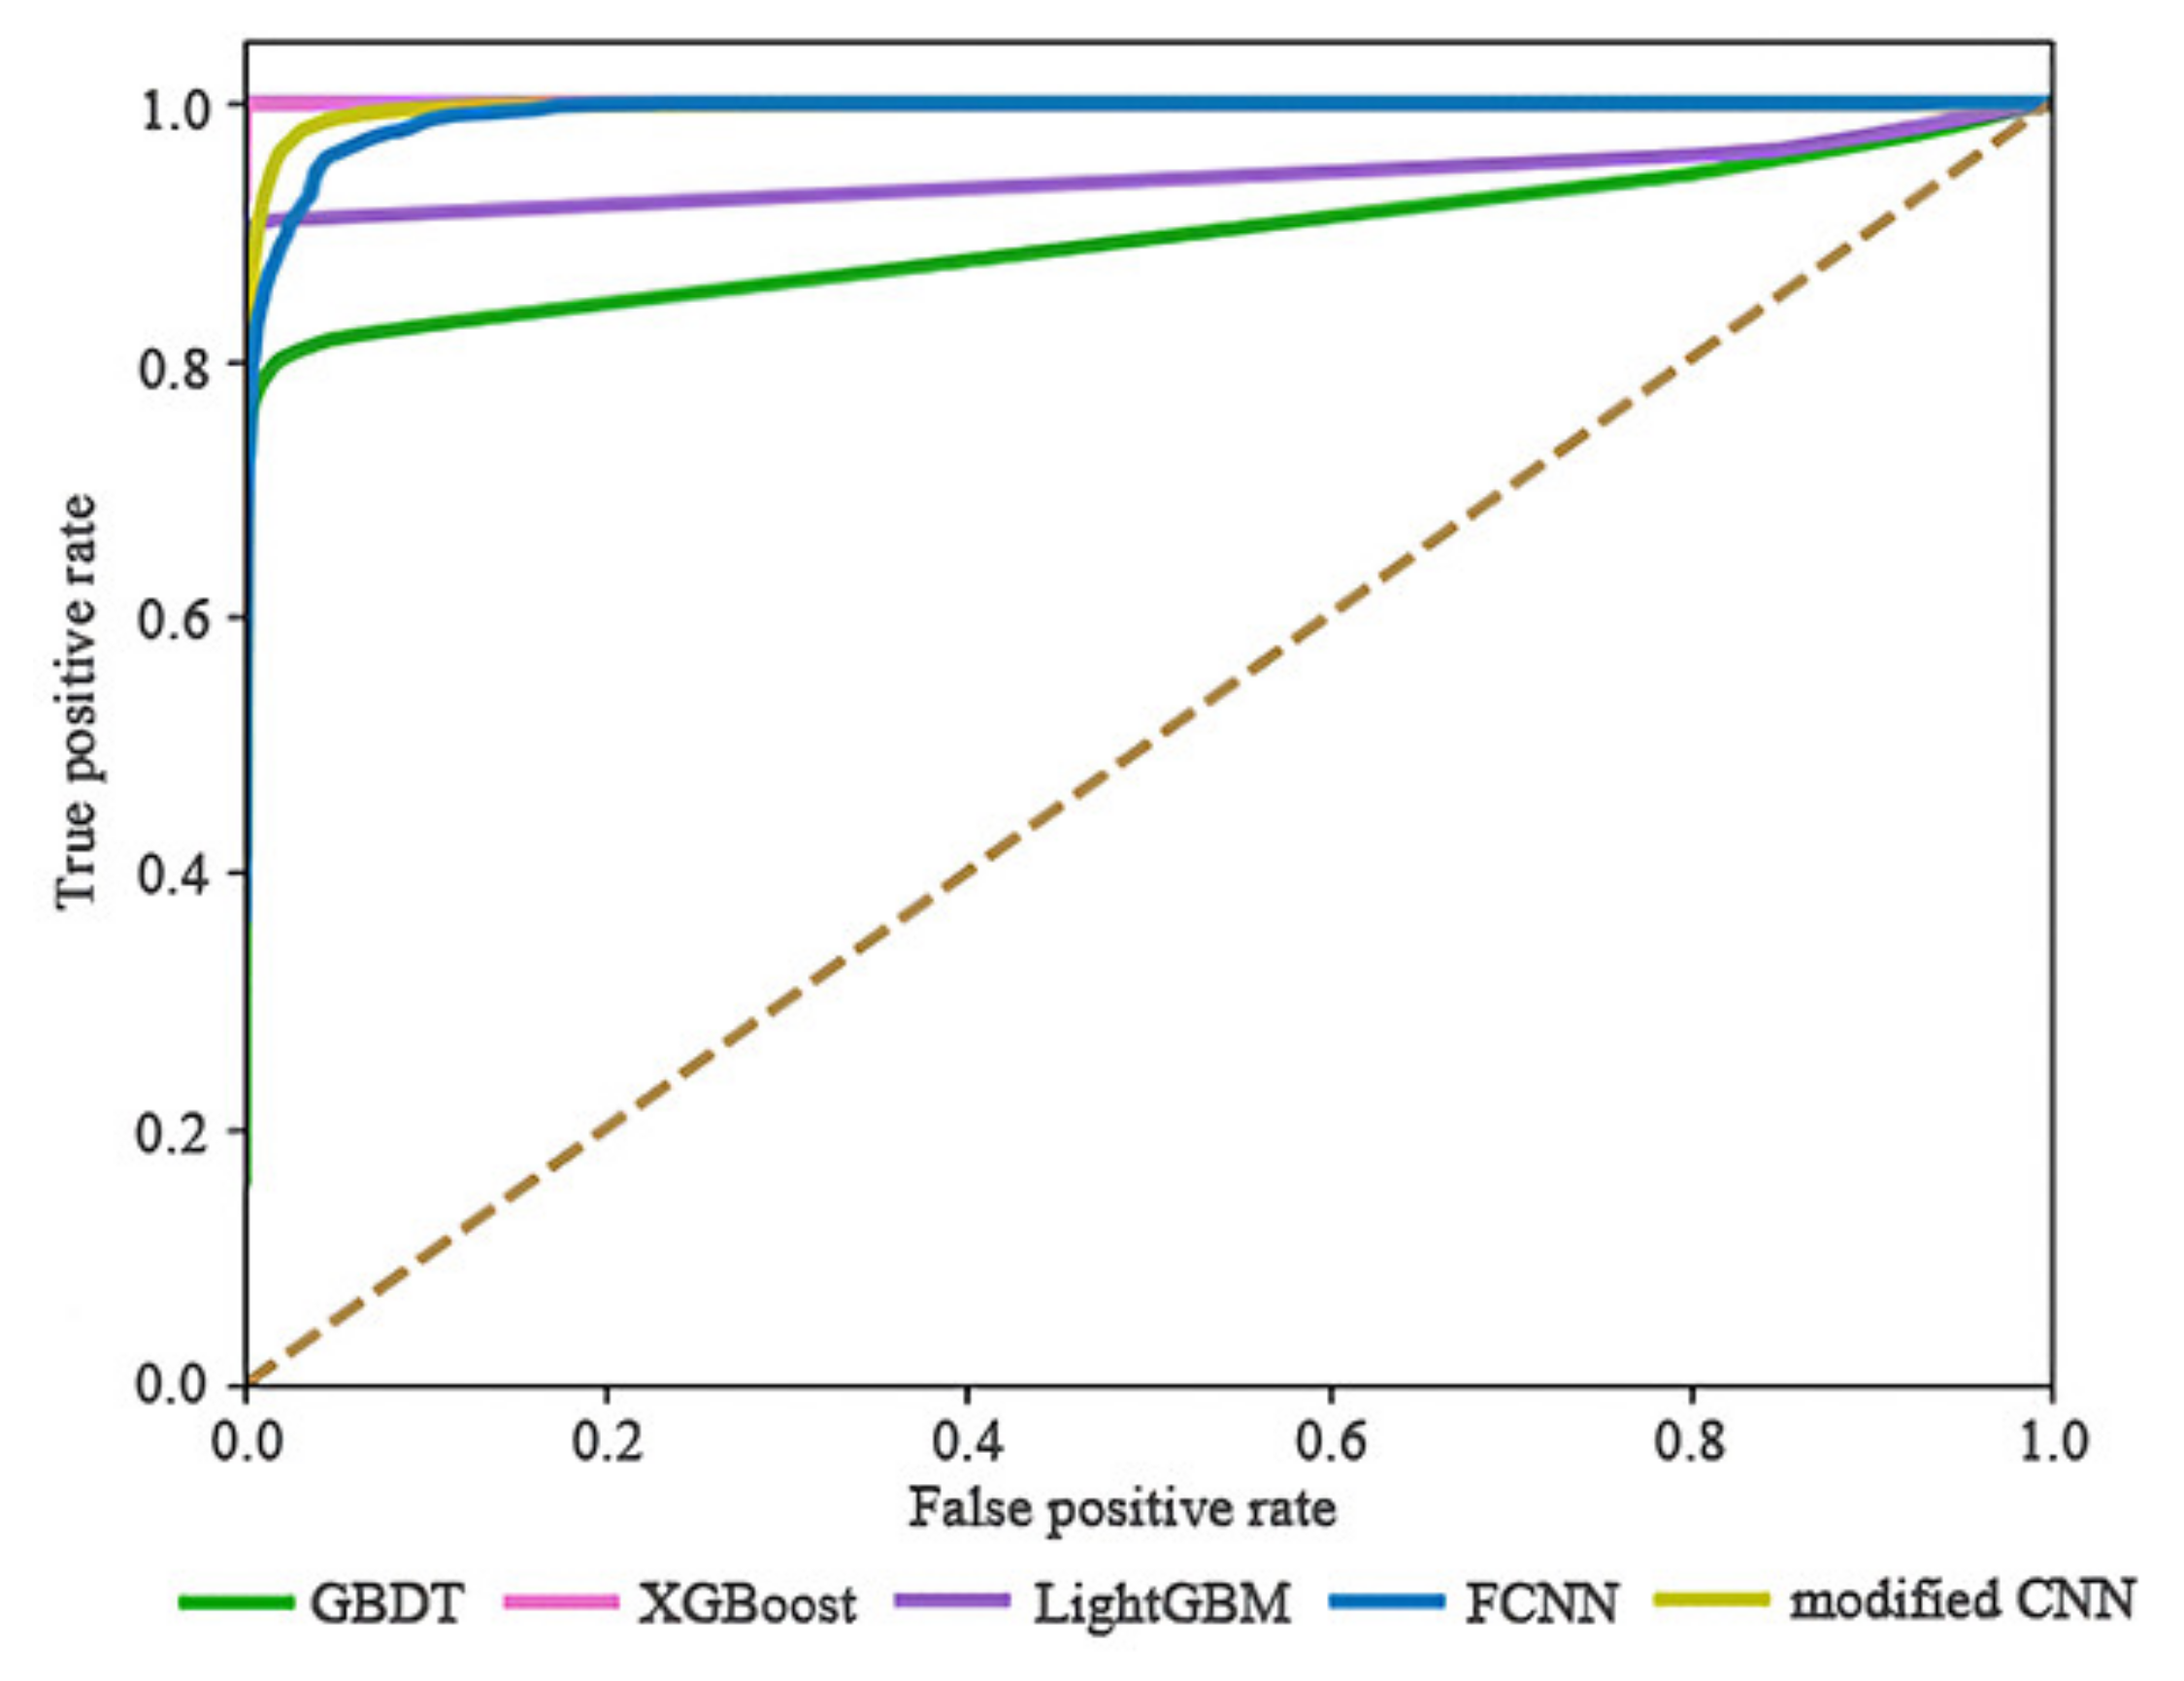
Due to the serious imbalance of flight data, it is urged to pay more attention to the MCC (Matthews Correlation Coefficient) and AUC (Area Under the ROC Curve), reflecting the possibility of the model bias toward majority classes. It can be seen that every proposed method could achieve above 0.95 on MCC, with a preferable capability to previous methods. Likewise, the result of AUC explains the friendliness of proposed models to imbalanced data, which can be visualized from ROC (Receiver Operating Characteristic) curves in
Figure 6.
According to
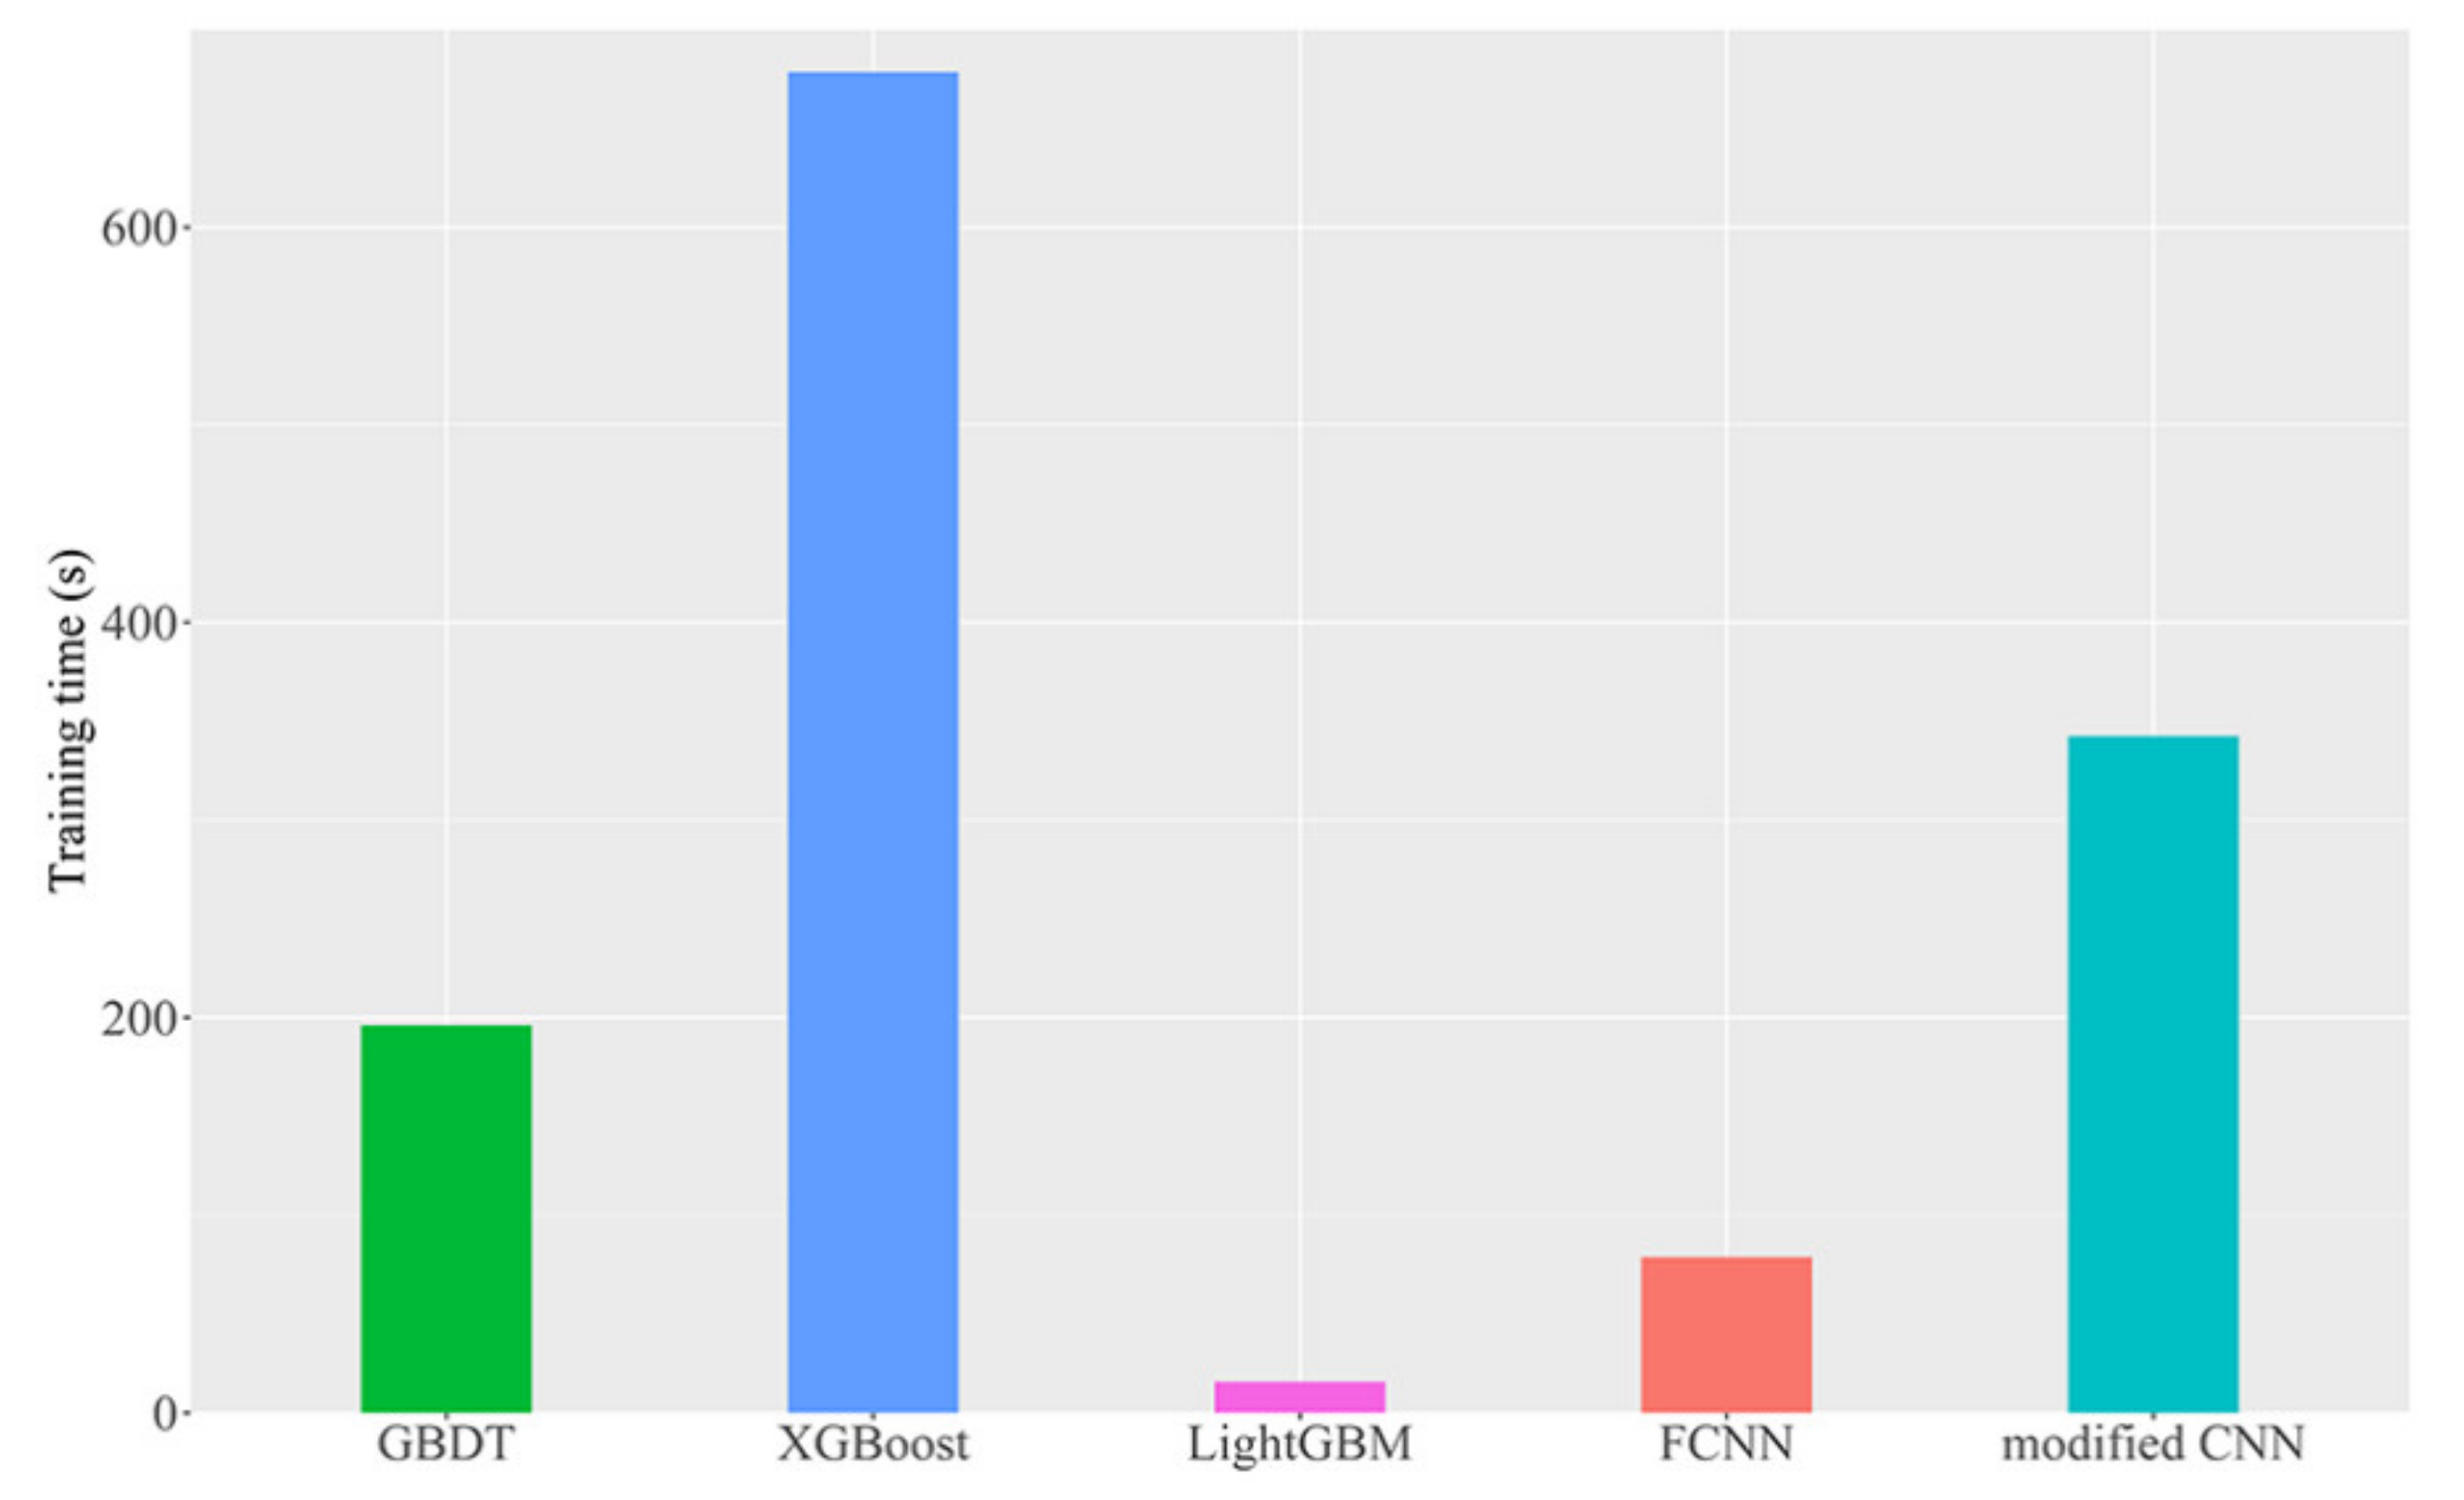
Table 2, considering that the data in training exceeded 220,000 samples, the slowest model completed training within 12 min, which is an acceptable result in processing large-scale UAV flight data. With the improvement in fault diagnosis ability, the training time of the model is also significantly increased, except for the LightGBM model. As a lightweight tool, LightGBM demonstrated its extraordinary speed in model training, shown in
Figure 7, while ensuring a decent diagnostic performance. It could be concluded that the LightGBM-based model would play an essential role in the future when facing the demand of real-time model updating and online diagnosis.
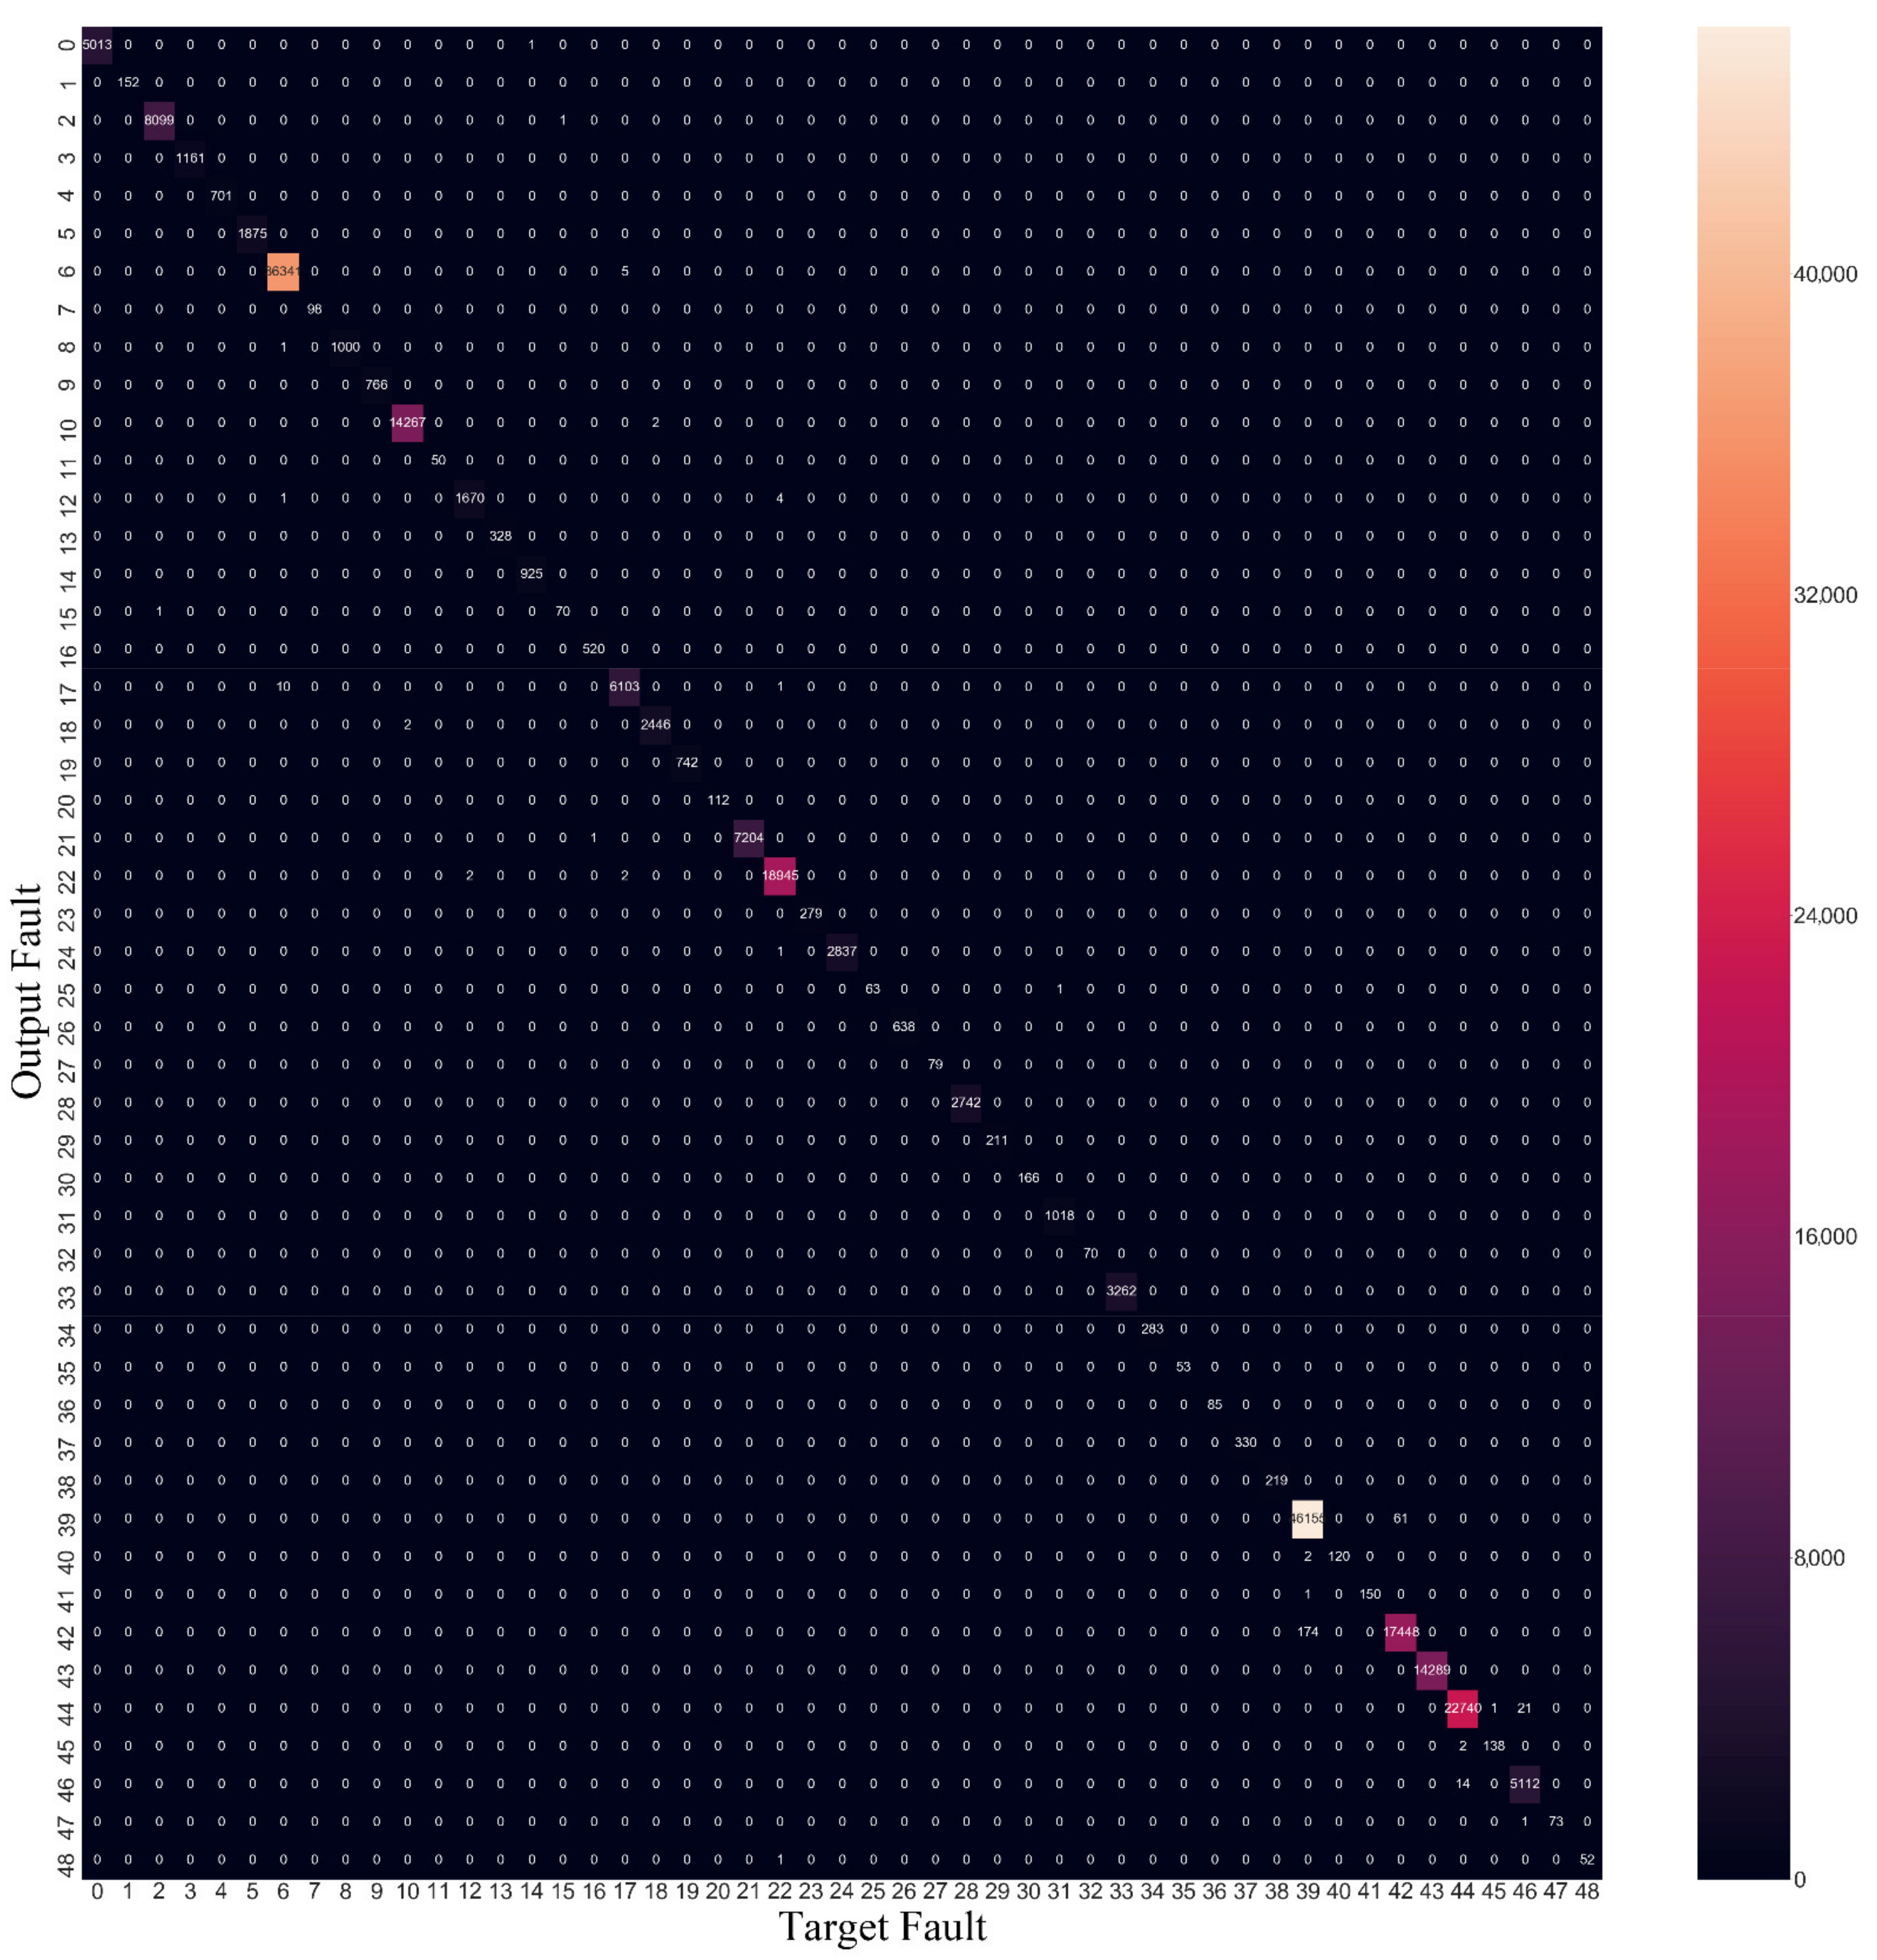
Comparing the three proposed methods, the confusion matrices of XGBoost, LightGBM and modified CNN are shown in
Figure 8,
Figure 9 and
Figure 10, respectively. It can be intuitively found that the XGBoost and modified CNN are more reliable in the diagnosis of the test set, while LightGBM has a systematic misdiagnosis for multiple frequent fault modes.
It can be concluded that, compared with the original diagnosis package, the proposed three methods have a significant comprehensive improvement. The most time-consuming XGBoost-based model with outstanding performance, the lightning LightGBM-based model and the balanced modified CNN-based model are reasonably suitable to combine together as a diagnosis package in practice, to handle the UAV compound fault diagnosis mission.
5. Conclusions
In the process of UAV flight testing, plenty of compound faults exist, which could be composed of concurrent single faults or over-limit states alarmed by a BIT system. At present, there still lacks a suitable automatic labeling approach for UAV flight data, effectively utilizing the information of the BIT record. The performance of the originally employed flight data-driven fault diagnosis models based on machine learning needs to be improved as well. In response to this requirement, this paper proposed a compound fault labeling and diagnosis method based on actual flight data and BIT records of a UAV during the flight test phase. With reference to FMECA and ground maintenance experience, we labeled the flight data with compound fault modes corresponding to concurrent single faults and over-limit states, and presented a novel fault diagnosis package based on XGBoost, LightGBM and modified CNN, upgraded from the original ensemble learning and deep learning models. The experimental results based on three instances of test flight data show that the proposed method could effectively label the flight data and obtain a significant improvement in diagnostic performance.
The following conclusions were drawn:
- (1)
Validated by manual sampling inspection, the proposed automatic labeling method is accurate and effective on actual UAV test flight data;
- (2)
When processing imbalanced large-scale flight data, compared with the original ensemble learning and neural network method, the performance of the proposed methods has a comprehensive improvement, which has better support for the following ground maintenance.
- (3)
It could be concluded that the superfast LightGBM-based model would play an essential role when facing the demand of real-time model updating and online diagnosis in the on-board early warning system.
This work would be practical in the actual UAV test flight process, and also profitable for the fault diagnosis of other large complex equipment (such as high-speed trains and manned aircrafts). It is feasible to focus on the real-time updating and online diagnosis of the model based on the data stream in the future. For the faults that may cause critical damage, the cost-sensitive learning method can be introduced in future, to reduce the total cost of misdiagnosis. Through thermal imaging or other methods to analyze the damage of the UAV structure, it could further improve the comprehensive fault diagnosis and prediction of UAV, to promote the capability of health management in the future.


