Article

Expanded Longitudinal Deformation Profile in Tunnel Excavations Considering Rock Mass Conditions via 3D Numerical Analyses

1
Department of Civil and Environmental Engineering, Hanyang University, 55 Hanyangdaehak-ro, Sangnok-gu, Ansan 15588, Korea
2
Department of Geological Engineering, Balochistan University of Information Technology, Engineering and Management Sciences (BUITEMS), Quetta 87300, Pakistan
3
Department of Mining Engineering, Balochistan University of Information Technology, Engineering and Management Sciences (BUITEMS), Quetta 87300, Pakistan
4
Department of Geotechnical & Tunneling, Daehan Consultants Co., Ltd., 113 Sajik-ro, Jongno-gu, Seoul 03041, Korea
*
Author to whom correspondence should be addressed.
Appl. Sci. 2021, 11(12), 5405; https://doi.org/10.3390/app11125405
Submission received: 20 May 2021 / Revised: 4 June 2021 / Accepted: 7 June 2021 / Published: 10 June 2021

Abstract

:
In the convergence–confinement method, the longitudinal deformation profile (LDP) serves as a graphical representation of the actual tunnel convergence (both ahead of and behind the face); therefore, it is considered important for determining the distance of support installation from the face or the timing after excavation in this method. The LDP is a function of the rock mass quality, excavation size, and state of in situ stresses; thus, obtaining the LDP according to the rock mass conditions is essential for analyzing the complete behavior of convergence during tunnel excavation. The famous LDP shows that the best fit for the measured values of tunnel internal displacement reported simply expresses the ratio of the preceding displacement as approximately 0.3. This can lead to an error when predicting the ratio of the preceding displacement while neglecting the rock conditions; consequently, a complete tunnel behavior analysis cannot be realized. To avoid such error, the finite difference method software FLAC 3D is used to develop an expanded longitudinal deformation profile (ELDP) according to the rock mass conditions. The ELDP is represented by graphs featuring different shapes according to the rock mass rating (RMR), and the empirical formula of the LDP best fitted for the tunnel convergence measurement values is expanded. This expanded LDP formula is proposed in a generalized form, including the parameters α and β from the empirical equation. These parameters α and β are expressed as functions of the RMR and initial stress. Statistical analysis results of the 3D numerical analysis of 35 cases were analyzed in the ranges of α = 0.898–2.416 and β = 1.361–2.851; this result is based on the empirical formula of Hoek (1999) (α = 1.1, β = 1.7), which was expanded in the current study according to the rock quality and initial stress conditions.

1. Introduction

Tunnel excavations generate displacements/convergence owing to the redistribution of stresses at the excavation periphery. Such convergence/deformation in tunnels is an important factor for evaluating tunnel behavior. Tunnel deformations depend on the rock mass properties and excavation-induced stress environments. Analyzing tunnel convergence is considered important for implementing appropriate excavation and support measures. The longitudinal deformation profile (LDP) is a graph that longitudinally represents the radial displacement of the ground around the tunnel during excavation; it is used to determine the unsupported tunnel distance from the excavation face and considered important for determining the support installation distance and timing in the convergence–confinement method (CCM) [1].
This method (CCM) is widely used in road, hydropower, mining and nuclear waste repository projects that normally involve tunneling and underground excavations. The CCM can be used to estimate the load acting on a support installed behind the tunnel face and to control the displacement at the tunnel excavation face to ensure tunnel stability. The principle of the CCM has been discussed by several previous researchers [1,2,3]. The CCM involves three curves: (1) the LDP, (2) the ground reaction curve (GRC), and (3) the support characteristic curve (SCC); these are illustrated in Figure 1.
A brief description of each point shown in Figure 1 is as follows and a list of nomenclature for symbols is given in Appendix A:
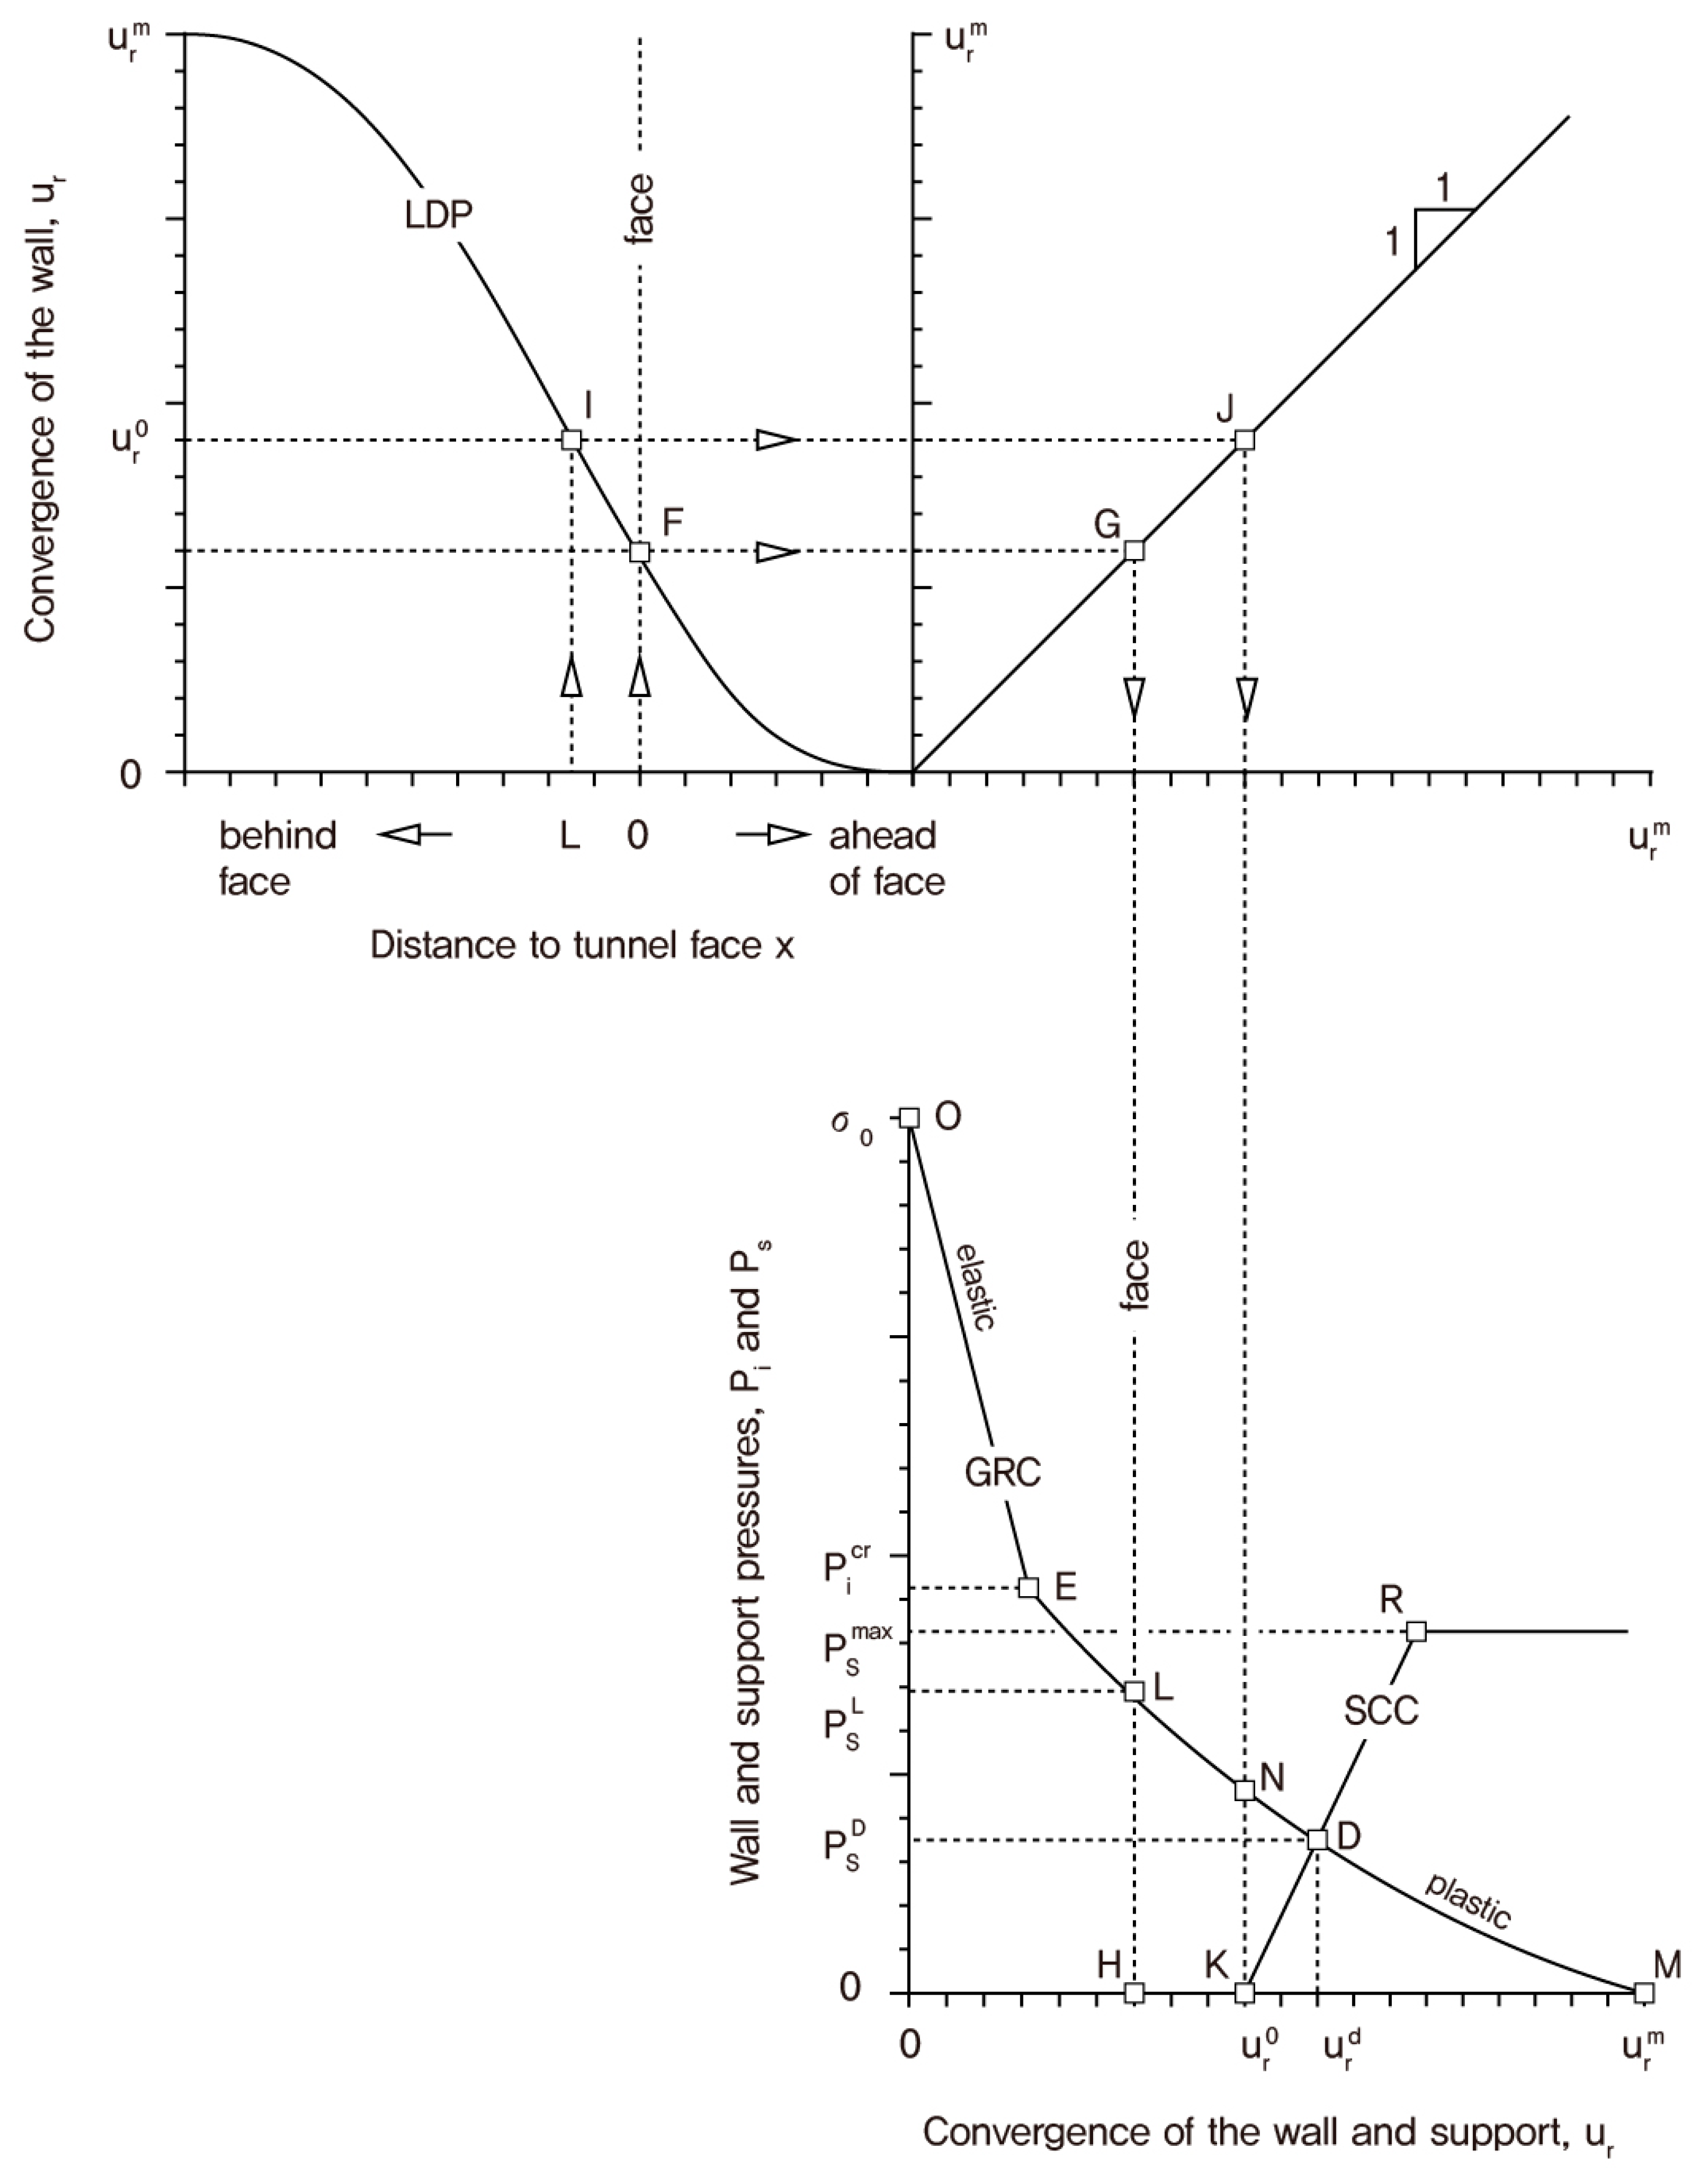
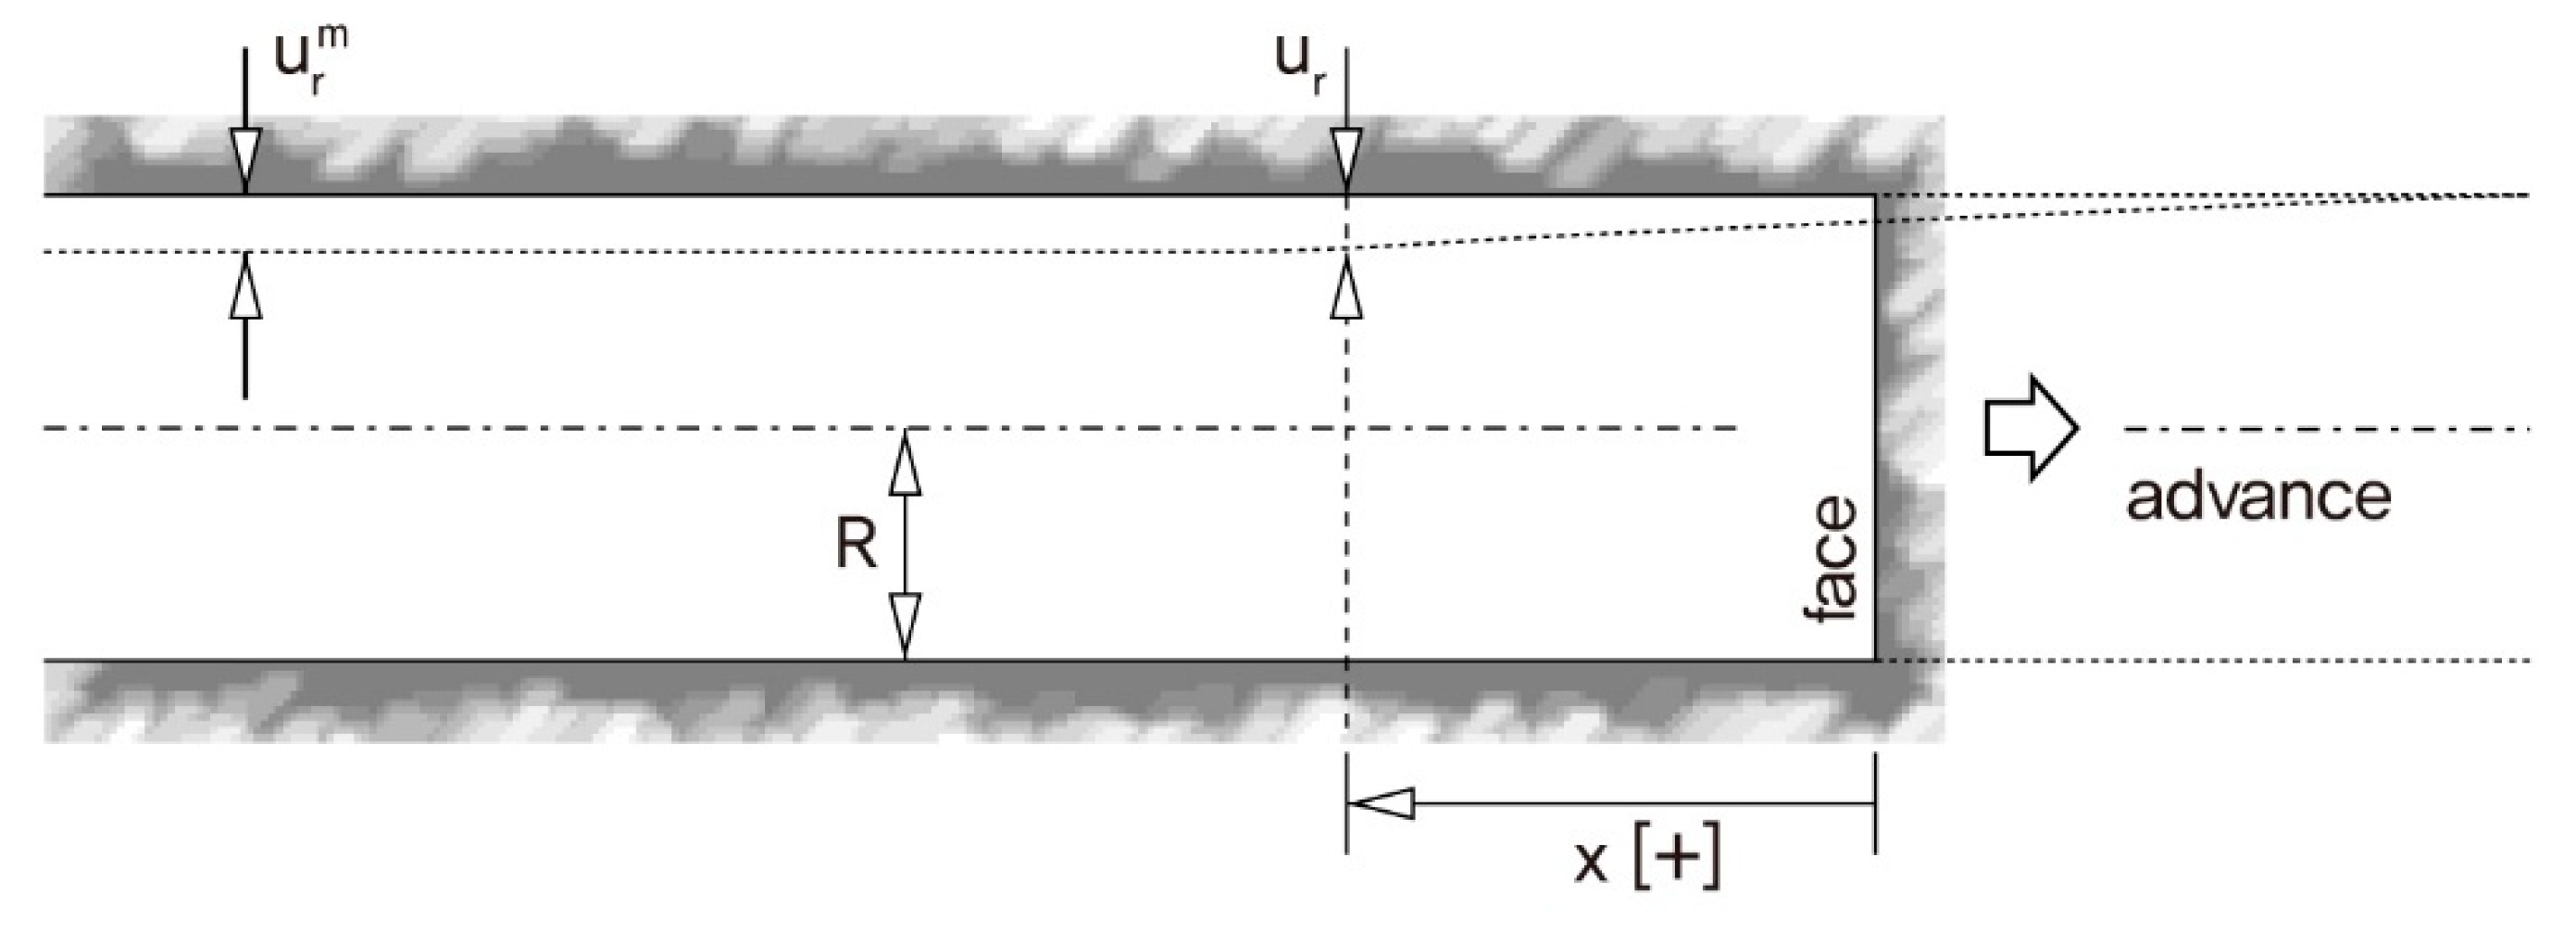
  • Longitudinal deformation profile
    • Point F: Convergence in the tunnel face
    • Point I: Convergence at a location separated by distance L from the back of the tunnel face, u r 0 .
  • Ground reaction curve
    • Point O: Initial state, p i = σ 0 ,   u r = 0
    • Point M: Final point of reach if there are no support members, p i = 0 ,   u r = u r m
    • Point E: When a plastic area is created around the tunnel excavation surface, p i = p i c r
    • Point N: Virtual ground pressure when installing the support members.
  • Support characteristic curve
    • Point K: The time of installing the support members, p s = 0 ,   u r = u r 0
    • Point D: Status of ground pressure exerted by the additional excavation after installing the support members, p s = p s D
    • Point R: Yield of support members, p s = p s m a x .
The complexities of tunnel behavior are dependent on the geological and ground conditions, excavation method, and installed support. Many researchers have used numerical analysis methods to evaluate tunnel behaviors, because these methods can ideally model the tunnel excavation process under various conditions and assess the LDP efficiently. Panet [4] analyzed the convergence during tunnel excavation using axisymmetric finite element analyses under elastic, plastic, and perfect elastoplasticity failure conditions and proposed an equation for convergence. Hoek [5] reported that the deformation due to tunnel excavation first occurs at the front of the excavation surface, resulting in approximately one-third of the total displacement at the excavation surface; this was found to vary according to the ratio of the rock mass strength to the in situ stress. Vlachopoulos and Diederich [3] performed a numerical analysis on various ground conditions based on the Hoek–Brown model and proposed a robust formula to estimate the longitudinal deformation profile (LDP) using plastic radius as a parameter. Alejano et al. [6] presented a new approach to calculate the simplified approximation formula of the plastic area and the LDP according to the GSI under strain-softening rock mass conditions. Rooh et al. [7] presented a new type of LDP using numerical simulations and regression analyses; this profile was a function of the GSI and tunnel cover depth.
Determining the LDP during tunnel excavations according to the rock mass conditions is essential for thorough tunnel behavior analyses. Hoek [8] proposed an empirical formula for the LDP that exhibited the best fit for the tunnel convergence measurements reported by Chern et al. [9]; however, these values are only applicable to the rock conditions at a particular site. As a result, the parameters are fixed and cannot be considered for different ground conditions. The Hoek’s LDP showed that the best fit for the measured values of tunnel internal displacement reported simply expresses the ratio of the preceding displacement as approximately 0.3. This can lead to an error when predicting the ratio of the preceding displacement while neglecting the rock conditions; consequently, a complete tunnel behavior analysis cannot be realized.
This paper proposes an expanded longitudinal deformation profile (ELDP) that considers different rock masses and initial stress conditions. FLAC 3D (ver. 5.00) was used for numerical analyses. The ELDP presented herein is represented graphically according to the RMR value and initial stress conditions. Based on 35 cases, the ELDP is represented using a graph with different shapes according to the RMR value and the initial stress conditions. The LDP empirical formula proposed by Hoek [8], which showed the best fit for instrumental tunnel convergence values as reported by Chern et al. [9], is expanded into a generalized form.

2. Literature Review of Longitudinal Deformation Profile

The LDP is a graph that expresses the amount of convergence at the tunnel wall as a function of the distance from the tunnel face. Figure 2 presents the concept of a longitudinal cross-section and the LDP for an unsupported tunnel with the excavation radius R. At a distance x from the tunnel face, the convergence displacement is u r . On increasing the distance x from the tunnel face, the convergence displacement converges to u r m . Ahead of the excavation face, negative values of x indicate that the rock mass has begun to deform ahead of the excavation face and measureable displacement is reduced to its minimum value at a distance of about one-half a tunnel diameter ahead of the advancing tunnel face. This implies that longitudinal displacement occurs in front of the tunnel face when tunnel excavation is conducted. Thus, LDP analyses considering the preceding displacement are essential for a complete assessment of the tunnel excavation behavior.
Panet and Guenot [4] proposed convergence displacement according to the tunnel distance in the following fractional function form by using finite element analysis:
u r u r m = 0.28 + 0.72 [ 1 ( 0.84 0.84 + x / R T ) 2 ]
where u r = radial displacement at a distance x from the face;
u r m = maximum radial displacement;
R T   = tunnel radius.
Corbetta et al. [10] proposed an empirical formula in the form of an exponential function as follows:
u r u r m = 0.29 + 0.71 [ 1 e x p ( 1.5 ( x / R T ) ) 0.7 ]
Panet [11] conducted a finite element analysis under elastic conditions and proposed a convergence displacement relationship formula according to tunnel distance, as expressed below. This expression can only be applied to the rear of the tunnel face, as indicated in Figure 3 in the form of a dashed line.
u r u r m = 0.25 + 0.75 [ 1 (   0.75 0.75 + x / R T ) 2 ]
Carranza-Torres and Fairhurst [3] presented an improved empirical formula proposed by Hoek [8], as expressed in Equation (4). This empirical formula is best fitted with the sigmoid curve function measured by Chern et al. [9] for the Mingtam Power Cavern project (Figure 3). The empirical formula of Hoek [8] is applicable to both the front and rear of the tunnel face.
  u r u r m = [ 1 + exp ( x / R T 1.10 ) ] 1.7
The proposed LDP calculation formula is a function of the excavation distance and does not consider the parameters for the ground conditions. Unlu and Gecek [12] proposed normalized radial displacements using numerical analyses and statistical regression to account for the effect of Poisson’s ratio on circular tunnels under elastic ground conditions. Unlu and Gercek [12] believed that it was difficult to obtain a good correlation for expressing the normalized LDP in the form of a single sigmoid curve when curve fitting the results of tunnel air displacement obtained via numerical analyses. Moreover, they proposed a formula for determining the LDP by dividing it into two parts, as shown in Figure 4, based on the tunnel face.
U a = u r u r m = u 0 + A a [ 1 exp ( B a X * ) ]     for   X *   0
U b = u r u r m = u 0 + A b [ 1 [ B b ( B b + X * ) ] 2 ]   for   X * 0
where X * = | x | / R T , x = distance from the face, and R T   = tunnel radius;
u 0 = normalized pre-deformation ( u 0 = 0.22 ν + 0.19 );
A a ,   B a ,   A b   and   B b are the statistical constants dependent on Poisson’s ratio;
A a = 0.22 ν 0.19 , B a = 0.73 ν + 0.81 ;
B b = 0.22 ν + 0.81 , B b = 0.39 ν + 0.65 .
Vlachopoulos and Diederichs [3] analyzed the normalized maximum plastic zone, R P / R T , generated around the rock during the excavation of a circular tunnel; they proposed a new form of the LDP formula, indicating the relationship between u 0 / u r m and R P / R T . The convergence displacement at the tunnel face ( X * = x / R T = 0 ) u 0 * is expressed as follows:
u 0 * = u 0 u r m = 1 3 exp ( 0.15 R * )
where R * = R P / R T ;
R P = maximum plastic radius;
R T = tunnel radius.
The normalized maximum plastic zone and the relational expressions of u r / u r m as a function of R P / R T are as follows:
u * = u r u r m = u 0 * · exp ( X * )   for   X *   0 ( in   the   rockmass )
u * = u r u r m = 1 ( 1 u 0 * ) · exp ( 3 X * 2 R * )   for   X *   0   ( in   the   tunnel )
where X * = x / R T .
Rooh et al. [7] performed numerical and regression analyses on circular tunnels using the tunnel diameter, geological strength index (GSI), and overburden depth, and they proposed an S-shaped logistic function:
u r u r m = 1 + 1 1 + m · exp ( n · X )
where X * = x / D ;
x   = distance from the face;
D = tunnel diameter.
According to the GSI range, m and n can be expressed as follows:
m = { 0.74 × exp ( 23.69 · h 0.4 D 1.6 · G S I 0.8 )       for   G S I < 20 1.85                                             for   G S I 20
n = { 1.73 × ln ( G S I 0.9 h 0.7 ) 1.36         for   G S I < 60 4.3                                               for   G S I 60

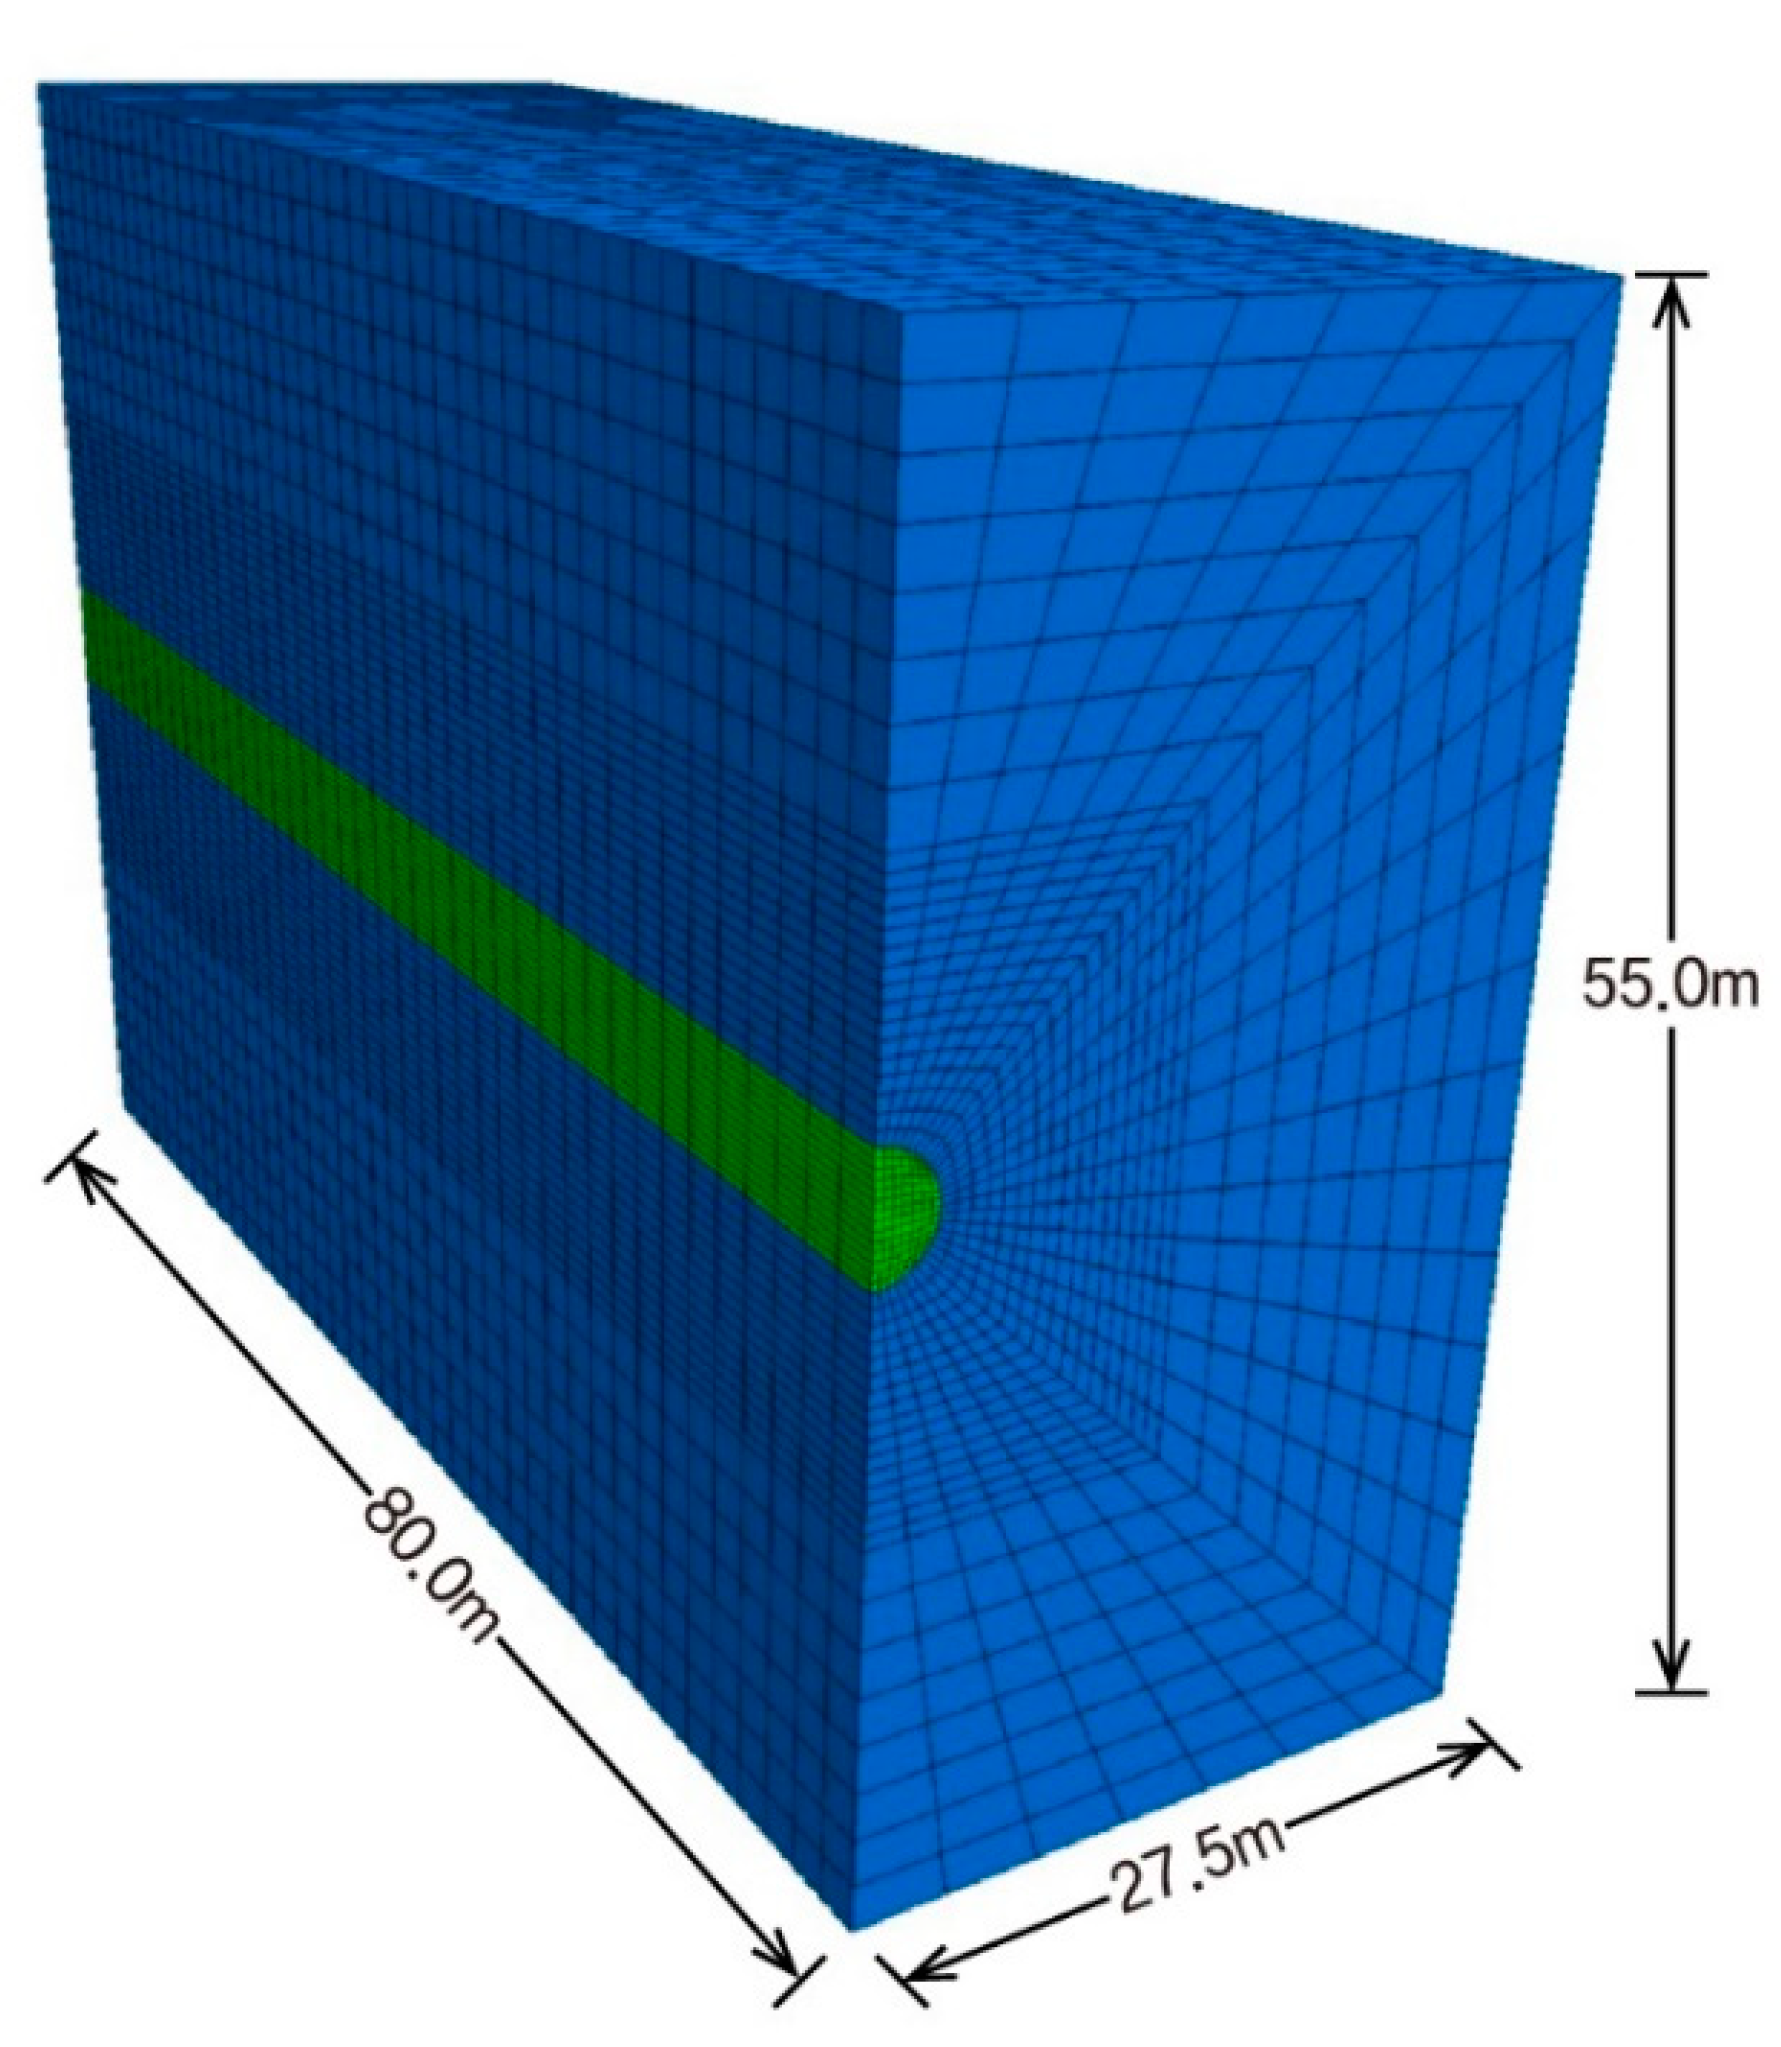
3. Numerical Simulation

To assess the impact of the rock quality and the initial stress conditions on LDP around the tunnel, FLAC 3D numerical simulation was performed. For variable geology under different stress conditions, it was obvious to choose the FLAC 3D continuum model to study displacements at locations around the tunnel. The numerical simulations were done to present the LDP considering the rock mass conditions and the initial stress state. The overall shape of the analysis model is shown in Figure 5. The modeling dimensions are X = 27.5 m, Y = 80.0 m, and Z = 55.0 m, and the tunnel diameter is 5 m.

3.1. Constitutive Model and Failure Criterion

The behavior of the rock was evaluated using the Mohr–Coulomb failure criterion expressed for an elastic–perfectly plastic material. The Mohr–Coulomb failure criterion is expressed as a function of the normal stress and the shear stress acting on the failure surface. As the normal stress acting on the failure surface of the rock mass increases, the shear resistance of the fracture surface increases. The Mohr–Coulomb failure criterion is well reflected in these rock strength characteristics, and it is expressed as a relatively simple formula. Therefore, it is widely used as a yield condition in ground analyses.

3.2. Rock Mass Conditions for the 3D Numerical Analyses

Rock mass classification, which qualitatively and quantitatively indicates the condition of a rock mass, is currently acknowledged as a mandatory adjunct when evaluating rock mass environments for engineering purposes. Although well-known classification systems have been applied in various engineering projects such as mining, slopes, dam foundations, and tunnel-boring machines (TBMs), they have been developed, refined, and updated for tunnel support design [13]. Numerous rock mass classifications have been developed, such as the RQD, RMR, Q-system, and GSI. In this study, RMR was adopted as a way of expressing the rock mass condition. The RMR classification was first proposed by Bieniawski [14], and it has since been modified several times. Its features and structures have also been modified significantly [15,16,17].
The change in the LDP curve according to the rock mass conditions was analyzed via numerical analyses, and the rock mass conditions were defined by dividing the RMR value in 5–20 intervals. Numerical modeling numbers were classified into 35 cases from A-1 to G-6, including the initial stress conditions. Table 1 lists the rock mass properties and the initial stresses of the rock mass for the numerical analyses.
The rock mass properties obtained from the Korean railway construction site (Figure 6) were used as input values for the numerical analysis. The Songjeong Tunnel, which features an extension of 10 km, is located at this construction site. The Ulsan and Ocheon faults are in the area where the Songjeong railway tunnel is planned; these are large faults that extend for approximately 50 km and intersect with the Yeonil tectonic line, which has a 50-m-wide brittle layer. The distribution of rock quality on the project site is generally poor; mudstone and andesite are noted at the starting point, whereas most of the remaining section features granite distributed along the tunnel alignment.

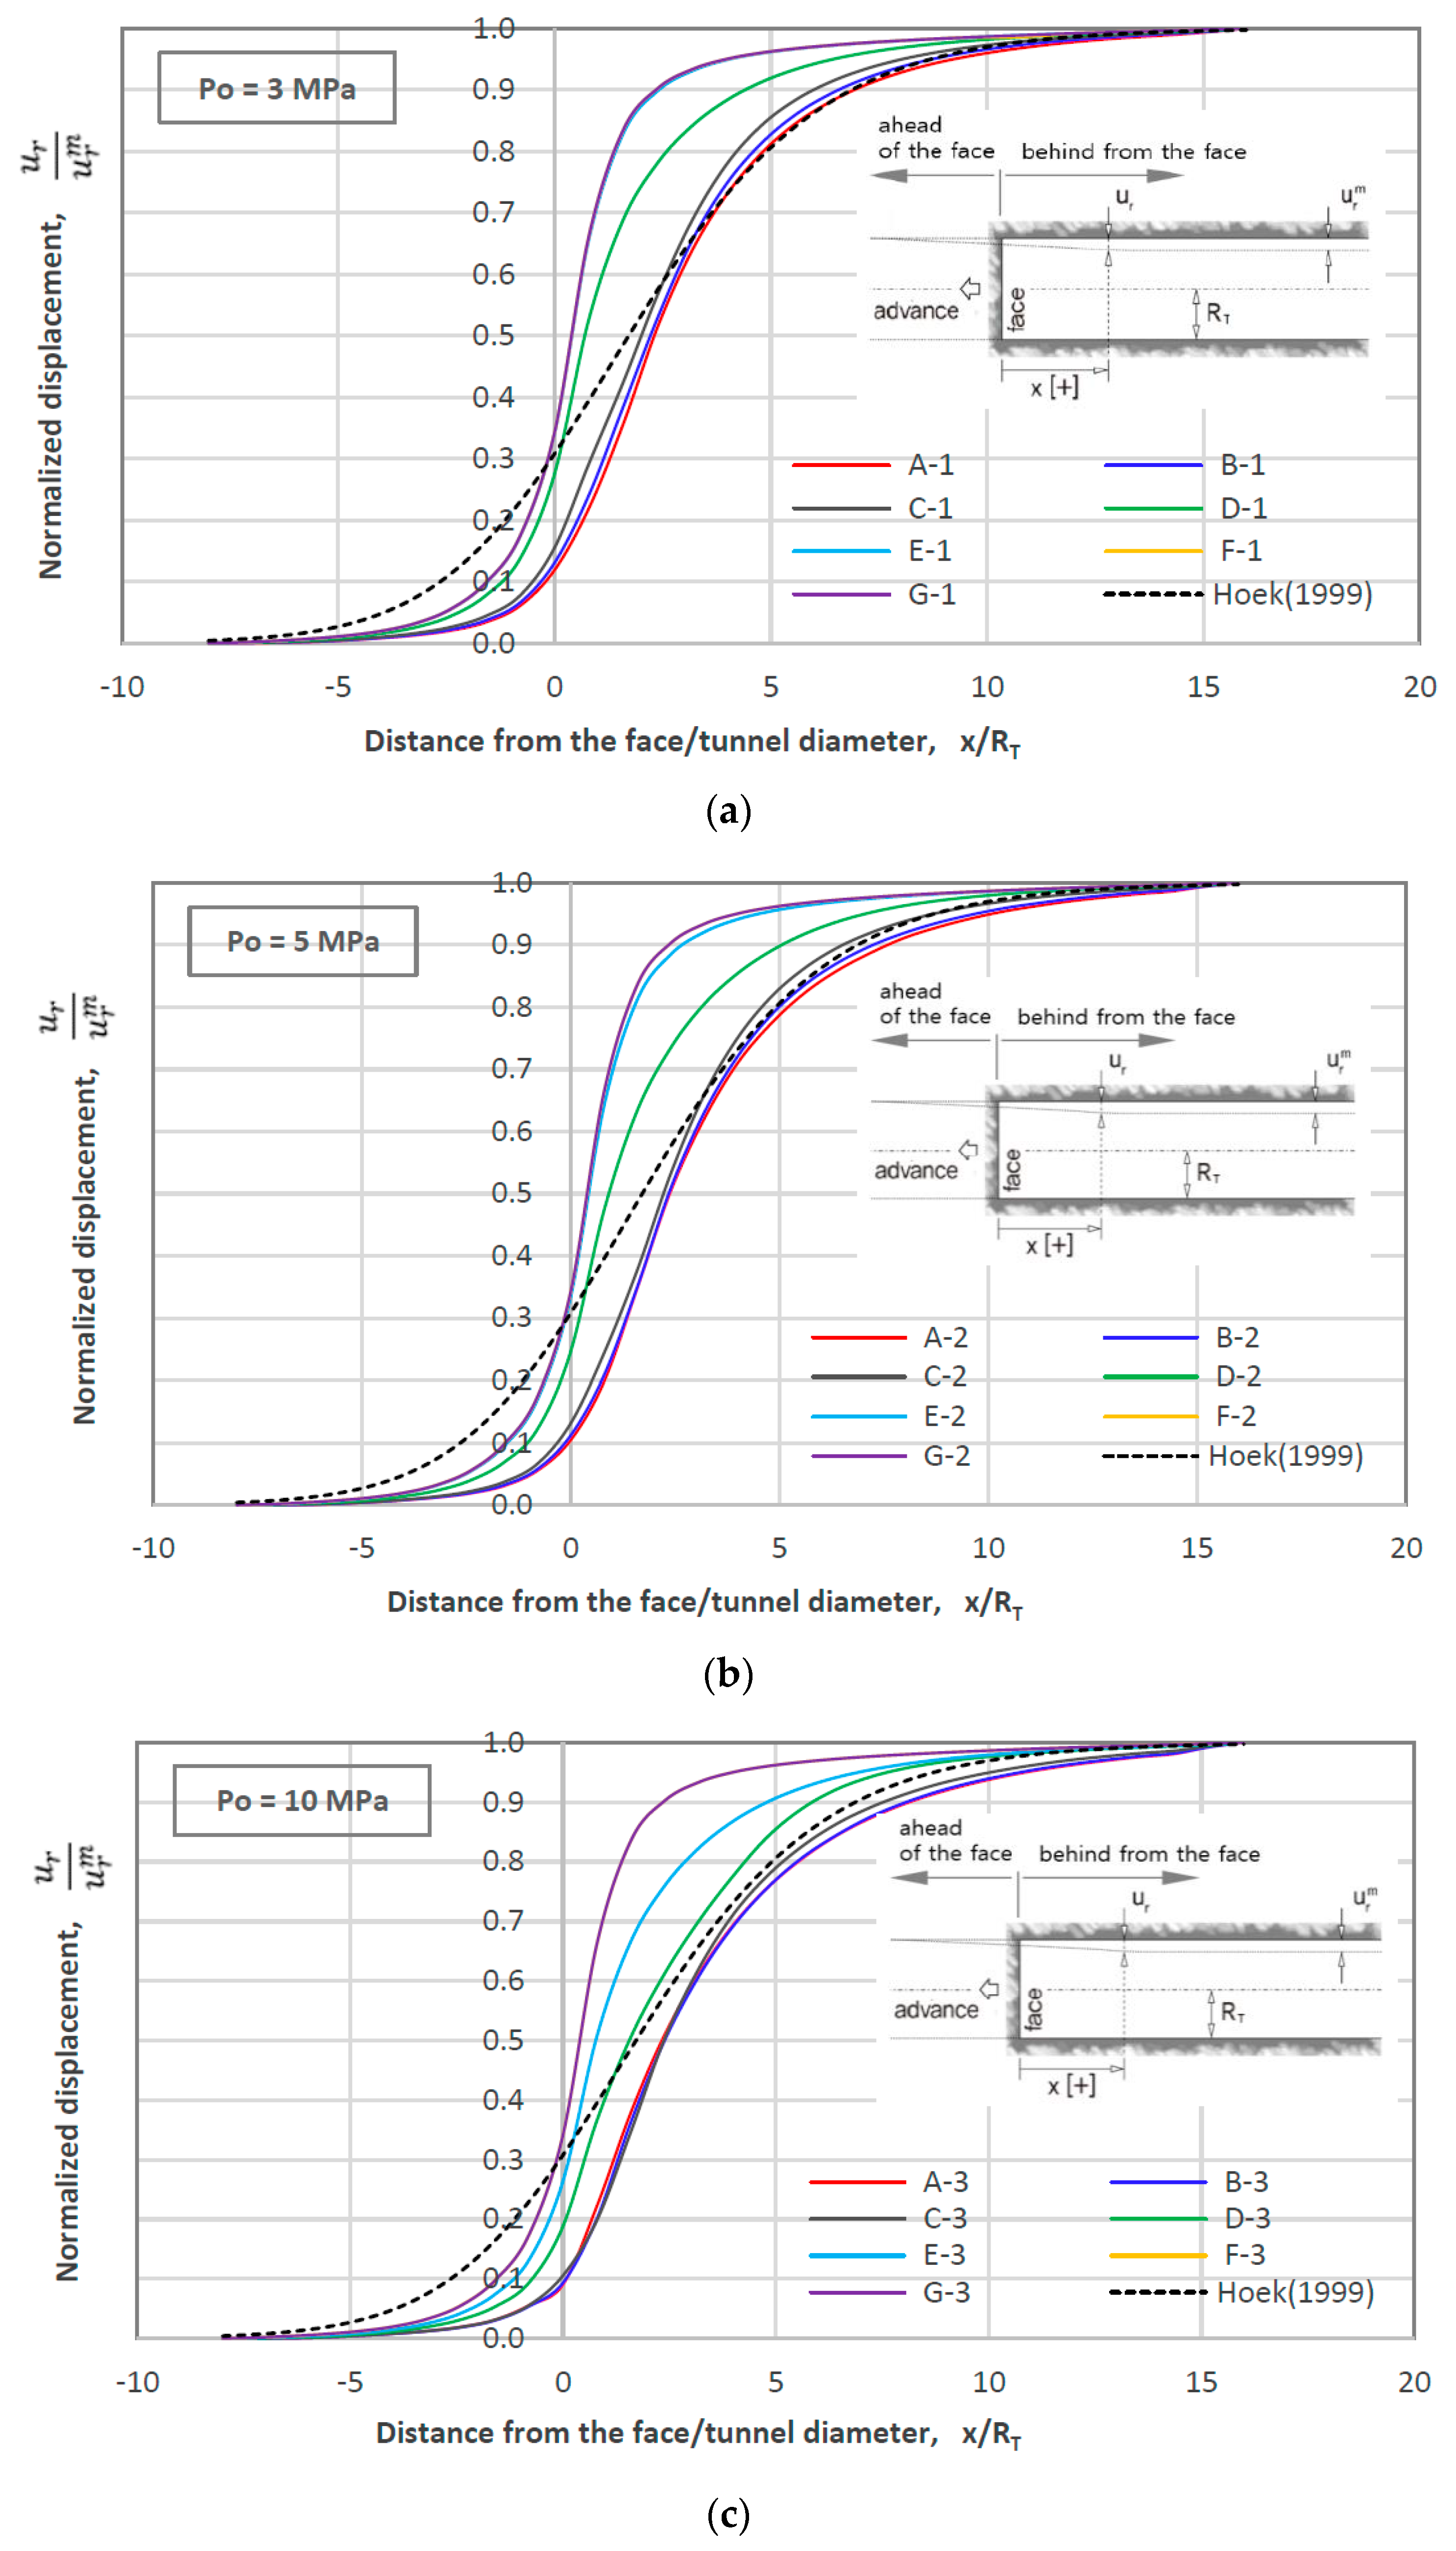
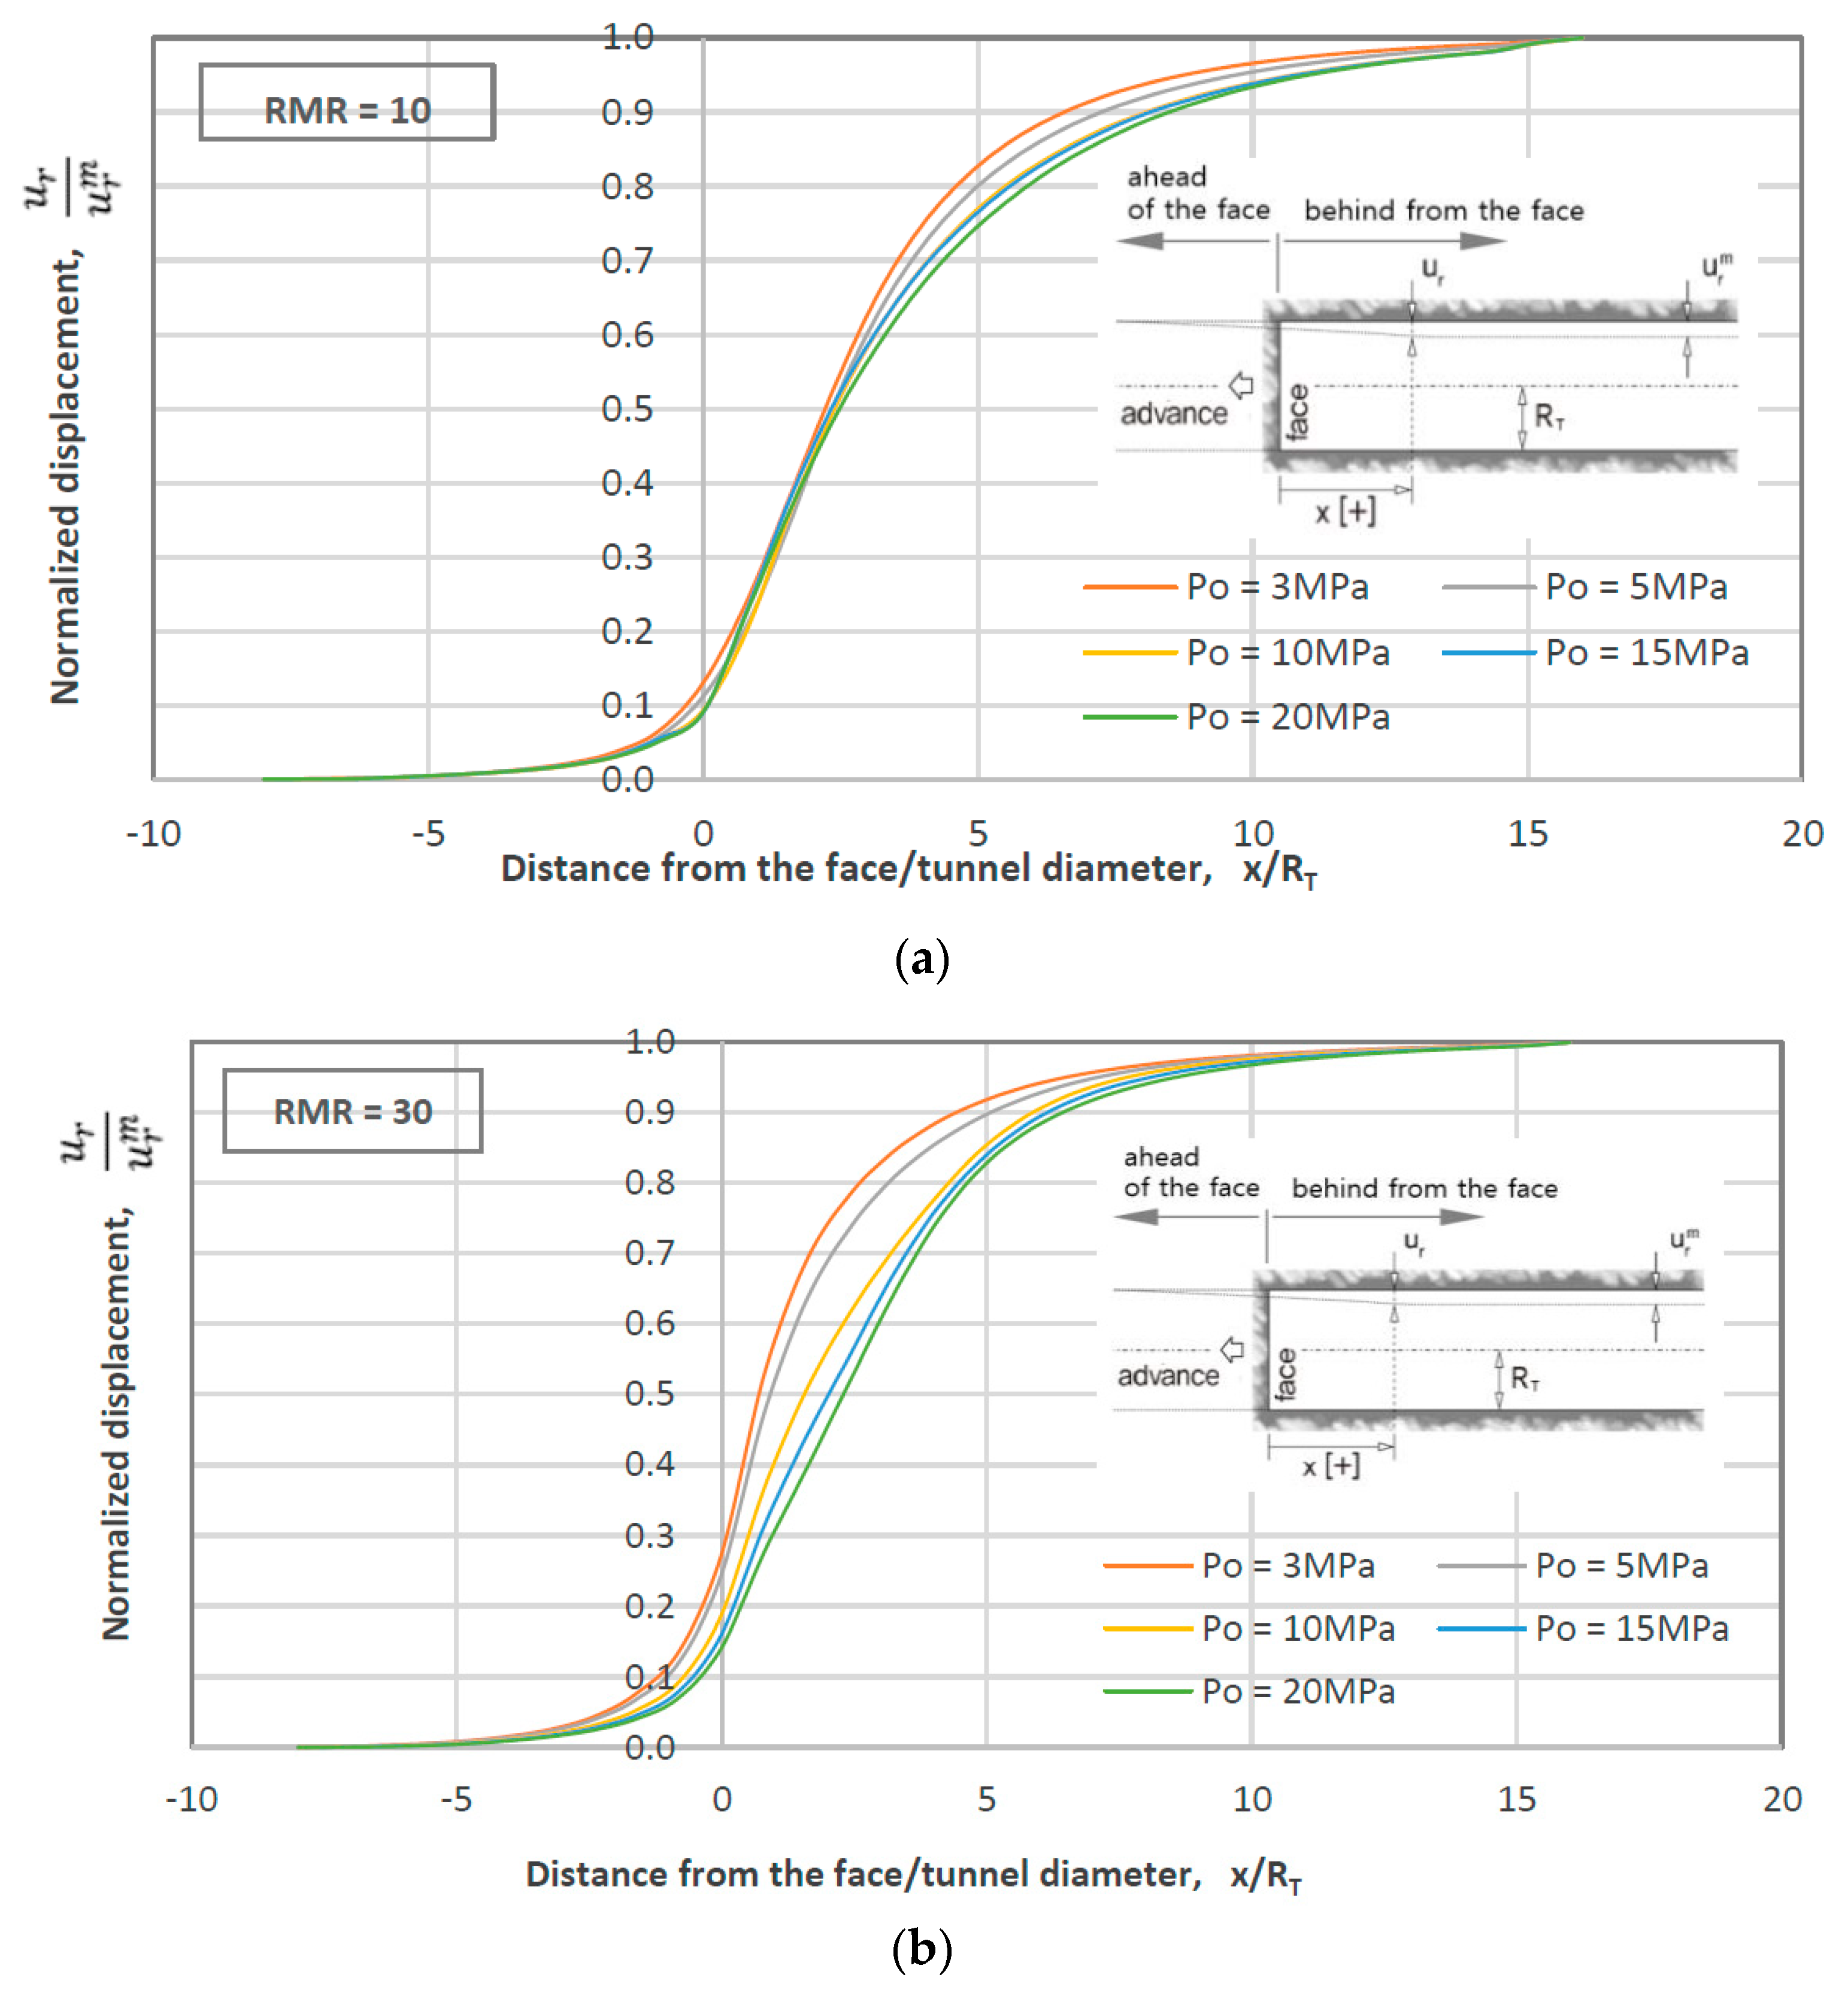
3.3. Results of Analyses

Numerical analyses were performed using FLAC 3D, and the LDP curves were obtained according to the rock mass properties (RMR) and initial stress (Po) conditions (Figure 7). In Figure 7, the x-coordinate represents the distance from the tunnel excavation face, while the y-coordinate denotes the normalized deformation for the final deformation caused by tunnel excavation. As the tunnel excavation advances, the preceding deformation occurs ahead of the face. The ratio of the preceding displacement is defined as the normalized displacement ( u r / u r m ) at the face. The LDP in this study shows that as the RMR decreases, the ratio of the preceding displacement decreases, and the displacement converges gradually behind the excavation face. This LDP trend is similar to that reported by previous studies [3].
Notably, the LDP presented herein was found to differ from that reported by Hoek [8], which is indicated by a dotted line in Figure 7. The rock mass deformation ahead of the excavation face was found to be less than that determined by Hoek [8]. Furthermore, according to the RMR (expressed as groups A to F), different shapes of the LDP are presented. The LDP proposed by Hoek [8] showed a trend similar to that of the proposed LDP only at x / R T = 5 behind the excavation face, when the RMR was grade V (groups A, B, and C). This indicates that the LDP formula of Hoek [8] represents the measured values for a specific site, and thus, it cannot reflect various rock conditions.
It should be noted that according to the LDP analysis results obtained in this study, the ratio of the preceding displacement varies from 0.1 to 0.35 according to the change in rock conditions. The LDP of Hoek [8], which showed the best fit for the measured values of tunnel internal displacement reported by Chern et al. [9], simply expresses the ratio of the preceding displacement as approximately 0.3 (Figure 3). This can lead to an error when predicting the ratio of the preceding displacement while neglecting the rock conditions; consequently, a complete tunnel behavior analysis cannot be realized. When the initial stress increased, the LDP tended to move toward the right, and this tendency became more dominant under the condition of poor rock quality (Figure 8). This is attributed to the effect of increasing the plastic area around the excavation surface of the tunnel as the initial stress increases. It means that under high-stress conditions, the rock mass around the tunnel deforms more as compared with low-stress conditions. Furthermore, poor-quality rocks have low load-carrying capacity as compared to strong rocks. Therefore, poor-quality rocks deform more under high-stress conditions.
Figure 8 shows the LDP under different initial stress conditions for the same rock mass quality. For RMR = 10, 30, and 50, the LDP changes as the initial stress increases (Figure 8a–c); however, for RMR = 70, there is no change in the LDP with respect to the changes in the initial stress (Figure 8d). Even under the condition of RMR = 90, the same trend as that under RMR = 70 was observed, and therefore, the results are not included in the paper. This is likely due to the effect of the increase in the plastic zone when the initial stress increases under poor rock quality. In fractured rock conditions where joints are developed, the LDP should be considered important because it is affected by both the rock quality and the initial stress conditions.

4. Regression Analysis Results

Regression analysis methods were used to generalize the LDP curves obtained via the numerical analysis. The empirical formula for the LDP proposed by Hoek [8] (Equation (4)) can be generalized as Equation (13) containing two parameters (α, β):
u r u r m = [ 1 + exp ( x / R T α ) ] β
where α ,   β = p a r a m e t e r s   r e l a t e d   t o   r o c k   m a s s   c o n d i t i o n s , α   and   β = f ( R M R ,   p 0 ) ;
u r = radial displacement at distance x from the face;
u r m = maximum radial displacement;
x = distance from the face;
R T = tunnel radius.
Parameters α and β are functions of the RMR and initial stress state ( p 0 ) indicating a rock mass condition, as determined via the numerical analysis results. The values of α and β in Equation (13) were obtained using regression analysis. Regression analysis was performed using MATLAB, and the results are listed in Table 2. The analysis was performed in the range of α = 0.898–2.416 and β = 1.361–2.851 depending on the rock quality and the initial stress conditions. These results were obtained using the extended values at α = 1.1 and β = 1.7 of the empirical equation for the LDP proposed by Hoek [8], which showed the best fit for the tunnel internal displacement measurements reported by Chern et al. [9]. The value of α is proportional to the RMR and tends to be inversely proportional to the initial stress. The value of β exhibits a tendency to decrease with an increase in the RMR; however, it shows no clear correlation with the initial stress.
Figure 9 presents the results of the regression analysis for α and β. The correlation was excellent, and the parameters for Equation (13) were analyzed as shown in Equations (14) and (15):
α = 0.305 ln(Po/RMR1.5) + 2.419
β = 2.926 exp(−0.01 RMR).

5. Conclusions

This paper proposed a longitudinal deformation profile (LDP) considering the rock quality and the initial stress conditions. For LDP analysis, a numerical analysis method using FLAC 3D was employed, and 35 analysis results were evaluated by combining the RMR and the initial stress conditions. This study expanded the empirical equation for the LDP proposed by Hoek [8], which showed the best fit for the measured values of tunnel internal displacement reported by Chern et al. [9]. This previous study can lead to an error in forecasting the ratio of the preceding displacement while ignoring the rock conditions. Due to this, a comprehensive tunnel behavior analysis cannot be understood. To avoid such error, an expanded longitudinal deformation profile (ELDP) is developed according to the rock mass conditions. The results of this study can be summarized as follows:
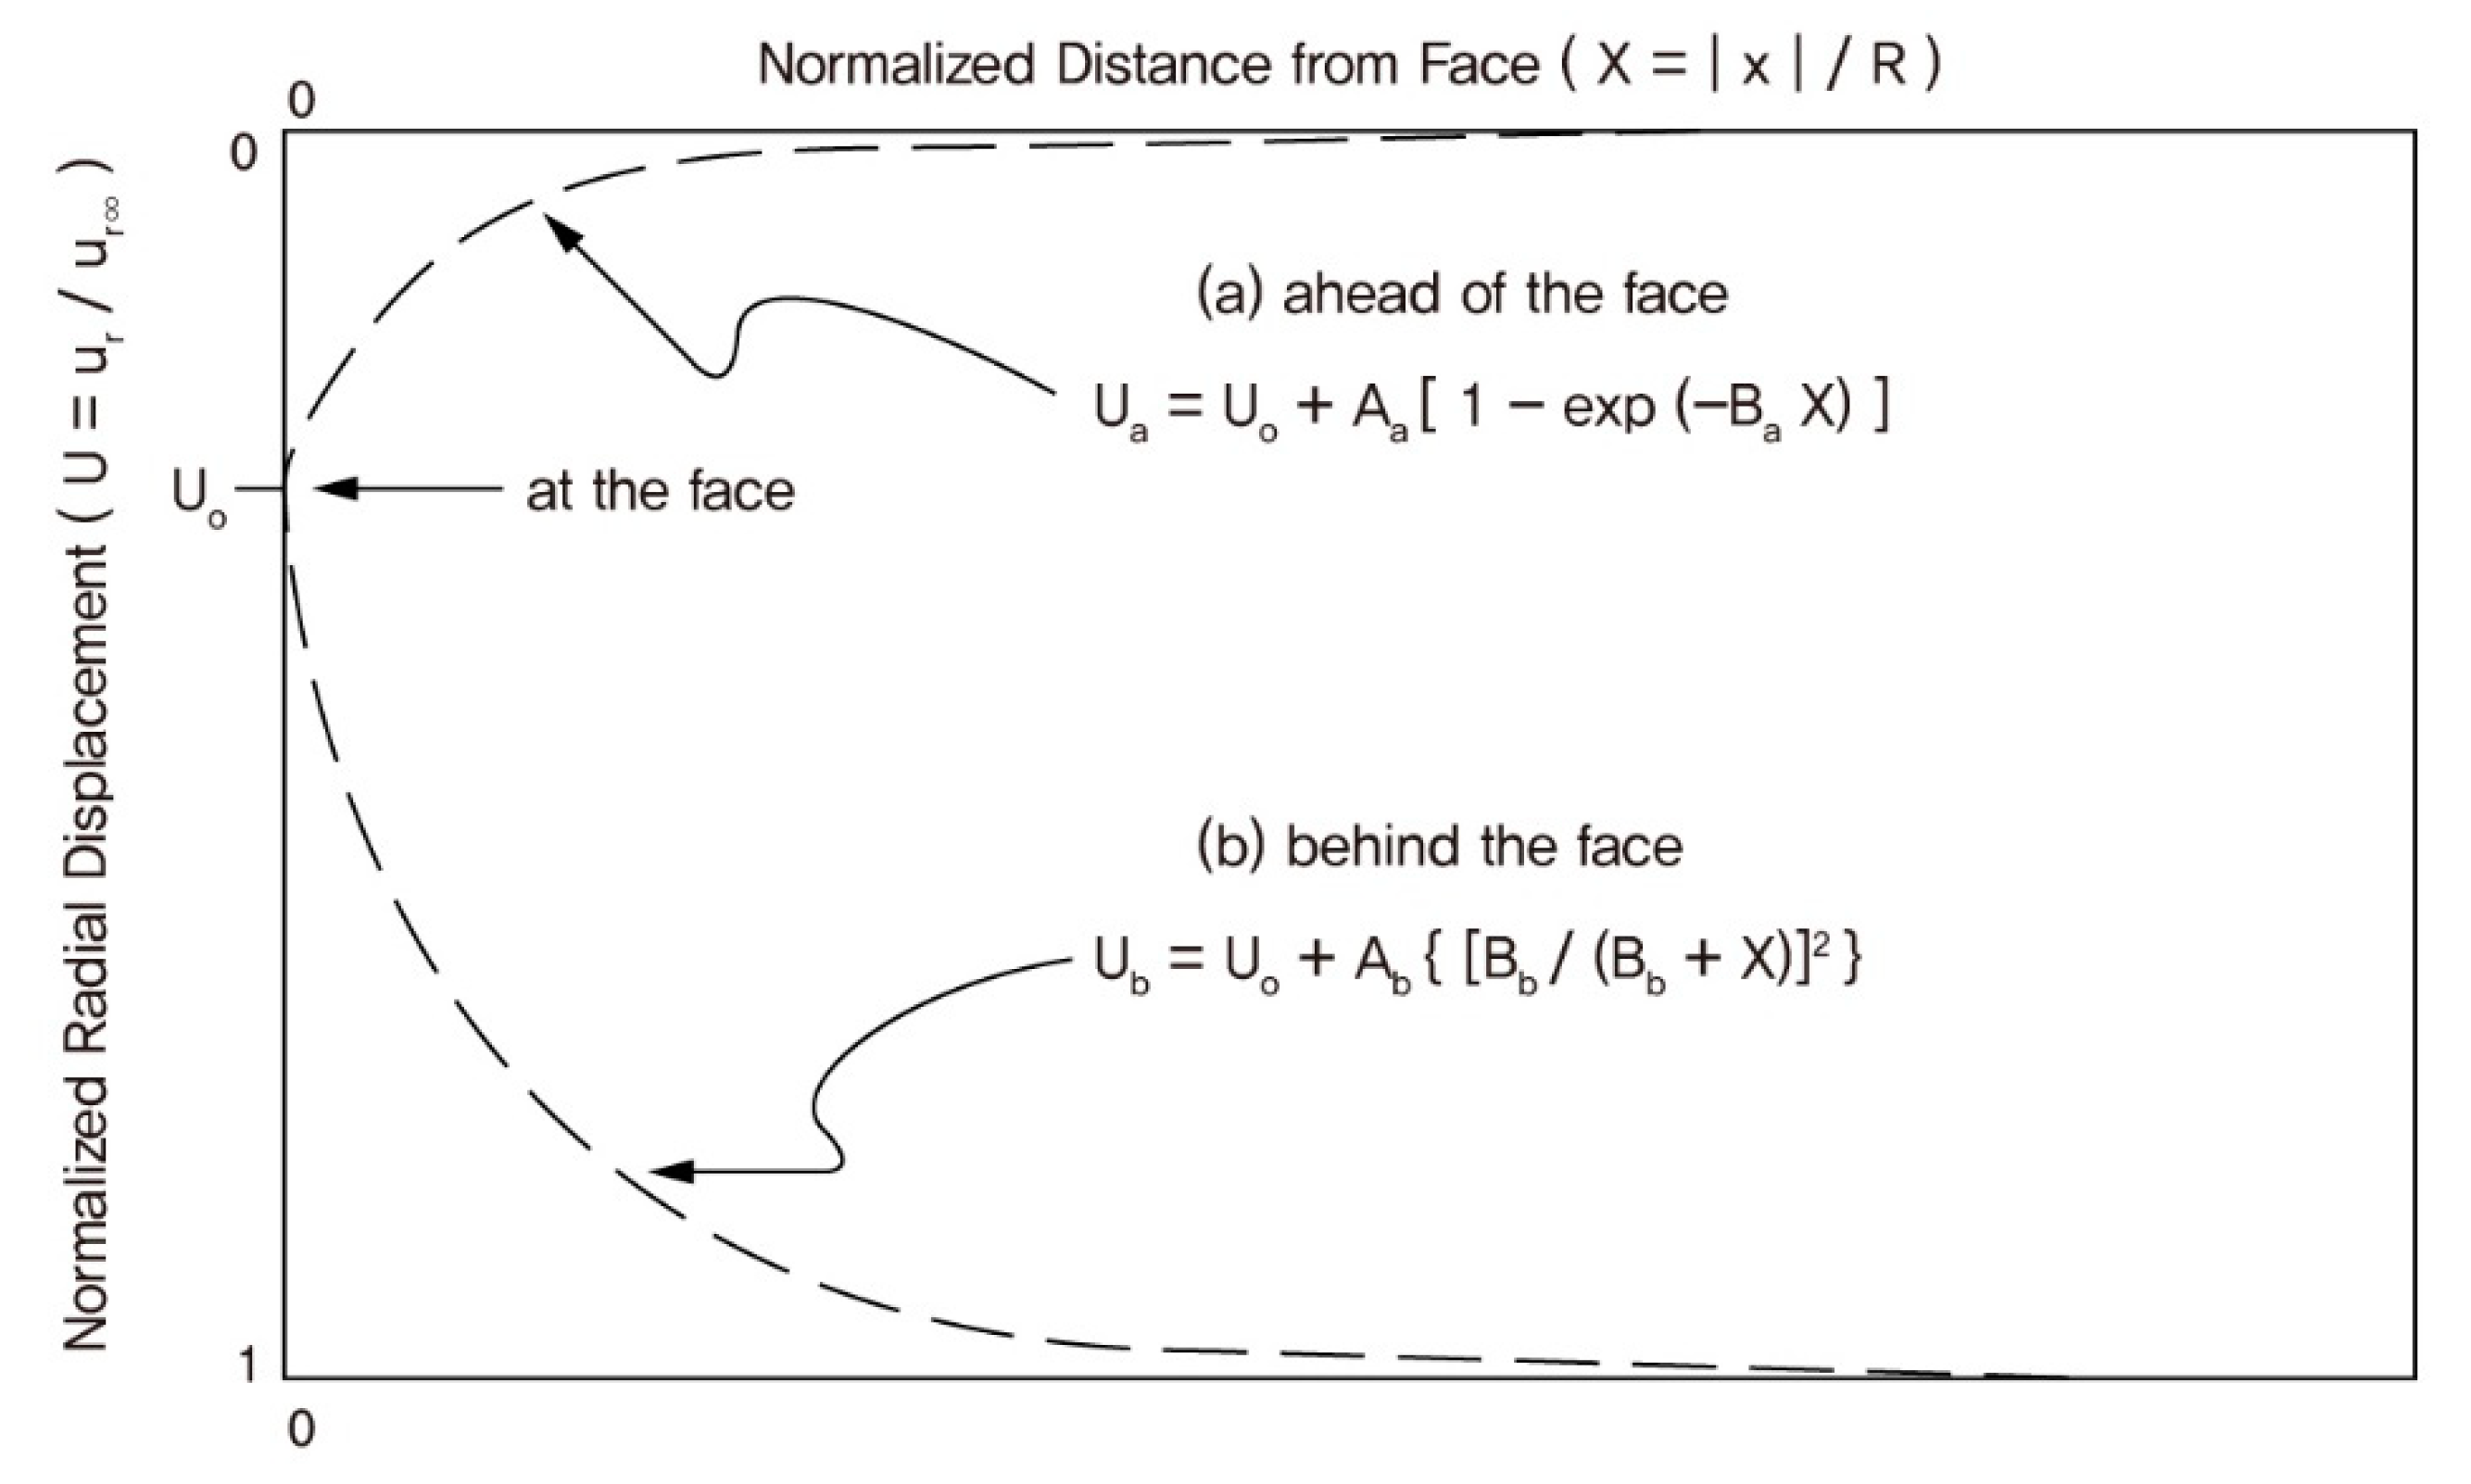
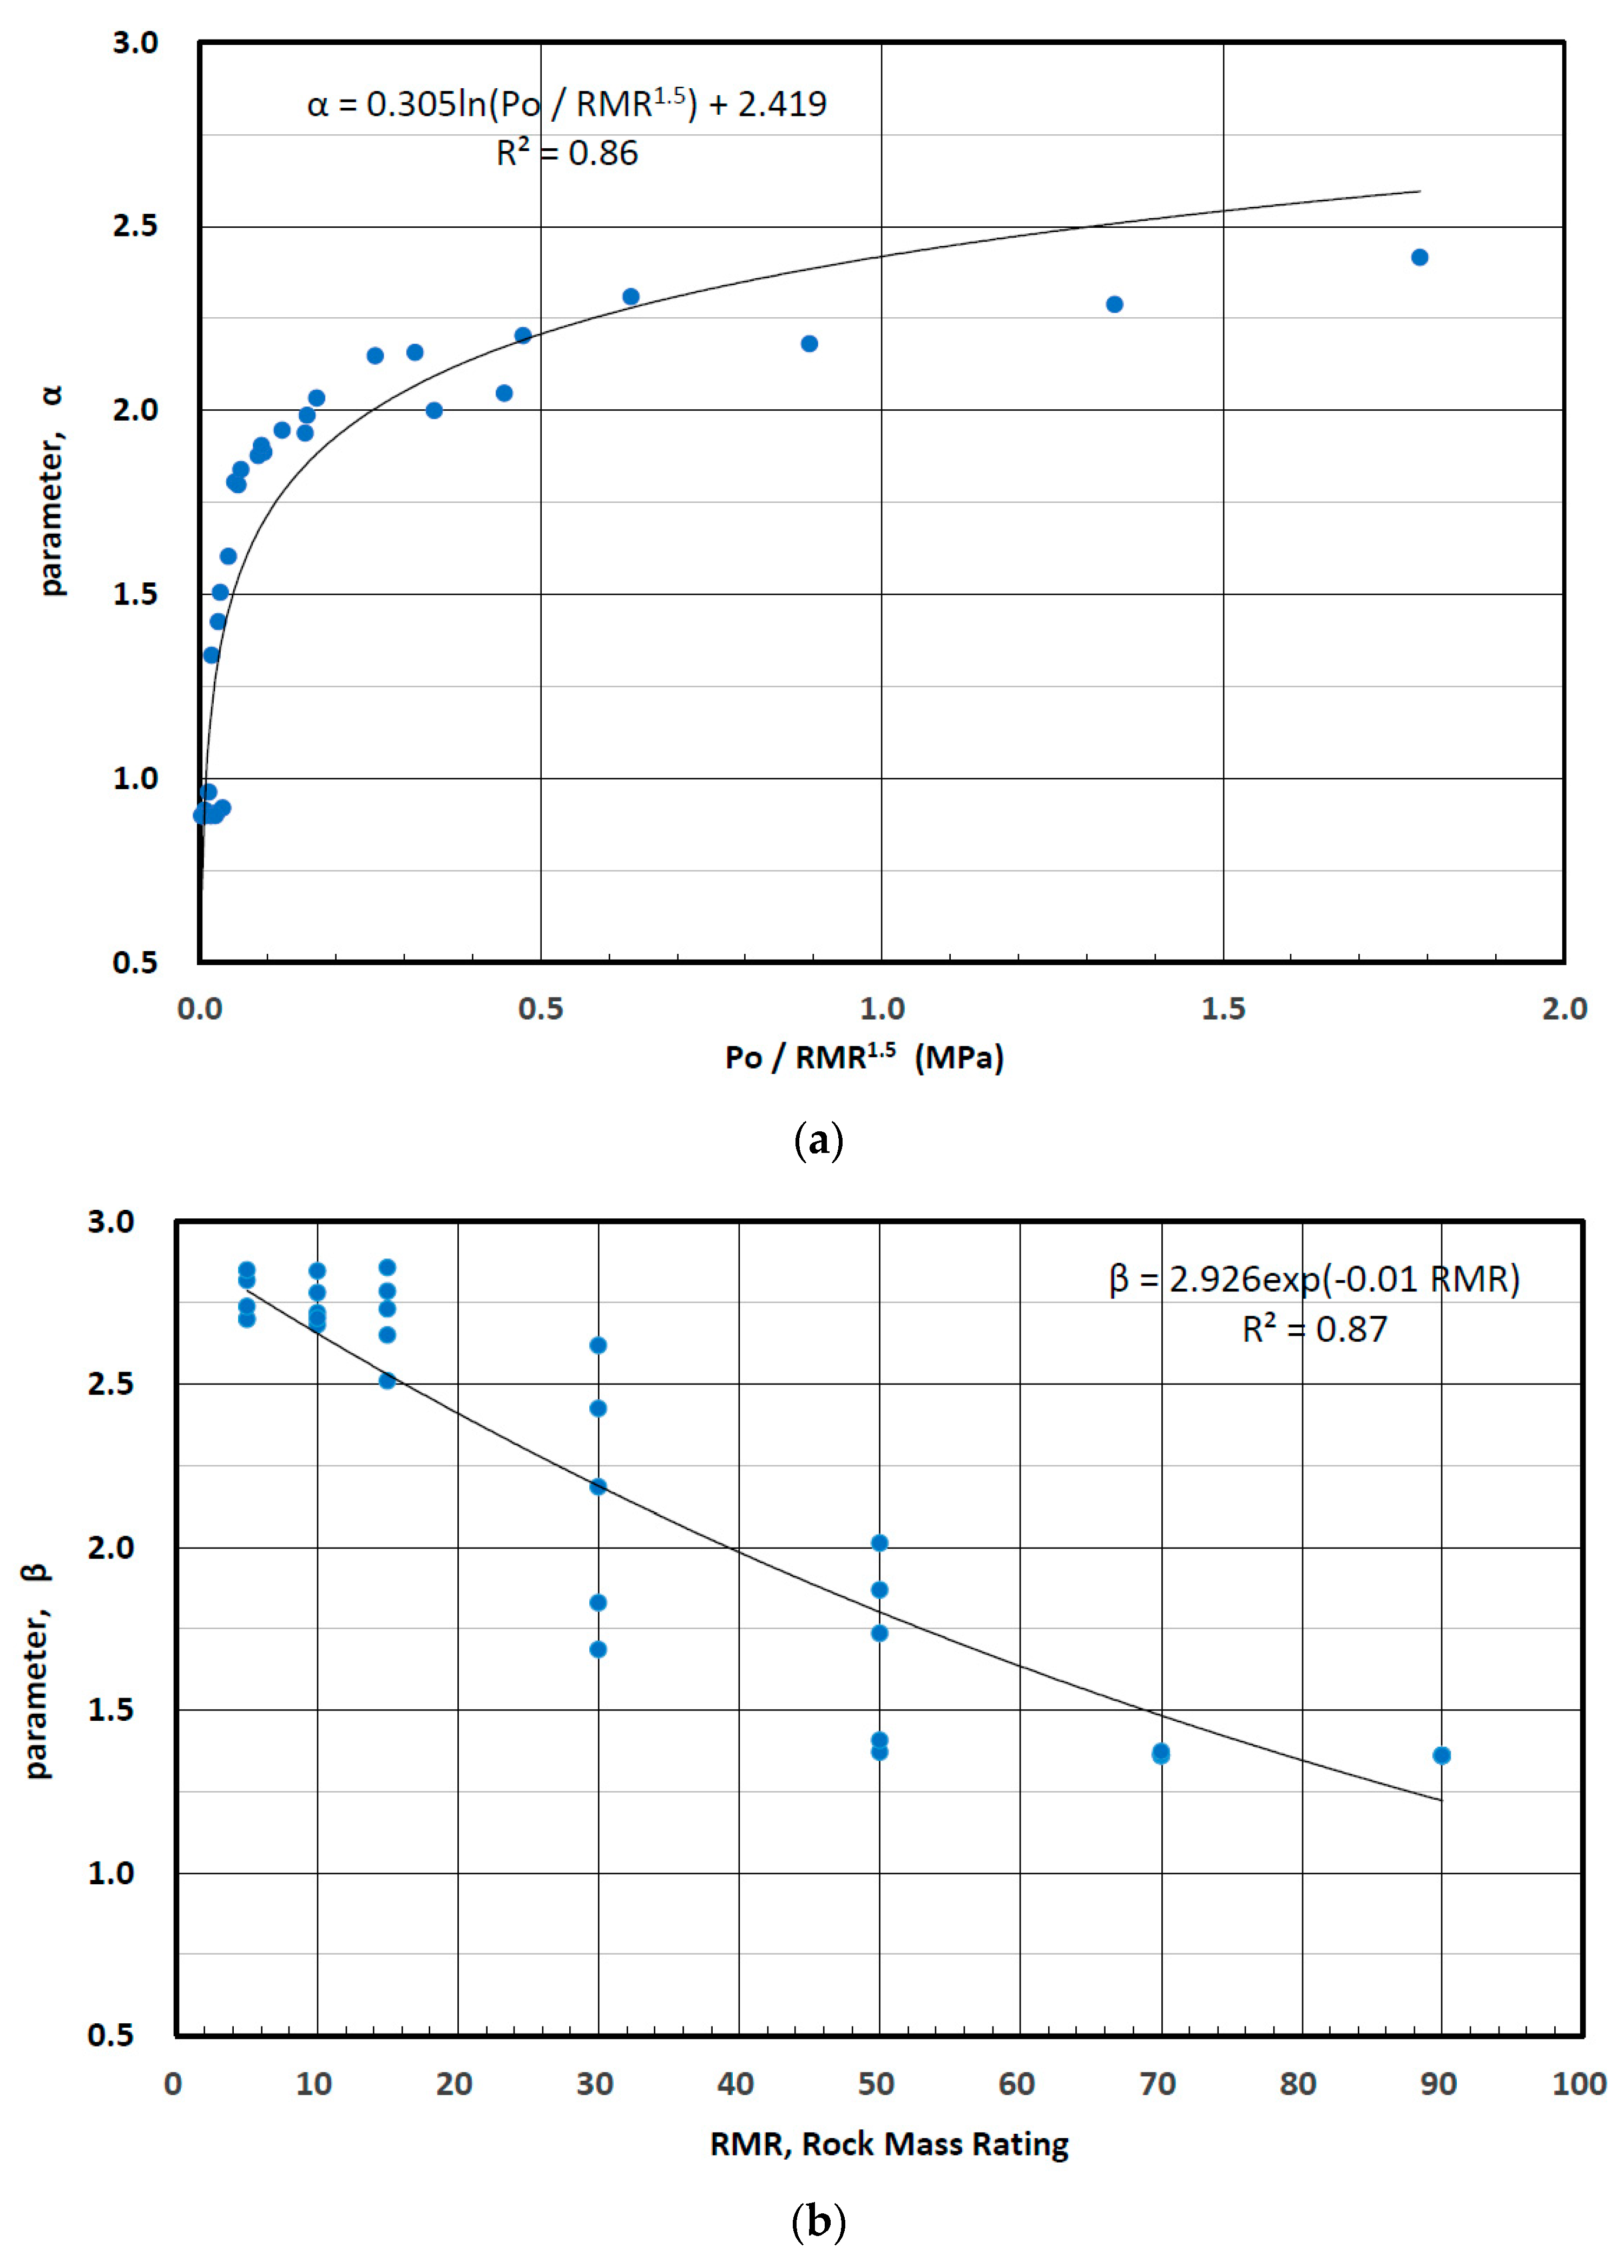
  • An LDP equation considering tunnel excavation conditions was proposed in a generalized form, including the parameters α and β from the empirical equation put forth by Hoek [8]. The parameters are expressed as a function of the RMR and the initial stress, where α is a log function and β is an exponential function with excellent correlation coefficient.
    u r u r m = [ 1 + exp ( x / R T α ) ] β
    where α = 0.305 ln(Po/RMR1.5) + 2.419;
    β = 2.926 exp(−0.01 RMR).
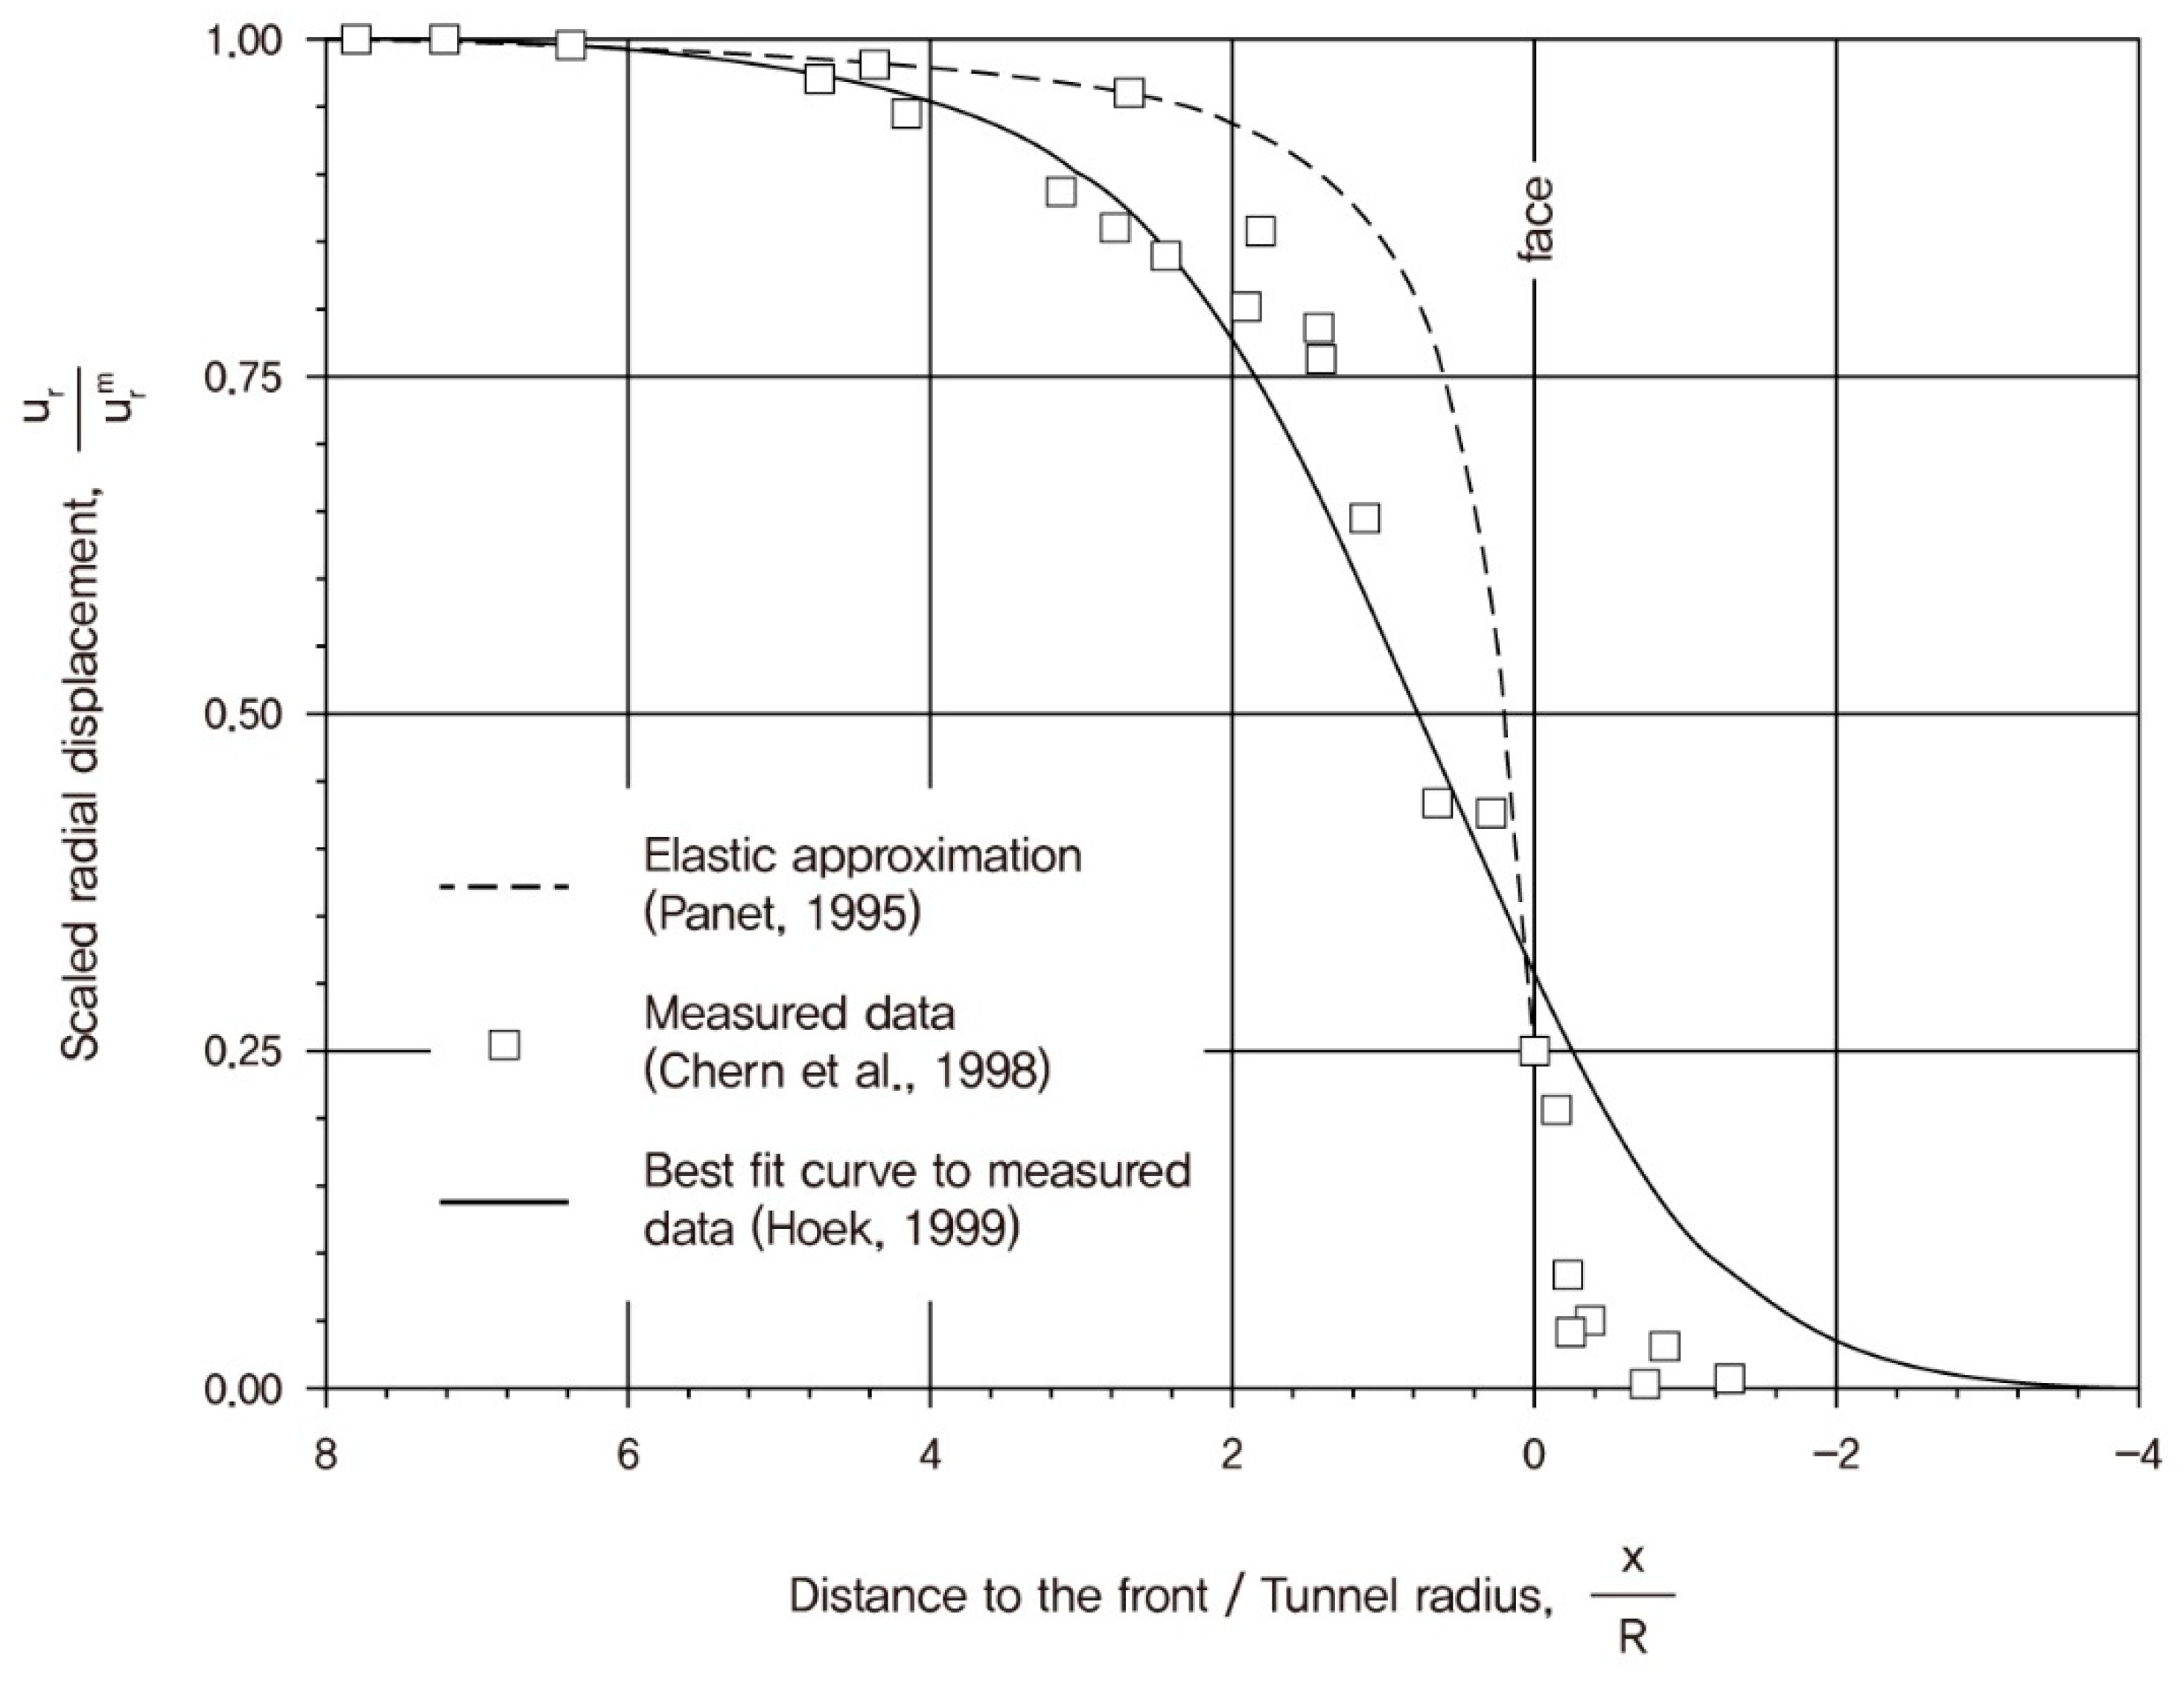
  • For the empirical formula of Hoek [8], which showed the best fit for the tunnel internal displacements reported by Chern et al. [9], the values of α and β were 1.1 and 1.7, respectively. However, in the present study, α = 0.898–2.416 and β = 1.361–2.851 depending on the rock quality and the initial stress conditions.
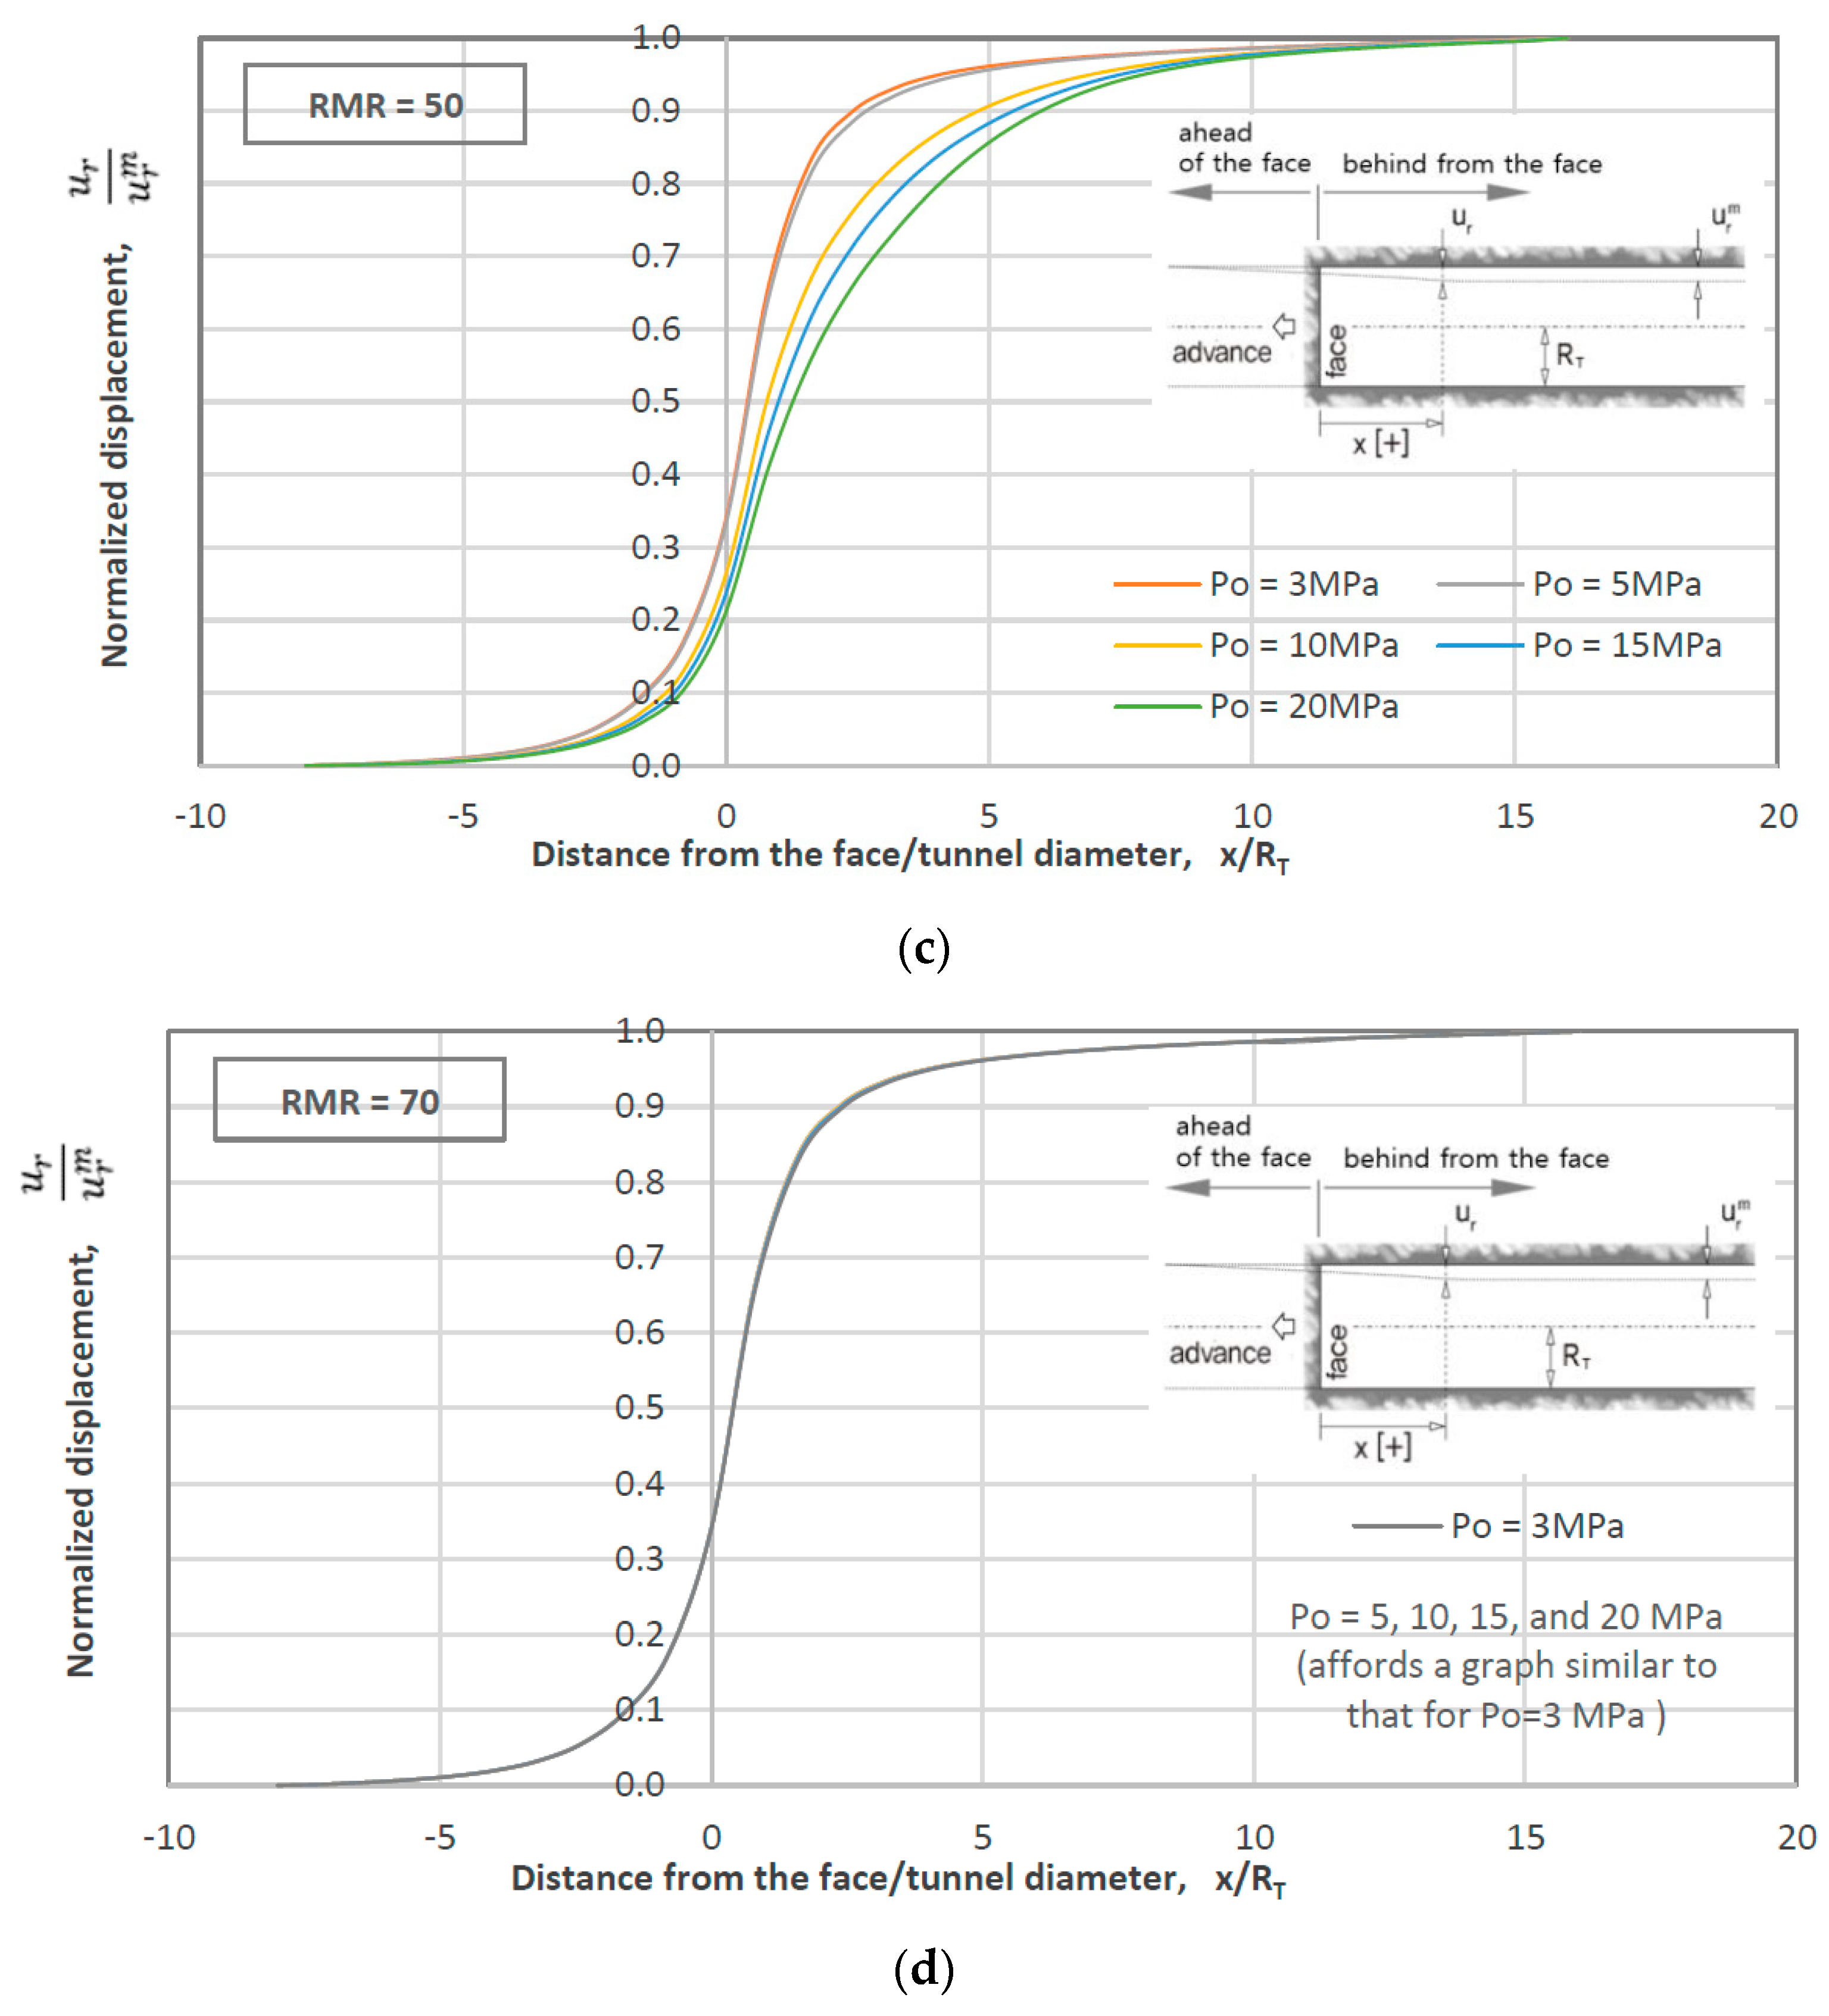
  • The ratio of the preceding displacement was analyzed in the range of 0.1 to 0.35. When the rock quality was poor, the LDP varied according to the initial stress condition. However, for an RMR of 70 or more, the LDP remained the same regardless of the initial stress conditions. These results are considered to be related to the plastic area formed according to the quality of the rock.

Author Contributions

S.-g.H. developed the research concept and wrote the paper. A.M.N. performed the numerical analyses. H.R. conducted an analysis and consultation of the rock conditions for numerical analysis. K.-m.N. and H.-e.K. performed statistical analyses on the results of the numerical analysis. J.-w.P. reviewed the final paper. H.-k.Y. supervised the research and provided important suggestions and recommendations for paper revision. All authors have read and agreed to the published version of the manuscript.

Funding

This work was supported by the Korea Agency for Infrastructure Technology Advancement (KAIA) grant funded by the Ministry of Land, Infrastructure and Transport (“Research of Advanced Technology for Construction and Operation of Underground Transportation Infrastructure” (Grant 21UUTI-B157787-02)).

Institutional Review Board Statement

Not applicable.

Informed Consent Statement

Not applicable.

Data Availability Statement

Not applicable.

Conflicts of Interest

The authors declare no conflict of interest.

Appendix A. A List of Nomenclature for Symbols

SymbolDescription
x distance from the face
u r 0 radial displacement at a location separated by distance from the back of the tunnel face
p i initial state of support pressure
σ 0 initial state of wall pressure
u r radial displacement at a distance x from the tunnel face
p i cr critical state of support pressure
p s uniform pressure
p s D final loaded pressure
p s max maximum pressure
u r m maximum radial displacement
R T tunnel radius
U a   and   U b normalized radial displacement
A a ,   B a ,   A b   and   B b statistical constants dependent on Poisson’s ratio
R P maximum plastic radius
α   and   β parameters related to rack mass conditions, consist of RMR and p0 function

References

  1. Carranza-Torres, C.; Fairhurst, C. Application of the Convergence-Confinement Method of Tunnel Design to Rock Masses That Satisfy the Hoek-Brown Failure Criterion. Tunn. Undergr. Space Technol. 2000, 15, 187–213. [Google Scholar] [CrossRef]
  2. Panet, M.; Givet, P.D.; Guilloux, A.; Duc, J.L.; Piraud, J.; Wong, H.T. The Convergence-Confinement Method; Press ENPC, 2001; Available online: https://tunnel.ita-aites.org/media/k2/attachments/public/Convergence-confinement%20AFTES.pdf (accessed on 10 June 2021).
  3. Vlachopoulos, N.; Diederichs, M.S. Improved Longitudinal Displacement Profiles for Convergence Confinement Analysis of Deep Tunnels. Rock Mech. Rock Eng. 2009, 42, 131–146. [Google Scholar] [CrossRef]
  4. Panet, M.; Guenot, A. Analysis of convergence behind the face of a tunnel: Tunnelling 82. In Proceedings of the 3rd International Symposium, Brighton, UK, 7–11 June 1982; pp. 197–204. [Google Scholar]
  5. Hoek, E. Tunnel Support in Weak Rock. In Proceedings of the Keynote Address, Symposium of Sedimentary Rock Engineering, Taipei, Taiwan, 20–22 November 1998. [Google Scholar]
  6. Alejano, L.R.; Rodríguez-Dono, A.; Veiga, M. Plastic Radii and Longitudinal Deformation Profiles of Tunnels Excavated in Strain-Softening Rock Masses. Tunn. Undergr. Space Technol. 2012, 30, 169–182. [Google Scholar] [CrossRef]
  7. Rooh, A.; Hamid, R.N.; Kamran, G. A New Formulation for Calculation of Longitudinal Displacement Profile (LDP) on the Basis of Rock Mass Quality. Geomech. Eng. 2018, 16, 539–545. [Google Scholar]
  8. Hoek, E.; Carranza-Torres, C.; Fairhurst, C.; (Duluth Campus, University of Minnesota, Minneapolis, MN, USA). Personal communication, 1999.
  9. Chern, J.C.; Shiao, F.Y.; Yu, C.W. An Empirical Safety Criterion for Tunnel Construction. In Proceedings of the Regional Symposium on Sedimentary Rock Engineering, Taipei, Taiwan, 20–22 November 1998. [Google Scholar]
  10. Corbetta, F.; Bernaud, D.; Nguyen, M.D. Contribution à la méthode convergence-confinement par le principe de la similitude. Rev. Fr. Geotech. 1991, 54, 5–11. [Google Scholar] [CrossRef] [Green Version]
  11. Panet, M. Calcul des Tunnels par la Methode de Convergence-Confinement; Presses de l’Ecole Nationale des Ponts et Chausse’es: Paris, France, 1995. [Google Scholar]
  12. Unlu, T.; Gercek, H. Effect of Poisson’s Ratio on the Normalized Radial Displacements Occurring Around the Face of a Circular Tunnel. Tunn. Undergr. Space Technol. 2003, 18, 547–553. [Google Scholar] [CrossRef]
  13. Rehman, H.; Ali, W.; Naji, A.; Kim, J.-J.; Abdullah, R.; Yoo, H.-K. Review of rock-mass rating and tunnelling quality index systems for tunnel design: Development, refinement, application and limitation. Appl. Sci. 2018, 8, 1250. [Google Scholar] [CrossRef] [Green Version]
  14. Bieniawski, Z. Engineering classification of jointed rock masses. Civil Eng. S. Afr. 1973, 15, 333–343. [Google Scholar]
  15. Bieniawski, Z.T. Engineering Rock Mass Classifications: A Complete Manual for Engineers and Geologists in Mining. In Civil and Petroleum Engineering; JohnWiley & Sons: Hoboken, NJ, USA, 1989. [Google Scholar]
  16. Celada, B.; Tardáguila, I.; Varona, P.; Rodríguez, A.; Bieniawski, Z. Innovating Tunnel Design by an Improved Experience-Based RMR System. In Proceedings of the World Tunnel Congress, Foz do Iguaçu, Brazil, 9–15 May 2014; p. 9. [Google Scholar]
  17. Rehman, H.; Naji, A.M.; Kim, J.-J.; Yoo, H. Extension of tunneling quality index and rock mass rating systems for tunnel support design through back calculations in highly stressed jointed rock mass: An empirical approach based on tunneling data from himalaya. Tunn. Undergr. Space Technol. 2019, 85, 29–42. [Google Scholar] [CrossRef]
Figure 1. Schematic of the longitudinal deformation profile (LDP), ground reaction curve (GRC), and support characteristic curve (SCC) [1].
Applsci 11 05405 g001
Figure 2. LDP and cross-section for tunnel excavation.
Applsci 11 05405 g002
Figure 3. u r / u r m profiles derived from elastic models [11], measurements in a tunnel [9], and best-fit measurements [1,8].
Applsci 11 05405 g003
Figure 4. Statistical LDP models used for the normalized radial displacements occurring around the face [12].
Applsci 11 05405 g004
Figure 5. Numerical model for calculating the LDP.
Applsci 11 05405 g005
Figure 6. Construction site referenced for the properties of material: (a) location map; and (b) geological structure of the study area.
Applsci 11 05405 g006
Figure 7. LDP results from 3D numerical analysis: (a) P 0 = 3 MPa; (b) P 0 = 5 MPa; (c) P 0 = 10 MPa; (d) P 0 = 15 MPa; and (e) P 0 = 20 MPa.
Applsci 11 05405 g007aApplsci 11 05405 g007b
Figure 8. Variation of LDP with initial stress conditions: (a) RMR = 10; (b) RMR = 30; (c) RMR = 50; and (d) RMR = 70.
Applsci 11 05405 g008aApplsci 11 05405 g008b
Figure 9. Regression analysis results for parameters (a) α and (b) β.
Applsci 11 05405 g009
Table 1. Numerical modeling data for evaluating the LDP under different rock mass qualities and initial stress conditions.
RMRVIVIIIIII
Input Data 5101530507090
Rock mass property
Elastic modulus, E (MPa)501005001500500014,00020,000
Cohesion, c (kPa)80100150500100030005000
Internal friction angle Φ (°)30303033354045
Initial stress, P 0 (MPa)
P 0 = 3 MPaA-1B-1C-1D-1E-1F-1G-1
P 0 = 5 MPaA-2B-2C-2D-2E-2F-2G-2
P 0 = 10 MPaA-3B-3C-3D-3E-3F-3G-3
P 0 = 15 MPaA-4B-4C-4D-4E-4F-4G-4
P 0 = 20 MPaA-5B-5C-5D-5E-5F-5G-5
Table 2. Regression analysis results for α and β.
P 0 = 3 MPaA-1B-1C-1D-1E-1F-1G-1
α1.941.891.811.330.910.900.90
β2.822.722.511.691.371.361.36
P 0 = 5 MPaA-2B-2C-2D-2E-2F-2G-2
α2.051.991.881.510.960.900.90
β2.852.852.731.831.411.361.36
P 0 = 10 MPaA-3B-3C-3D-3E-3F-3G-3
α2.182.162.031.841.430.900.90
β2.702.782.862.181.741.361.36
P 0 = 15 MPaA-4B-4C-4D-4E-4F-4G-4
α2.292.202.151.901.600.910.90
β2.702.682.792.431.871.361.36
P 0 = 20 MPaA-5B-5C-5D-5E-5F-5G-5
α2.422.312.001.951.800.920.90
β2.742.702.652.622.011.371.36
Publisher’s Note: MDPI stays neutral with regard to jurisdictional claims in published maps and institutional affiliations.

