Article

A Preliminary Study on the Use of Xylit as Filter Material for Domestic Wastewater Treatment

Department of Hydraulic and Sanitary Engineering, Poznan University of Life Sciences, Piątkowska 94A, 60-649 Poznań, Poland
*
Author to whom correspondence should be addressed.
Co-author Tadeusz Nawrot passed away before publication.
Appl. Sci. 2021, 11(11), 5281; https://doi.org/10.3390/app11115281
Submission received: 29 April 2021 / Revised: 24 May 2021 / Accepted: 31 May 2021 / Published: 7 June 2021
(This article belongs to the Special Issue Wastewater Treatment and Waste Remediation: Recent Advances)

Abstract

:

Featured Application

The study indicated xylit as a material highly effective in wastewater quality indicators removal. The material is suitable for simple construction (low cost) on-site wastewater trickling filters.

Abstract

The aim of the study was to verify two morphological forms (“angel hair” and “scraps”) of xylit as a trickling filter material. The study was carried out on two types of polluted media: septic tank effluent (STE) and seminatural greywater (GW). The basic wastewater quality indicators, namely, chemical oxygen demand (COD), biochemical oxygen demand (BOD5), total suspended solids (TSS), ammonium nitrogen (NNH4), and total phosphorus (Ptot) were used as the indicators of treatment efficiency. Filtering columns filled with the investigated material acted as conventional trickling filters at a hydraulic load of 376–472 cm3/d during the preliminary stage, 198–245 cm3/d during stage I, and 184–223 cm3/d during stage II. The removal efficiency of the two morphological forms of xylit did not differ significantly. The average efficiencies of treatment were as follows: for COD, over 70, 80, and 85% for preliminary stage, stage I and stage II, respectively; for BOD5, 77–79% (preliminary stage); for TSS, 42% and 70% during the preliminary stage, and 88, 91, and 65% during stage I; for NNH4, 97–99% for stage I and 36–49% for stage II; for Ptot, 51–54% for stage I and 52–56% for stage II. The study demonstrated that xylit was a material highly effective in wastewater quality indicators removal, even during the initial period of its use.

1. Introduction

Individual wastewater systems are common in many regions of Europe and some parts of the world (USA), due to lack of economic justification or sewerage systems; its building needs will develop.
Septic tanks are in general devices used for preliminary wastewater treatment; however, they are prone to periodically increased concentrations of suspended solids in effluent, which may accelerate clogging processes. Clogging, it should be noted, can occur even after a few years [1].
In view of the disadvantages of septic tanks and aiming to prevent outflow from small wastewater treatment facilities from instability and exceeding recommended or required limits, there is a need to look for systems of better treatment, including nutrients, which can ensure longer life of existing soil infiltration systems. Some interesting and promising solutions are referred to in the literature. They utilise, e.g., a geotextile fabric filter [2], a modified up-flow septic tank, followed by an anaerobic baffled reactor [3] and a gradual chamber using a gravel bed as an effluent filter [4].
The authors are therefore of the opinion that there is a need to look for trickling filter filling materials that are cheap, highly effective in removing contaminants, and where possible, ones that have a low (negative) impact on the environment (carbon footprint). Such systems should be as cheap and simple as possible, especially in less developed or developing countries. The traditional trickling filter technology preceded by a septic tank or preliminary settler still seems to be a promising solution because of its simplicity and resistance to load and hydraulic overloading. In contrast, plastic carriers being used for trickling filter filling are relatively expensive and are often associated with negative side effects on the environment during their production, such as energy consumption and carbon footprint.
Xylit (usually referred to as xyloid lignite) is a waste material (by-product) obtained from the mining of lignite (brown coal). Xylit is a type of lignite, sometimes referred to as fossil wood. The use of the term is justifiable because xylit frequently has an appearance similar to wood; some properties (and visual or physical features) of “wood” are altered [5].
The structure of carbonised wood fibres can be observed in this material of density around 400 kg/m³. It is not used as fuel for heat generation due to very low heat content (even in a dried state) and due to the obstruction of the technological process of construction ceramics production [6].
Xylit is not well recognised as a filtering material for wastewater or greywater treatment and only a few studies have been carried out on this usage [5,7]; however, it is used as a biocarrier in some decentralised wastewater systems [8]. One of the most detailed research was conducted by Zhang [9]. This author highlighted several interesting and important features of xylit that can prove useful in polluted water treatment, such as (1) particle size of 20 mm, (2) solvent-accessible area (surface area approx. 2.5 m2/g), (3) pore volume of 0.01 cm3/g, (4) average pore size of about 16–17 nm, (5) overall negatively charged surfaces and molecular weight, and (6) positively correlated removal of micro-pollutants by xylit (with both apolar and polar surface area ratio, and pH value favouring bacteria growth). These all can be considered as features also useful for dissolved organic compound removal. For the purposes of the research experiment, xylit was crushed and sieved to obtain the relevant particle size of 2–4 mm [10].
Xylit proved to be a highly effective DOC removal material, it removed 52% DOC during the screening experiment and 89% DOC in the long-term experiment [9]. In that study, only granular activated carbon was better in DOC removal efficiency (average removal efficiency above 95%).
Xyloid lignite (xylit) was examined in a column experiment involving the removal of 31 selected organic micropollutants and phosphorus using several sorbents over a period of 12 weeks, and the average removal of this material was 80 ± 28% [7]. This material proved to be less effective in removing micropollutants, as compared to GAC in the long-term column experiment; however, it demonstrated a higher removal efficiency of MPS than lignite and sand [9]. Despite a smaller surface area, xylit revealed higher removal efficiency than lignite.
Chemically, xylit consists mainly of carbon and oxygen, therefore is not efficient in phosphorus removal by precipitation, as shown by [9]; in his study, Ptot was poorly removed by xylit with an efficiency of 14–22%. The role of adsorption or biological processes (biofilm development) in phosphorus removal with the use of xylit was considered in the study by Zhang et al. [7].
Zhang et al. [11] observed that the hydrophobic effect played an important role in the removal of micropollutants. Vargas et al. [12] noted that the presence of surface functional groups and the surface charge affect the adsorption capacity and the micropollutant removal mechanism.
Lifespan (life cycle) has not been described in the literature. The potential reuse or transformation can be through its processing to compost or its reuse after heating it to a temperature around 300 °C with the aim of immobilising the adsorbed organic compounds.
Despite some disadvantages, such as difficulties in uniform liquid sprinkling, the advantage of xylit is the ease of its processing.

2. Materials and Methods

2.1. Laboratory Setup (Model) and Experiment Conditions

The experimental set was located in the laboratory of the Department of Hydraulic and Sanitary Engineering, Poznań University of Life sciences. The study was carried out at a temperature close to room temperature (17–27 °C) from 7 May 2019 until 10 July 2020.

2.2. Description of the Model and Its Operation

The research model consisted of filtration columns (tubes) which were 100 cm long and had an internal diameter of 4.4 cm, made of organic glass (Figure 1). The depth of filling with the filtering material was 80 cm.
During the preliminary stage, the study was conducted on two columns (one column with ‘angel hair’ type material and the second column—with ‘scraps’ (material crushed into particles of several centimeters) for septic tank effluent (Figure 2).
During the first stage (I), the study was carried out on three columns (two columns with angel hair (AH) type material and one column with scraps (SCR) for septic tank effluent treatment. The significant difference between the preliminary phase and first stage (apart from the number of filtering columns) was the manner of inlet sample collection. In the first stage, the inlet wastewater (septic tank effluent) was dosed from the retention tank for all columns assuming the same concentration of pollutants. However, a few control samples showed that the concentrations at the inlets to the tubes were not exactly the same. This phenomenon could be caused by the different wastewater volumes that remained inside the pumps and dosing tubes. The mixing of the content of the retention tank was not a consideration since it could change the pollutant concentration in the direct vicinity of dosing (suction) tubes. The endings of tubes were immersed at the middle of the retention tank bottom as a bunch.
Therefore, during the I and II stages, the inlet STE and greywater were collected separately for every filtration column.
During the second stage (II), two filters filled with ‘angel hair’ were used for greywater treatment.

2.3. Research Layout

The study was conducted in three stages:
  • Preliminary stage: septic tank effluent treatment and inlet media collection as a mixture; period: 7/16 May 2019–2/9 July 2020; measured indicators: TSS, COD, BOD5; assumed hydraulic load: about 380–470 cm3/d; this stage was planned as a startup period. Its additional goal was to determine the biodegradability of wastewater pre-treated in a septic tank, which is subject to unfavourable processes that often take place in practice, such as extended retention time and/or increased temperature;
  • Stage I (experiment I): septic tank effluent treatment and inlet media collection separately for every filter column; period: 10 September–8 November 2019; measured indicators: TSS, COD, Ptot, NNH4; assumed hydraulic load: about 200–250 cm3/d;
  • Stage II (experiment II): seminatural greywater (inlet media collecting separately for every filter column); period: 28 May–10 July; measured indicators: COD, Ptot, NNH4; assumed hydraulic load: about 200–250 cm3/d.
It was decided to perform experiment II, using seminatural greywater, since the experiments on greywater treatment by means of biofiltration [13] showed that greywater can be treated biologically, and filters used previously for domestic wastewater (septic tank effluent) treatment can be subsequently used for greywater treatment.

2.4. Treated Media, Their Dosing, and Collection

The septic tank effluent used for the study was obtained from an on-site wastewater treatment plant consisting of a septic tank and soil infiltration system, collecting and treating domestic wastewater generated by a four-person household. The wastewater was collected as a septic tank effluent.
The proportions of components of the seminatural greywater (GW) used in the study were 31%, 62%, and 7% of laundry, bath or shower, and washbasin, respectively. The seminatural greywater comprised 12 dm3 of natural laundry greywater collected from the washing machine effluent after washing 2–5 kg of clothes (Ariel, Procter, and Gamble, Warsaw, Poland) mixed with artificial greywater simulating bath/shower greywater, prepared using: 3.6 g of shampoo (Head & Shoulders, Procter and Gamble, Warsaw, Poland), 5.7 g of shower gel (Colgate-Palmolive, Warsaw, Poland), 0.4 g of liquid soap (Serpol-Cosmetics Ltd., Mieścisko, Poland) and 27 dm3 of tap water. The total water hardness in tap water used was 275 mg CaCO3/dm3.
During the preliminary stage, the filtration columns were fed with septic tank effluent. In this stage, the columns were fed with a volume of about 20 cm3 of wastewater every hour. During stage I, the filtration columns were fed with septic tank effluent; however, they were fed every two hours (with a volume of about 20 cm3).
After collection, the STE was transported to the laboratory and stored in a chamber of 20 dm3 at room temperature for a few days (up to 7 days). This suggests that thanks to the extended retention time and increased temperature, there occur processes that often take place in practice (high-temperature periods, vacation users’ absence).
During stage II, the filtration columns were fed with GW with a volume of about 20 cm3, every two hours. The raw GW was prepared twice a week. The collection and measurements of wastewater quality indicators in raw GW were carried out no later than one day after supplying the retention chamber with a new dose of a new portion of media; hence, the retention time of media was about 24 h. The dosing schedule for raw and treated GW sample collection was as follows: 7:00, 9:00, 11:00, and 13:00, for the dosing of GW into the filters and 8:00, 10:00, 12:00, and 14:00, for the dosing of GW into the beakers.
The assumed hydraulic load during the preliminary stage was about 30–40 cm·d−1 (20–25 cm3 every hour per 15.2 cm2 of inner filtering column surface area), and during stages I and II, about 15–20 cm·d−1 (20–25 cm3 every 2 h).
These filtering columns were fed with STE and GW using pumps controlled by a programmable timer.
Xylit (xyloid lignite) used in this study comprised carbonised wood fibres derived from lignite. The raw lignite blocks were crushed to 10–30 mm pieces (‘scraps’) and raw lignite ‘angel hair’ was crushed to 20–40 mm pieces before being used as a filter material in the experiment.
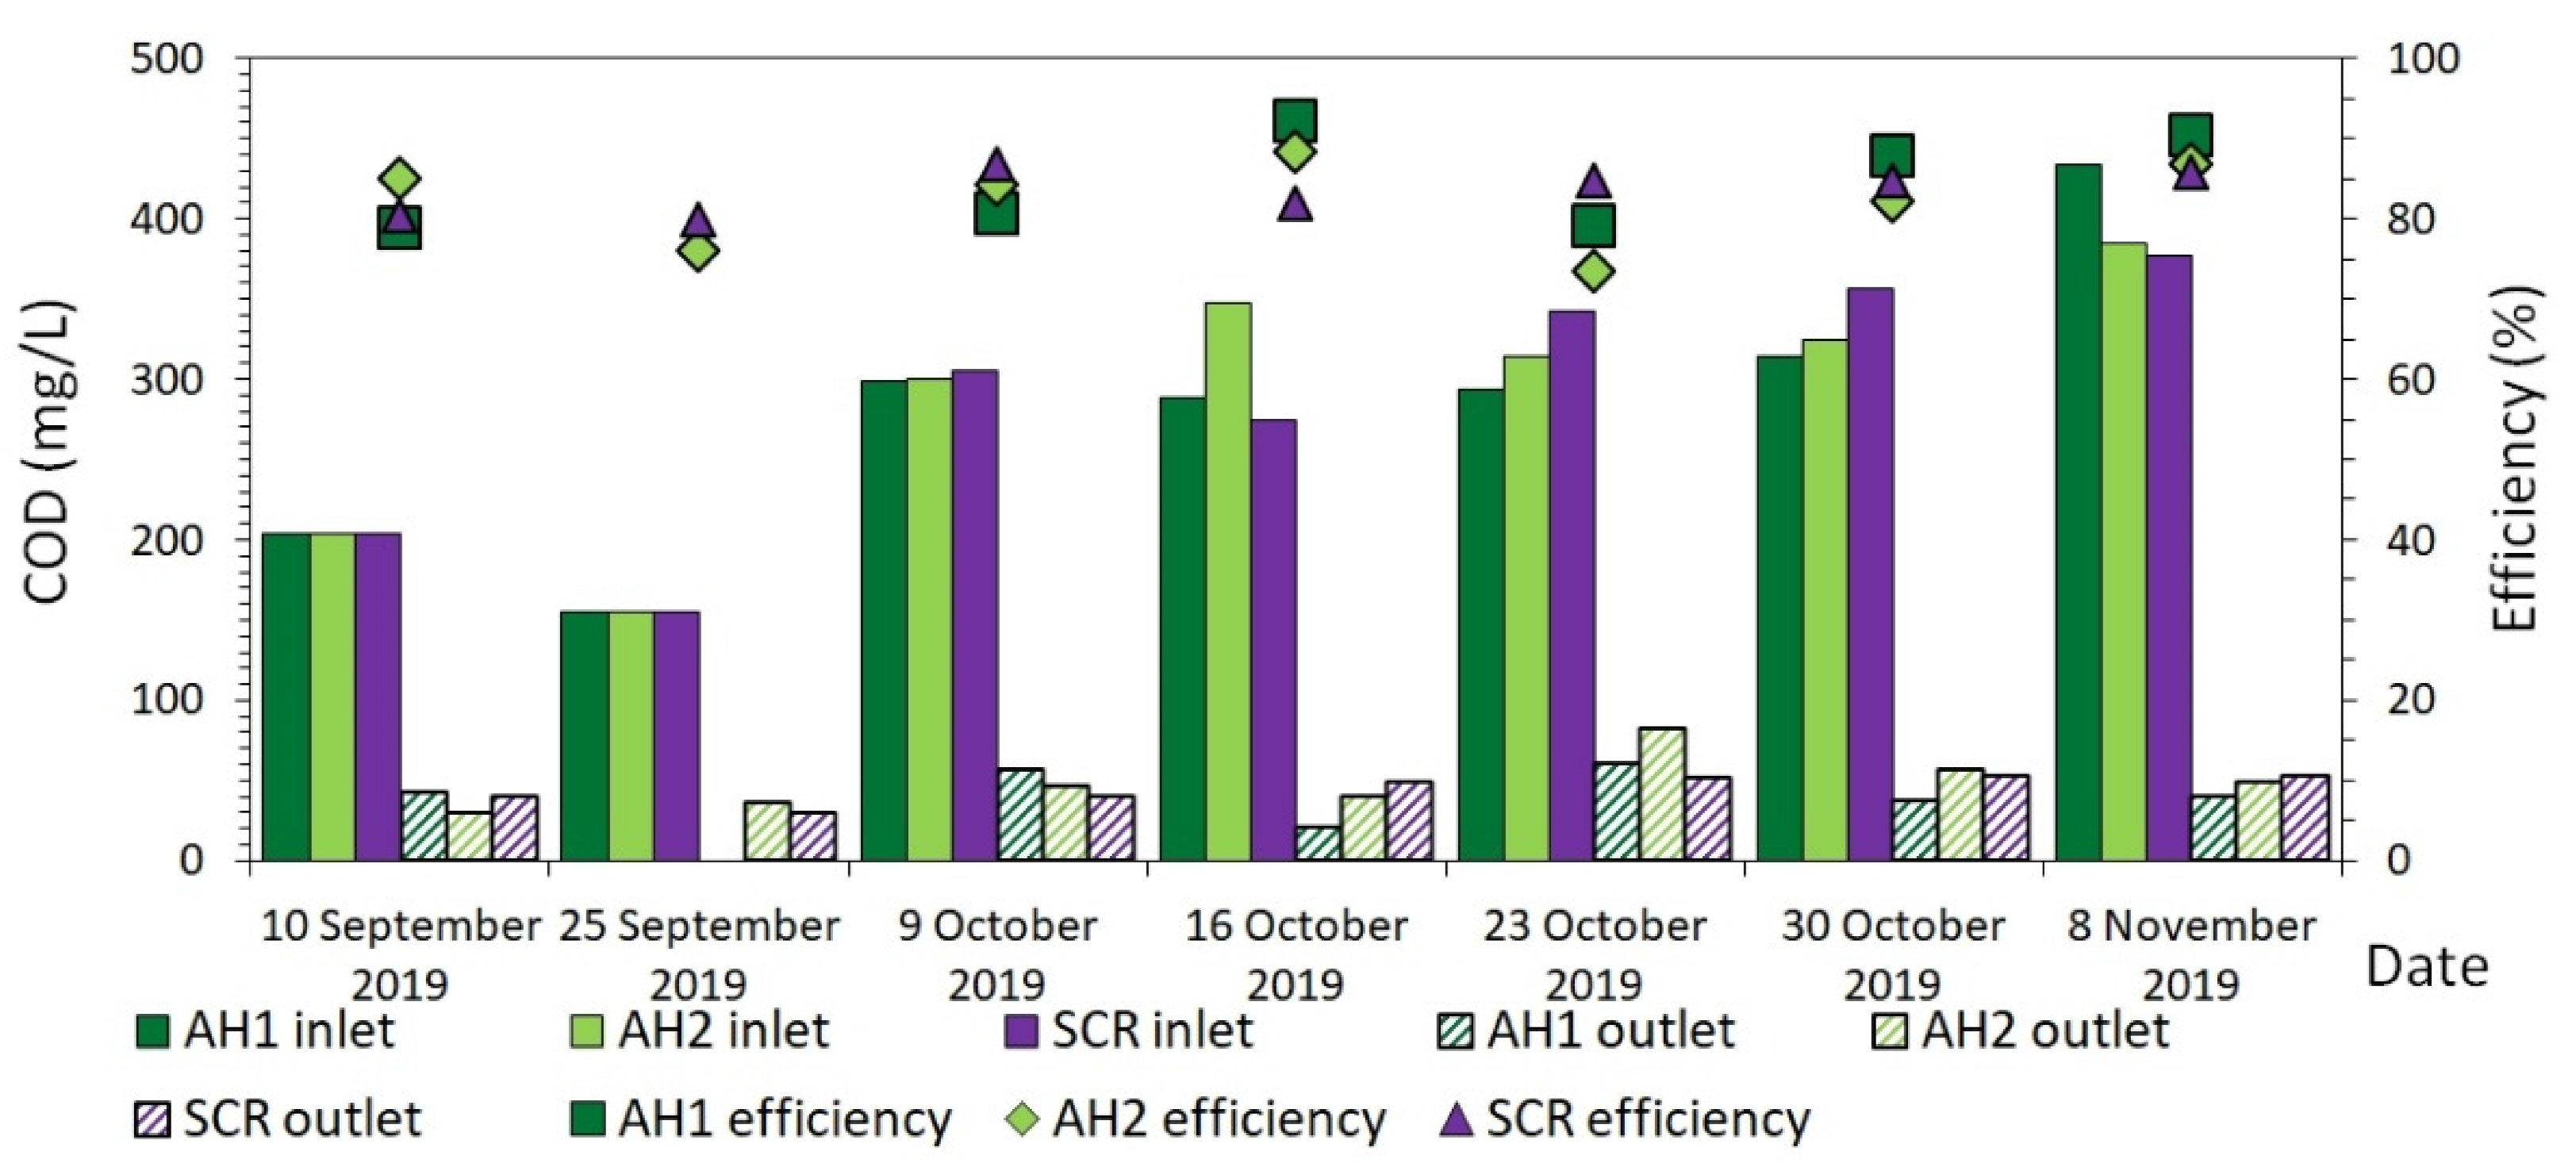
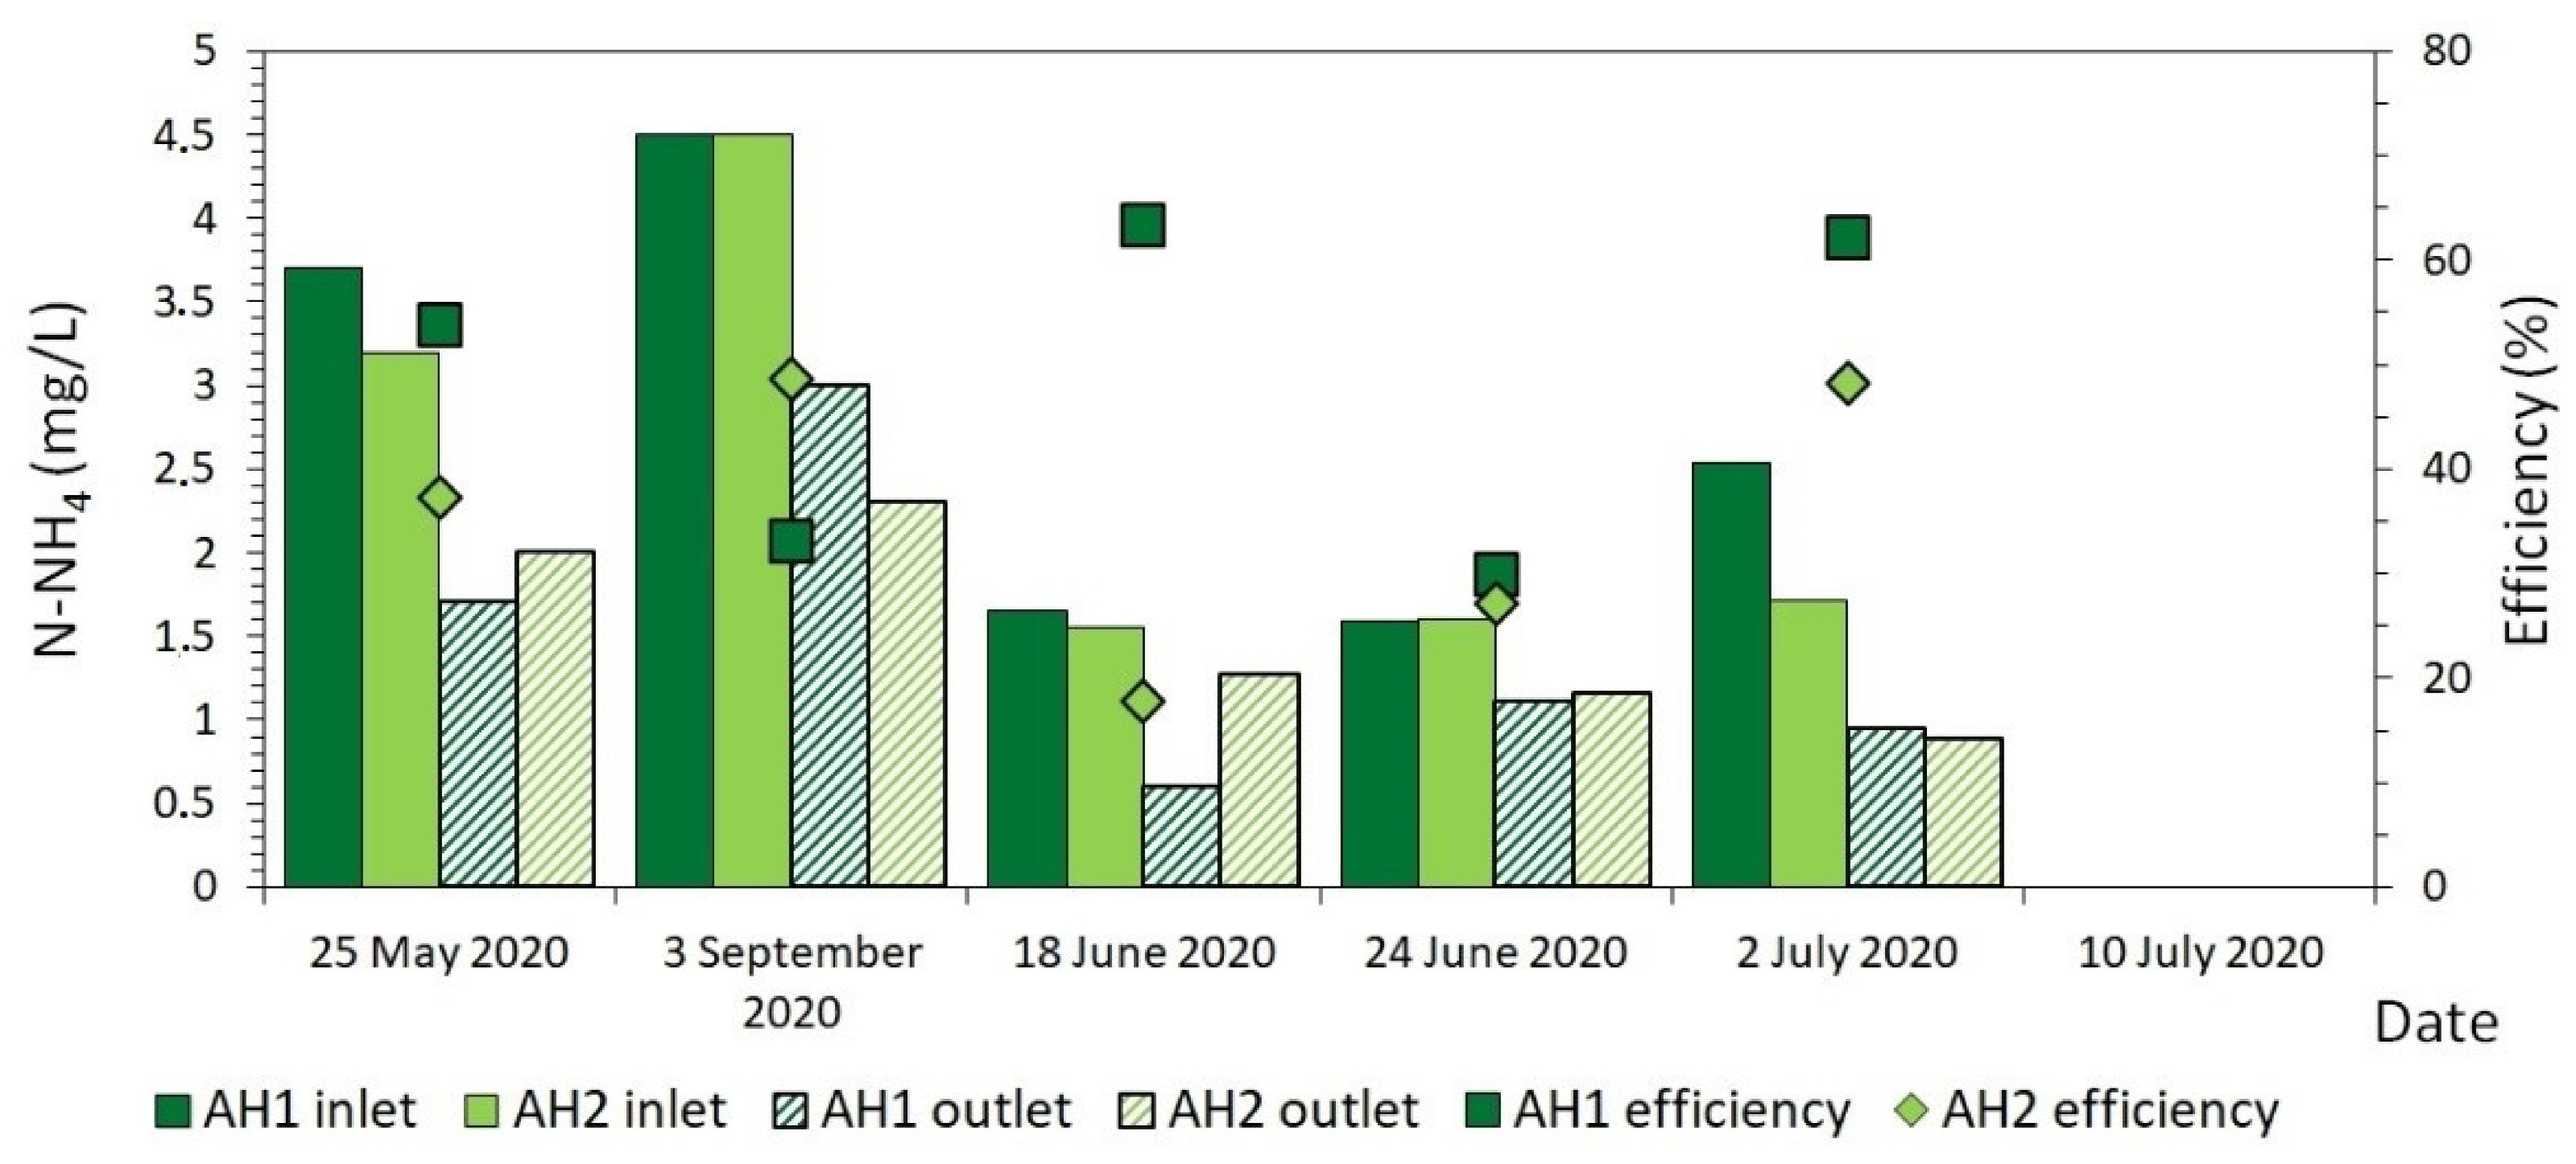
During the study (usually on a weekly basis, with a few deviations, such as holidays, a holiday break) measurements of hydraulic capacity (outflow rate) and qualitative analyzes of inflow and outflow media (STE or GW) were carried out in terms of total suspended solids (TSS), five-day biochemical oxygen demand (BOD5), chemical oxygen demand (COD), ammonium nitrogen (NNH4) and total phosphorus (Ptot). Outflows were measured twice or three times a week.

2.5. Measurements of the Wastewater Quality Indicators

The samples of inlet and outlet wastewater (seminatural greywater or septic tank effluent) were collected and analysed usually once a week. The following parameters were analysed: chemical oxygen demand (COD), determined by using the bichromate method (the oxidation of organic compounds using chromosulfuric acid, determination as chromate) using a Merck Spectroquant® NOVA 60A spectrophotometer; five-day biochemical oxygen demand (BOD5), performed with the use of the respirometric method (Oxitop, WTW), (ammonium nitrogen (N-NH4, the indophenol method) and total phosphorus (Ptot), analysed using a Merck Spectroquant® NOVA 60A spectrophotometer; total suspended solids (TSS) using the dry weight method with filtration through paper filters. The detection of the total phosphorus and ammonium nitrogen (NNH4) concentrations was performed using spectrophotometer (Merck,Darmstadt, Germany) kits (Spectroquant kits Nos. 14752 and 14773, respectively). Determination of wastewater quality indicators, defined as dissolved organic and nutrient compounds (COD, BOD5, NNH4, Ptot, TSS) was performed for samples filtered through paper filters of 2.5 µm pore size. The values of the wastewater quality indicators were determined in accordance with the standards (for COD: PN-ISO 6060 [14], for Ptot: PN-EN ISO 6878 [15], for TSS: PN-EN 872 [16]).
The pH value is not limited in Poland for on-site wastewater treatment plants treating domestic wastewater up to 5.0 m3/d and disposed into the soil being the property of the user. In view of this fact, only a few pH measurements were taken and the average values were 8.29 ± 0.03 and 8.36 ± 0.05 for inflowing and outflowing seminatural greywater, respectively.

2.6. Statistical Analysis

At the beginning of the statistical procedure, it was verified whether the population of values within sets is normally distributed using the Shapiro–Wilk test. Then, a paired sample t-test of the hypothesis for the difference in means was applied [17].
The analysis of paired sample t-test of the difference between means was performed as proposed by Łomnicki [17], with final verification conducted by checking whether the critical value for the significance level 0.025 of the two-sided test was higher or lower than the calculated t statistic.

2.7. Media Properties

Although the inflow wastewater (STE) was taken from the same source for the preliminary stage and stage I, the average inflow wastewater quality indicators in septic tank effluent applied into the filters during the preliminary stage and stage II were fairly different. It was probably caused by a longer time of storage in the laboratory and a higher volume of the sediments filling the septic tank (sludge).
The content of basic wastewater quality indicators in the STE used was typical. The proportion of greywater content (31%, 62%, and 7% of laundry, bath and shower, and washbasin, respectively) was comparable to values reported by other authors [18,19]. The concentrations of wastewater quality indicators in seminatural greywater varied in the range typical for real greywater [20,21,22,23].

3. Results and Discussion

3.1. Outflow Rate

Although the flow rates of pumps were established on approximately the same level, some differences were observed between hydraulic capacities of columns, and there occurred some irregularities in the flow rate of each pump. Some anomalies were related to the plugging of sprinklers, the plugging of pump inlet and outlet tubes, and rinsing after plugging.
The average outflow rates during preliminary stage (7 May–27 July 2020) were as follows: 471.8 ± 49.6 cm3/d (n = 21) for column filled with AH, and 375.8 ± 38.8 cm3/d (n = 21) for column filled with SCR. The average outflow rates during stage I (10 September–8 November) were as follows: 244.9 ± 12.9 cm3/d (n = 11), 242.4 ± 15.2 cm3/d (n = 11), and 197.8 ± 9.6 cm3/d (n = 11) for AH1, AH2, and SCR, respectively. The average outflow rates during stage II (28 May–10 July 2020) were 183.9 ± 5.1 cm3/d (n = 14) for AH1 and 223.2 ± 8.2 cm3/d (n = 14) for AH2.
During the study, the effect of hydraulic load on wastewater quality indicators removal efficiency was not analysed; however, the hydraulic load was selected so that under technical conditions, it would be possible for four users (total outflow about 0.4 m3/d) to use a trickling filter of a surface area not exceeding a few square meters in top view (2–3 m2). A given reactor therefore would need to be as compact as possible to be installed in a room, e.g., in a basement (in this case two filter sections of 1 m2 would have to be placed under each other). The used hydraulic load of filters was relatively low, compared to conventional wastewater trickling filters, but quite substantial, compared to sand or gravel filter beds. The increase in the hydraulic load would be possible and effective with respect to the removal efficiency of wastewater quality indicators in the conditions of uniform distribution of wastewater on the filter surface (inner cross section of the column).

3.2. Efficiency of Wastewater Quality Indicators Removal

3.2.1. Chemical Oxygen Demand

The average value of inflow COD at preliminary stage was 717.8 ± 113.0 mg/L (n = 9). In experiment I: 284.1 ± 33.4 mg/L (n = 7), 290.0 ± 30.8 mg/L (n = 7), and 287.7 ± 31.2 mg/L (n = 7) for AH1, AH2, and SCR, respectively. In experiment II, average inflow values for COD were as follows: 537.2 ± 47.9 mg/L (n = 6) and 548.0 ± 46.3 mg/L (n = 6) for AH1 and AH2, respectively. The inflow COD values are presented in Table 1, Table 2 and Table 3 and Figure 3, Figure 4 and Figure 5.
The average efficiencies of COD removal at preliminary stage were as follows: 71.5 ± 5.0% (n = 9) for angel hair (AH) and 70.8 ± 4.7% (n = 9) for crushed material (SCR). The details related to COD removal efficiencies at preliminary stage are presented in Table 1 and Figure 3.
In experiment I, the average efficiencies of COD removal were as follows: 85.0 ± 2.5% (n = 6), 82.5 ± 2.1% (n = 7), and 83.6 ± 1.0% (n = 7), for AH1, AH2, and SCR, respectively. COD removal efficiencies at stage I are presented in Table 2 and Figure 4.
The average efficiencies of COD removal at stage II were as follows: 86.3 ± 2.7% (n = 6) for AH1 and 87.5 ± 1.6% (n = 6) for AH2. The details related to COD removal efficiencies at stage II are presented in Table 3 and Figure 5.
The removal efficiencies of organic compounds expressed as COD were relatively high during all stages of the study (above 70% at the preliminary stage and above 80% at stages I and II). Similar results (especially compared to stages I and II), although for a different but indirectly related indicator—total organic carbon (TOC), obtained by Zhang et al. [7]—was about 89%. In contrast, Zhang et al. [11] obtained for this material much lower TOC removal efficiency, only about 70%.
Higher efficiencies at stages I and II (comparing to the preliminary stage) resulted from a lower hydraulic load and a more even distribution of wastewater on the filter surface (periodic cleaning of sprinklers).

3.2.2. Biochemical Oxygen Demand

According to the preliminary experiment result, it was found that septic tank effluent used in the experiment is relatively low in susceptibility to bio-decomposition, and therefore, the main experiment can be carried out. The COD/BOD5 ratio was 2.9 ± 0.2 and was comparable to ratios referred by Jóźwiakowski [24], i.e., 2.6–3.1 for septic tank effluent collected at conditions of long retention time (7–11 days).
The average value of BOD5 inflow at the preliminary stage was 311.1 ± 87.5 mg/L (n = 9). One record (measurement) was excluded from the analysis set as a gross error (enormous inlet value). During stages I and II, the BOD5 was determined occasionally with the aim to verify the COD/BOD5 ratio, indicated during the preliminary experiment. The BOD5 measurements during stages I and II were less accurate (compared to the preliminary experiment) due to the small sample volumes.

3.2.3. Total Phosphorus Removal

The average values of inflow Ptot at stage I were as follows: 23.5 ± 1.7 mg/L (n = 7), 22.6 ± 1.3 mg/L (n = 7), and 23.0 ± 1.4 mg/L (n = 7) for AH1, AH2, and SCR, respectively. At stage II, Ptot average inlet values were as follows: 6.9 ± 0.7 mg/L (n = 6) and 7.0 ± 0.7 mg/L (n = 6) for AH1 and AH2, respectively. The inflow Ptot concentrations are presented in Table 4 and Table 5 and Figure 6 and Figure 7.
In experiment I, the average efficiencies of Ptot removal were as follows: 51.9 ± 3.0% (n = 6), 50.6 ± 2.4% (n = 7), and 53.9 ± 2.3% (n = 7), for AH1, AH2, and SCR, respectively. Ptot removal efficiencies at stage I are presented in Table 4 and Figure 6.
In experiment II, the average efficiencies of Ptot removal were as follows: 52.2 ± 5.7% (n = 6) and 56.2 ± 3.6% (n = 6), for AH1 and AH2, respectively. Ptot removal efficiencies at stage II were presented in Figure 7. Total phosphorus removal efficiencies obtained in this study were slightly higher than in studies made by Zhang et al. [11]—about 46%.
Total phosphorus removal efficiencies of both types of material (angel hair and scraps) were very similar at both stages I and II. The obtained efficiencies are rather typical for single-stage trickling filters.

3.2.4. Ammonium Nitrogen

The average values of inflow NNH4 at stage I were as follows: 100.1 ± 11.3 mg/L (n = 7), 93.5 ± 7.6 mg/L (n = 7), and 92.5 ± 8.9 mg/L (n = 7) for AH1, AH2, and SCR, respectively. In stage II, Ptot average inlet values were as follows: 2.8 ± 0.6 mg/L (n = 5) and 2.5 ± 0.6 mg/L (n = 5) for AH1 and AH2, respectively. One record (the last one) was rejected as a rough error (inflow concentrations: 0.13 mg/L for both columns and outflow concentrations: 1.37 mg/L and 1.35 mg/L for AH1 and AH2, respectively). The inflow NNH4 concentrations are presented in Table 6 and Table 7 Figure 8 and Figure 9.
In experiment I, the average efficiencies of NNH4 removal were as follows: 98.5 ± 0.13% (n = 6), 96.6 ± 1.7% (n = 7), and 97.1 ± 1.1% (n = 7), for AH1, AH2, and SCR, respectively. NNH4 removal efficiencies at stage I are presented in Table 6 and Figure 8.
In experiment II, the average efficiencies of NNH4 removal were as follows: 48.7 ± 7.1% (n = 5) and 36.1 ± 6.0% (n = 5), for AH1 and AH2, respectively. NNH4 removal efficiencies at stage II are presented in Table 7 and Figure 9.
Ammonium nitrogen removal efficiency was very high during experiment I and almost equal (taking into account average values) for both types of filling. Very high efficiency of ammonium nitrogen removal resulted from good oxygenation (due to natural ventilation) of the filter bed (a low hydraulic load of wastewater, relatively free air supply to both the surface zone and the bottom of filters). The results obtained in experiment I were comparable to results obtained by Zhang et al. [11] for sorbents (including xylit) with a pH between 7 and 9—about 87%.
During experiment II, ammonium nitrogen removal efficiency was much lower, as compared to experiment I. It could result from very low inflow concentrations (greywater) and some minimum demand for nitrogen incorporated into bacterial cell biomass.

3.2.5. Total Suspended Solids

The average values of inflow TSS at preliminary stage and stage I were as follows: 387.6 ± 73.5 mg/L (n = 9) and 107.3 ± 19.7 mg/L (n = 4), respectively (Table 8 and Table 9).
The average efficiencies of TSS removal at the preliminary stage were 42.1 ± 6.2% (n = 9) for angel hair (AH), and 70.2 ± 8.1% (n = 8, excluding the measurement of 2 July 2019, as a rough measurement error) for crushed material (SCR). The details related to TSS removal efficiencies at this stage are presented in Figure 10.
The average efficiencies of TSS removal efficiency at stage I were highly variable (14.0%–93.7%). The average TSS removal efficiencies were also differentiated—on average for AH1, was 51.8 ± 21.6% (n = 3), for AH, 91.5 ± 1.4% (n = 3), and for SCR, 77.4 ± 5.7% (n = 4). The details related to TSS removal efficiencies at stage I are presented in Figure 11.
During the preliminary experiment, some anomalies related to inlet TSS concentrations were observed. Although no flow-rate-related problems were identified, these phenomena could be the result of dosing tubes clogging by suspended solids or other unknown phenomena. During stages I and II, the dosing tubes were controlled (and shaken) to prevent clogging.
The average efficiencies of total suspended solid removal were not identified at stage II, and it was concluded from the preliminary stage and stage I that this indicator concentration is highly changeable due to the potential excess biomass detachment. Some amounts of suspended solids in the filter effluent are rather unavoidable due to the activity, growth, and detachment of some of the excessive biomass inhabiting the filter. The increase in concentration and increased instability of total suspended solids in the effluent may also have been influenced by the development of Psychoda flies, which were observed periodically.
The overall TSS removal efficiencies were significantly higher during stage I, as compared to the preliminary stage. The following factors can be indicated as the main reasons for the variable and quite low efficiency of TSS removal at the preliminary stage: non-uniform distribution of wastewater on the surface of the filters and a relatively high hydraulic load.
As only a part of a whole wastewater facility system, i.e., trickling filter (filter columns), was investigated in the experiments, it is worth noting that under technical conditions (as per most types and kinds of conventional trickling filters), it is recommended to use secondary settlers to remove effluent in the form of excessive biomass periodically occurring in the filter (in the form of suspended solids).

3.2.6. Statistical Analysis

No statistically principal differences (95% difference interval) between ‘angel hair’ and ‘scraps’ removal efficiencies of wastewater quality indicators were stated. The inability to confirm the statistical significance for the differences between the means of the paired sample was caused by the relatively high variability of individual values.

4. Conclusions

It should be noted that due to periodic leaching of biomass, it is recommended to use secondary settling tanks for biological deposits.
The use of xylit for domestic wastewater (raw or pre-treated in a septic tank) treatment can be a promising solution taking into account both macro- and micropollutant removal. This material can be packed much more densely than was used in this study, which should increase its efficiency in the removal of wastewater quality indicators. Although the experiment (all stages) lasted 15 months and no xylit material clogging problems were observed, there is a need to verify the clogging process intensity (e.g., under technical conditions).
Based on the results obtained, the following conclusions and recommendations can be proposed:
  • The average efficiencies of COD removal were over 70, 80, and 85% for preliminary stage, stage I, and stage II, respectively;
  • The effectiveness of TSS removal was strongly differentiated in the preliminary stage and stage I: 42% and 70% during the preliminary stage and 88, 91, and 65% during stage I;
  • The efficiency of ammonium nitrogen (NNH4) removal was very high at stage I: 97–99%, but relatively low at stage II: 36–49%;
  • Average total phosphorus removal efficiencies were practically equal at stages I and II: 51–54% and 52–56%, respectively;
  • The removal efficiency of wastewater quality indicators using both types of materials did not differ significantly;
  • The investigated hydraulic load of filters enables their use in filed scale a relatively compact treatment system (less than 1.0 m2 of surface area in plain view) for one homestead (four-person family);
  • The study demonstrated that xylit was a material highly effective in the removal of wastewater quality indicators, even during the initial period of its use (preliminary stage);
  • Using xylit as a trickling filter material it is recommended to take care about uniform distribution of wastewater on the filter surface.
There is a need for further research on xylit material under technical conditions (field scale) to determine basic applicable conditions, e.g., hydraulic and organic load or packing density.

Author Contributions

Conceptualisation, M.S. and R.M.; methodology, M.S. and R.M.; validation M.S. and R.M.; formal analysis, M.S.; investigation, M.S. and R.M.; resources, M.S.; data curation, M.S. and T.N.; writing—original draft preparation, M.S. and T.N.; writing—review and editing, M.S. and R.M.; visualisation, M.S. and T.N; supervision, M.S.; project administration, M.S.; funding acquisition, M.S. and R.M. All authors have read and agreed to the published version of the manuscript.

Funding

This research received external funding: Project No. 005/RID/2018/19 under “Wielkopolska Regional Initiative of Excellence in the area of life sciences of the Poznań University of Life Sciences”. The project was financed under the program of the Minister of Science and Education in 2019–2022.

Institutional Review Board Statement

Not applicable.

Informed Consent Statement

Not applicable.

Data Availability Statement

Data available on request.

Acknowledgments

The authors thank Krzysztof Ziewiecki and EKOTECH Company for the delivery of research material (xylit) and the information related to it. The authors also thank Jolanta Zawadzka—a laboratory technician at the Department of Water and Sanitary Engineering—for her help in laboratory measurements and the Amica S. A. company, for renting a washing machine.

Conflicts of Interest

The authors declare no conflict of interest.

References

  1. Spychała, M.; Pawlak, M.; Makowska, M. Influence of solids contained in septic tank effluent on lifespan of soil infiltration systems, Desalin. Water Treat. 2020, 181, 204–212. [Google Scholar]
  2. Riddle, C.S.A. Scrolling Geotextile Fabric Filter Device for Primary Clarification. Master’s Thesis, Virginia Polytechnic Institute and State University, Blacksburg, VA, USA, 2002. [Google Scholar]
  3. Sabry, T. Evaluation of decentralized treatment of sewage employing. Upflow Septic Tank/Baffled Reactor (USBR) in developing countries. J. Hazard. Mater. 2010, 174, 500–505. [Google Scholar] [CrossRef] [PubMed]
  4. Mendoza, L.; Carballa, M.; Sitorus, B.; Pieters, J.; Verstraete, W. Technical and economic feasibility of gradual concentric chambers reactor for sewage treatment in developing countries. Electron. J. Biotechnol. 2009, 12, 7–8. [Google Scholar] [CrossRef] [Green Version]
  5. Rostvall, A. Evaluation of Sorption Materials for the Removal of Organic Micropollutants in Domestic Wastewater and Their Potential Infiltration in Groundwater. Master’s Thesis, Uppsala University and Swedish University of Agricultural Sciences, Uppsala, Sweden, 2017. [Google Scholar]
  6. Widera, M. Xylites in the cenozoic fine-grained deposits from the Konin and Adamów lignite opencasts. Opencast Min. 2012, 119–122. (In Polish) [Google Scholar]
  7. Zhang, W.; Gago-Ferrero, P.; Gao, Q.; Ahrens, L.; Blum, K.; Rostvall, A.; Björlenius, B.; Andersson, P.L.; Wiberg, K.; Haglund, P.; et al. Removal of 31 organic micropollutants and phosphorus by filter media in a column experiment using household wastewater. J. Environ. Manag. 2018, 205, 298–307. [Google Scholar]
  8. Eloy Water s.a. Available online: https://www.eloywater.com/en/ (accessed on 11 February 2021).
  9. Zhang, W. An Add-On Filter Technique to Improve Micropollutant Removal and Water Quality in On-Site Sewage Treatment Facilities. Ph.D. Thesis, KTH Royal Institute of Technology, Stockholm, Sweden, 2018. [Google Scholar]
  10. Rostvall, A.; Zhang, W.; Dürig, W.; Renman, G.; Wiberg, K.; Ahrens, L.; Gago-Ferrero, P. Removal of pharmaceuticals, perfluoroalkyl substances and other micropollutants from wastewater using lignite, Xylit, sand, granular activated carbon (GAC) and GAC+Polonite ® in column tests—Role of physicochemical properties. Water Res. 2018, 137, 99–106. [Google Scholar] [CrossRef] [PubMed]
  11. Zhang, W.; Blum, K.; Gros, M.; Ahrens, L.; Jernstedt, H.; Wiberg, K.; Andersson, P.L.; Björlenius, B.; Renman, G. Removal of micropollutants and nutrients in household wastewater using organic and inorganic sorbents. Desalin. Water Treat. 2018, 120, 88–108. [Google Scholar] [CrossRef] [Green Version]
  12. Vargas, A.; Cazetta, A.; Kunita, M.H.; Silva, T.L.; Almeida, V.C. Adsorption of methylene blue on activated carbon produced from flamboyant pods (Delonix regia): Study of adsorption isotherms and kinetic models. Chem. Eng. J. 2011, 168, 722–730. [Google Scholar] [CrossRef]
  13. Spychała, M.; Nguyen, T.H. Preliminary Study on Greywater Treatment Using Nonwoven Textile Filters. Appl. Sci. 2019, 9, 3205. [Google Scholar] [CrossRef] [Green Version]
  14. PN-ISO 6060. Water Quality—Determination of Chemical Oxygen Demand; Polish Committee for Standardization: Warszawa, Poland, 2006. (In Polish) [Google Scholar]
  15. PN-EN ISO 6878. Water Quality—Determination of Phosphorus. Spectrophotometric Method with Ammonium Molybdate; Polish Committee for Standardization: Warsaw, Poland, 2006. (In Polish) [Google Scholar]
  16. PN-EN 872. Water Quality—Determination of Suspensions—The Method Using Filter Filtration; Polish Committee for Standardization: Warsaw, Poland, 2007. (In Polish) [Google Scholar]
  17. Łomnicki, A. Introduction to Statistics for Natural Scientists; State Scientific: Warsaw, Poland, 1999. (In Polish) [Google Scholar]
  18. Ghaitidak, D.M.; Yadav, K.D. Characteristics and treatment of greywater—A review. Environ. Sci. Pollut. Res. 2013, 20, 2795–2809. [Google Scholar] [CrossRef] [PubMed]
  19. Ochoa, S.I.C.; Ushijima, K.; Hijikata, N.; Funamizu, N. Treatment of domestic greywater by geotextile filter and intermittent sand filtration bioreactor. J. Water Reuse Desalin. 2015, 5, 39–49. [Google Scholar] [CrossRef] [Green Version]
  20. Li, F.; Wichmann, K.; Otterpohl, R. Review of the technological approaches for greywater treatment and reuses. Sci. Total Environ. 2009, 407, 3439–3449. [Google Scholar] [CrossRef] [PubMed]
  21. Couto, D.E.D.A.; Calijuri, M.L.; Assemany, P.P.; Santiago, A.D.F.; Carvalho, I.D.C. Greywater production in airports: Qualitative and quantitative assessment. Resour. Conserv. Recycl. 2013, 77, 44–51. [Google Scholar] [CrossRef] [Green Version]
  22. Gross, A.; Maimon, A.; Alfiya, Y.; Friedler, E. Greywater Reuse; Taylor & Francis Group: New York, NY, USA, 2015. [Google Scholar]
  23. Zipf, M.S.; Pinheiro, I.G.; Conegero, M.G. Simplified greywater treatment systems: Slow filters of sand and slate waste followed by granular activated carbon. J. Environ. Manag. 2016, 176, 119–127. [Google Scholar] [CrossRef] [PubMed]
  24. Jóźwiakowski, K. The evaluation of usability of em-farming™ preparation for work optimization of preliminary settling tanks. Infrastruct. Ecol. Rural Areas 2008, 5, 159–167. [Google Scholar]
Figure 1. Experimental set-up: (1—transparent acrylic glass tube (L = 100 cm; Din = 4.4 cm); 2—bed of xylit with a height of 80 cm; 3—safety net (mosquito net) with a mesh size of 1.0 × 1.0 mm; 4—fountain pump sprinkler located centrally in relation to the pipe with a 5.0 cm sponge above the surface of the filling; 5—wastewater tank with a capacity of 30 dm3; 6—pump; 7—collecting and measuring vessel).
Applsci 11 05281 g001
Figure 2. Forms of material (xylit) used: left: scraps; right: angel hair.
Applsci 11 05281 g002
Figure 3. Inlet and outlet COD and removal efficiencies at preliminary stage.
Applsci 11 05281 g003
Figure 4. Inlet and outlet COD and removal efficiencies at stage I.
Applsci 11 05281 g004
Figure 5. Inlet and outlet COD and removal efficiencies at stage II.
Applsci 11 05281 g005
Figure 6. Inlet and outlet Ptot and removal efficiencies at stage I.
Applsci 11 05281 g006
Figure 7. Inlet and outlet Ptot and removal efficiencies at stage II.
Applsci 11 05281 g007
Figure 8. Inlet and outlet NNH4 and removal efficiencies at stage I.
Applsci 11 05281 g008
Figure 9. Inlet and outlet NNH4 and removal efficiencies at stage II.
Applsci 11 05281 g009
Figure 10. Inlet and outlet TSS and removal efficiencies at preliminary stage.
Applsci 11 05281 g010
Figure 11. Inlet and outlet TSS and removal efficiencies at stage I.
Applsci 11 05281 g011
Table 1. Inlet and outlet COD and removal efficiencies at preliminary stage.
Sample No.InletAHSCR
OutletEfficiencyOutletEfficiency
mg/Lmg/L%mg/L%
143013269.326438.6
26176389.87288.3
369112082.620071.1
46807289.416475.9
574019773.415179.6
668130155.818672.7
7158035477.633478.9
855125453.921461.2
949023851.414370.8
Avg.717.8 ± 113.0192.3 ± 34.171.5 ± 5.0192.0 ± 25.170.8 ± 4.7
Table 2. Inlet and outlet COD and removal efficiencies at stage I.
Sample No.AH1AH2SCR
InletOutletEfficiencyInletOutletEfficiencyInletOutletEfficiency
mg/Lmg/L%mg/Lmg/L%mg/Lmg/L%
12044378.92043085.32044080.4
2155E.n. d.1553776.11553180.0
32995780.93004784.33054086.9
42892292.43484088.52744982.1
52946179.33148373.63435284.8
63143887.93245782.43565484.8
74344190.63855087.03775385.9
Avg.284.1 ± 33.443.7 ± 5.785.0 ± 2.5290.0 ± 30.849.1 ± 6.682.5 ± 2.1287.7 ± 31.245.6 ± 3.383.6 ± 1.0
Table 3. Inlet and outlet COD and removal efficiencies at stage II.
Sample No.AH1AH2
InletOutletEfficiencyInletOutletEfficiency
mg/Lmg/L%mg/Lmg/L%
16854593.46954693.4
26855492.16906291.0
348410877.74856486.8
449810678.74837085.5
54454789.44406784.8
64265786.64958383.2
Avg.537.2 ± 47.969.5 ± 12.086.3 ± 2.7548.0 ± 46.365.3 ± 4.987.5 ± 1.6
Table 4. Inlet and outlet Ptot and removal efficiencies at stage I.
Sample No.AH1AH2SCR
InletOutletEfficiencyInletOutletEfficiencyInletOutletEfficiency
mg/Lmg/L%mg/Lmg/L%mg/Lmg/L%
120.111.343.820.110.448.320.110.746.8
217.6E.n. d.17.61137.517.610.838.6
321.39.356.321.88.859.622.49.657.1
426.510.560.425.310.658.126.211.556.1
529.212.756.524.212.847.126.213.249.6
628.513.154.027.612.255.827.512.654.2
721.410.252.321.59.257.220.810.151.4
Avg.23.5 ± 1.711.2 ± 0.653.9 ± 2.322.6 ± 1.310.7 ± 0.651.9 ± 3.023.0 ± 1.411.2 ± 0.550.6 ± 2.4
Table 5. Inlet and outlet Ptot and removal efficiencies at stage II.
Sample No.AH1AH2
InletOutletEfficiencyInletOutletEfficiency
mg/Lmg/L%mg/Lmg/L%
18.82.868.292.770.0
29.12.869.28.93.659.6
35.43.240.75.82.753.4
45.43.142.65.62.751.8
55.53.438.25.53.143.6
67.23.354.272.958.6
Avg.6.9 ± 0.73.1 ± 0.152.2 ± 5.77.0 ± 0.73.0 ± 0.156.2 ± 3.6
Table 6. Inlet and outlet NNH4 and removal efficiencies at stage I.
Sample No.AH1AH2SCR
InletOutletEfficiencyInletOutletEfficiencyInletOutletEfficiency
mg/Lmg/L%mg/Lmg/L%mg/Lmg/L%
164.40.9998.564.40.3399.564.40.5399.2
275E.n. d.750.898.9750.3299.6
3930.8699.1971.3198.61001.0299.0
41522.298.61083.896.5987.392.6
51162.298.111715.786.61247.893.7
61162.198.21112.597.71172.398.0
7841.498.3821.598.2691.597.8
Avg.100.1 ± 11.41.6 ± 0.398.5 ± 0.193.5 ± 7.63.7 ± 2.096.6 ± 1.792.5 ± 8.93.0 ± 1.297.1 ± 1.1
Table 7. Inlet and outlet NNH4 and removal efficiencies at stage II.
Sample No.AH1AH2
InletOutletEfficiencyInletOutletEfficiency
mg/Lmg/L%mg/Lmg/L%
13.71.754.13.2237.5
24.5333.34.52.348.9
31.650.663.61.551.2718.1
41.591.1130.21.61.1627.5
52.530.9562.51.710.8848.5
Avg.2.8 ± 0.61.5 ± 0.448.7 ± 7.12.5 ± 0.61.5 ± 0.336.1 ± 6.0
Table 8. Inlet and outlet TSS and removal efficiencies at preliminary stage.
Sample No.InletAHSCR
OutletEfficiencyOutletEfficiency
mg/Lmg/L%mg/L%
1654.2129.6080.2654.224.20
2218142.0034.921817.60
3348.9283.1018.9348.9202.00
4343.9247.4028.1343.913.50
5351.9210.3040.2351.9109.50
6642.8318.0050.5642.8375.00
7665.1313.0052.9665.1208.80
857.743.4024.857.7184.80
9205.5105.6048.6205.590.60
Avg.387.6 ± 73.5199.2 ± 32.942.1 ± 6.2387.6 ± 73.5136.2 ± 39.7
Table 9. Inlet and outlet TSS and removal efficiencies at stage I.
Sample No.AH1AH2SCR
InletOutletEfficiencyInletOutletEfficiencyInletOutletEfficiency
mg/Lmg/L%mg/Lmg/L%mg/Lmg/L%
1667.3088.9665.292.16621.7067.1
282.2E.n. d.82.29.288.882.225.9068.5
3132.963.2052.4132.9E.n. d.132.922.4083.1
4148.1127.3014.0148.19.493.7148.113.8090.7
Avg.107.3 ± 19.765.9 ± 34.751.8 ± 21.6107.3 ± 19.77.9 ± 1.491.5 ± 1.4107.3 ± 19.721.0 ± 2.677.4 ± 5.7
Publisher’s Note: MDPI stays neutral with regard to jurisdictional claims in published maps and institutional affiliations.

