
A Gas Chromatography-Mass Spectrometry Method for the Determination of Fatty Acids and Sterols in Yeast and Grape Juice

 ,
,  , and
, and
Abstract
:
1. Introduction
2. Materials and Methods
2.1. Optimization Design
2.2. Chemicals and Standard Solutions
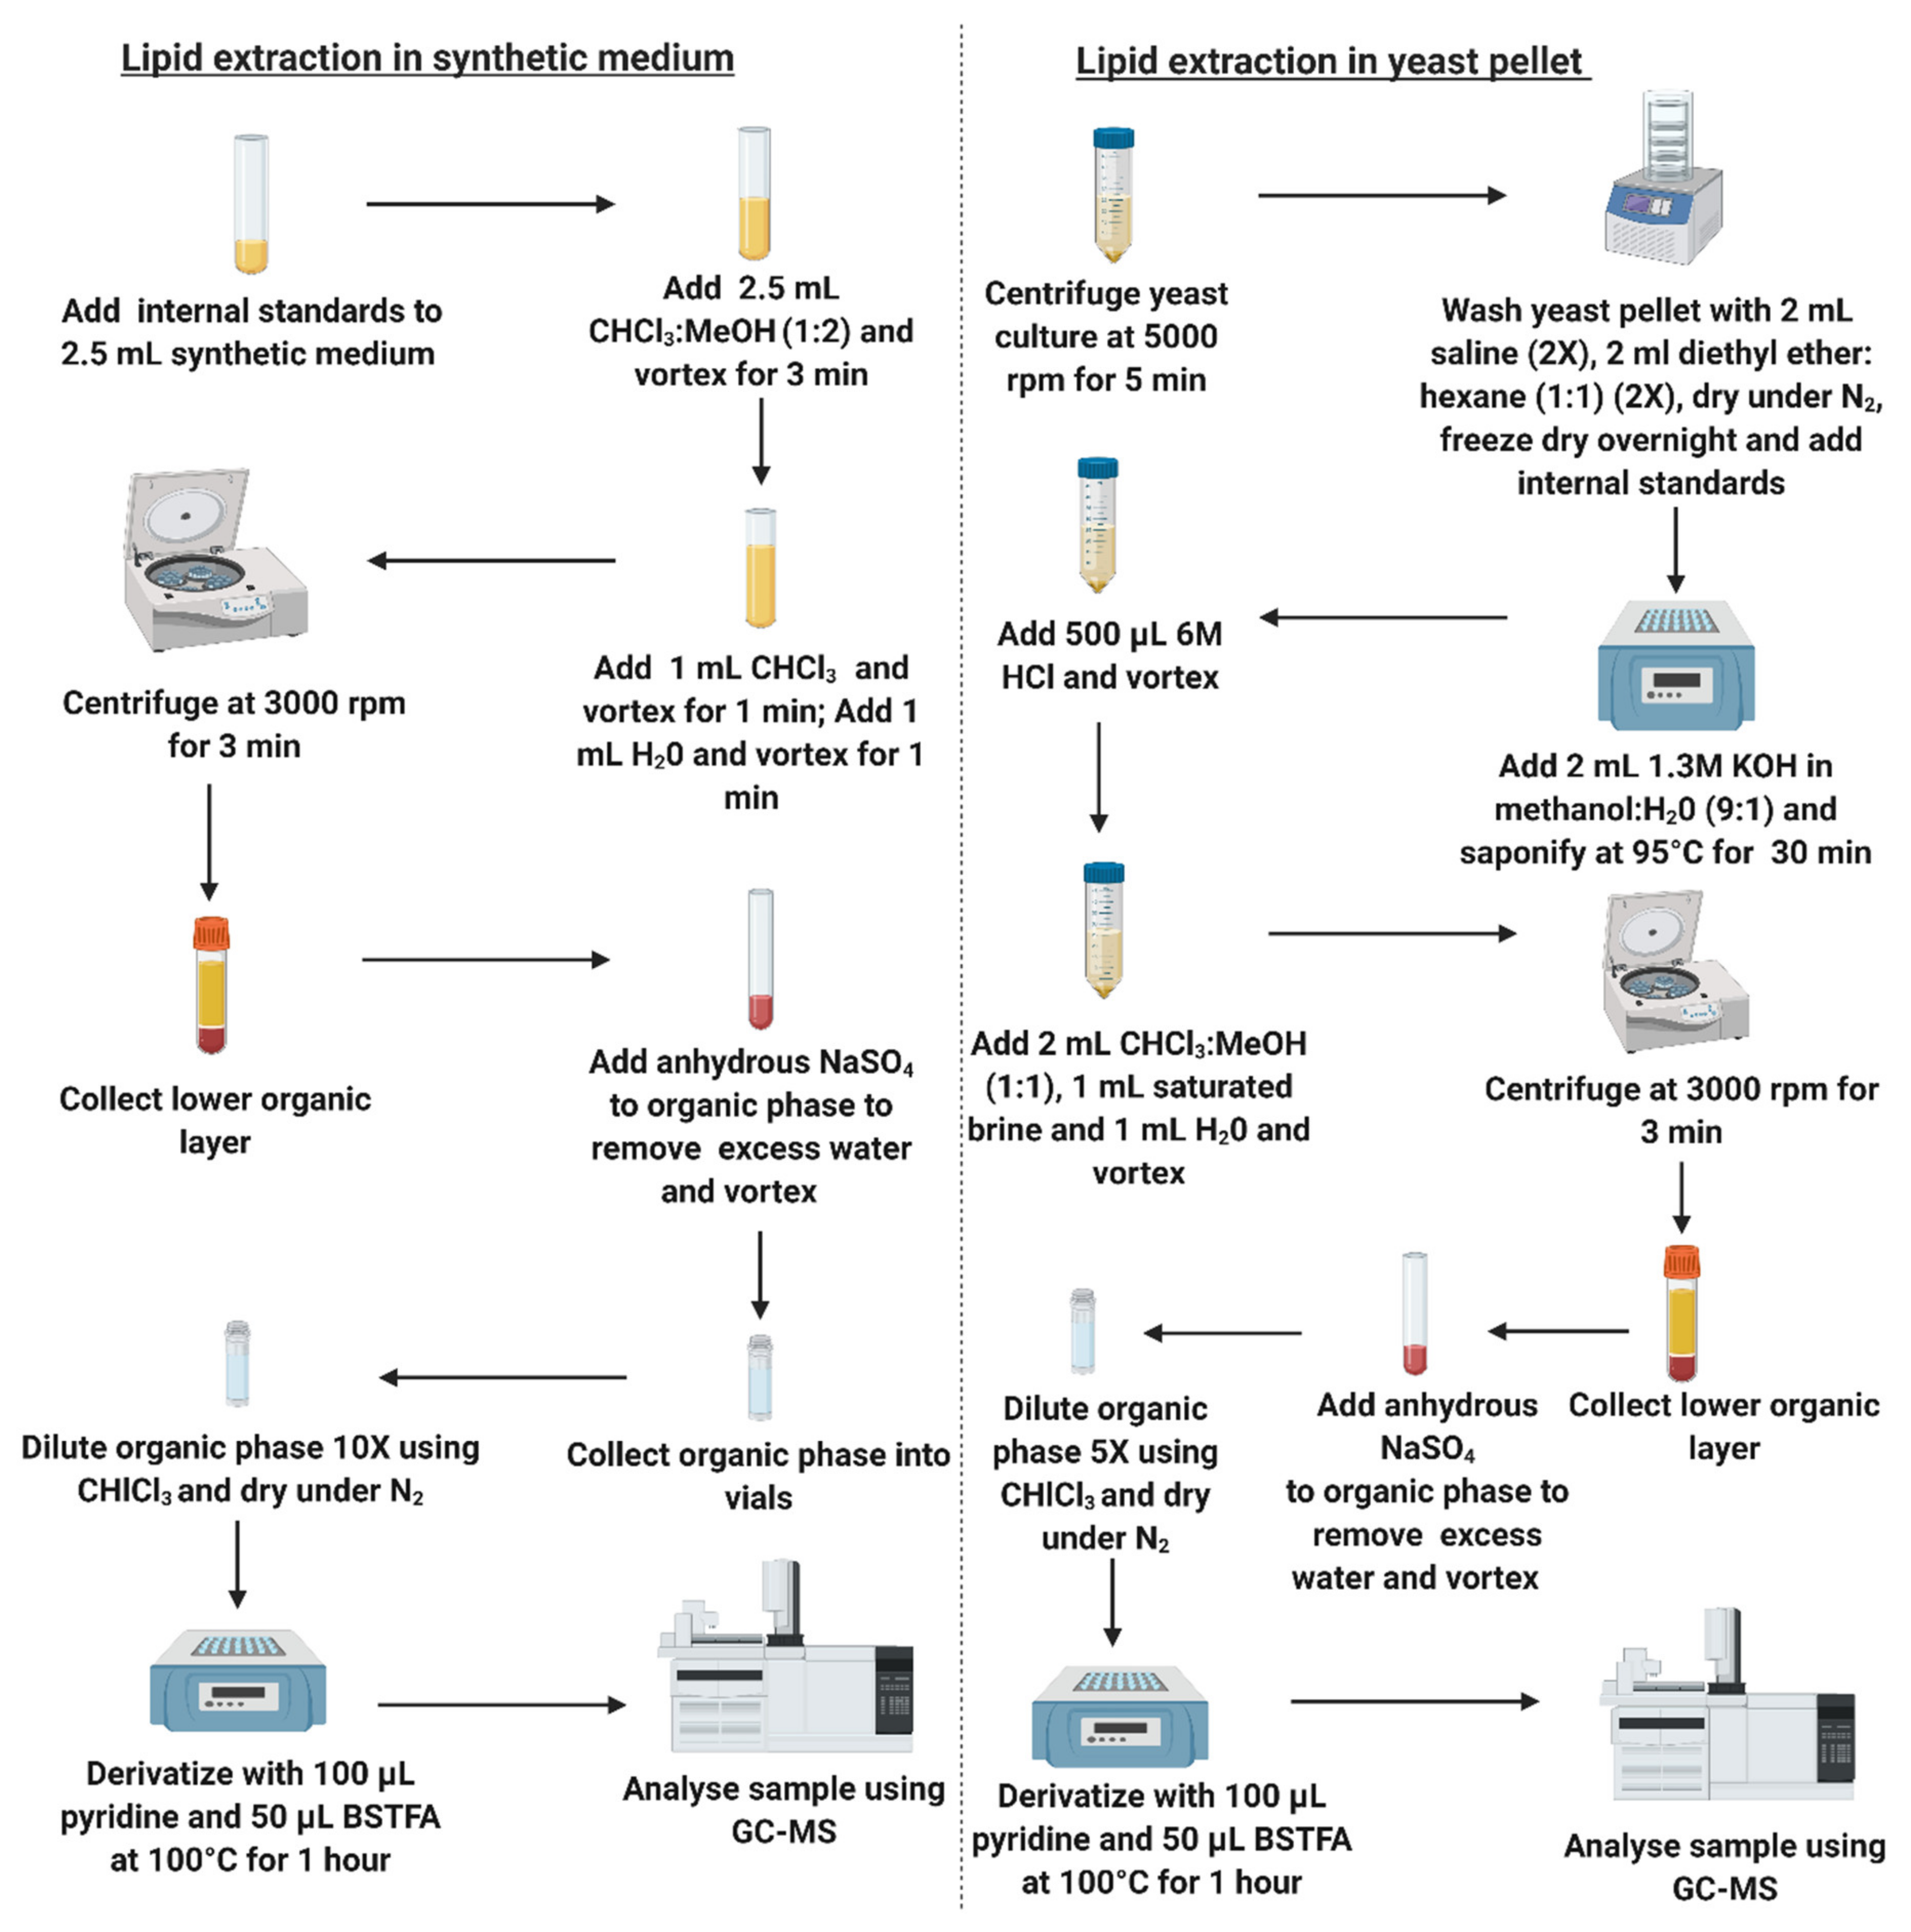
2.3. Sample Preparation—Extraction
2.4. Sample Preparation—Derivatization
2.5. Instrumental Parameters
2.6. Performance Parameters
2.7. Samples
3. Results
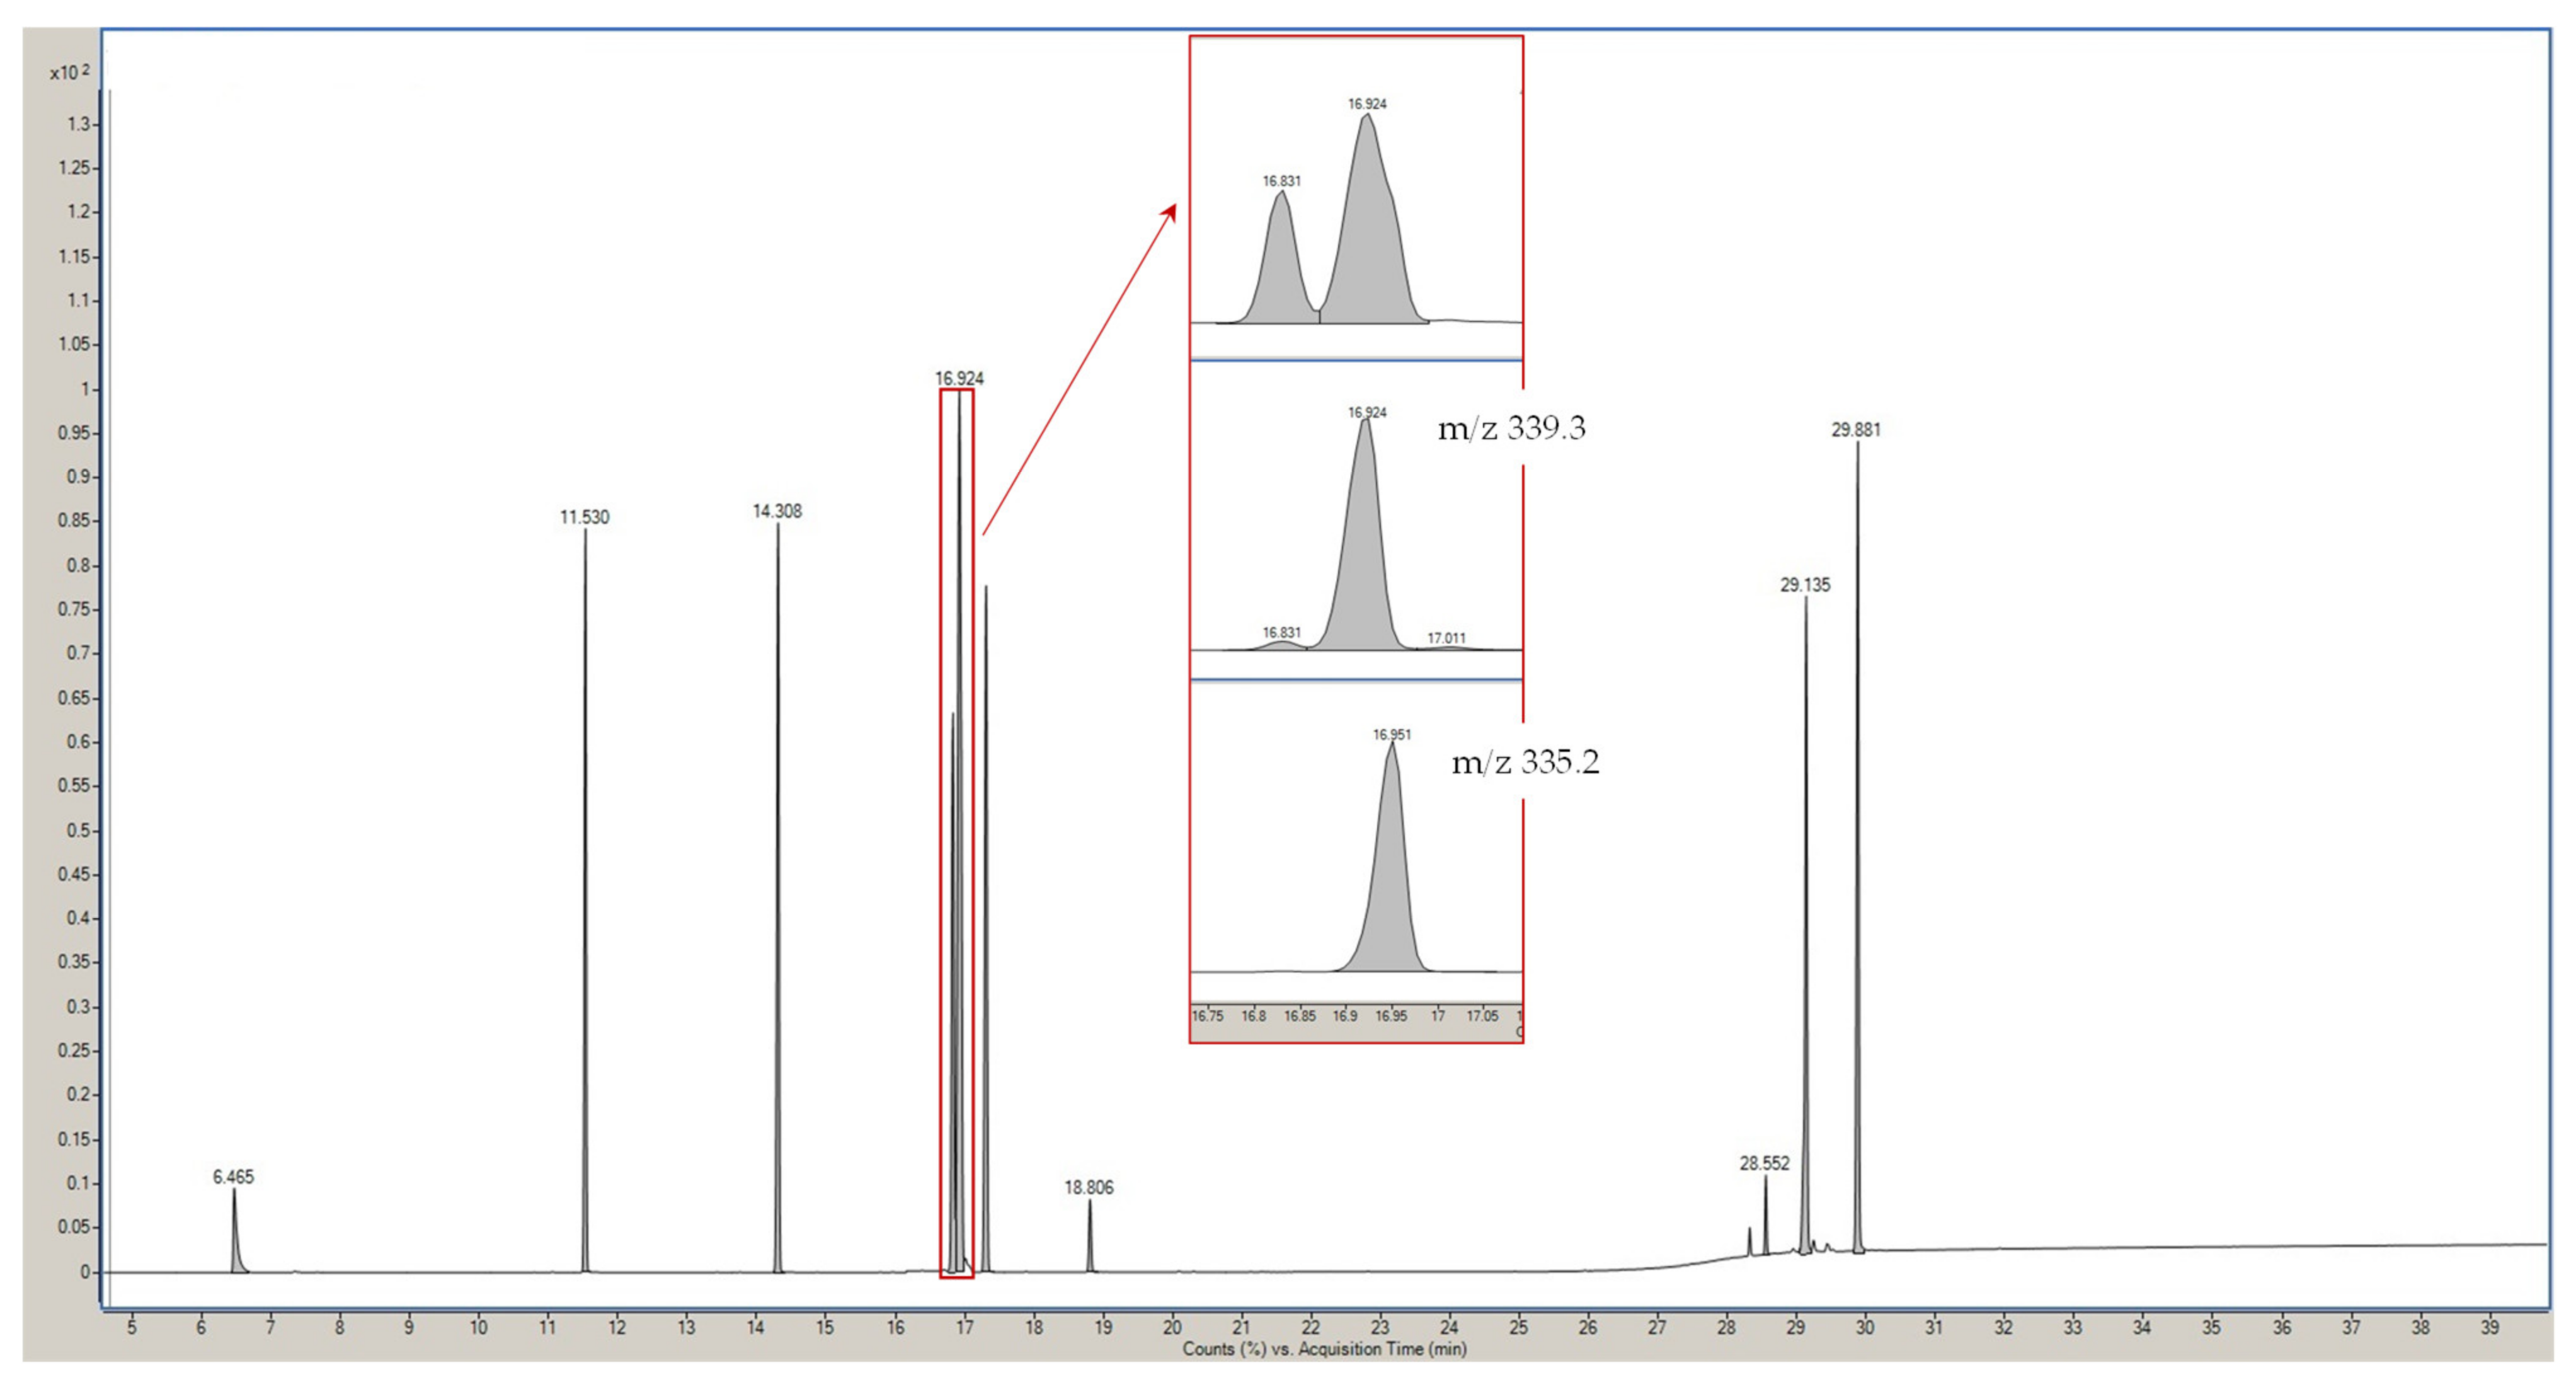
3.1. GC-MS Optimization
3.2. Extraction Optimization
3.3. Method Performance
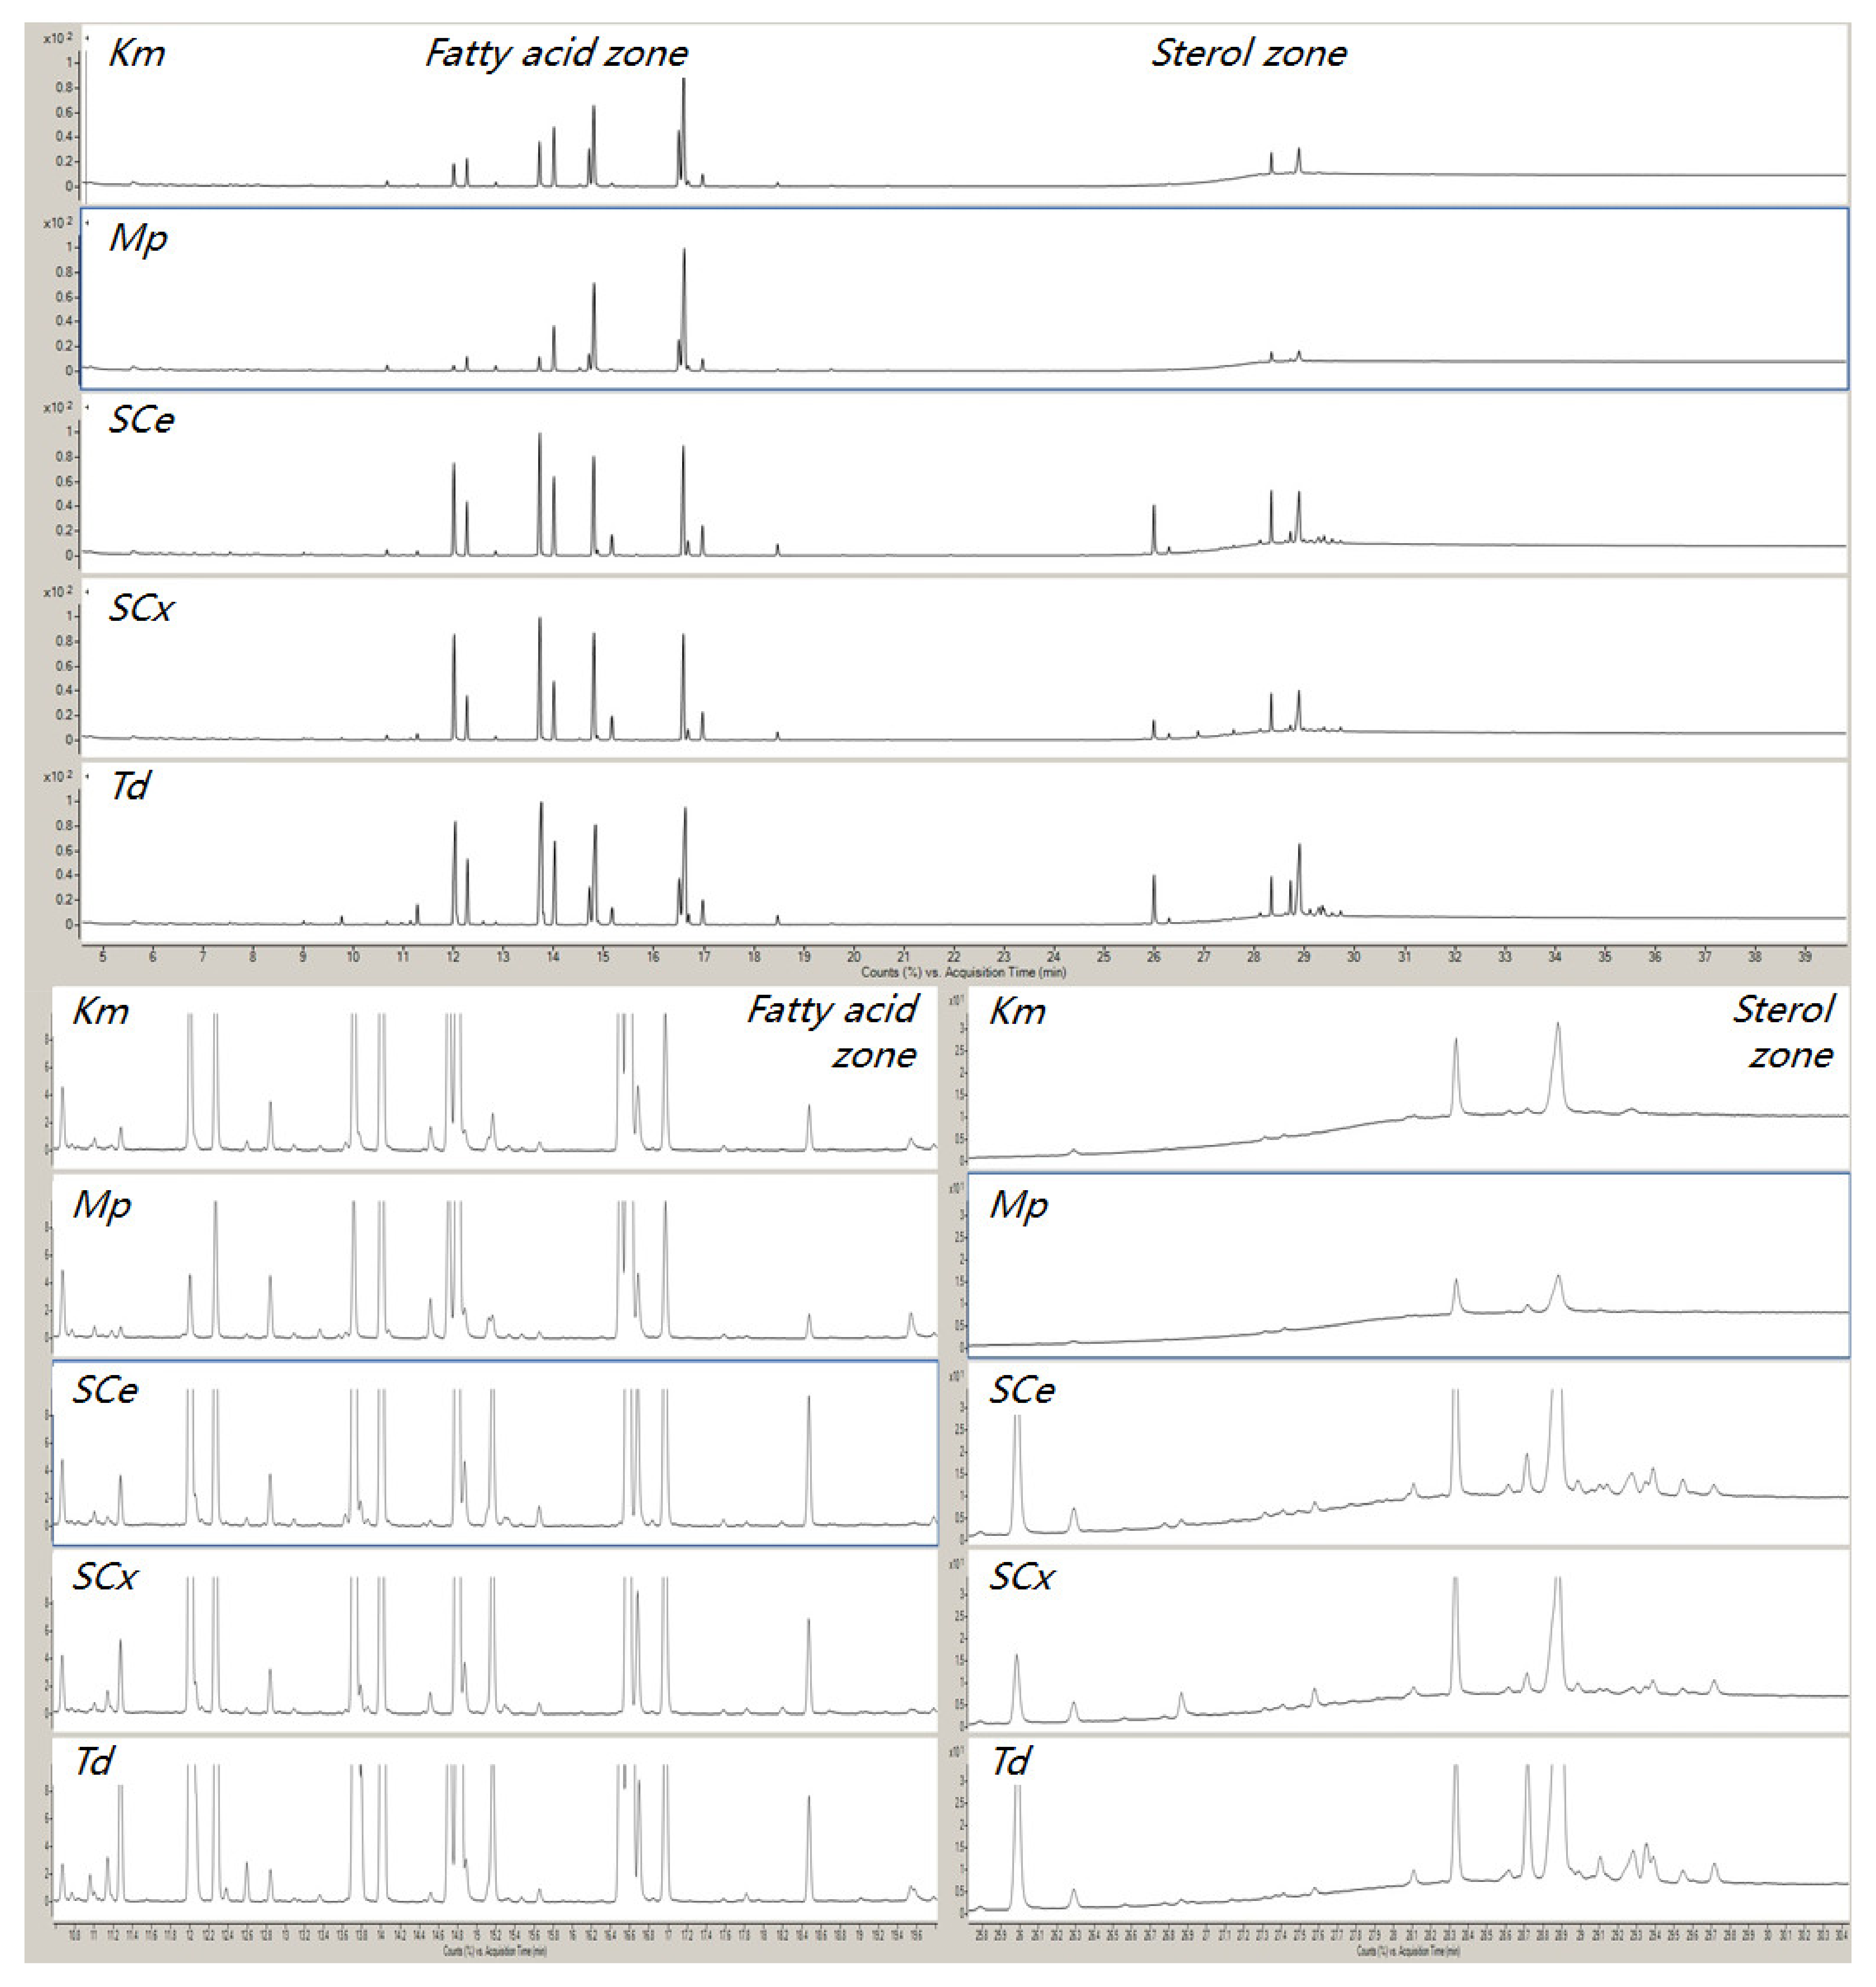
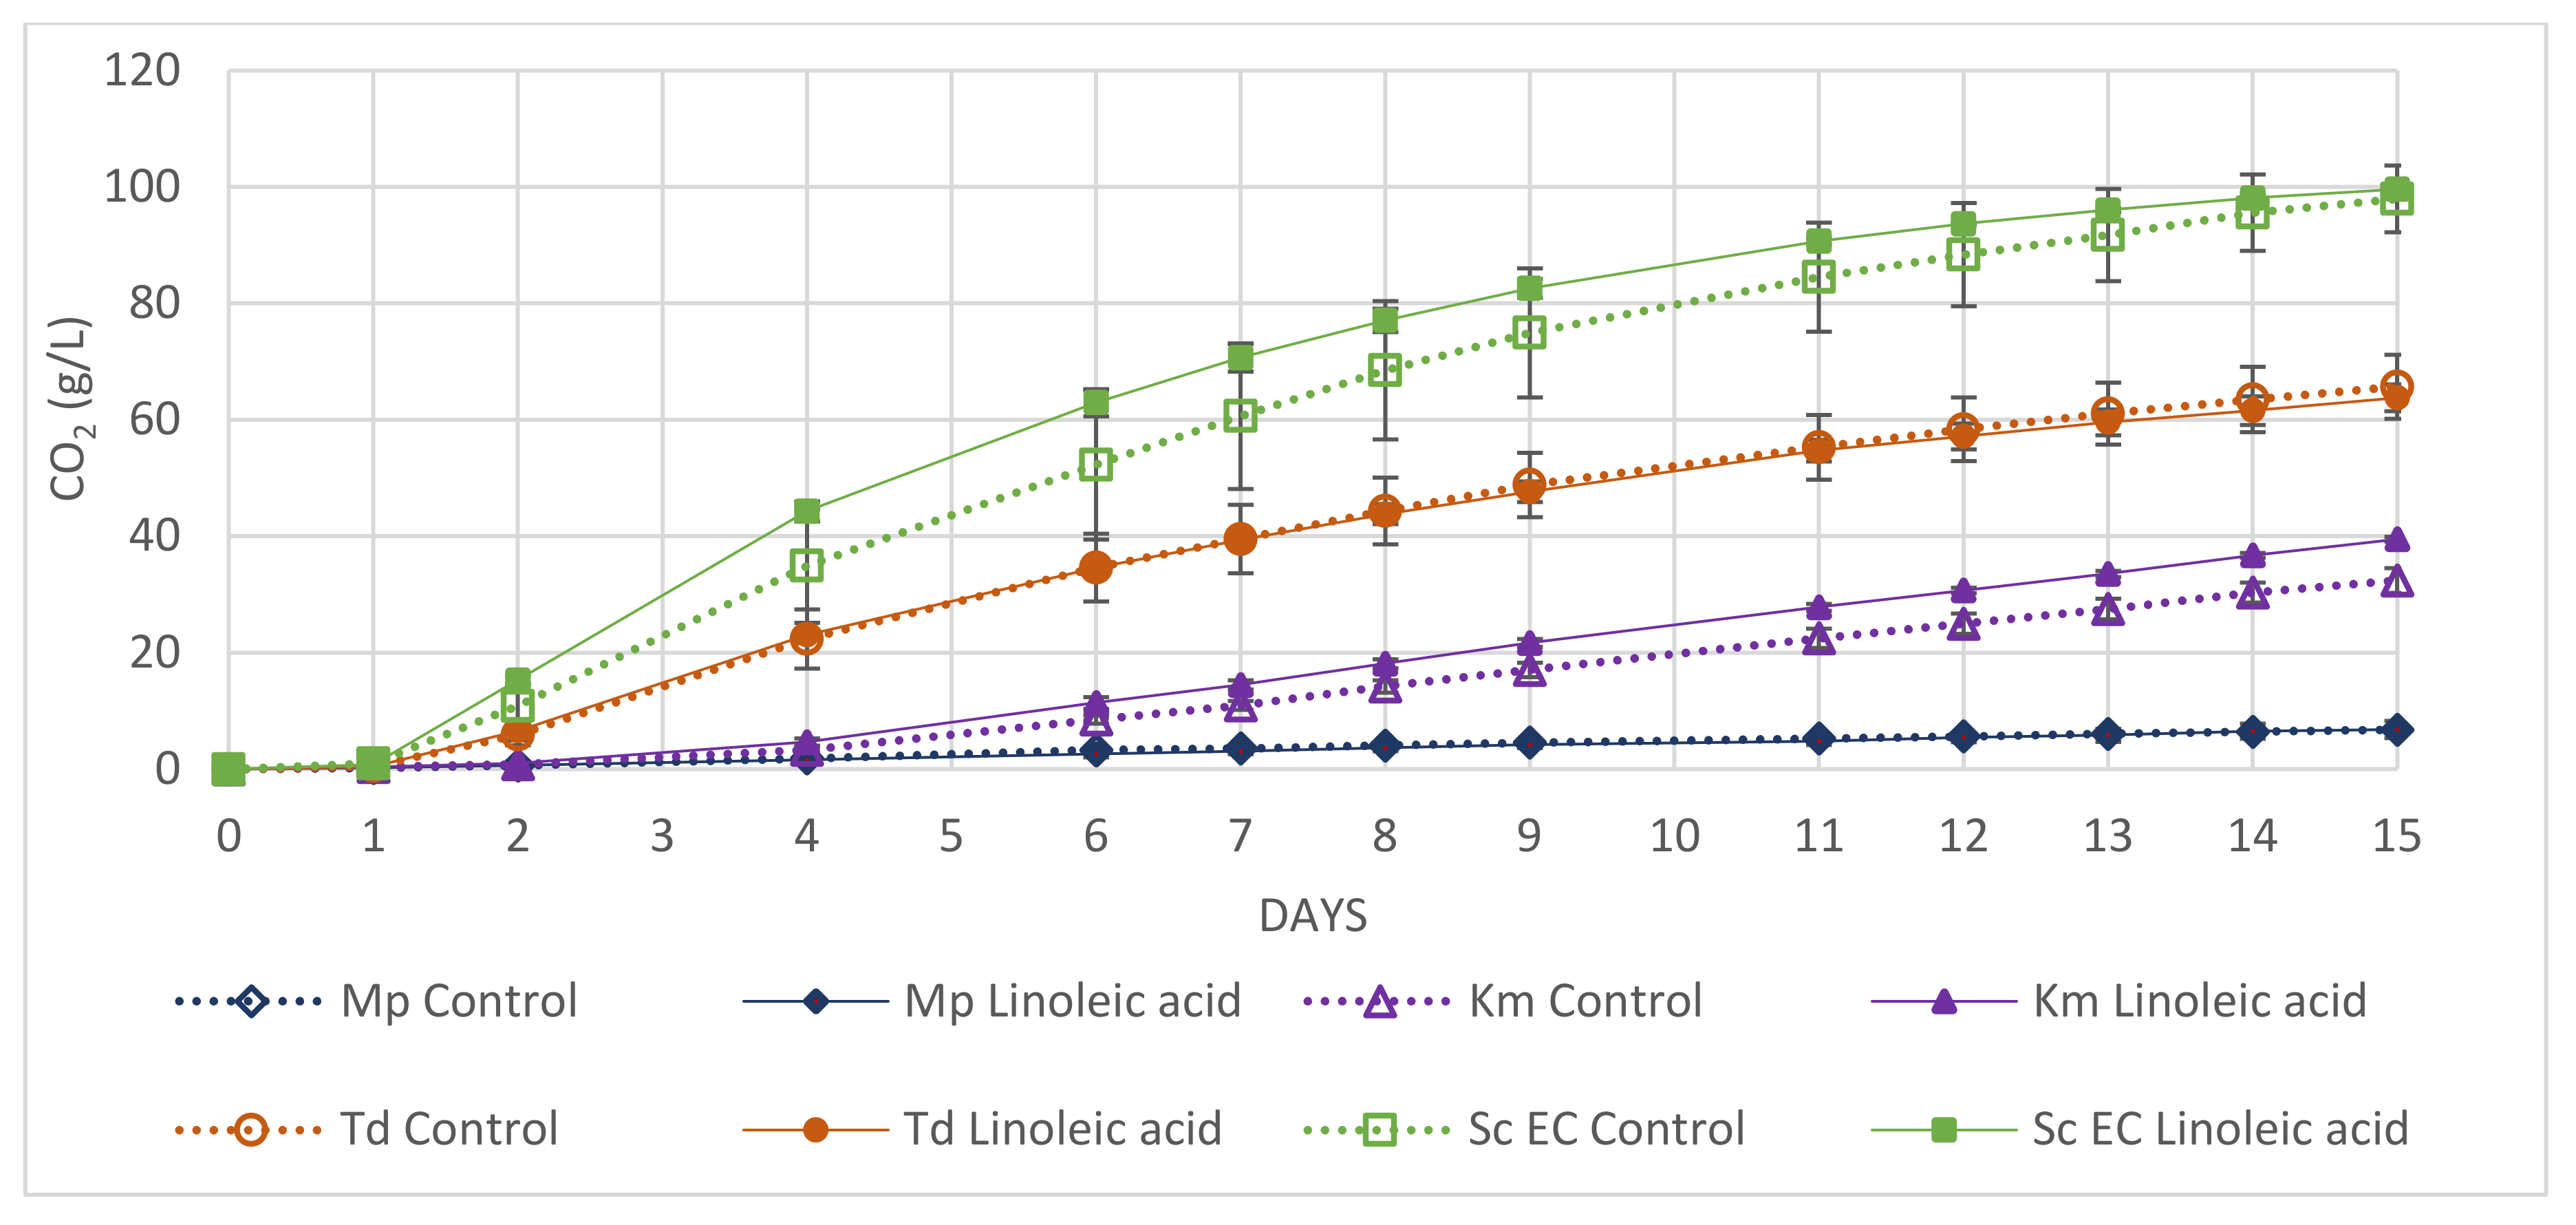
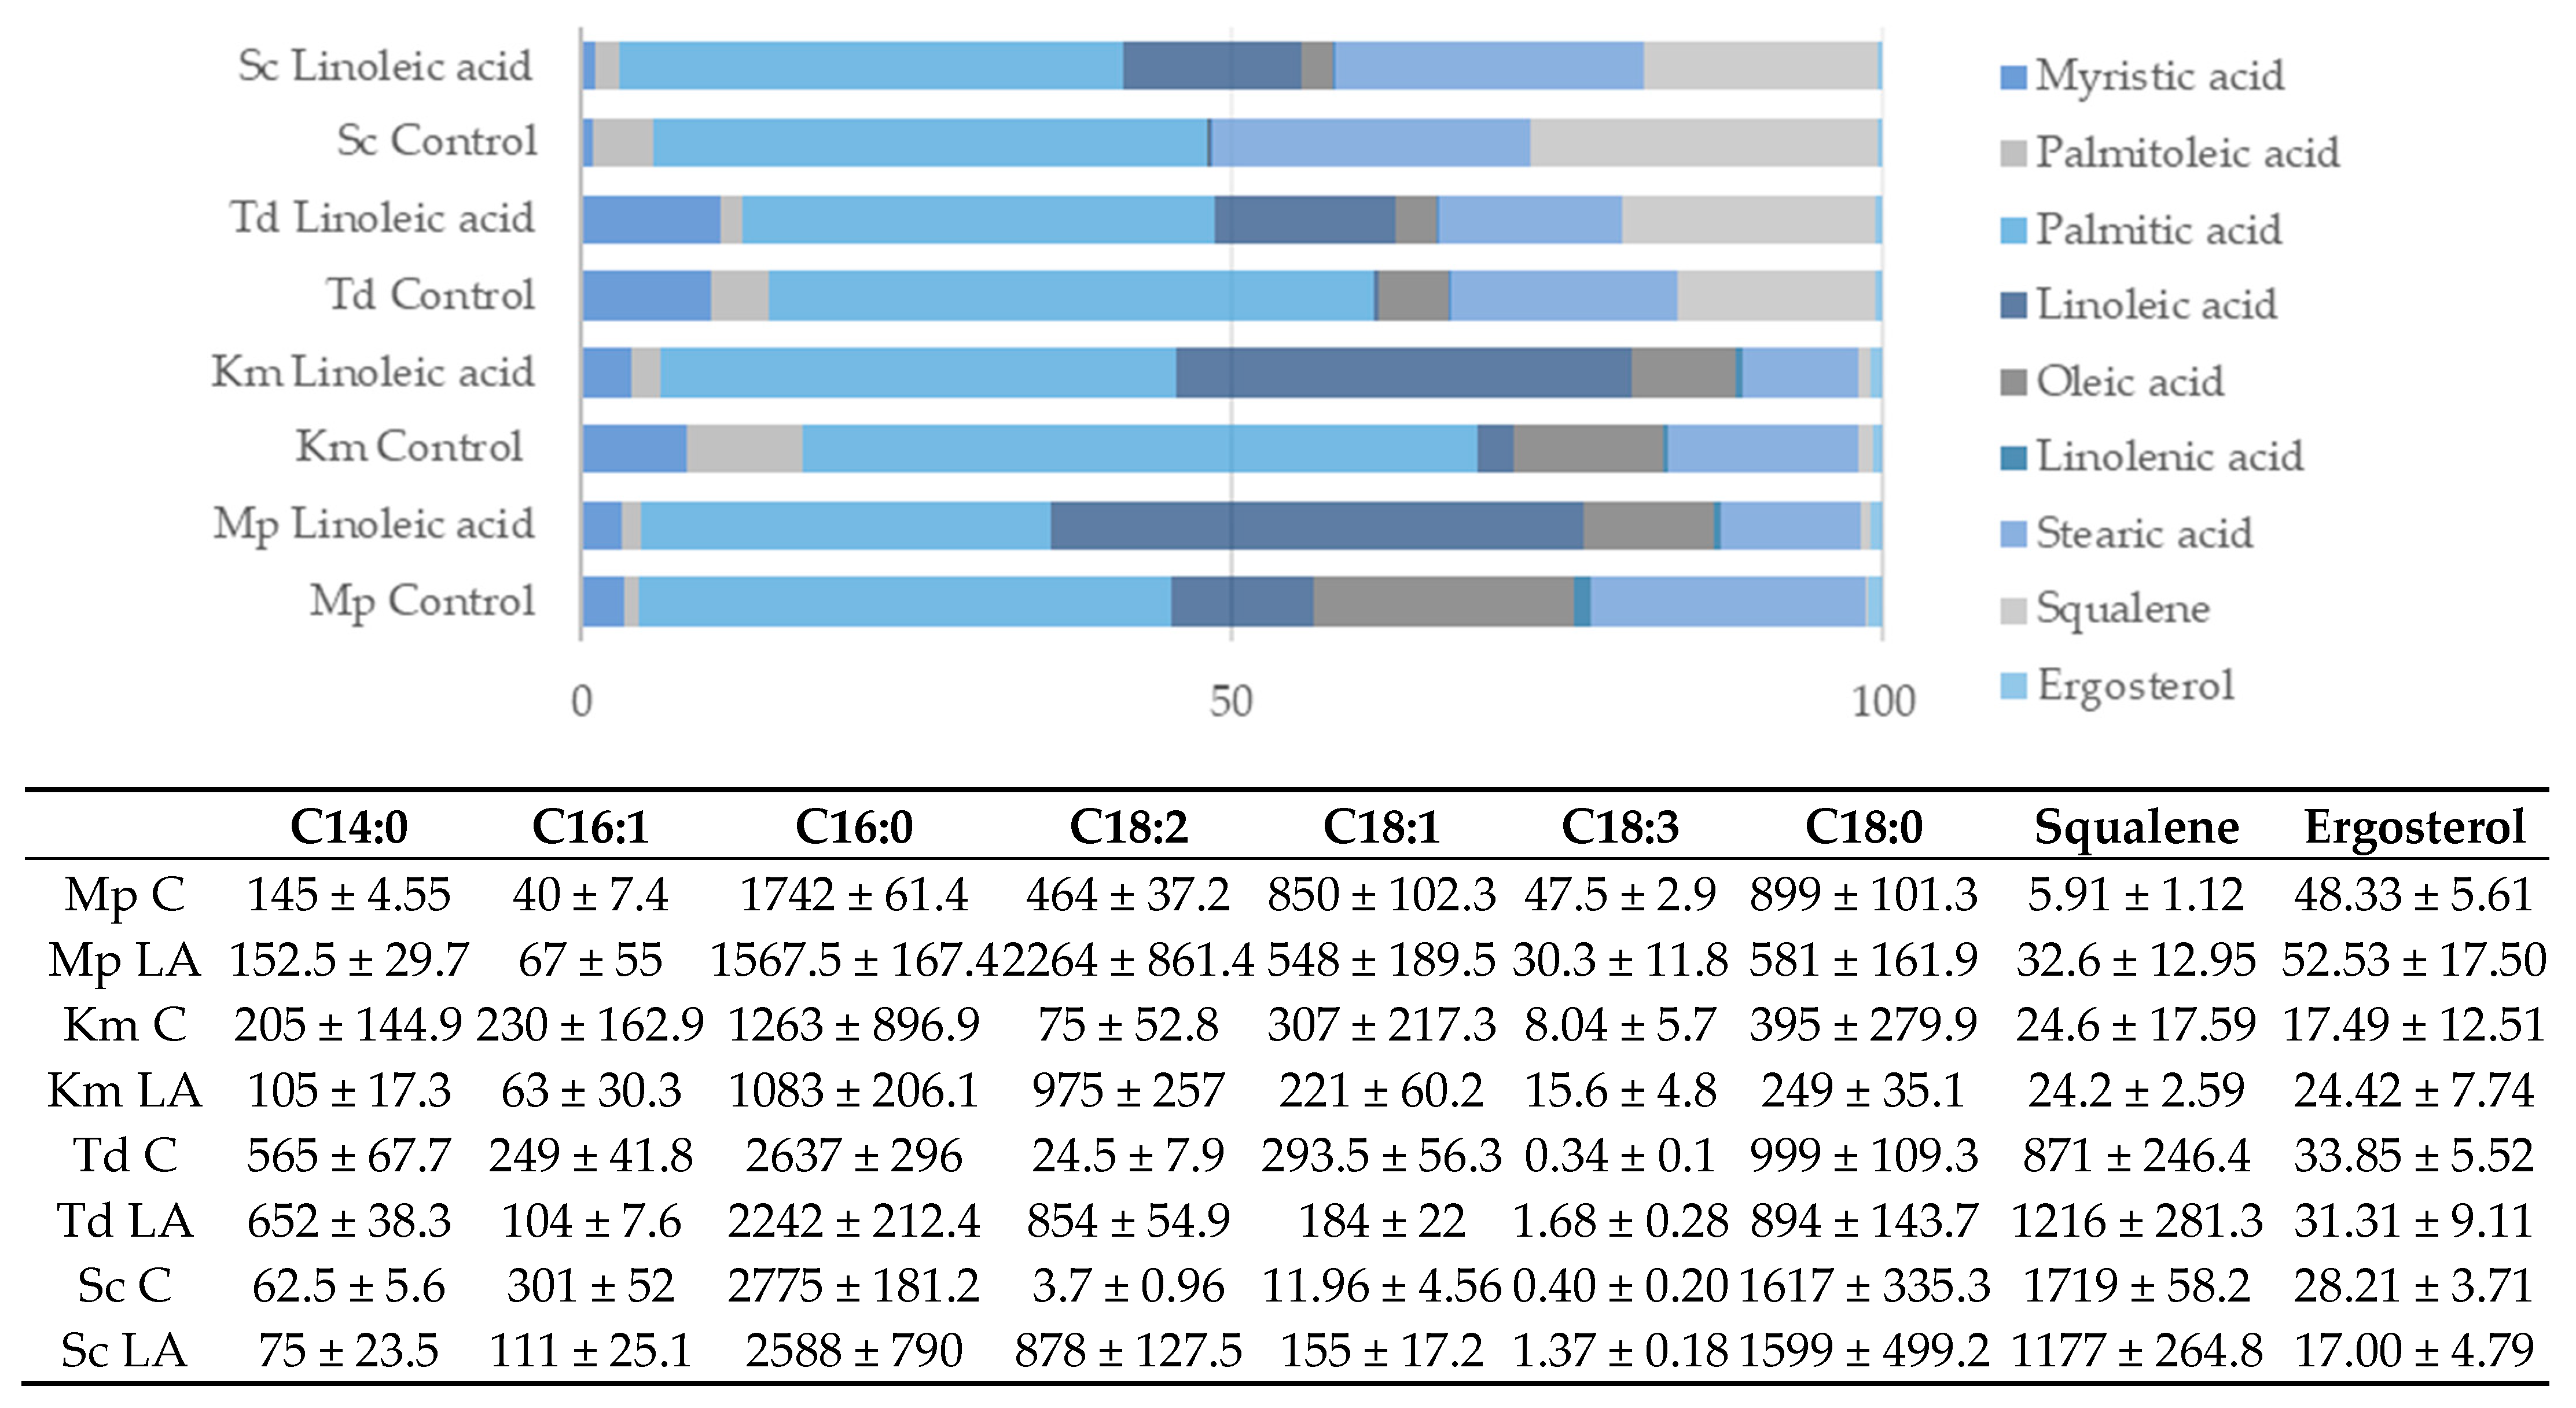
3.4. Application
4. Discussion
Author Contributions
Funding
Institutional Review Board Statement
Informed Consent Statement
Data Availability Statement
Conflicts of Interest
References
- Fahy, E.; Cotter, D.; Sud, M.; Subramaniam, S. Lipid classification, structures and tools. Biochim. Biophys. Acta BBA Mol. Cell Biol. Lipids 2011, 1811, 637–647. [Google Scholar] [CrossRef] [Green Version]
- Christie, W.W. The chemistry and biochemistry of simple and complex lipids. Nat. Prod. Rep. 1984, 1, 499–511. [Google Scholar] [CrossRef] [PubMed]
- Fahy, E.; Subramaniam, S.; Brown, H.A.; Glass, C.K.; Merrill, A.H., Jr.; Murphy, R.C.; Raetz, C.R.H.; Russell, D.; Seyama, Y.; Shaw, W.; et al. A comprehensive classification system for lipids. J. Lipid Res. 2005, 46, 839–861. [Google Scholar] [CrossRef] [Green Version]
- Akpinar-Bayizit, A. Fungal lipids: The biochemistry of lipid accumulation. Int. J. Chem. Eng. Appl. 2014, 5, 409–414. [Google Scholar] [CrossRef] [Green Version]
- López-Lara, I.M.; Geiger, O. Bacterial lipid diversity. Biochim. Biophys. Acta Mol. Cell Biol. Lipids 2017, 1862, 1287–1299. [Google Scholar] [CrossRef] [PubMed]
- Li-Beisson, Y.; Shorrosh, B.; Beisson, F.; Andersson, M.X.; Arondel, V.; Bates, P.D.; Baud, S.; Bird, D.; Debono, A.; Durrett, T.P.; et al. Acyl-lipid metabolism. Arab. Book 2013, 11, e0161. [Google Scholar] [CrossRef] [Green Version]
- Birsoy, K.; Festuccia, W.T.; Laplante, M. A comparative perspective on lipid storage in animals. J. Cell Sci. 2013, 126, 1541–1552. [Google Scholar] [CrossRef] [Green Version]
- Coleman, R.A. The “discovery” of lipid droplets: A brief history of organelles hidden in plain sight. Biochim. Biophys. Acta (BBA) Mol. Cell Biol. Lipids 2020, 1865, 158762. [Google Scholar] [CrossRef]
- Ziółkowska, N.E.; Christiano, R.; Walther, T.C. Organized living: Formation mechanisms and functions of plasma membrane domains in yeast. Trends Cell Biol. 2012, 22, 151–158. [Google Scholar] [CrossRef]
- Sunshine, H.; Iruela-Arispe, M.L. Membrane lipids and cell signaling. Curr. Opin. Lipidol. 2017, 28, 408–413. [Google Scholar] [CrossRef]
- Van Der Rest, M.E.; Kamminga, A.H.; Nakano, A.; Anraku, Y.; Poolman, B.; Konings, W.N. The plasma membrane of Saccharomyces cerevisiae: Structure, function, and biogenesis. Microbiol. Rev. 1995, 59, 304–322. [Google Scholar] [CrossRef] [PubMed]
- Kodedová, M.; Sychrová, H. Changes in the sterol composition of the plasma membrane affect membrane potential, salt tolerance and the Activity of multidrug resistance pumps in Saccharomyces cerevisiae. PLoS ONE 2015, 10, e0139306. [Google Scholar] [CrossRef] [Green Version]
- Pinu, F.R.; Villas-Boas, S.G.; Martin, D. Pre-fermentative supplementation of fatty acids alters the metabolic activity of wine yeasts. Food Res. Int. 2019, 121, 835–844. [Google Scholar] [CrossRef]
- Rodríguez-Porrata, B.; Lopez-Martinez, G.; Redón, M.; Sancho, M.; Mas, A.; Rozès, N.; Cordero-Otero, R. Enhancing yeast cell viability after dehydration by modification of the lipid profile. World J. Microbiol. Biotechnol. 2011, 27, 75–83. [Google Scholar] [CrossRef]
- Tehlivets, O.; Scheuringer, K.; Kohlwein, S.D. Fatty acid synthesis and elongation in yeast. Biochim. Biophys. Acta (BBA) Mol. Cell Biol. Lipids 2007, 1771, 255–270. [Google Scholar] [CrossRef] [PubMed]
- Sokolov, S.S.; Trushina, N.I.; Severin, F.F.; Knorre, D.A. Ergosterol turnover in yeast: An interplay between biosynthesis and transport. Biochemistry 2019, 84, 346–357. [Google Scholar] [CrossRef] [PubMed]
- Uemura, H. Synthesis and production of unsaturated and polyunsaturated fatty acids in yeast: Current state and perspectives. Appl. Microbiol. Biotechnol. 2012, 95, 1–12. [Google Scholar] [CrossRef]
- Galea, A.M.; Brown, A.J. Special relationship between sterols and oxygen: Were sterols an adaptation to aerobic life? Free Radic. Biol. Med. 2009, 47, 880–889. [Google Scholar] [CrossRef]
- Bardi, L.; Cocito, C.; Marzona, M. Saccharomyces cerevisiae cell fatty acid composition and release during fermentation without aeration and in absence of exogenous lipids. Int. J. Food Microbiol. 1999, 47, 133–140. [Google Scholar] [CrossRef]
- Liu, P.-T.; Zhang, B.-Q.; Duan, C.-Q.; Yan, G.-L. Pre-fermentative supplementation of unsaturated fatty acids alters the effect of overexpressing ATF1 and EEB1 on esters biosynthesis in red wine. LWT 2020, 120, 108925. [Google Scholar] [CrossRef]
- Ochando, T.; Mouret, J.-R.; Humbert-Goffard, A.; Sablayrolles, J.-M.; Farines, V. Impact of initial lipid content and oxygen supply on alcoholic fermentation in Champagne-like musts. Food Res. Int. 2017, 98, 87–94. [Google Scholar] [CrossRef] [PubMed]
- Tesnière, C. Importance and role of lipids in wine yeast fermentation. Appl. Microbiol. Biotechnol. 2019, 103, 8293–8300. [Google Scholar] [CrossRef] [PubMed]
- Fairbairn, S.; Ferreira, A.C.S.; Bauer, F.F. Modulation of yeast-derived volatile aromas by oleic acid and sterols. S. Afr. J. Enol. Vitic. 2019, 40, 1–11. [Google Scholar] [CrossRef]
- Bligh, E.G.; Dyer, W.J. A rapid method of total lipid extraction and purification. Can. J. Biochem. Physiol. 1959, 37, 911–917. [Google Scholar] [CrossRef] [Green Version]
- Camacho, A.P.; Delgado, M. Histological study of the gonadal development of Ruditapes decussates (L.) (Mollusca: Bivalvia) and its relationship with available food. Sci. Mar. 2005, 69, 87–97. [Google Scholar] [CrossRef] [Green Version]
- Tumanov, S.; Zubenko, Y.; Greven, M.; Greenwood, D.R.; Shmanai, V.; Villas-Boas, S.G. Comprehensive lipidome profiling of Sauvignon blanc grape juice. Food Chem. 2015, 180, 249–256. [Google Scholar] [CrossRef]
- Yunoki, K.; Tanji, M.; Murakami, Y.; Yasui, Y.; Hirose, S.; Ohnishi, M. Fatty acid compositions of commercial red wines. Biosci. Biotechnol. Biochem. 2004, 68, 2623–2626. [Google Scholar] [CrossRef] [PubMed] [Green Version]
- Arita, K.; Honma, T.; Suzuki, S. Comprehensive and comparative lipidome analysis of Vitis vinifera L. cv. Pinot noir and Japanese indigenous V. vinifera L. cv. Koshu grape berries. PLoS ONE 2017, 12, e0186952. [Google Scholar] [CrossRef] [PubMed]
- Cocito, C.; Delfini, C. Simultaneous determination by GC of free and combined fatty acids and sterols in grape musts and yeasts as silanized compounds. Food Chem. 1994, 50, 297–305. [Google Scholar] [CrossRef]
- Sharma, S.C. Implications of sterol structure for membrane lipid composition, fluidity and phospholipid asymmetry in Saccharomyces cerevisiae. FEMS Yeast Res. 2006, 6, 1047–1051. [Google Scholar] [CrossRef] [Green Version]
- Mejía-Barajas, J.; Montoya-Pérez, R.; Manzo-Avalos, S.; Cortés-Rojo, C.; Riveros-Rosas, H.; Cervantes, C.; Saavedra-Molina, A. Fatty acid addition and thermotolerance of Kluyveromyces marxianus. FEMS Microbiol. Lett. 2018, 365. [Google Scholar] [CrossRef]
- Lambert, M.A.; Moss, C.W. Comparison of the effects of acid and base hydrolyses on hydroxy and cyclopropane fatty acids in bacteria. J. Clin. Microbiol. 1983, 18, 1370–1377. [Google Scholar] [CrossRef] [Green Version]
- Ruggiero, A.; Vitalini, S.; Burlini, N.; Bernasconi, S.; Iriti, M. Phytosterols in grapes and wine, and effects of agrochemicals on their levels. Food Chem. 2013, 141, 3473–3479. [Google Scholar] [CrossRef]
- Díaz-Hellín, P.; Gómez-Alonso, S.; Borrull, A.; Rozès, N.; Cordero-Otero, R.; Úbeda, J. Membrane lipid variability in Saccharomyces cerevisiae wine strains rehydrated in the presence of metabolic activators. J. Agric. Food Chem. 2014, 62, 8679–8685. [Google Scholar] [CrossRef]
- Chiu, H.-H.; Tsai, S.-J.; Tseng, Y.J.; Wu, M.-S.; Liao, W.-C.; Huang, C.-S.; Kuo, C.-H. An efficient and robust fatty acid profiling method for plasma metabolomic studies by gas chromatography–mass spectrometry. Clin. Chim. Acta 2015, 451, 183–190. [Google Scholar] [CrossRef] [PubMed]
- Klavina, L.; Kviesis, J. Solid Phase Extraction of Bryophyte Lipids / Briofītu lipīdu cietfāzes ekstrakcijas frakcionēšana. Mater. Sci. Appl. Chem. 2015, 32, 58–67. [Google Scholar] [CrossRef] [Green Version]
- Beltran, G.; Novo, M.; Guillamón, J.M.; Mas, A.; Rozès, N. Effect of fermentation temperature and culture media on the yeast lipid composition and wine volatile compounds. Int. J. Food Microbiol. 2008, 121, 169–177. [Google Scholar] [CrossRef]
- Alexandre, H.; Rousseaux, I.; Charpentier, C. Relationship between ethanol tolerance, lipid composition and plasma membrane fluidity in Saccharomyces cerevisiae and Kloeckera apiculata. FEMS Microbiol. Lett. 1994, 124, 17–22. [Google Scholar] [CrossRef] [PubMed]
- Le fur, Y.; Hory, C.; Bard, M.H.; Olsson, A. Evolution of phytosterols in Chardonnay grape berry skins during last stages of ripening. Vitis 1994, 33, 127–131. [Google Scholar]
- Hosono, K. Effect of salt stress on lipid composition and membrane fluidity of the salt tolerant yeast Zygosaccharomyces rouxii. J. Gen. Microbiol. 1992, 138, 91–96. [Google Scholar] [CrossRef] [Green Version]
- Aloklah, B.; Alhajali, A.; Yaziji, S. Identification of some yeasts fatty acid profiles. Pol. J. Microbiol. 2014, 63, 467–472. [Google Scholar] [CrossRef] [PubMed]
- Grillitsch, K.; Tarazona, P.; Klug, L.; Wriessnegger, T.; Zellnig, G.; Leitner, E.; Feussner, I.; Daum, G. Isolation and characterization of the plasma membrane from the yeast Pichia pastoris. Biochim. Biophys. Acta (BBA) Biomembr. 2014, 1838, 1889–1897. [Google Scholar] [CrossRef] [PubMed] [Green Version]
- Yunoki, K.; Yasui, Y.; Hirose, S.; Ohnishi, M. Fatty acids in must prepared from 11 grapes grown in Japan: Comparison with wine and effect on fatty acid ethyl ester formation. Lipids 2005, 40, 361–367. [Google Scholar] [CrossRef]
- Delfini, C.; Cocito, C.; Ravaglia, S.; Conterno, L. Influence of clarification and suspended grape solid materials on sterol content of free run and pressed grape musts in the presence of growing yeast cells. Am. J. Enol. Vitic. 1993, 44, 452–458. [Google Scholar]
- Pérez-Navarro, J.; Da Ros, A.; Masuero, D.; Izquierdo-Cañas, P.M.; Hermosín-Gutiérrez, I.; Gómez-Alonso, S.; Mattivi, F.; Vrhovsek, U. LC-MS/MS analysis of free fatty acid composition and other lipids in skins and seeds of Vitis vinifera grape cultivars. Food Res. Int. 2019, 125, 108556. [Google Scholar] [CrossRef]
- Lucarini, M.; Durazzo, A.; Kiefer, J.; Santini, A.; Lombardi-Boccia, G.; Souto, E.; Romani, A.; Lampe, A.; Nicoli, S.F.; Gabrielli, P.; et al. Grape seeds: Chromatographic profile of fatty acids and phenolic compounds and qualitative analysis by FTIR-ATR spectroscopy. Foods 2019, 9, 10. [Google Scholar] [CrossRef] [Green Version]
- Cocito, C.; Delfini, C. Experiments for developing selective clarification techniques: Sterol and fatty acid loss from grape must related to clarification technique. J. Wine Res. 1997, 8, 187–197. [Google Scholar] [CrossRef]
- Ohnishi, M.; Hirose, S.; Kawaguchi, M.; Ito, S.; Fujino, Y. Chemical composition of lipids, especially triacylglycerol, in grape seeds. Agric. Biol. Chem. 1990, 54, 1035–1042. [Google Scholar] [CrossRef] [Green Version]
- Henschke, P.A.; Jiranek, V. Yeast: Metabolism of nitrogen compounds. In Wine Microbiology and Biotechnology; Harwood Academie: Lausanne, Switzerland, 1993; pp. 77–164. ISBN 0-415-27850-3. [Google Scholar]
- Bely, M.; Sablayrolles, J.-M.; Barre, P. Automatic detection of assimilable nitrogen deficiencies during alcoholic fermentation in oenological conditions. J. Ferment. Bioeng. 1990, 70, 246–252. [Google Scholar] [CrossRef]
- Williams, C.; Buica, A. Comparison of an offline SPE–GC–MS and online HS–SPME–GC–MS method for the analysis of volatile terpenoids in wine. Molecules 2020, 25, 657. [Google Scholar] [CrossRef] [PubMed] [Green Version]
- Smart, K.F.; Aggio, R.B.M.; Van Houtte, J.R.; Villas-Boas, S.G. Analytical platform for metabolome analysis of microbial cells using methyl chloroformate derivatisation GCMS. Nat. Protoc. 2010, 5, 1709. [Google Scholar] [CrossRef] [PubMed]
- Han, X.; Gross, R.W. Shotgun lipidomics: Electrospray ionization mass spectrometric analysis and quantitation of cellular lipidomes directly from crude extracts of biological samples. Mass Spectrom. Rev. 2004, 24, 367–412. [Google Scholar] [CrossRef] [PubMed]
- Ishikawa, T.; Yoshizawa, K. Effects of cellular fatty acids on the formation of flavor esters by saké yeast. Agric. Biol. Chem. 1979, 43, 45–53. [Google Scholar] [CrossRef] [Green Version]
- Lopes, T.I.B.; Rimland, C.A.; Nagassaki, S.; Geloneze, B.; Marsaioli, A.J. A chemometric model applied to fatty acid determination in blood. J. Braz. Chem. Soc. 2013, 24, 1599–1605. [Google Scholar] [CrossRef]
- Esteki, M.; Simal-Gandara, J.; Shahsavari, Z.; Zandbaaf, S.; Dashtaki, E.; Heyden, Y.V. A review on the application of chromatographic methods, coupled to chemometrics, for food authentication. Food Control. 2018, 93, 165–182. [Google Scholar] [CrossRef]
- Thurnhofer, S.; Vetter, W. A Gas chromatography/electron ionization−mass spectrometry−selected ion monitoring method for determining the fatty acid pattern in food after formation of fatty acid methyl esters. J. Agric. Food Chem. 2005, 53, 8896–8903. [Google Scholar] [CrossRef]
- Nasution, O.; Lee, Y.M.; Kim, E.; Lee, Y.; Kim, W.; Choi, W. Overexpression of OLE1 enhances stress tolerance and constitutively activates the MAPK HOG pathway in Saccharomyces cerevisiae. Biotechnol. Bioeng. 2017, 114, 620–631. [Google Scholar] [CrossRef]
- Aguilera, F.; Peinado, R.; Millán, C.; Ortega, J.; Mauricio, J.C. Relationship between ethanol tolerance, H+-ATPase activity and the lipid composition of the plasma membrane in different wine yeast strains. Int. J. Food Microbiol. 2006, 110, 34–42. [Google Scholar] [CrossRef]


| Stage | Aim | Sample Type | Matrix/Solvent | Parameters Tested | Observations |
|---|---|---|---|---|---|
| 1 | GC-MS optimization | Standard mixtures | Chloroform | Separation | Derivatization well documented in the literature |
| MS parameters | |||||
| MS dynamic range | |||||
| 2 | Extraction optimization | Standard mixtures | YNB medium | Volume (sample, solvent, aliquot) | GC-MS optimized in stage 1 |
| Yeast (one strain) | Pellet size, solvent volume, aliquot | Any additional compounds of interest? | |||
| SGM | Volume (sample, solvent, aliquot) | Any additional compounds of interest? | |||
| 3 | Method testing | Standard mixtures | YNB medium | Performance parameters | Reference, non-interfering matrix |
| Yeast (various strains) | - | ||||
| SGM | - | ||||
| 4 | Applications | Real samples from fermentation experiments | |||
| Lipid Name (Detected as TMS Derivative) | Lipid Name in Abbreviated Form (TMS Derivative) | Compound Molecular Weight (Underivatized) | Retention Time (Min) | Quantifier Ion (m/z) | Qualifier Ion (m/z) |
|---|---|---|---|---|---|
| Myristic acid | C14:0 | 228.37 | 11.28 | 285.2 | 300.3 |
| Palmitoleic acid | C16:1 | 254.41 | 13.72 | 311.1 | 129.0 |
| Palmitic acid | C16:0 | 256.4 | 14.00 | 313.3 | 328.3 |
| Linoleic acid | C18:2 | 280.45 | 16.49 | 73.1 | 337.3 |
| Oleic acid | C18:1 | 282.47 | 16.58 | 73.1 | 339.3 |
| Linolenic acid | C18:3 | 278.43 | 16.61 | 75.1 | 335.2 |
| Stearic acid | C18:0 | 284.48 | 16.97 | 341.3 | 297.3 |
| Nonadecanoic acid (IS) | C19:0 | 298.5 | 18.47 | 117.0 | 370.3 |
| Squalene | C30H50 | 414.71 | 25.98 | 117.0 | 355.3 |
| Cholesterol (IS) | C27H46O | 386.65 | 28.33 | 129.1 | 458.4 |
| Ergosterol | C28H44O | 396.65 | 28.88 | 253.2 | 363.3 |
| β-Sitosterol | C29H50O | 414.71 | 29.61 | 129.1 | 396.4 |
| Analyte | Calibration Range (mg/L) | R2 | LOD (μg/L) | LOQ (μg/L) | Recovery (%) at 1 mg/L | Recovery (%) at 10 mg/L | Extraction Repeatability (RSD %) at 1 mg/L | Extraction Repeatability (RSD %) at 10 mg/L |
|---|---|---|---|---|---|---|---|---|
| YNB | ||||||||
| Myristic acid | 0.5–50 | 0.9996 | 4.3 | 14.2 | 70.7 | 93.58 | 12.24 | 6.72 |
| Palmitoleic acid | 0.5–50 | 0.9992 | 35.5 | 118.3 | 81.5 | 84.45 | 4.53 | 7.13 |
| Palmitic acid | 0.5–50 | 0.999 | 1.4 | 4.7 | 90.65 | 132.67 | 16.44 | 18.55 |
| Linoleic acid | 0.5–50 | 0.9997 | 15.1 | 50.2 | 103.59 | 97.96 | 4.27 | 4.82 |
| Oleic acid | 0.5–50 | 0.9994 | 37.2 | 124.0 | 95.43 | 97.99 | 9.83 | 6.74 |
| Linolenic acid | 0.5–50 | 0.9987 | 58.5 | 195.1 | 95.10 | 99.09 | 2.24 | 4.85 |
| Stearic acid | 0.5–50 | 0.9996 | 6.8 | 22.6 | 91.91 | 87.11 | 10.38 | 12.82 |
| Squalene | 0.5–50 | 1 | 62.0 | 206.5 | 119.56 | 103.03 | 7.59 | 2.88 |
| Ergosterol | 0.5–50 | 1 | 94.3 | 314.3 | 102.44 | 101.53 | 9.15 | 1.40 |
| ß-sitosterol | 0.5–50 | 0.9996 | 474.9 | 1583.0 | 132.54 | 112.94 | 2.77 | 1.94 |
| SGM | ||||||||
| Myristic acid | 0.5–50 | 0.9991 | 0.7 | 2.3 | 141.29 | 118.37 | 5.76 | 6.83 |
| Palmitoleic acid | 0.5–50 | 0.9987 | 3.0 | 10.0 | 105.29 | 117.35 | 4.07 | 8.18 |
| Palmitic acid | 0.5–50 | 0.9996 | 0.1 | 0.2 | 110.31 | 75.37 | 17.36 | 14.97 |
| Linoleic acid | 0.5–50 | 0.9986 | 11.8 | 39.3 | 96.53 | 111.63 | 5.20 | 6.25 |
| Oleic acid | 0.5–50 | 0.9977 | 35.0 | 116.5 | 104.78 | 113.56 | 10.12 | 9.74 |
| Linolenic acid | 0.5–50 | 0.9979 | 61.3 | 204.4 | 105.15 | 112.42 | 3.51 | 6.05 |
| Stearic acid | 0.5–50 | 0.9988 | 0.8 | 2.5 | 108.80 | 114.80 | 14.66 | 5.41 |
| Squalene | 0.5–50 | 0.9999 | 9.2 | 30.6 | 83.64 | 96.94 | 4.00 | 16.84 |
| Ergosterol | 0.5–50 | 1 | 12.2 | 40.7 | 97.61 | 107.36 | 4.73 | 8.76 |
| ß-sitosterol | 0.5–50 | 0.9991 | 66.8 | 222.6 | 75.45 | 97.68 | 4.19 | 8.57 |
| Direct injection (Yeast) | ||||||||
| Myristic acid | 0.2–50 | 0.9984 | 0.0 | 0.2 | n/a | n/a | 8.53 | 8.61 |
| Palmitoleic acid | 0.2–50 | 0.9984 | 0.1 | 0.3 | n/a | n/a | -- * | -- * |
| Palmitic acid | 0.2–50 | 0.9985 | 0.0 | 0.1 | n/a | n/a | 13.39 | 6.39 |
| Linoleic acid | 0.2–50 | 0.9989 | 4.3 | 14.4 | n/a | n/a | 6.52 | 6.59 |
| Oleic acid | 0.2–50 | 0.999 | 5.7 | 18.9 | n/a | n/a | 6.52 | 5.02 |
| Linolenic acid | 0.2–50 | 0.9994 | 4.8 | 15.9 | n/a | n/a | 3.13 | 5.89 |
| Stearic acid | 0.2–50 | 0.9982 | 0.1 | 0.3 | n/a | n/a | 5.63 | 5.24 |
| Squalene | 0.2–50 | 0.9995 | 0.7 | 2.3 | n/a | n/a | -- * | -- * |
| Ergosterol | 0.2–50 | 0.9962 | 0.3 | 1.1 | n/a | n/a | 8.83 | 1.56 |
| ß-sitosterol | 0.2–50 | 0.9994 | 1.8 | 5.9 | n/a | n/a | 13.42 | 6.42 |
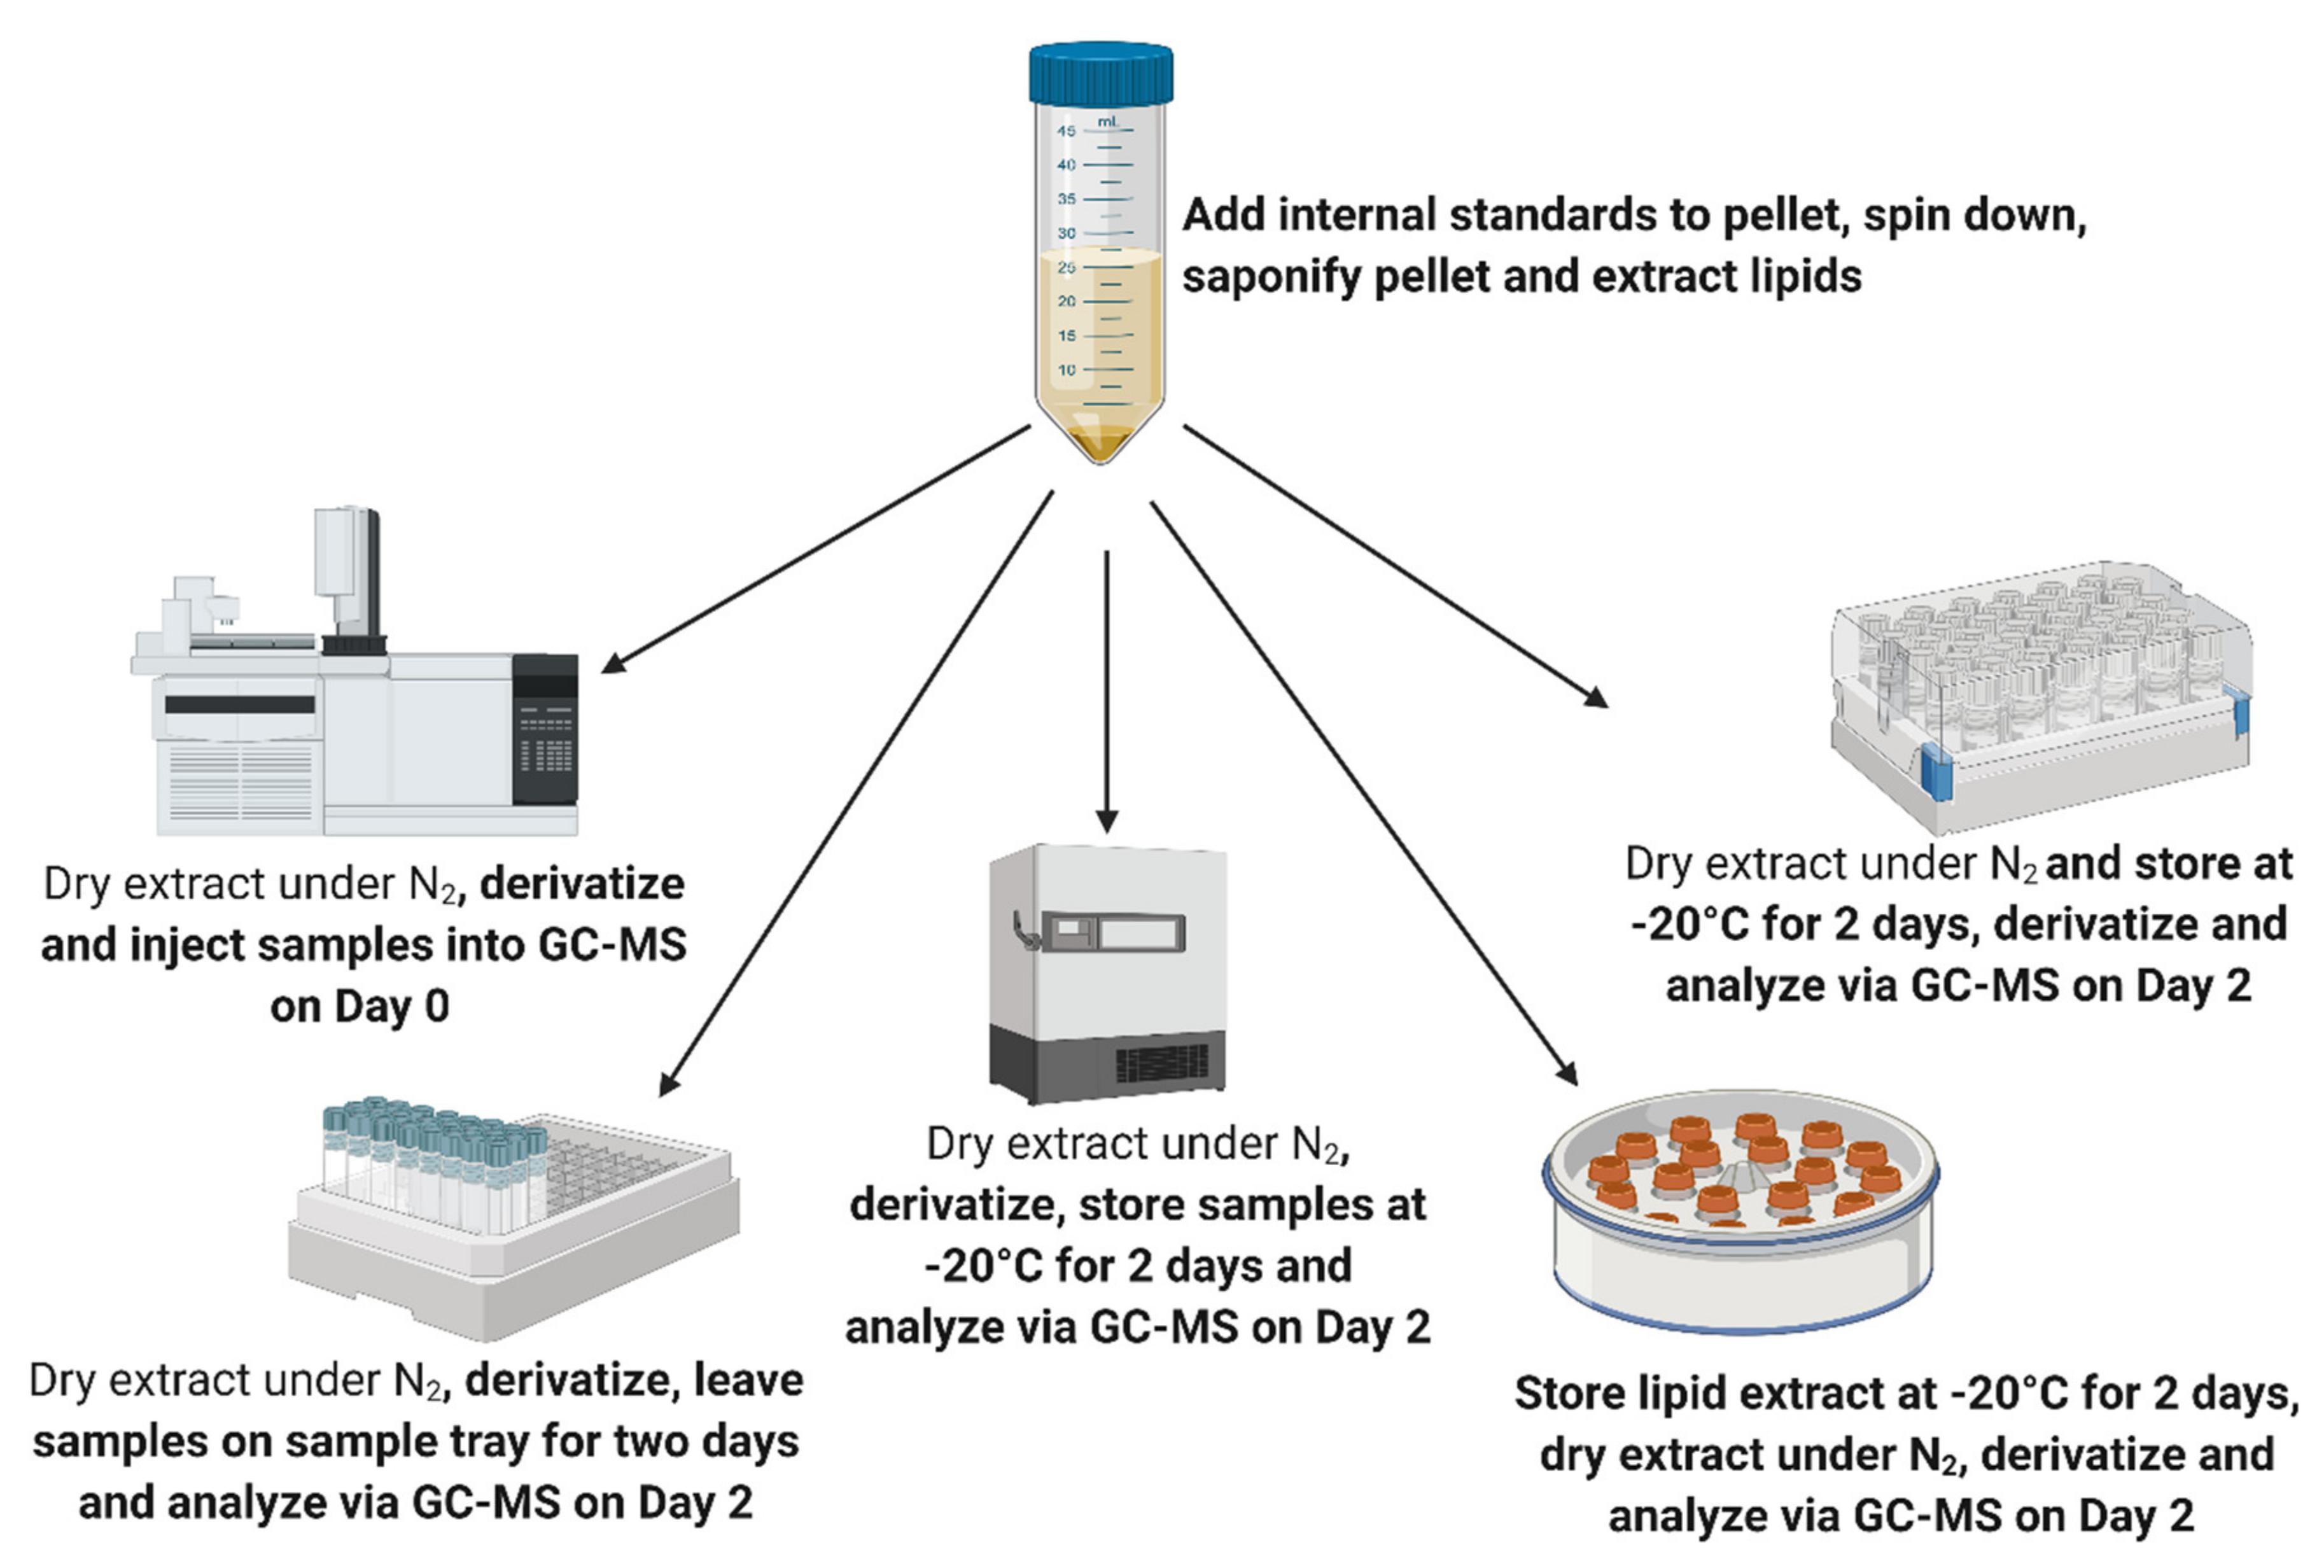
| Analyte | 48 h Sample Tray | Extract Dried, Derivatised, Stored at −20 °C for 48 h | Extract Stored in Chloroform 48 h at −20 °C, Dried, Derivatised after 48 h | Extract Dried, Stored at −20 °C, Derivatised after 48 h |
|---|---|---|---|---|
| Myristic acid | 10.34 | 2.97 | 4.61 | 5.07 |
| Palmitoleic acid | - | - | - | - |
| Palmitic acid | 10.46 | 3.46 | 6.44 | 6.00 |
| Linoleic acid | 3.93 | 0.82 | 19.16 | 0.35 |
| Oleic acid | 8.40 | 2.33 | 3.70 | 3.84 |
| Linolenic acid | 3.89 | 3.66 | 15.64 | 2.22 |
| Stearic acid | 13.94 | 9.28 | 11.67 | 10.50 |
| Squalene | - | - | - | - |
| Ergosterol | 3.43 | 11.09 | 11.89 | 12.26 |
| ß-sitosterol | 33.37 | 34.82 | 35.13 | 36.84 |
Publisher’s Note: MDPI stays neutral with regard to jurisdictional claims in published maps and institutional affiliations. |
© 2021 by the authors. Licensee MDPI, Basel, Switzerland. This article is an open access article distributed under the terms and conditions of the Creative Commons Attribution (CC BY) license (https://creativecommons.org/licenses/by/4.0/).
Share and Cite
Williams, C.; Mbuyane, L.L.; Bauer, F.F.; Mokwena, L.; Divol, B.; Buica, A. A Gas Chromatography-Mass Spectrometry Method for the Determination of Fatty Acids and Sterols in Yeast and Grape Juice. Appl. Sci. 2021, 11, 5152. https://doi.org/10.3390/app11115152
Williams C, Mbuyane LL, Bauer FF, Mokwena L, Divol B, Buica A. A Gas Chromatography-Mass Spectrometry Method for the Determination of Fatty Acids and Sterols in Yeast and Grape Juice. Applied Sciences. 2021; 11(11):5152. https://doi.org/10.3390/app11115152
Chicago/Turabian StyleWilliams, Cody, Lethiwe L. Mbuyane, Florian F. Bauer, Lucky Mokwena, Benoit Divol, and Astrid Buica. 2021. "A Gas Chromatography-Mass Spectrometry Method for the Determination of Fatty Acids and Sterols in Yeast and Grape Juice" Applied Sciences 11, no. 11: 5152. https://doi.org/10.3390/app11115152