Article

Effect of Cut-Off, Evaluation Length, and Measurement Area in Profile and Areal Surface Texture Characterization of As-Built Metal Additive Manufactured Components

by
Arun Prasanth Nagalingam
1,2,
Moiz Sabbir Vohra
2,
Pulkit Kapur
2 and
Swee Hock Yeo
1,2,*
1
School of Mechanical and Aerospace Engineering, Nanyang Technological University, 50 Nanyang Avenue, Singapore 639798, Singapore
2
Rolls-Royce@NTU Corporate Lab, N3.1-B2a-01, 50 Nanyang Avenue, Singapore 639798, Singapore
*
Author to whom correspondence should be addressed.
Appl. Sci. 2021, 11(11), 5089; https://doi.org/10.3390/app11115089
Submission received: 30 April 2021 / Revised: 27 May 2021 / Accepted: 27 May 2021 / Published: 31 May 2021
(This article belongs to the Special Issue Characterizations of Three-Dimensional Surfaces at Micro/Nanoscale)

Abstract

:
Surface texture characterization of components built using additive manufacturing (AM) remains a challenge. The presence of various asperities and random roughness distributions across a surface poses several challenges to users in selecting an appropriate cut-off wavelength (λc), evaluation length (ln), and measurement area. This paper investigates a modified framework for surface texture characterization of AM components. First, the surface asperities in an AM component were identified through scanning electron microscope (SEM) analyses. The maximum diameter (φm) of the surface asperities were determined through image processing and were used as cut-off for surface texture evaluation. Second, another set of surface texture results were extracted using standard measurement procedures per ISO 4287, 4288, 25178-1, -2, and -3. Third, the investigative measurement framework’s effectiveness and suitability were explored by comparing the results with ISO standard results. Last, the effects of using non-standard cut-off wavelength, evaluation length, and measurement area during surface texture characterization were studied, and their percentage deviations from the standard values were discussed. The key findings prove that (a) the evaluation length could be compromised instead of cut-off, (b) measurement area must be 2.5 times the maximum asperity size present in the surface, and (c) it is possible to identify, distinguish, and evaluate specific features from the AM surface by selecting appropriate filters, thereby characterizing them specifically. The investigations and the obtained results serve as valuable data for users to select appropriate measurement settings for surface texture evaluation of AM components.

1. Introduction

Additive manufacturing (AM) has gained more attention due to its ability to manufacture complex geometries. AM can build components with sizes ranging from a few microns to a few meters [1]. The primary reason for this flexibility is that there is no component-specific tooling required for the build process. As a result, AM techniques have substantially reduced the number of steps in the production process and time to market [2]. However, parts manufactured using AM techniques have poor surface quality. Poor surface quality due to various asperities poses many challenges in surface characterization [3]. With the recent developments and capabilities of surface metrology instruments, complex geometries in AM components can be measured [4]. The measurement techniques adopted to characterize complex AM geometries range from conventional contact stylus profilometers to non-contact areal topography measurement systems, such as confocal microscopes [5], chromatic confocal microscopes [6], focus variation microscopes [7], and X-ray computed tomography (X-CT) [8].
The primary issue is that the as-built AM components consist of a wide range of surface asperities. Some of the asperities that give rise to large surface texture values are loosely attached particles [9], partially melted particles, balling melts, semi-welded structures [7], staircase effects, and melts zones [10,11]. Each asperity varies in its size and shape and thus poses measurement difficulties.
Apart from this, challenges arise while adopting standard measurement procedures for roughness measurements (as per ISO 4288-Section 7 [12] for profile and ISO 25178-2, 3 [13,14] for areal surface texture, respectively) on AM components. Several standard measurement procedures were applied to as-built metal AM components, and their surface characteristics were evaluated. The difficulties and the suitability of the focus variation technique were highlighted. The ability to separate single powder particles using material ratio and spectral density analysis was also highlighted [15]. The difference in surface texture results due to changes in measurement area is evident in the as-built and post-processed conditions [16]. Due to the miniature designs of AM components (branched fuel nozzles [17], cooling channels [16], rocket injectors [18], overhanging and lattice structures), the evaluation length (ln) for texture characterization is insufficient. Due to this reason, many researchers adopted non-standard cut-off wavelength (λc) and evaluation length for measurements. For example, an open porous AM structures’ surface roughness was quantified using modified equations of profile surface texture parameters due to an insufficient evaluation length [8]. On analyzing AM surfaces, it was found that an area of 2.5 mm × 2.5 mm area was enough to characterize the areal surface texture parameters as compared to the 8 mm × 8 mm area proposed by ISO 25178. From the analysis performed, a λc of 2.5 mm was sufficient to measure AM surfaces having Ra values that require a λc of 8 mm. However, the implications of using such a non-standard cut-off and the deviations in profile roughness measurements were left unexplored [7]. It was also found that measurements were performed that were non-conforming to ISO 4288 recommendations (specifies λc 8 mm and ln 40 mm for roughness 10 µm < Ra ≤ 80 µm) by using a λc of 2.5 mm and ln of 12.5 mm for Ra > 10 µm due to insufficient sample length [19].
A two-axis profilometer was used to scan a rectangular surface area (1 mm × 5 mm), non-conforming to ISO 25178, to determine the areal surface texture parameters [6]. Profile surface texture of AM overhanging structures was investigated using non-contact measurements by applying a λc and ln of 0.8 mm and 4 mm, respectively, for Ra of 15 µm–25 µm [20]. Due to part complexity, curved internal surfaces of direct metal laser sintered (DMLS) components were characterized before and after surface finishing by measuring non-standard areas (3 mm × 1 mm and 5 mm × 1.5 mm) [21]. Selective laser sintering (SLS) and selective laser melting (SLM) of surfaces with Ra > 10 µm were characterized using confocal microscopy (with λc of 1 mm) and a contact stylus (with λc of 2.5 mm and ln of 12.5 mm) to develop an auto-correlation function [5]. A multi-scale analysis of the as-built AM surface was characterized using 3.22 mm × 1 mm, before and after heat treatments for comparison [22].
It is understood from the above review that researchers encounter measurement difficulties due to insufficient evaluation lengths and measurement areas in complex AM components to characterize surface textures using ISO standards. Therefore, measurements have to be performed with certain modifications in the guidelines defined by ISO standards. If the measurements performed do not conform to ISO standards, some important questions must be addressed before the results can be accepted with certainty. The following points highlight the challenges, issues, and questions encountered in industrial and academic domains while characterizing AM surfaces.
(1)
Challenges in measuring as-built AM component surface (issues in selecting the appropriate cut-off wavelength and evaluation length). What proper evaluation length and cut-off filter to use for measurement in case of insufficient measurement length?
(2)
Will the results be affected by using different measurement cut-off and evaluation lengths than suggested under ISO 4288?
(3)
How to interpret the resulting surface roughness obtained by using cut-off and evaluation length suggested by ISO?
(4)
What is the deviation in the resulting roughness values obtained by selecting non-recommended cut-off, evaluation length, and nesting index values contrary to ISO standards?
(5)
Is it possible to obtain useful measurable information from scanning electron microscope (SEM) analysis on the as-built AM surfaces?
By addressing the above questions, this study aims to provide appropriate answers to users on (a) the effect of using non-standard measurement settings during as-built surface characterization, (b) the measurement settings (cut-off, evaluation length, or measurement area) that can be compromised without significant changes in the results, and (c) select the appropriate settings to understand surface features of interest.
This study proposes a modified measurement framework to characterize the surface texture of as-built AM components using profile and areal surface texture analysis to address the above points. A survey conducted in 2017 showed that parameters Ra, Rq, and Rz (for profile) and Sa, Sz (for areal) are widely adopted to quantify surface textures [23]. Therefore, for characterizing AM surfaces in this study, profile and areal surface texture parameters were limited to Ra, Rq, Rz, and Sa, Sz, respectively. First, the AM surfaces were subjected to qualitative analysis (SEM imaging) to understand the surface asperities. Image processing techniques were used to identify different surface asperities based on the SEM images’ size variations. The maximum diameter (φm) values were determined and used to calculate the cut-off during surface roughness measurements. The resulting roughness and waviness of the surface were analyzed accordingly. Second, the surface was measured using standard profile and areal surface texture characterization procedures specified by ISO 4287 [24], ISO 4288, and ISO 25178-1, -2, and -3. The resulting profile surface texture parameters were studied by calculating the percentage deviation from the standard results. The standard value is selected based on the recommendation laid under ISO 4288. Last, the suitability of the investigative framework for AM surface texture characterization is discussed.

2. Manufacturing and Measurement Techniques

2.1. Manufacturing Method and Materials

In this investigation, components manufactured from four different materials and four different AM techniques were selected to characterize their surface textures. Different materials and AM processes were selected to validate the feasibility of the investigative measurement framework. The details of the AM techniques, their process parameters, and the post-processing done on the as-built components are given in Table 1. The components’ build orientation was 90 degrees, and their side surfaces were considered for all the measurements.

2.2. Qualitative Analysis

SEM (JSM5600LV, JEOL, Japan) images were taken at different magnifications to understand the surface morphology. From the SEM images, asperities present in the as-built AM surface were identified and explained based on their size differences. Additionally, the φm of each irregularity (loosely attached powders, partially melted powders, and semi-welded structures) was extracted using a suitable image processing technique. However, it should be noted that SEM images are difficult to calibrate and size measurements from the images also possess difficulties due to imaging artifacts.

2.3. Quantitative Analysis

Profile surface texture measurements (contact profilometer—2 µm diamond tip radius and 60° tip angle) (SJ-400, Mitutoyo, Japan), and areal surface texture measurements (laser scanning—2 µm spot diameter) (Talyscan 150, Taylor-Hobson, UK) were used to quantify the surfaces under study. All the major industrial and academic questions (refer to Section 1) were addressed by examining the roughness profile at various λc and ln’s. The outcomes from each case are elaborately discussed. The waviness of AM components is often ignored during surface quantification. Nevertheless, in this study, the resulting waviness and roughness topography at each filtering condition are presented, and the method proposed to understand the resulting topography is explained.

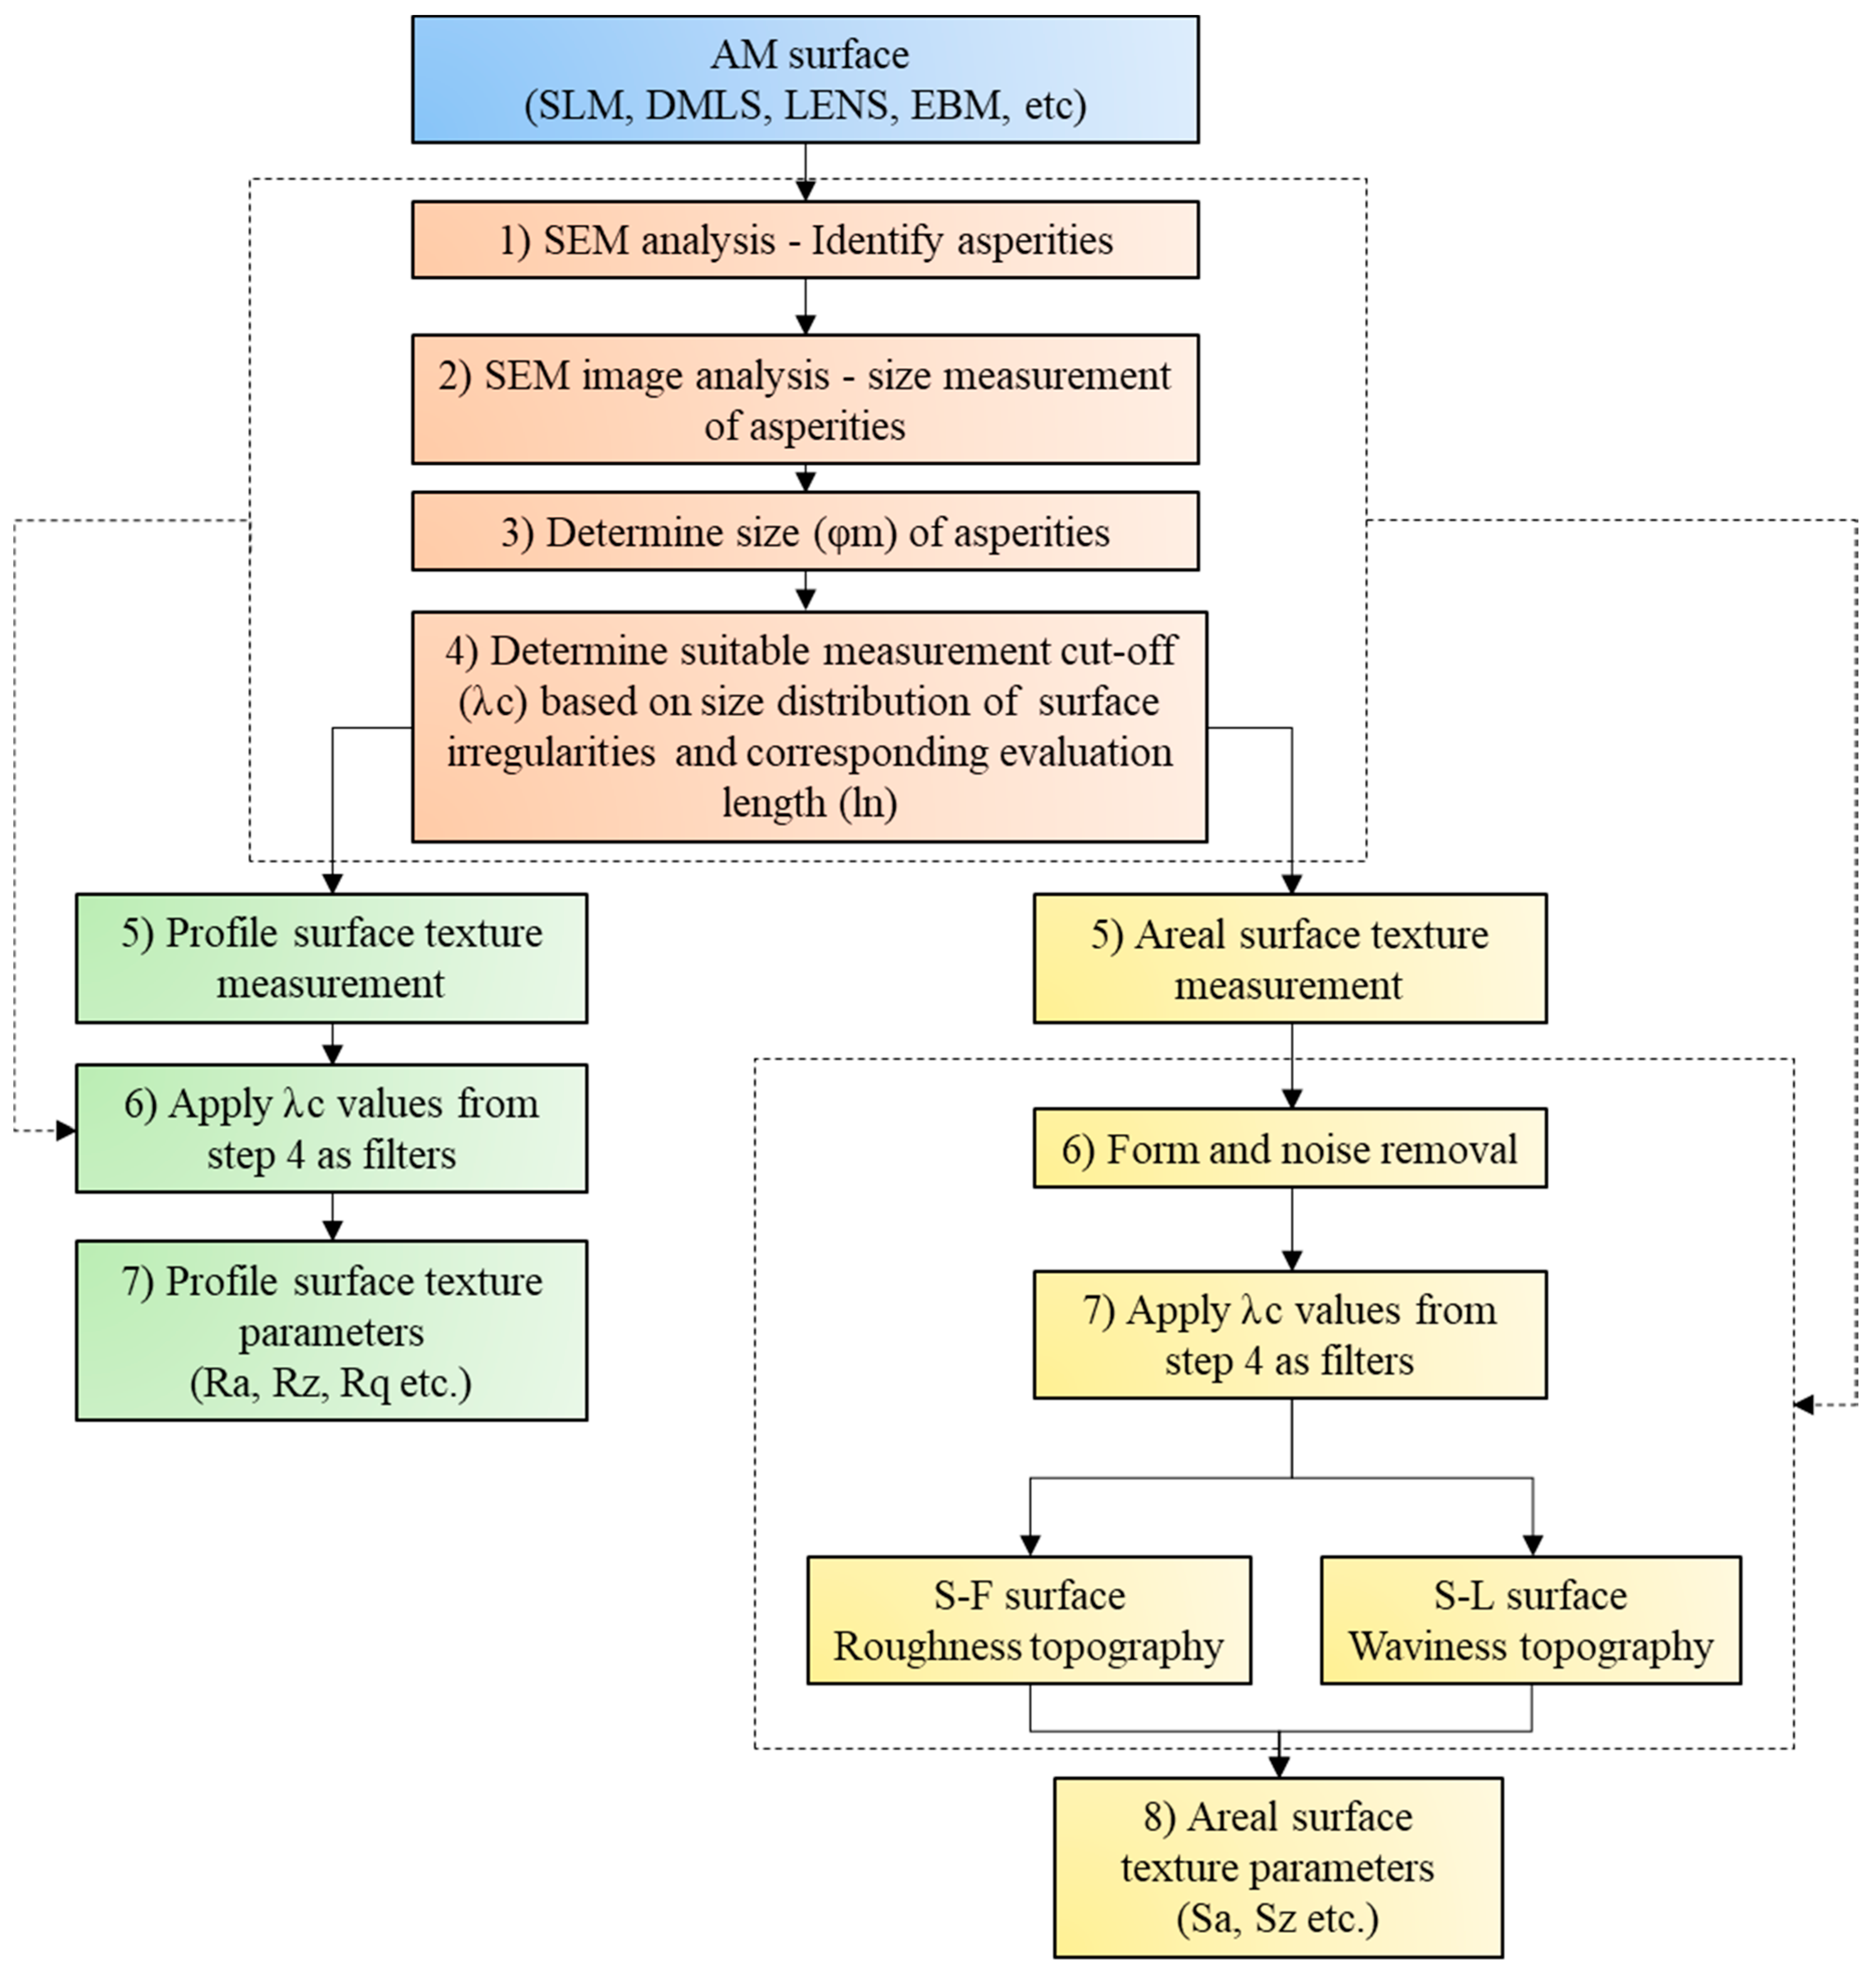
2.4. Investigative Measurement Framework

The existing measurement procedure to evaluate profile surface texture per ISO 4288 is that, during profile surface texture analysis, the surface under investigation is tested using a contact/non-contact based profilometer by visually estimating a specific Ra and selecting λc/ln accordingly. The Ra results from the initial measurement would then be analyzed, and a suitable λc/ln was selected based on the results obtained. The suitable λc/ln specified in ISO standard is followed throughout to perform the profile surface texture analysis. In the areal surface texture analysis, ISO 25178-2 and ISO 25178-3 do not specify any fixed area or cut-off. Hence, the cut-off wavelength values from ISO 4288 were used as length and width for areal surface roughness measurement. Since a Gaussian filter was used by default in the measurement systems, which transmits 90 % at a selected λc [21], it can effectively capture features of interest in the roughness or waviness profile.
The existing ISO measurement framework is modified to overcome the above-mentioned challenges.
The steps to be followed in the investigative framework are shown in Figure 1. Steps 1 to 5 in the investigative framework are in addition to the existing ISO standard measurement procedures and form the basis for selecting cut-off values. In the investigative framework, prior to performing the surface texture analysis, surface morphology (SEM image) of the as-built AM components must be understood. Identification and measurement of the surface asperities present on an AM component through SEM analysis aids in selecting the proper filtering conditions (λc and ln) and the measurement area for surface texture analysis.
Step 1: First, perform SEM analysis of the surface. Identify the asperities present and categorize them.
Step 2: Perform an image analysis and measure the size of asperities that are of interest.
Step 3: Quantify the size (φm) distribution of each type of asperity individually.
Step 4: Based on the results obtained, use the suitable φm particularly of interest to select λc (2 * φm = λc) for surface roughness measurements. Select ln to be at least five times the cut-off (λc). During areal measurements, always select the sides (length) of the square area five times the cut-off wavelength selected from the above steps to capture sufficient asperities effectively.
Step 5: Measure the profile and areal surface roughness of the component using the contact/non-contact profilometers.
Step 6: After the measurements: (a) for profile surface texture analysis, perform leveling operation and apply the selected λc value from step 4 to obtain the profile waviness and roughness results; (b) for areal surface texture analysis, perform the form and noise removal operation first and apply the λc value from step 4 for filtering.
Step 7: After filtering, waviness and roughness profile/areal topography were obtained. The resulting roughness profile/areal topography contains wavelengths less than the λc value, and the waviness profile/areal topography contains wavelengths larger than the λc value. This indicates that the resulting profile/areal surface topography results contain the errors majorly due to particular wavelengths in the respective roughness (wavelength errors less than λc) and waviness (wavelength errors greater than λc) profile/areal surfaces. (Note that determining the accurate size distribution of asperities might be limited due to overlapping asperities in AM components, SEM resolution, and image analysis technique. However, the user can follow any technique apart from SEM image analysis that might be more accurate and suitable to determine the size distribution of the asperities present in the surface. This technique is only efficient if the interest lies in specific types of asperities rather than multiple types of asperities. However, categorizing the asperities based on size and selecting a suitable λc can help understand each asperity separately.)
Figure 2 shows the effect of applied λc and the resulting output topographies. Initially, the AM surface is measured, and a profile/topography is obtained. The resulting surface is known as an S-F surface. The S-F surface contains errors largely due to loosely attached particles, partially melted particles, balling melts, semi-welded structures, staircase effect, etc.
The suitable φm found from SEM image processing is selected and used to calculate and apply a high pass filter (λc = 2 × φm). The high pass filter removes the higher wavelengths above the selected filter value from the surface. The resulting topography will have the presence of wavelengths lower than the selected filter value.

3. Results and Discussion

The components built using various AM techniques are subjected to qualitative and quantitative measurements, as discussed in Section 2. The maximum diameter of the asperities present on the surface is quantified from SEM analysis. Cut-off wavelength and evaluation length values for profile and areal surface texture measurements are selected based on the asperities’ maximum diameter. The results obtained from each measurement condition are analyzed and discussed.

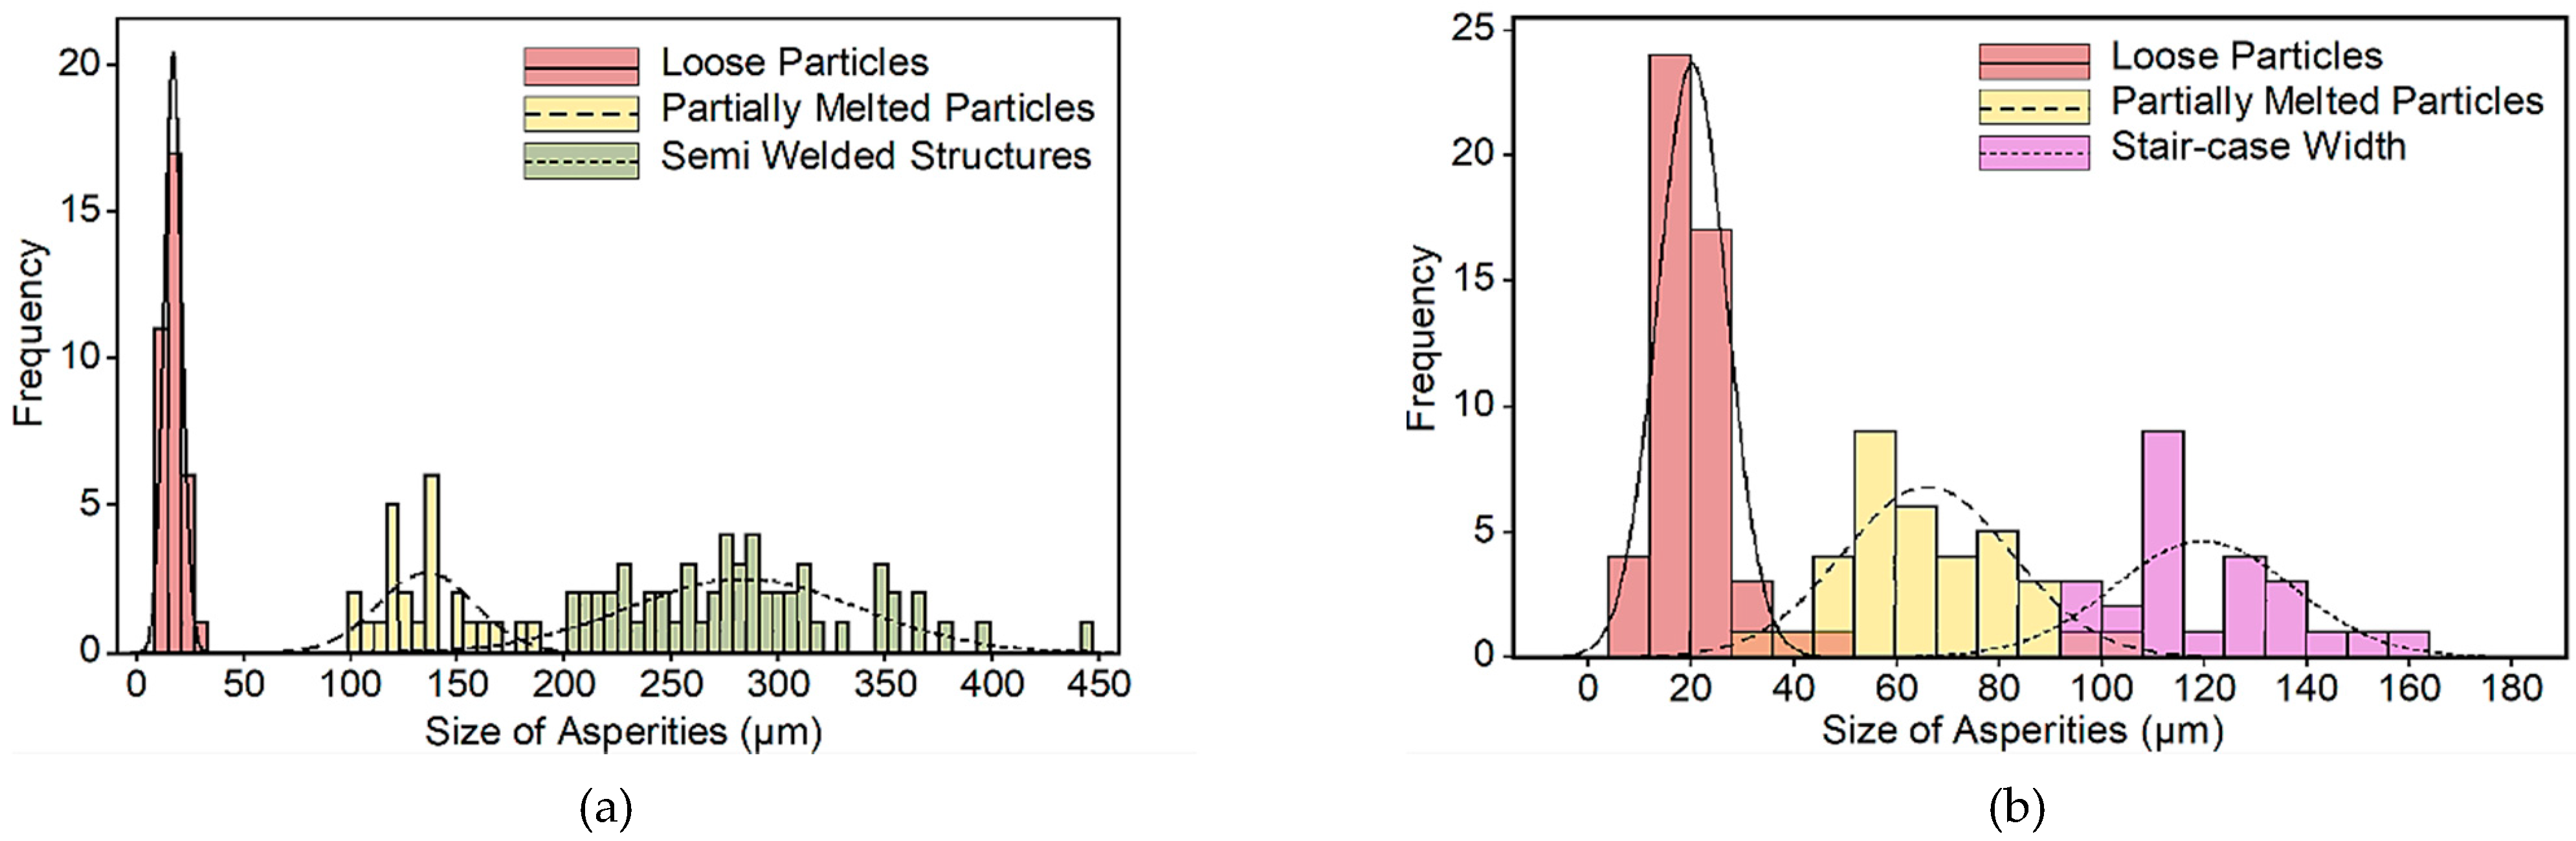
3.1. Scanning Electron Microscope (SEM) Analysis

The surface morphology of as-built AM components from four different AM techniques is shown in Figure 3. Irregularities such as loosely attached powders, partially melted powders, balling melts, semi-welded structures, staircase effect, and melt zones due to heat treatment are identified based on the size difference, nature of the irregularity (loose powder or partial melts) [8,18]. Currently, these irregularities are of high interest to researchers working in AM domain. Mostly the data available in SEM analysis are under-used or not given much attention. Figure 3 shows the asperities, such as loosely attached particles (SLM, DMLS, LENS), partially melted powders (SLM, DMLS, EBM, LENS), balling melts/semi-welded structures (SLM, DMLS, EBM), staircase effect (SLM, DMLS, LENS) and melt zones due to heat treatment (DMLS, EBM) identified in the surfaces under investigation. (Note that categorizing each type of irregularity may vary from user to user, some asperities in AM components overlap on each other and are difficult to separate. This is considered a challenge in this technique.)

Size Distribution of Surface Irregularities

SEM images provide clear visual evidence of the asperities present on any surface. SEM images of AM components can be used to understand the shape and size of each type of asperity present on the surface. The φm of the asperities are identified through image processing using ImageJ (open-source image processing software). Five SEM images are analyzed. Figure 4 shows the steps followed to determine φm. Raw SEM images were converted into an 8-bit image, and the outlines were enhanced via a built-in function in the software ImageJ. Figure 4b shows the resulting image after enhancing the outline of the asperities present. Figure 4c shows the method of φm measurement of a single structure. Since most of the asperities present are irregular in shape, φm is calculated by drawing a circle with a diameter as shown in Figure 4d equal to the largest length available in a single structure. Asperities present in five different SEM images are measured using this technique, and the frequency of occurrence was obtained for each type of asperity.
From the image processing analysis, the various types of asperities identified in each AM process and their frequency of occurrence are shown in Figure 5. The frequency of smaller-sized asperities in all the AM techniques is high (five times more) than larger-sized asperities.
The calculated maximum diameter of each type of asperity present in an AM surface is given in Table 2. It can be noticed that the standard deviations of the results in Table 2 are high. This is because the size of asperities present in the component depends mainly on the AM process conditions. The measurement values (φm) can be used to calculate filtering values in profile and areal surface texture measurements to filter out each type of asperity from the AM surface. The following section will explain the significance of measuring φm of asperity present on the surface.

3.2. Profile Surface Texture Analysis

The profile surface texture parameters Ra, Rq, and Rz were calculated using Equations (1)–(3) as specified in Section 4.2 of ISO 4287. ISO 4288 specifies a λc of 8 mm and ln of 40 mm to measure a surface with a roughness of Ra 10 µm and above. Due to stringent design strategies, in most cases, the components do not have sufficient evaluation length (Equation (1)) or transverse length (lt) due to stylus pre and post-travel lengths (Equation (2)). Hence, a λc and ln of 2.5 mm and 12.5 mm, respectively, are selected. Therefore, in this study, a λc of 2.5 mm and ln of 12.5 mm are taken as the reference values and compared to the percentage deviation of roughness values at other sampling and evaluation lengths. Ten repeated readings are taken along the surface, and the roughness results with the standard deviation in the measurement are provided in Table 3.
l n = λ c 5
l t = λ c 5 + ( λ c 2 ) S pre + ( λ c 2 ) S post

3.2.1. Profile Surface Measurements—Effect of Various Cut-Off Wavelength and Evaluation Length

Profile measurements were taken for various λc and ln on different AM-built surfaces. A total of ten repeated measurements were taken along the surface. The roughness results obtained and the standard deviations for each set of measurements (Case 1 to 7) are given in Table 4. For a λc of 8 mm and ln of 12.5 mm, the minimum transverse length would be 20.5 mm (from Equation (2)). Therefore, for SLM and LENS surfaces, λc/ln of 8/12.5 was not performed due to insufficient length. The resulting profile surface texture parameters—Ra, Rq, and Rz, were reported for all other conditions. These results were compared to the results obtained using standard λc and ln as mentioned in ISO 4288, and the percentage deviation between each condition was calculated.

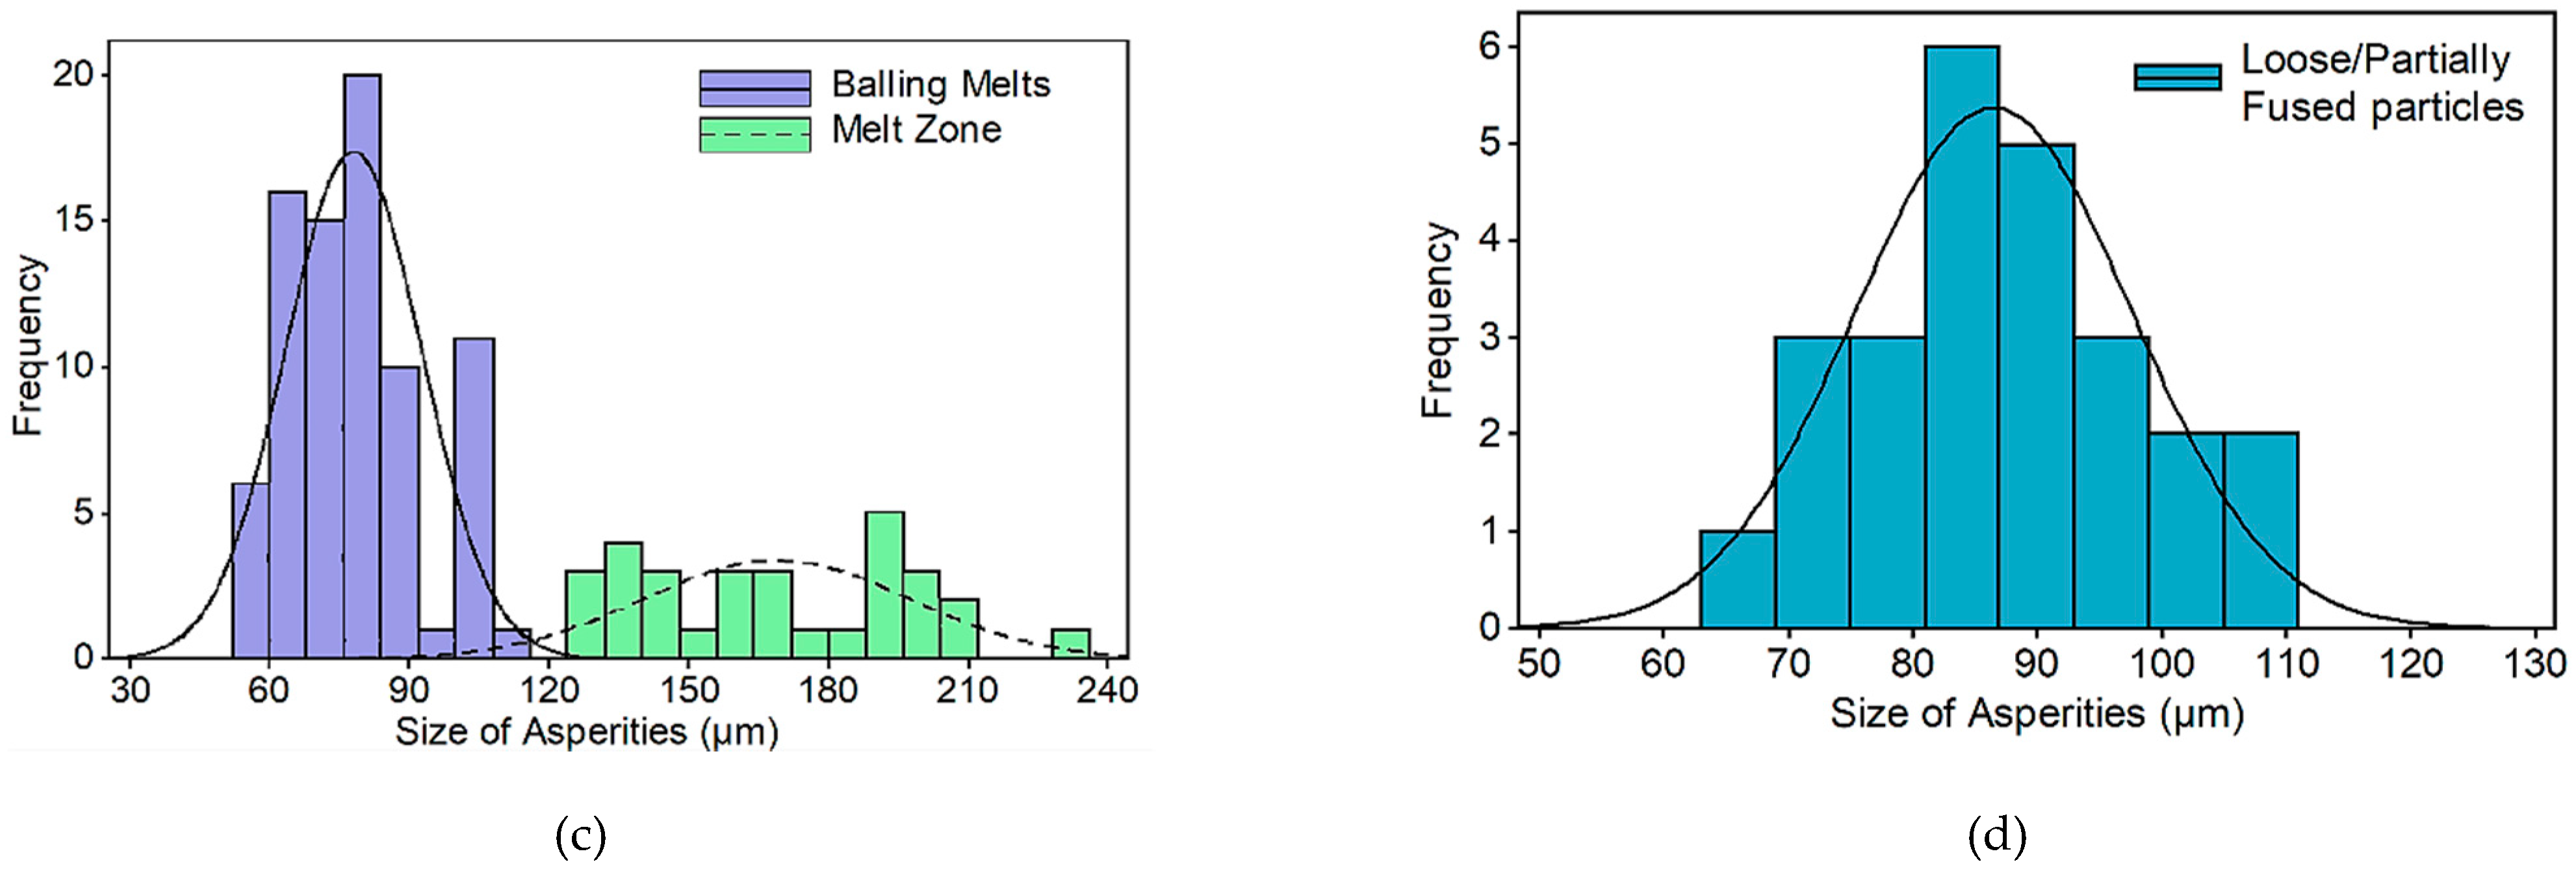
3.2.2. Percentage Deviation from the Reference Value

Figure 6 is obtained by comparing the roughness results in Table 3 and Table 4 with the roughness results obtained using standard λc and ln. The percentage deviation of the results obtained for cases 1 to 7 was calculated by comparing the results in Table 3c and ln selected from ISO 4288) and Table 4c and ln selected from the investigative framework). From Figure 6, it can be concluded that the smallest percentage deviation in roughness results was obtained for case 6 (X-axis) (λc/ln: 2.5/4). Therefore, this answers questions 1 and 2 in Section 1 for an AM component, ln can be compromised, whereas λc should not be changed. In case 7 (Figure 6b,d), the percentage deviation is substantially larger for Rz (DMLS, EDM) than Ra and Rq because the surface is filled with smaller sized irregularities with smaller wavelengths than the λc value of 8 mm. Applying a λc of 8 mm on a surface with smaller sized irregularities will include all the short and long wavelengths in the roughness profile itself rather than separating it as roughness and waviness errors. Therefore, for an accurate roughness measurement of AM components, the λc should be selected based on the size of asperities present on the surface, and ln can be compromised to the next smallest length available.

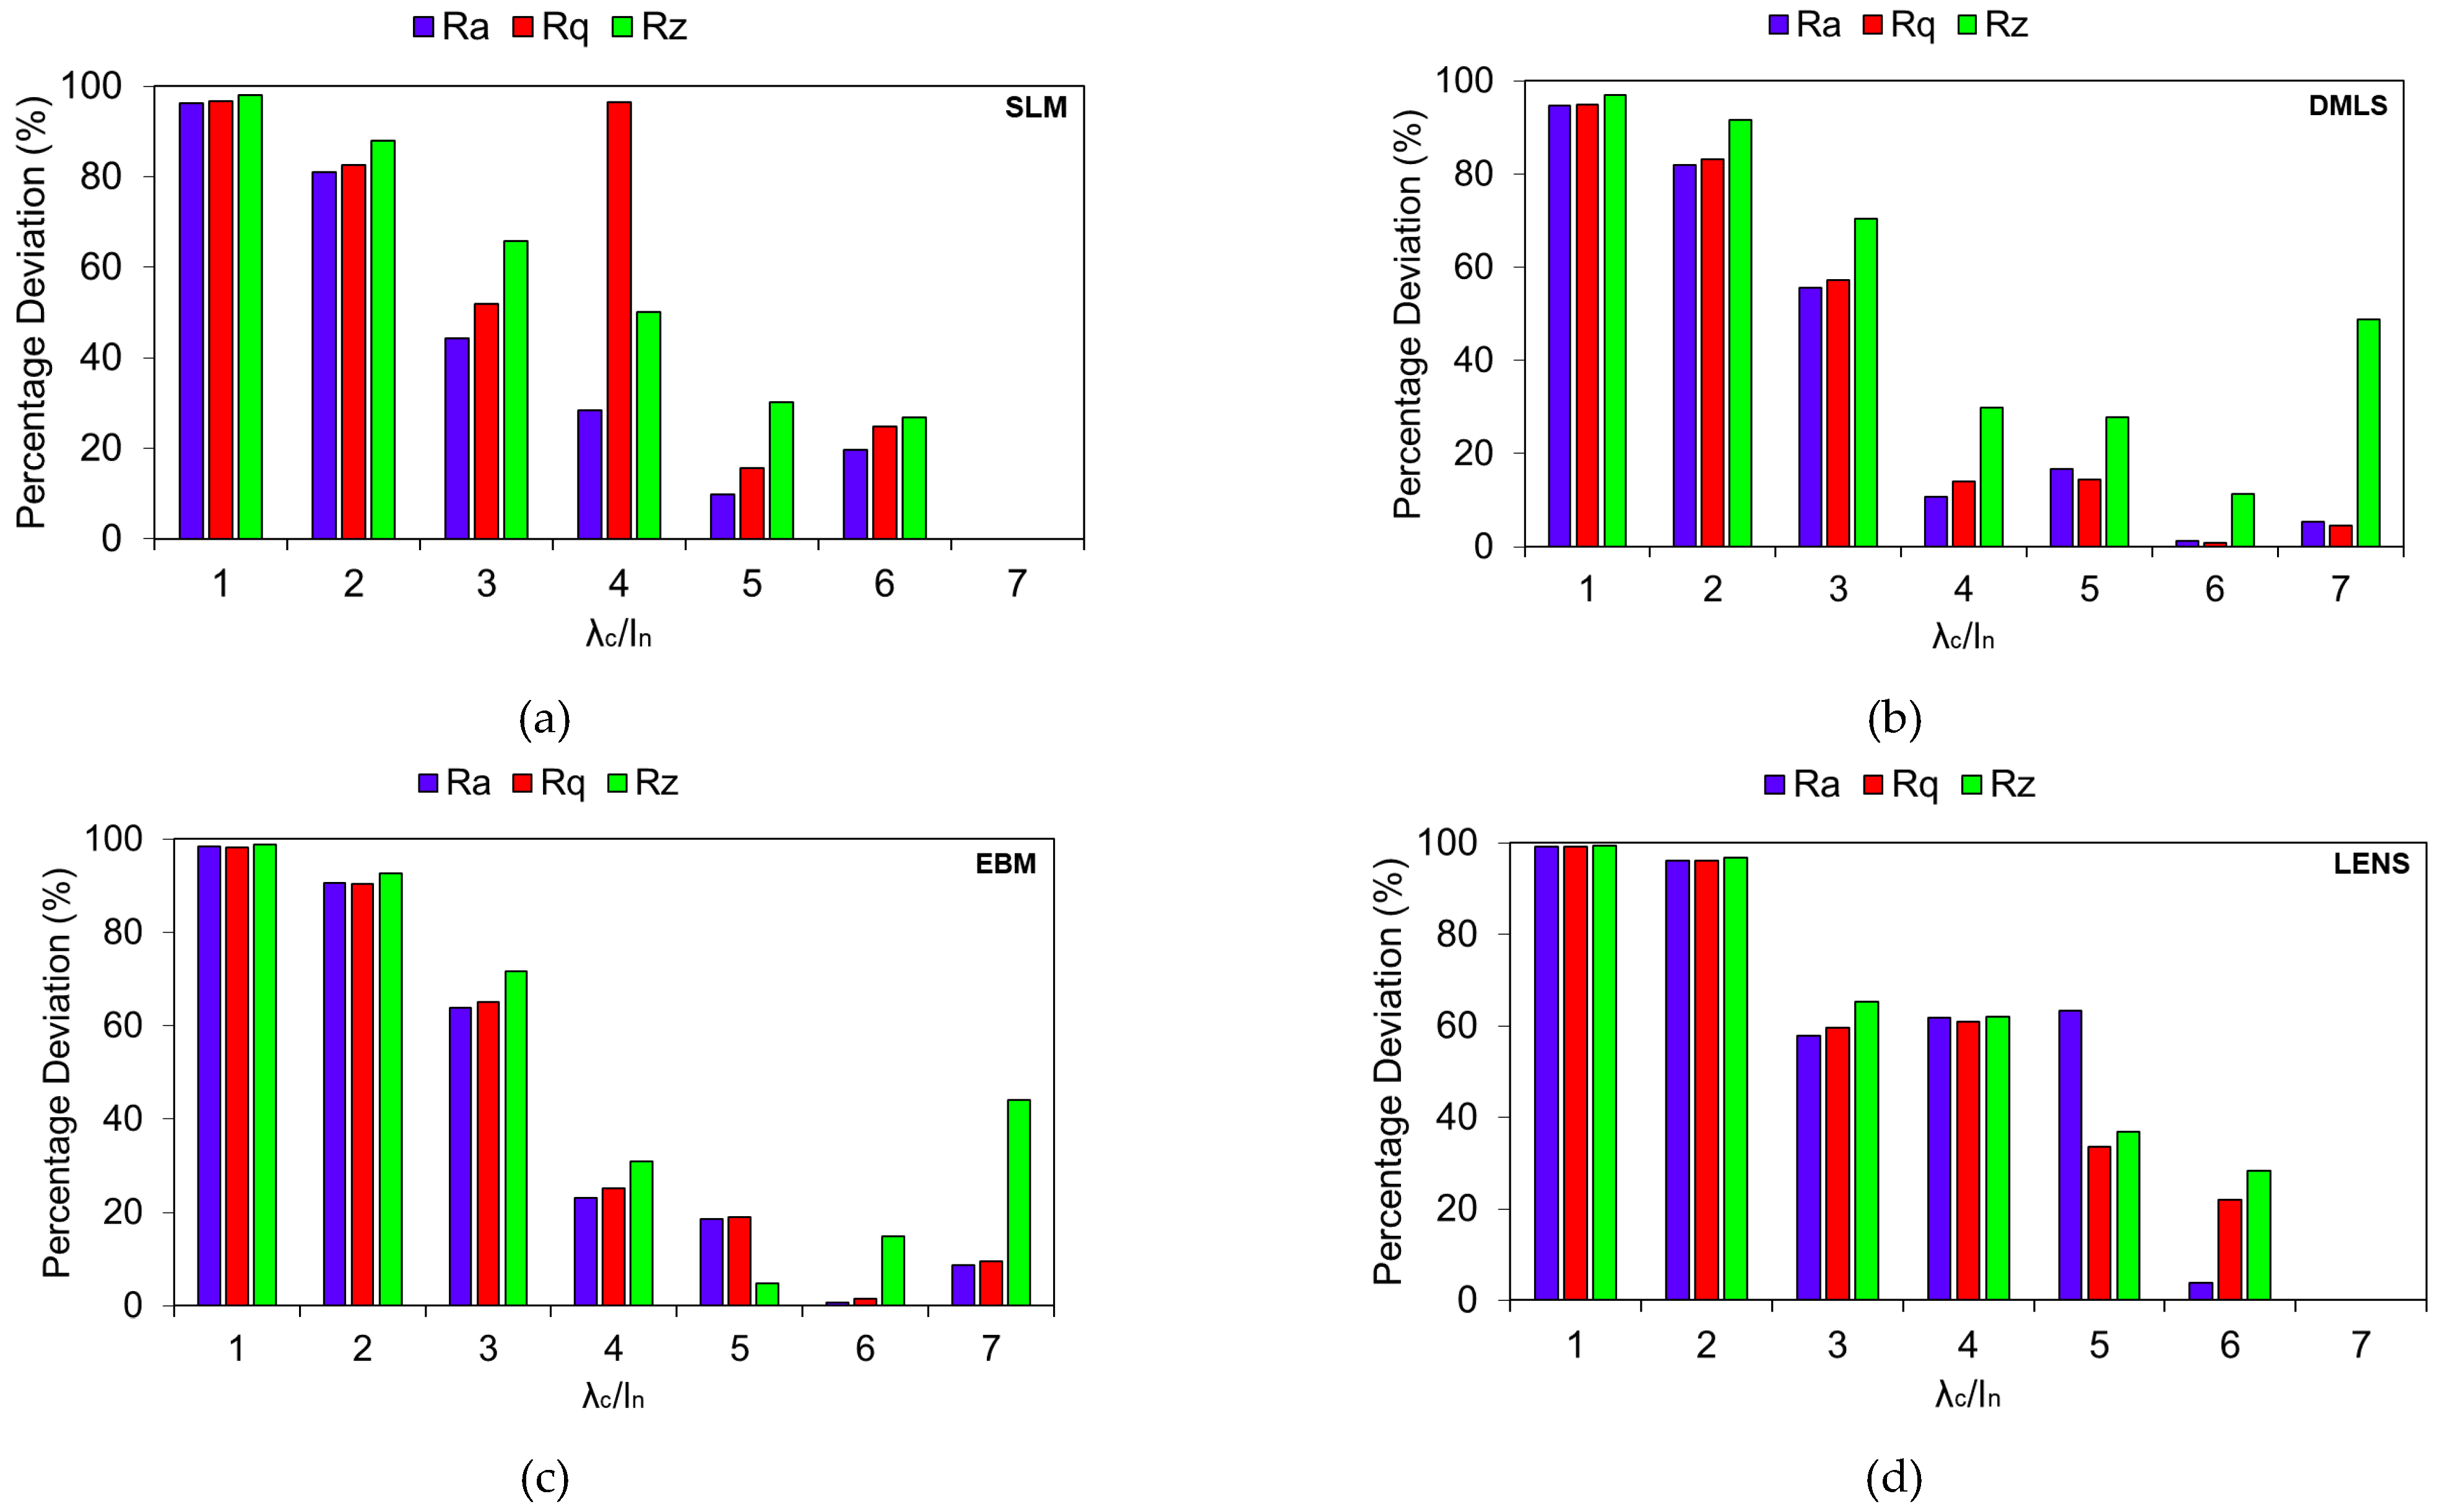
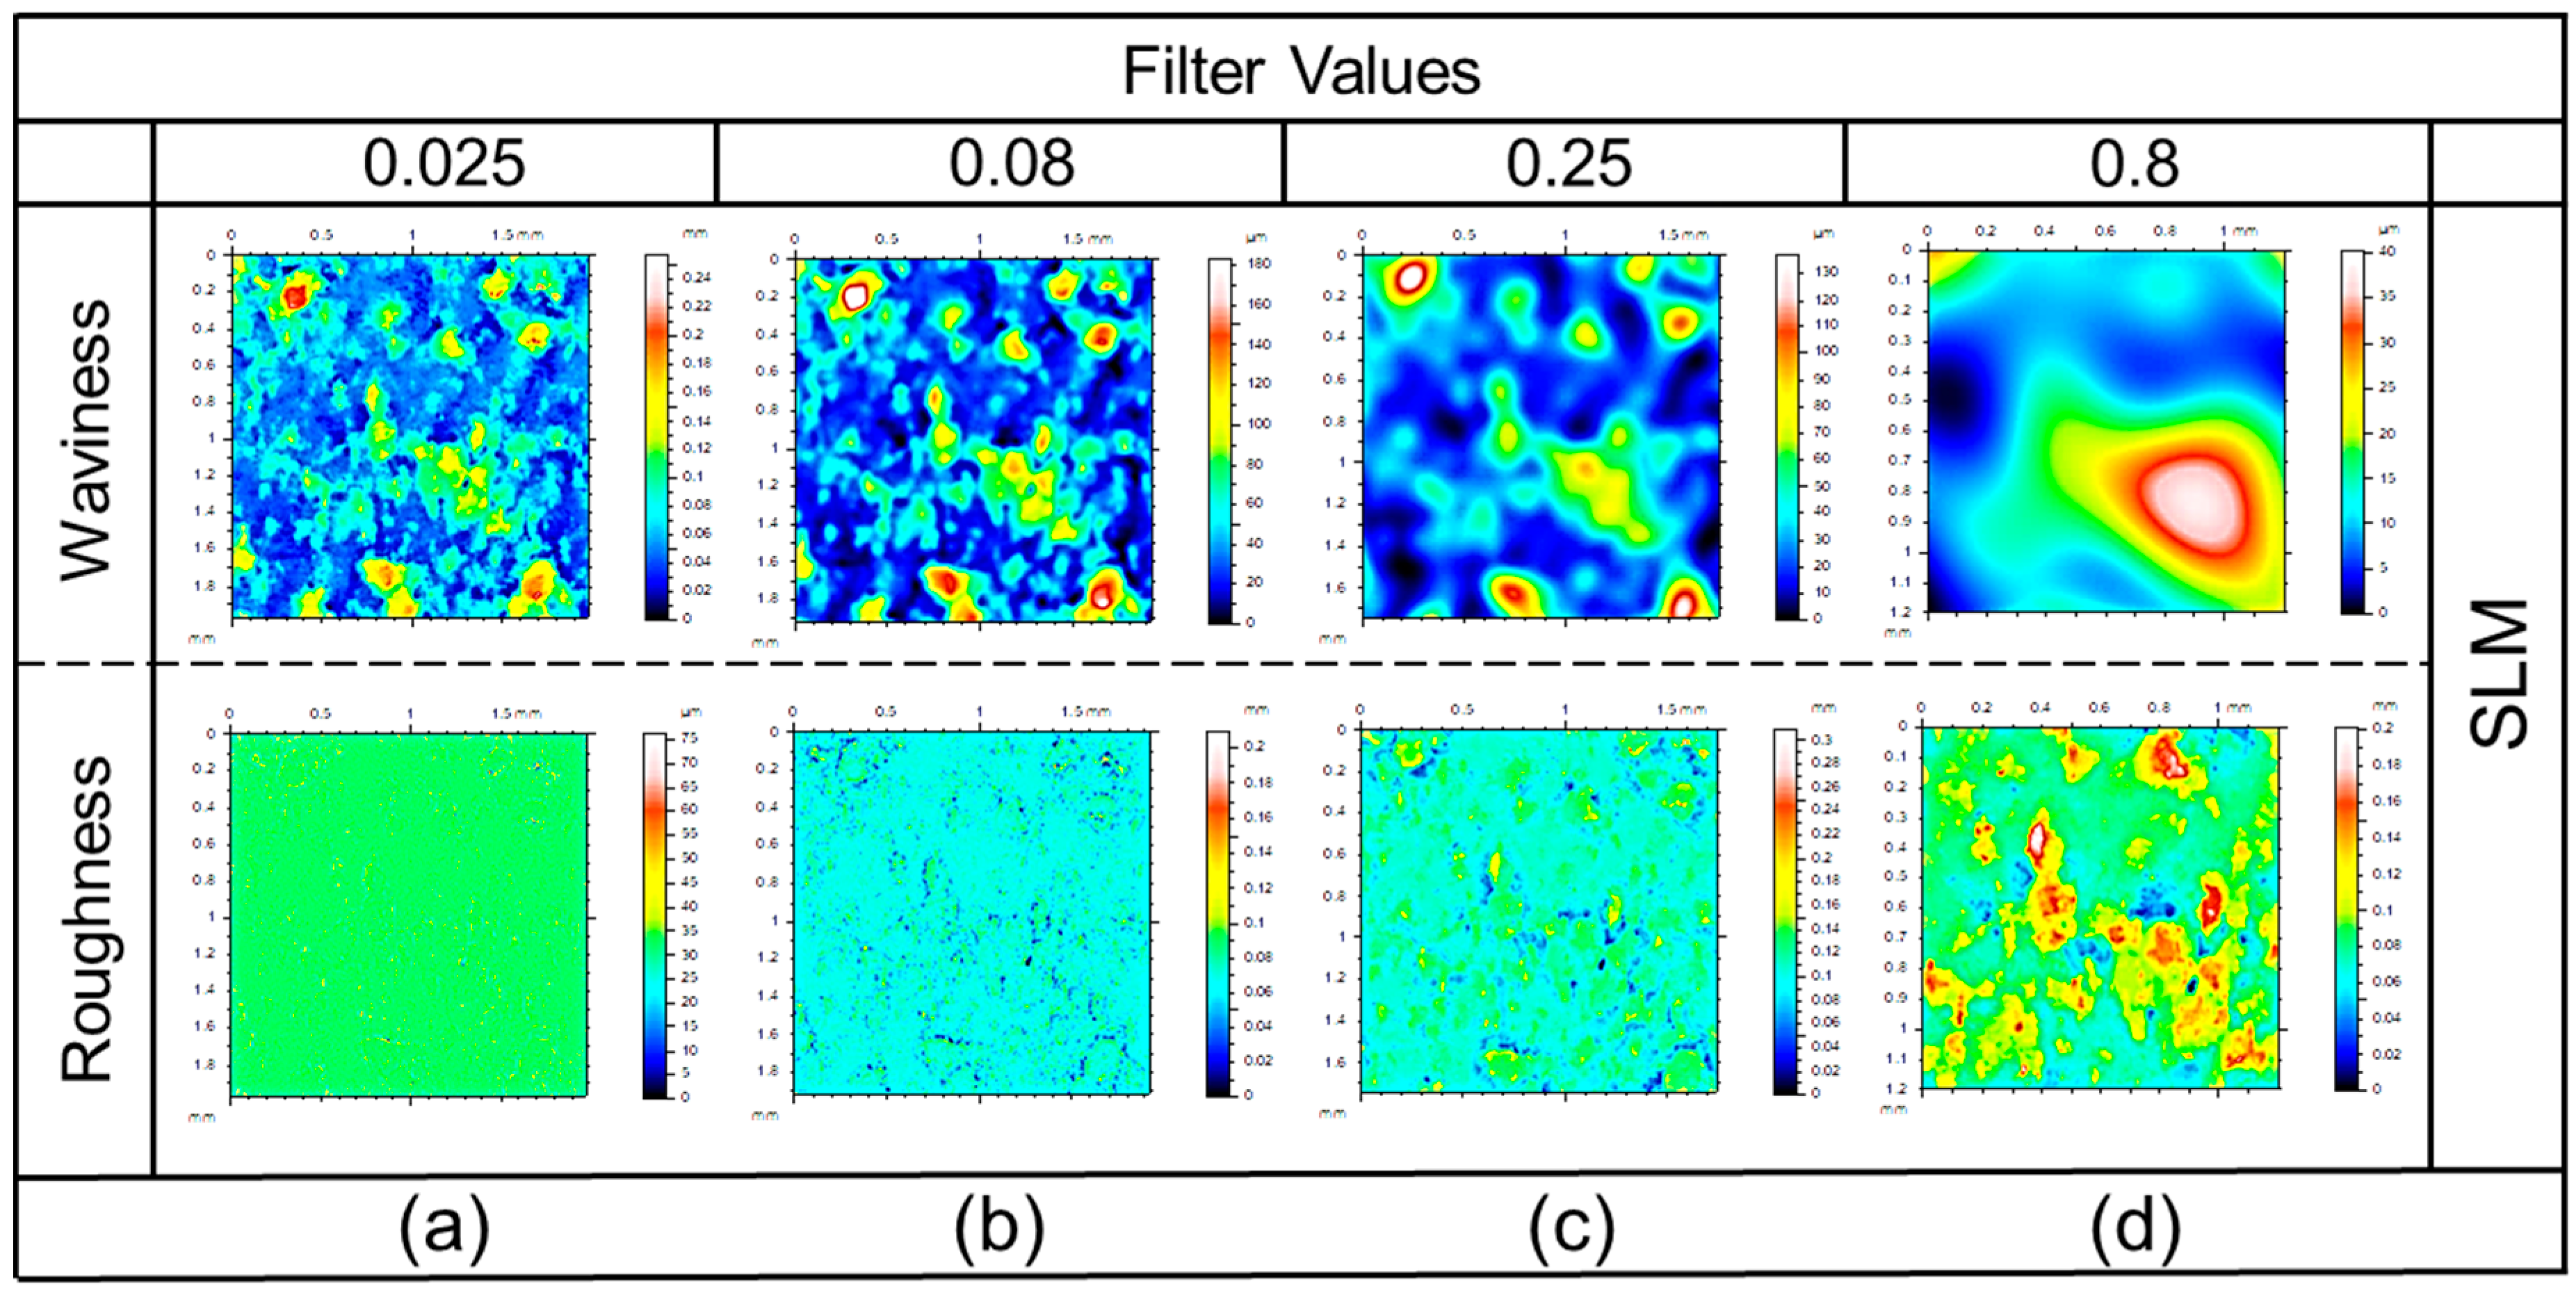
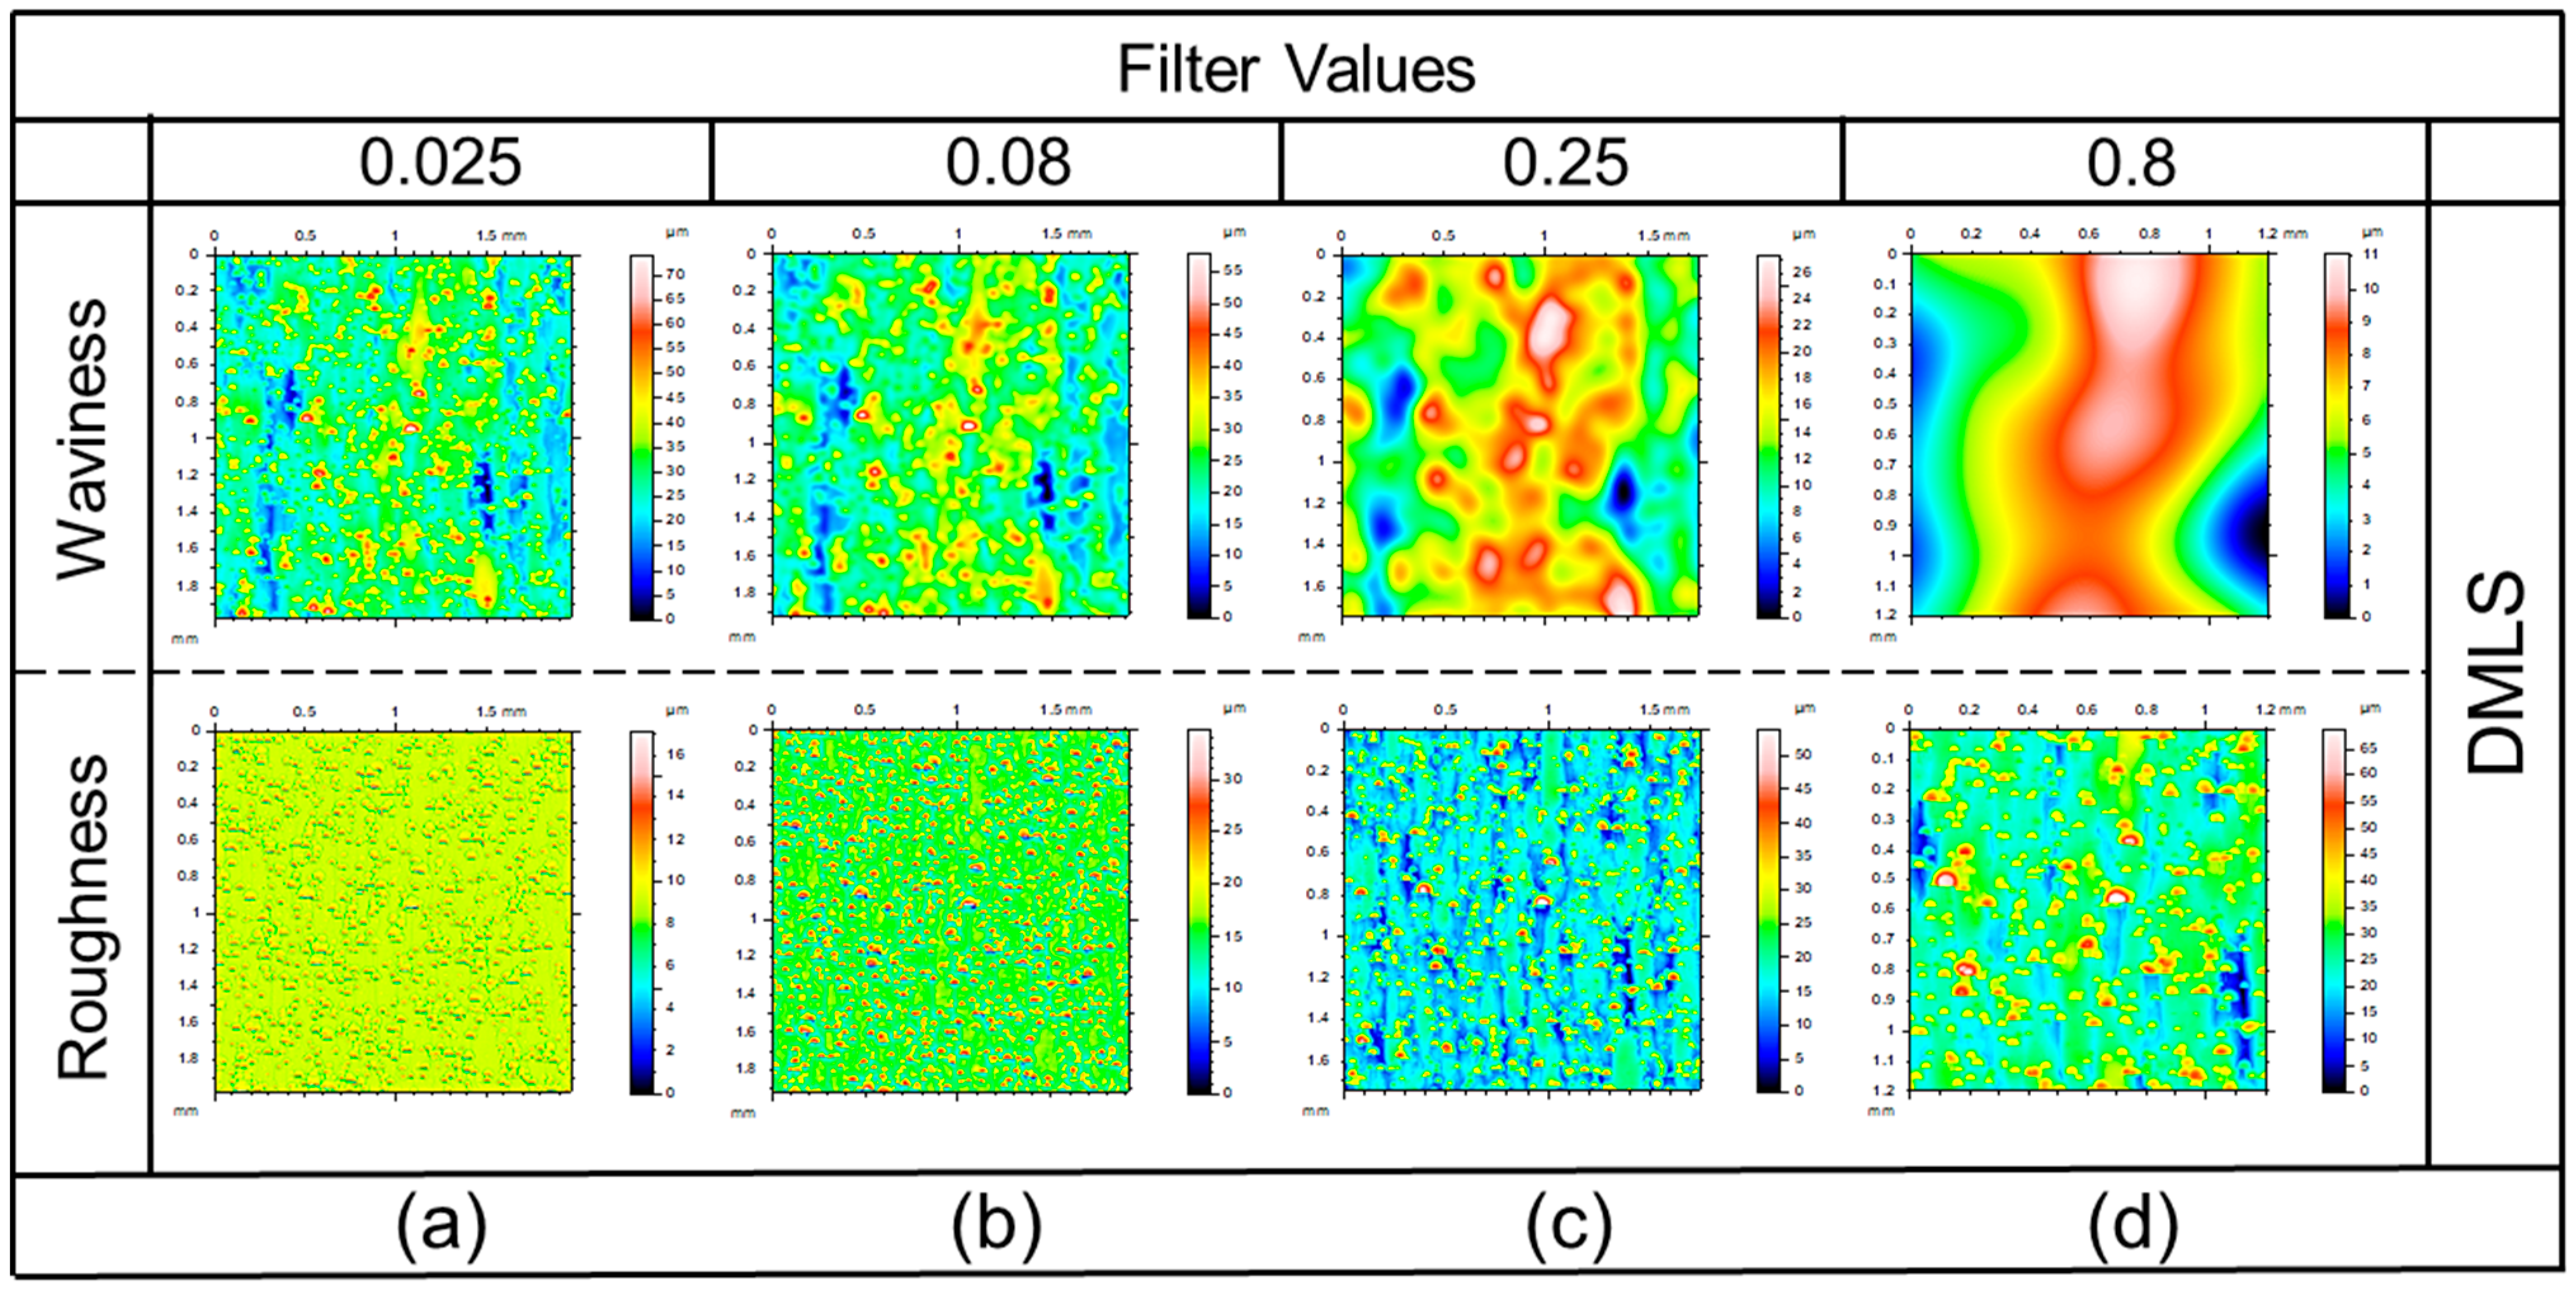
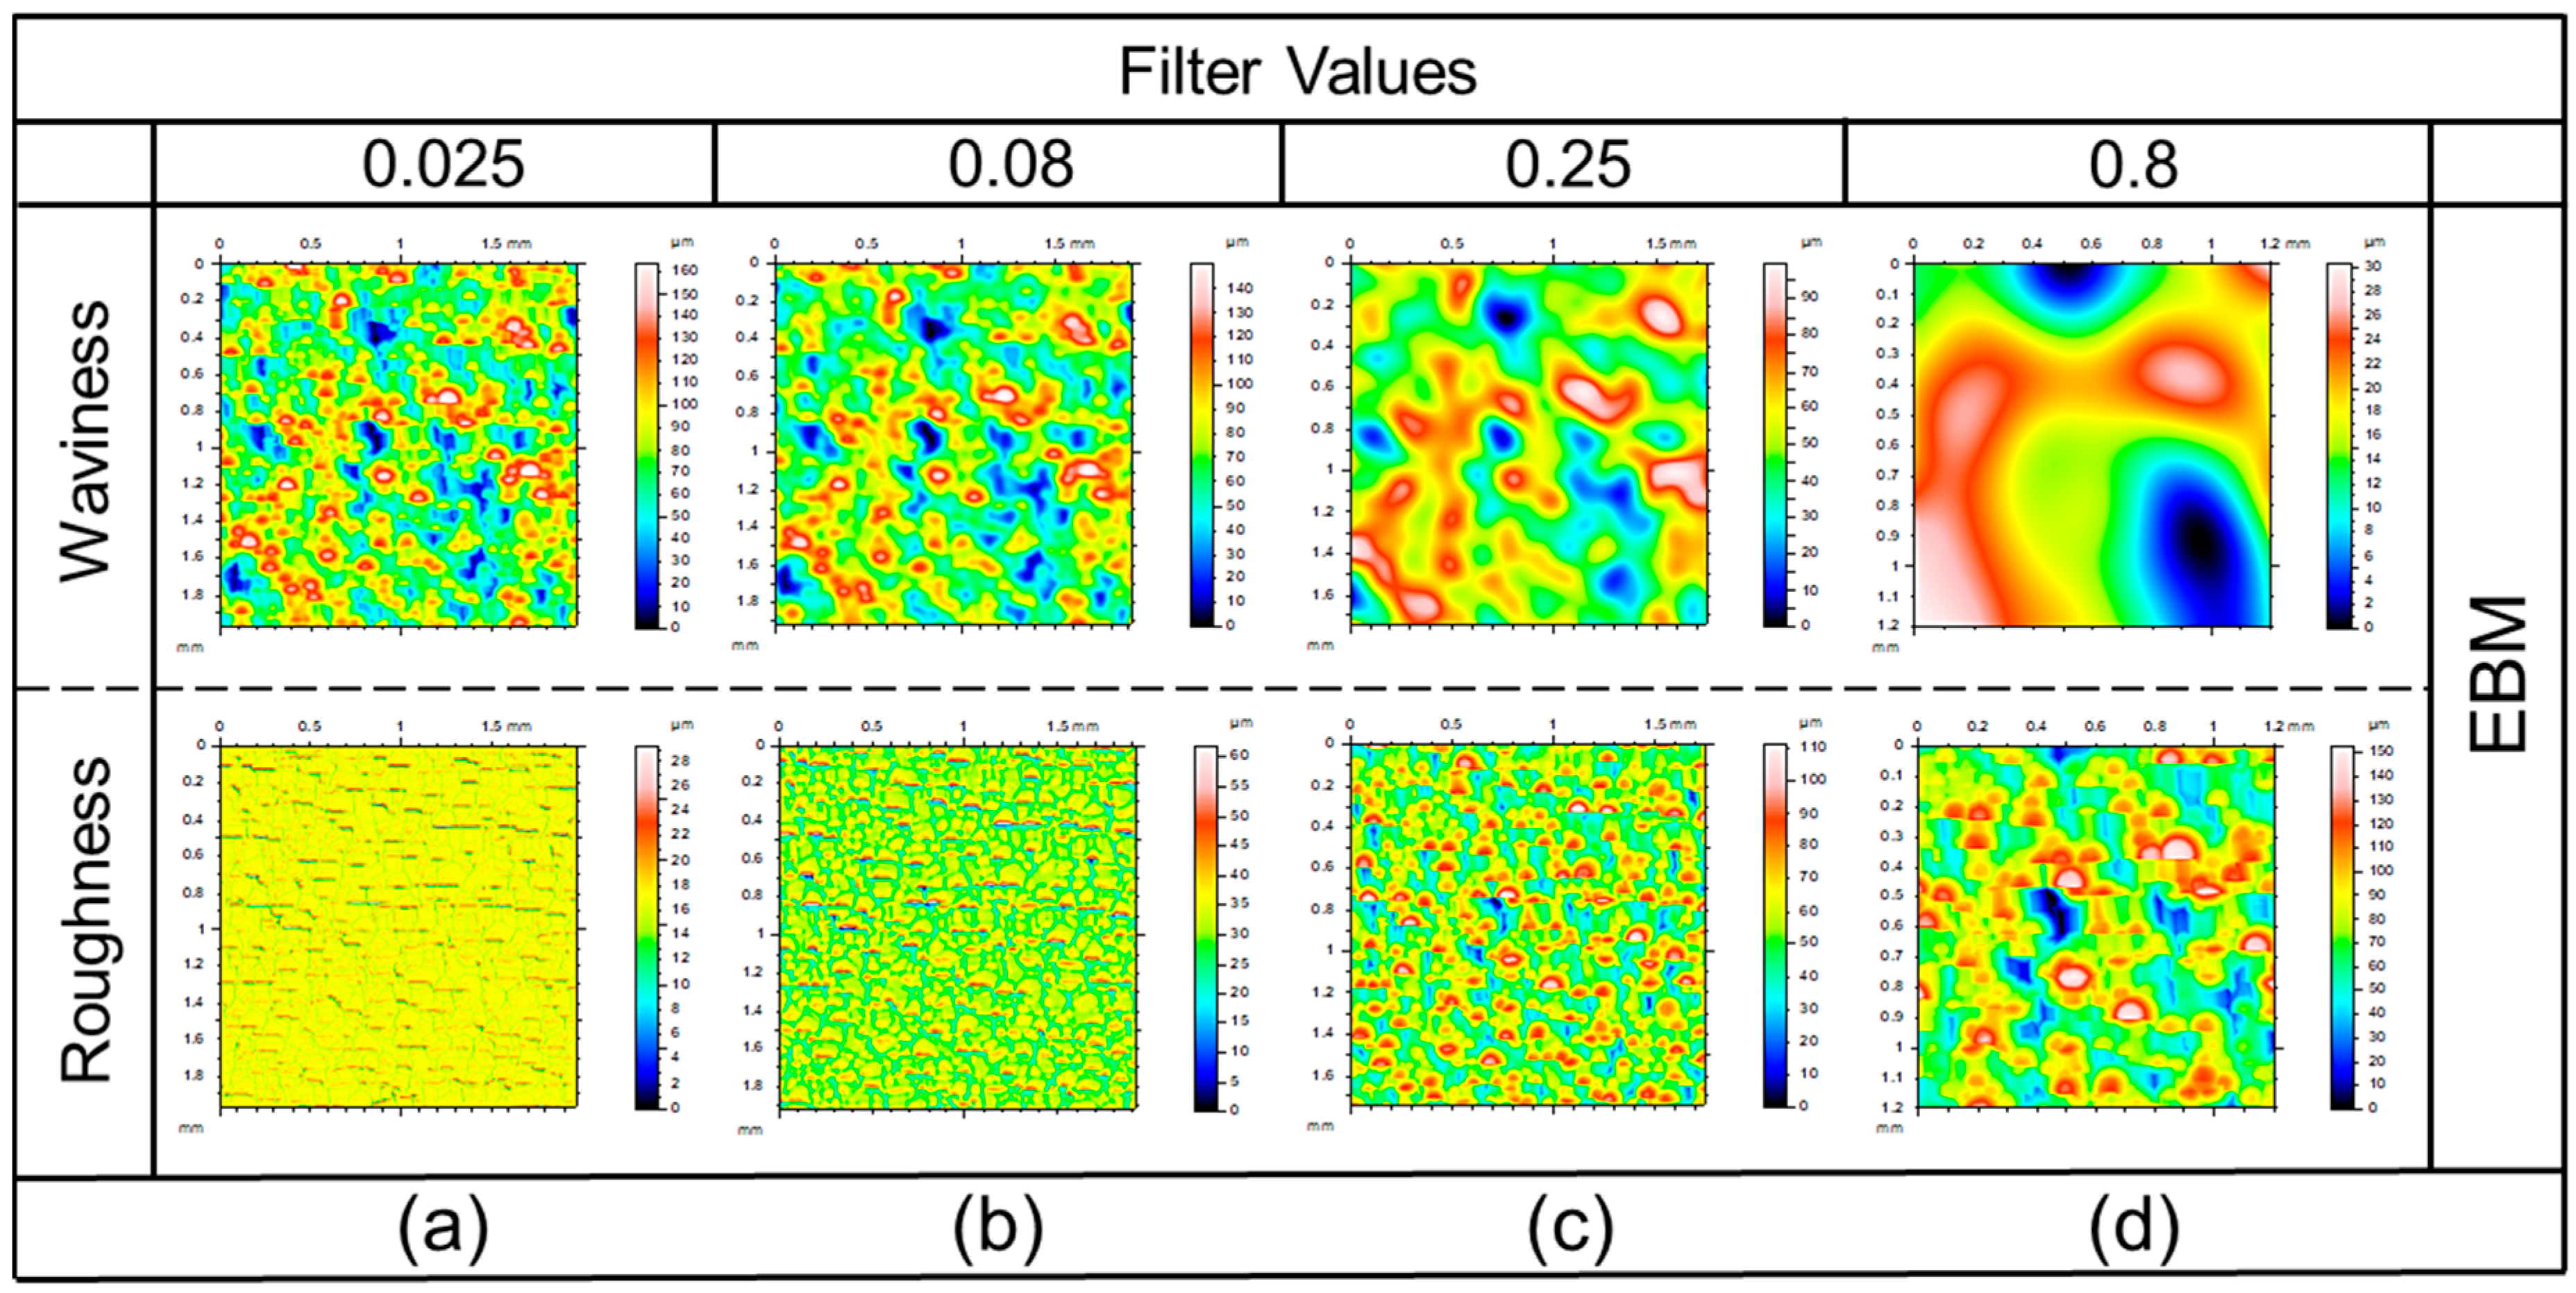
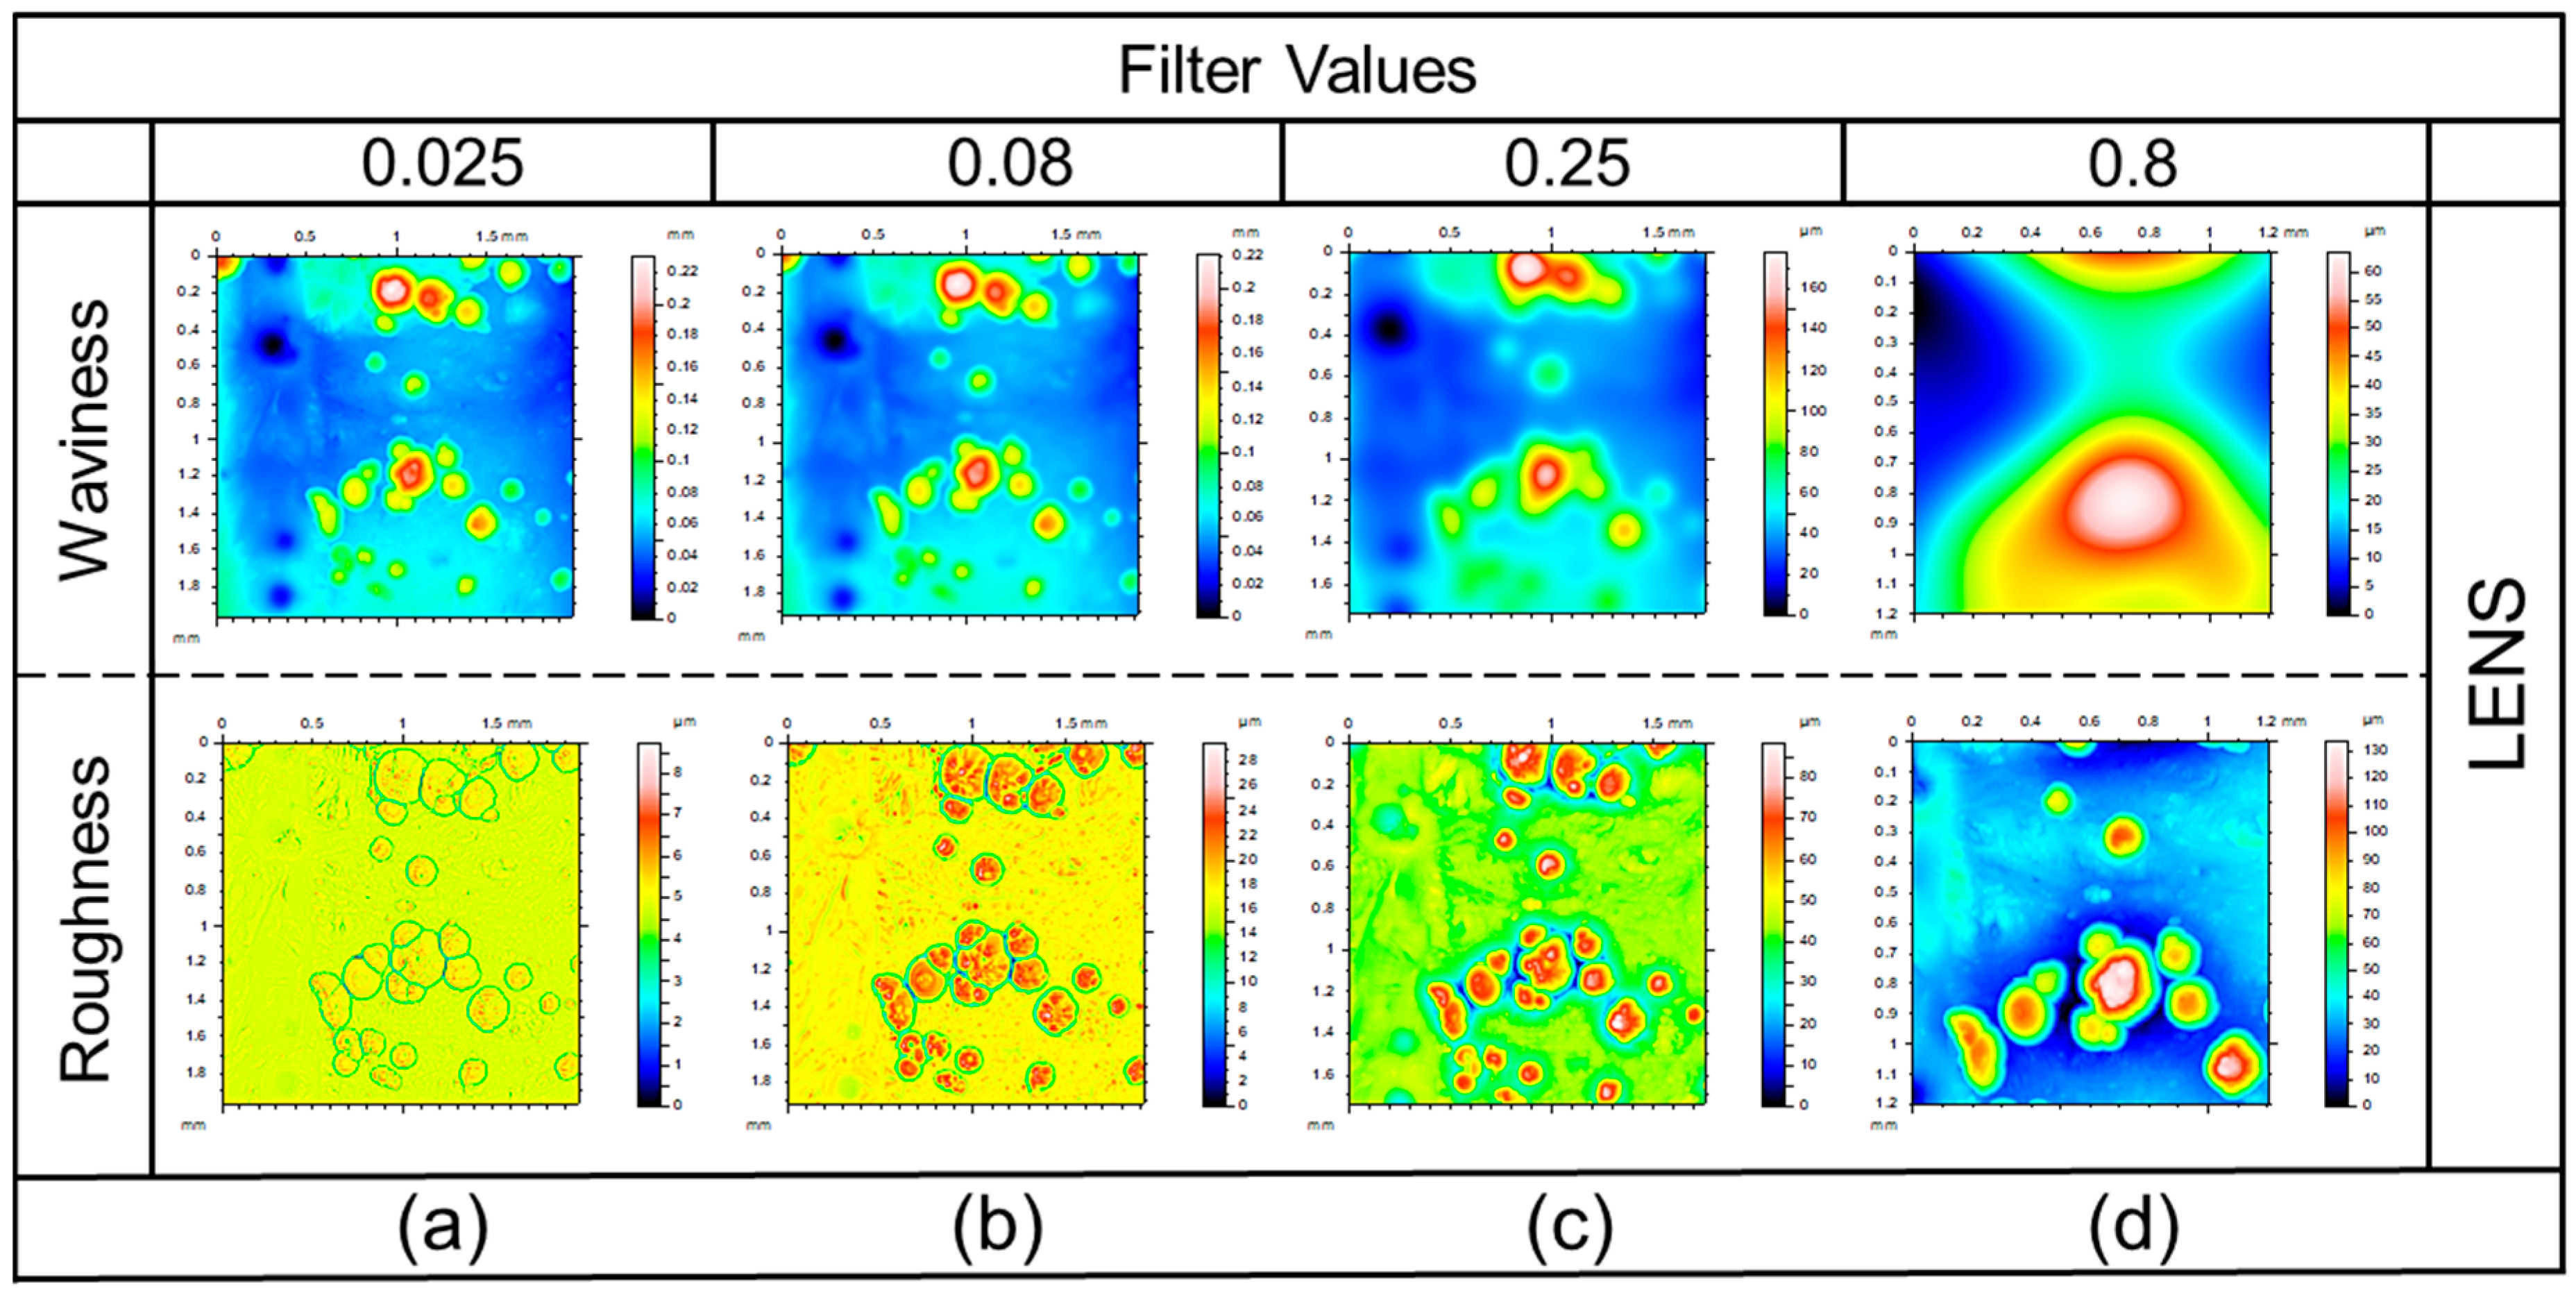
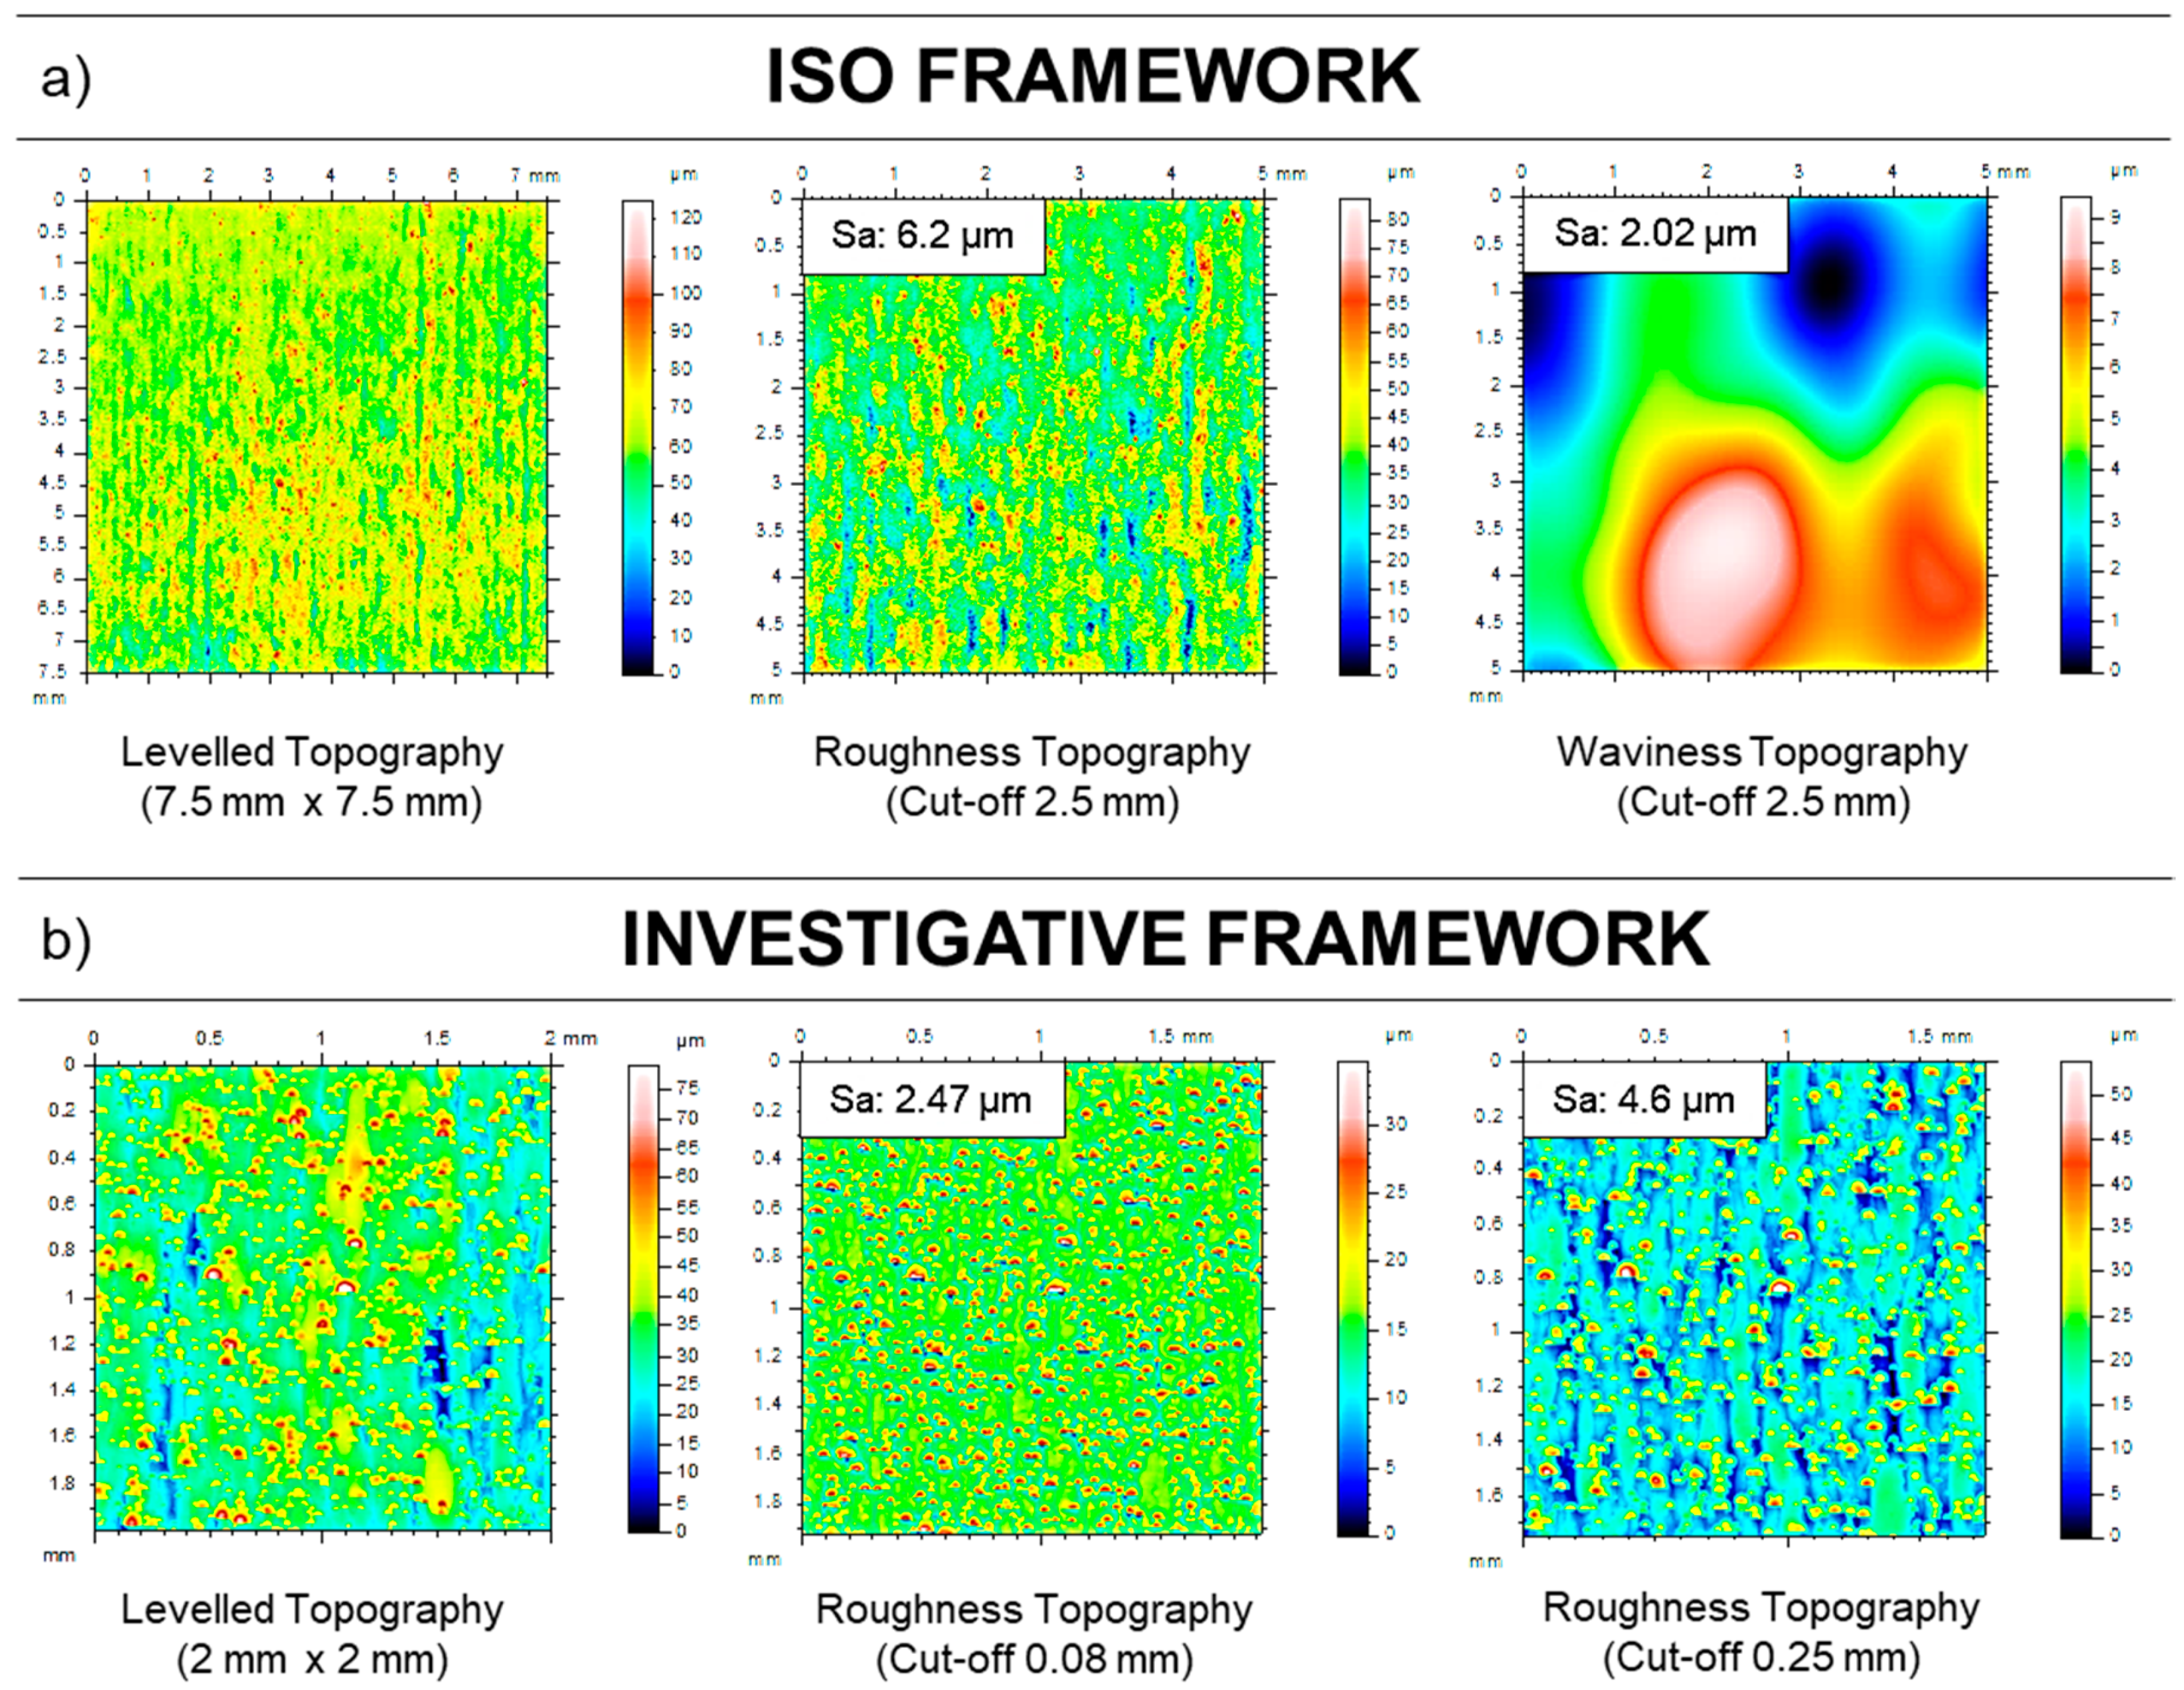
3.3. Areal Surface Texture Analysis

The raw topography of AM components obtained using laser point interferometry is shown in Figure 7. The areal surface texture parameters Sa and Sz are calculated using equations given in ISO 25178.
An issue arises while applying a suitable filtering value to analyze these surfaces. Usually, the filter is applied to separate the longer (understood as waviness) and shorter (understood as roughness) wavelengths from the measured data. Applying an improper filter will result in false quantifications. Therefore, the following sections discuss the effects of using various filtering values and their results.

Areal Surface Measurements—Effect of Various Filtering Conditions

ISO 25178 recommends that the measurement area be a square rather than a rectangle to get more accurate filtering results. After filtering the leveled topography, roughness and waviness topographies are obtained using a suitable λc value from the investigative framework. The surface texture parameters obtained by applying various cut-off wavelength values are given in Table 5.
For example, if a λc of 0.025 mm is applied to the areal surface texture measurement, this would transmit wavelengths less than 25 µm at 50 % transmission amplitude and above [25] and, at the same time, gradually attenuate wavelength errors of more than 25 µm. Hence, the resulting texture topography would essentially contain errors larger than 25 µm. Therefore, in this way, one can separate the loosely attached particles from partially melted and semi-welded structures on the surface and use them for analysis. If one needs to analyze the semi-welded structures in the surface separately, then a filter of 0.25 mm should be selected for DMLS surface (0.25 mm selected from Table 2 as two times φm of semi-welds is ~250 µm). The resulting texture topography will effectively capture irregularities less than 250 µm, and waviness topography will capture irregularities greater than 250 µm (at more than 90 % transmission amplitude). Since the interest is now on semi-welded structures, as most semi-welded structures are greater than 150 µm (from Figure 5a), the resulting waviness topography should be analyzed for surface texture parameters rather than roughness topography.
The resulting waviness and roughness areal surface topography of SLM specimen at various filtering conditions is shown in Figure 8. (Note that the discussions will be limited to analysis of the surface topography from the resulting contours. Future work will include an in-depth analysis of the Gaussian filter’s effectiveness and transmission amplitude in the resulting contours). Figure 8a shows that the waviness topography is similar to the leveled raw profile shown in Figure 7a. For a filter of 0.025 mm, all the irregularities with a wavelength greater than 25 µm (loose particles, partially melted and semi-welded structures) will be significantly present in the waviness profile, and the wavelengths less than 25 µm would be significantly present in roughness topography.
The waviness and roughness topography obtained by increasing the nesting index to 0.08 mm is shown in Figure 8b. In this case, all the irregularities with a wavelength greater than 80 µm are present in the waviness topography (partial melts and semi-welded structures), and wavelength less than 80 µm (loose particles) are present in roughness topography. Therefore, it can be said that the roughness topography indicates the presence of loose particles (wavelengths less than 80 µm), and the waviness topography indicates the presence of partial melts and semi-welded structures (wavelengths greater than 80 µm). Increasing the nesting index to the next larger value of 0.25 mm will have the same effect mentioned above on waviness and roughness topographies.
In Figure 8c, the roughness topography would contain loose particles and partial melts; the waviness topography would contain the wavelengths due to semi-welded structures alone. The roughness topography in Figure 8d shows almost all the irregularities in the roughness topography as all the structures in the surface under study are significantly smaller than 800 µm. Waviness topography contains wavelengths greater than 800 µm (considered as a form error).
A different set of filtering values were applied to the DMLS surface, and the resulting topographies are shown in Figure 9. Waviness topography (Figure 9a) is similar to the leveled raw profile as shown in Figure 7b as it contains all the irregularities with wavelengths greater than 25 µm. Roughness topography (Figure 9b) contains errors due to the presence of loose particles (size < 80 µm). Roughness topography (Figure 9c) contains errors due to the presence of loose particles, partial melts, and semi-welded structures (size < 250 µm).
The only type of irregularity identified in the EBM surface is balling melts of approximately 80 µm. The same effect of varying the filtering values applies even to the EBM surface. Roughness topography (Figure 10b) contains the wavelengths of irregularities due to balling melts (size < 80 µm). One such limitation is that laser scanning cannot distinguish each ball melt separately as the balling melts in the surface entirely overlap. Therefore, roughness topography (Figure 10c) contains the complete irregularities due to balling melts not exceeding 250 µm in size, and the shape of balling melts can be seen. There is no presence of a staircase or any other defect in the obtained topography.
The same methodology for filtering the surface is applied to the LENS surface, and the resulting topographies are shown in Figure 11. Similar trends are observed in the LENS surface for all the filtering conditions. The LENS surface consists of only partially melted and some loosely attached particles. The roughness topography (Figure 11c) gives the best results after filtering all other wavelengths from the surface.
The above investigations show that selecting a proper λc plays a significant role in determining the resulting waviness and roughness. For an AM component, if the size distribution of each type of asperity is known, the above results show that the textural variations arising from each type of asperity present on the surface can be identified and quantified separately.

4. Comparison of Surface Texture Results from the Investigated Framework with Standard ISO Results

A comparison is made between the profile and areal surface texture parameters obtained by following the ISO framework and the investigative framework. Table 6 compares the profile surface texture parameter results. Profile surface texture parameter value of Ra = 6.94 ± 0.24 represents the combined roughness errors due to loose particles, partial melts, and staircase effect. However, it does not give clear insight or distinguish the errors due to short wavelengths (loose particles and partial melts) and errors due to long wavelengths (staircase effect). To overcome these issues or to analyze the errors due to loose particles, select a suitable λc (in this case, 0.08 mm). If loose particles and partial melts together are of interest, select λc, and ln based on the steps given in Figure 1. The resulting values of Ra 1.25 ± 0.34 µm (errors due to loose particles and partial melts) and 3.08 ± 0.57 µm (errors due to loose particles, partial melts, and staircase effect) clearly distinguish the errors due to the presence of a particular type of asperity that is of interest on the surface.
Figure 12a shows the areal surface texture results obtained by following the ISO framework. An area of interest is measured, and its surface topography is obtained. The raw topography is leveled, and a λc of 2.5 mm is applied to filter the surface. The resulting roughness and waviness topographies and their areal surface texture parameters are analyzed. Considering the types of asperities present in a DMLS surface, as per ISO recommended λc of 2.5 mm, it can be understood that the roughness topography obtained will include errors due to the presence of all three distinct types of asperities such as loose particles, partial melts and staircase effects. Therefore, it is impossible to quantify or predict the errors due to particular types of asperities from the surface topographies obtained by following the ISO measurement framework.
Moreover, it can be seen from the waviness topography that waviness Sa value 2.02 µm < roughness Sa value 6.2 µm, which indicates that the errors present in roughness topography are more significant than the errors in waviness topography (usually, waviness topography has larger errors). This also reinforces that maximum wavelength errors have passed into roughness topography rather than waviness topography. This is because the size of irregularities present in the DMLS component is less than the cut-off applied according to ISO standards. Nevertheless, Figure 12b shows the resulting topographies obtained by following the investigative measurement framework. λc values are selected based on the steps mentioned in Figure 1. To separately analyze the errors due to the presence of asperities that is of interest, nesting index values of 0.08 mm (size of loose particles ~20 µm in Table 2, so 2*φm = 40 µm) the next possible λc 0.08 mm is applied, and the roughness topography is analyzed. In this filtering condition, the errors due to partial melts and staircase effect will be removed as the λc value applied is less than the staircase size. If a λc of 0.25 mm is applied, the resulting roughness topography will include the errors due to loose particles, partial melts, and the staircase effect, as shown in Figure 12b. Therefore, by adopting the investigative measurement framework, it is possible to distinguish, identify and quantify the errors due to a particular asperity of interest.

5. Conclusions

In this research work, a modified measurement framework is investigated for profile and areal surface texture characterization of as-built additive manufactured components. The investigative framework was applied on surfaces built from four different AM techniques. The following were the key findings from this investigation.
(1)
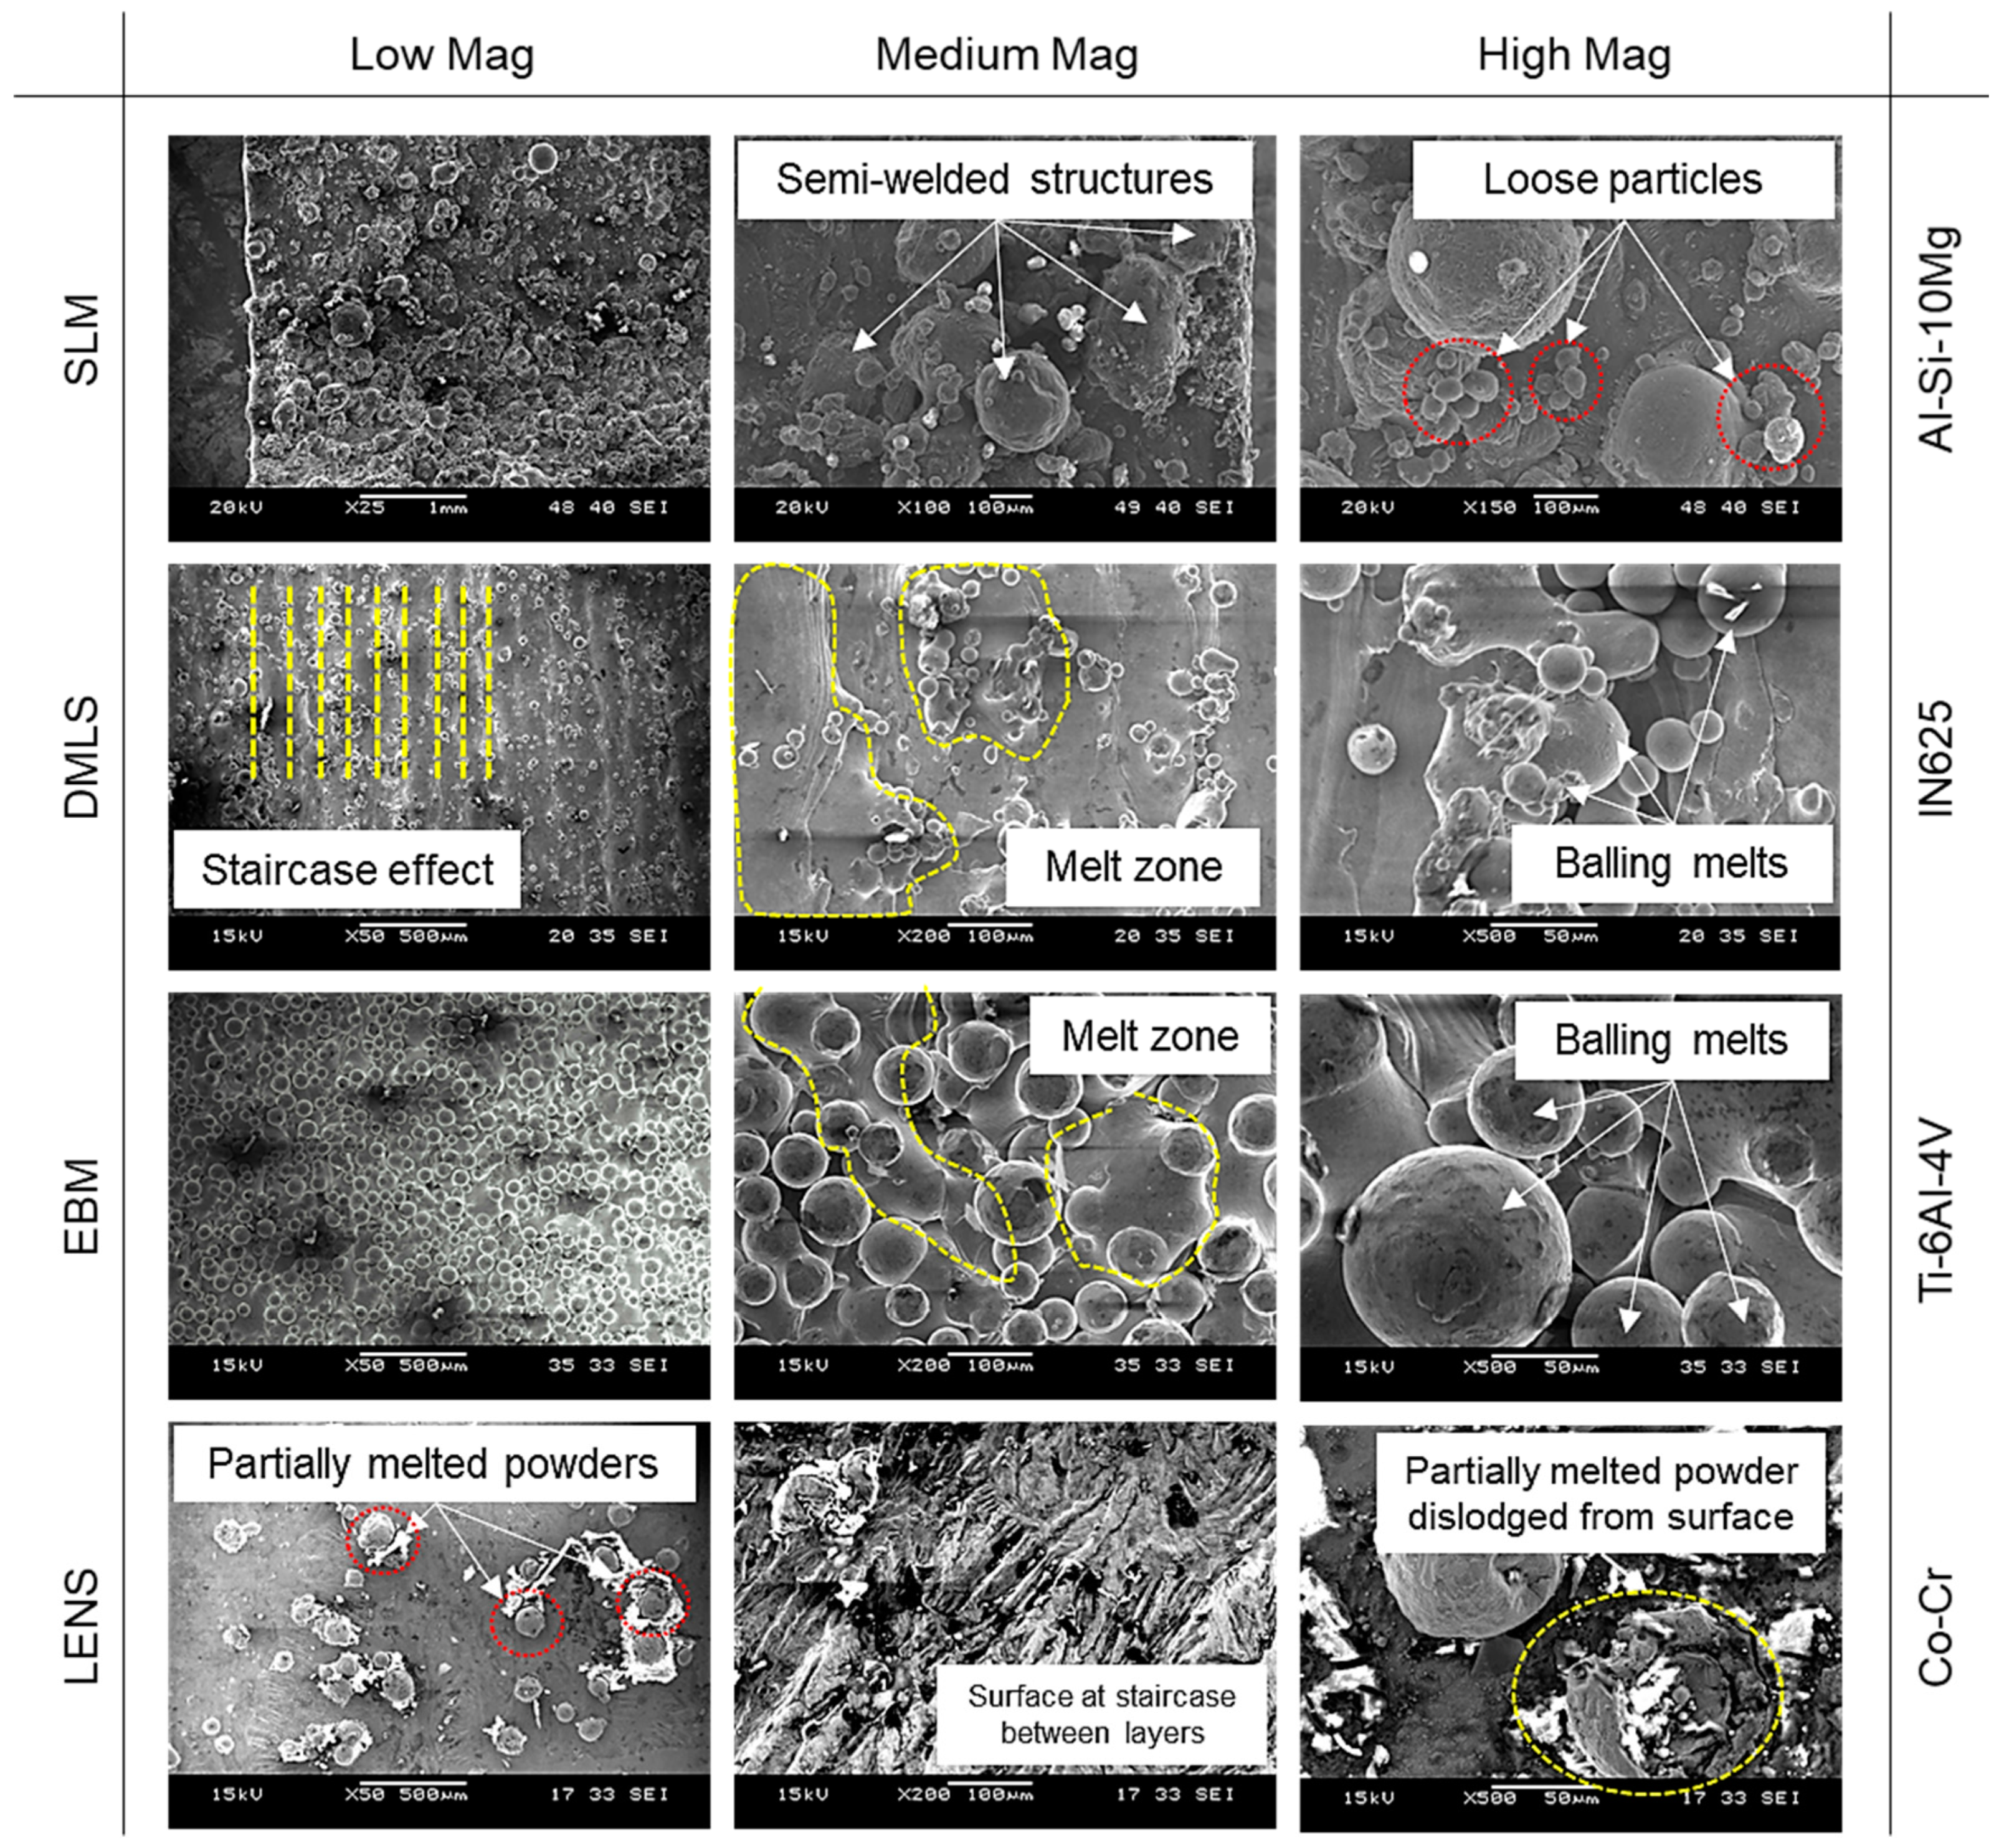
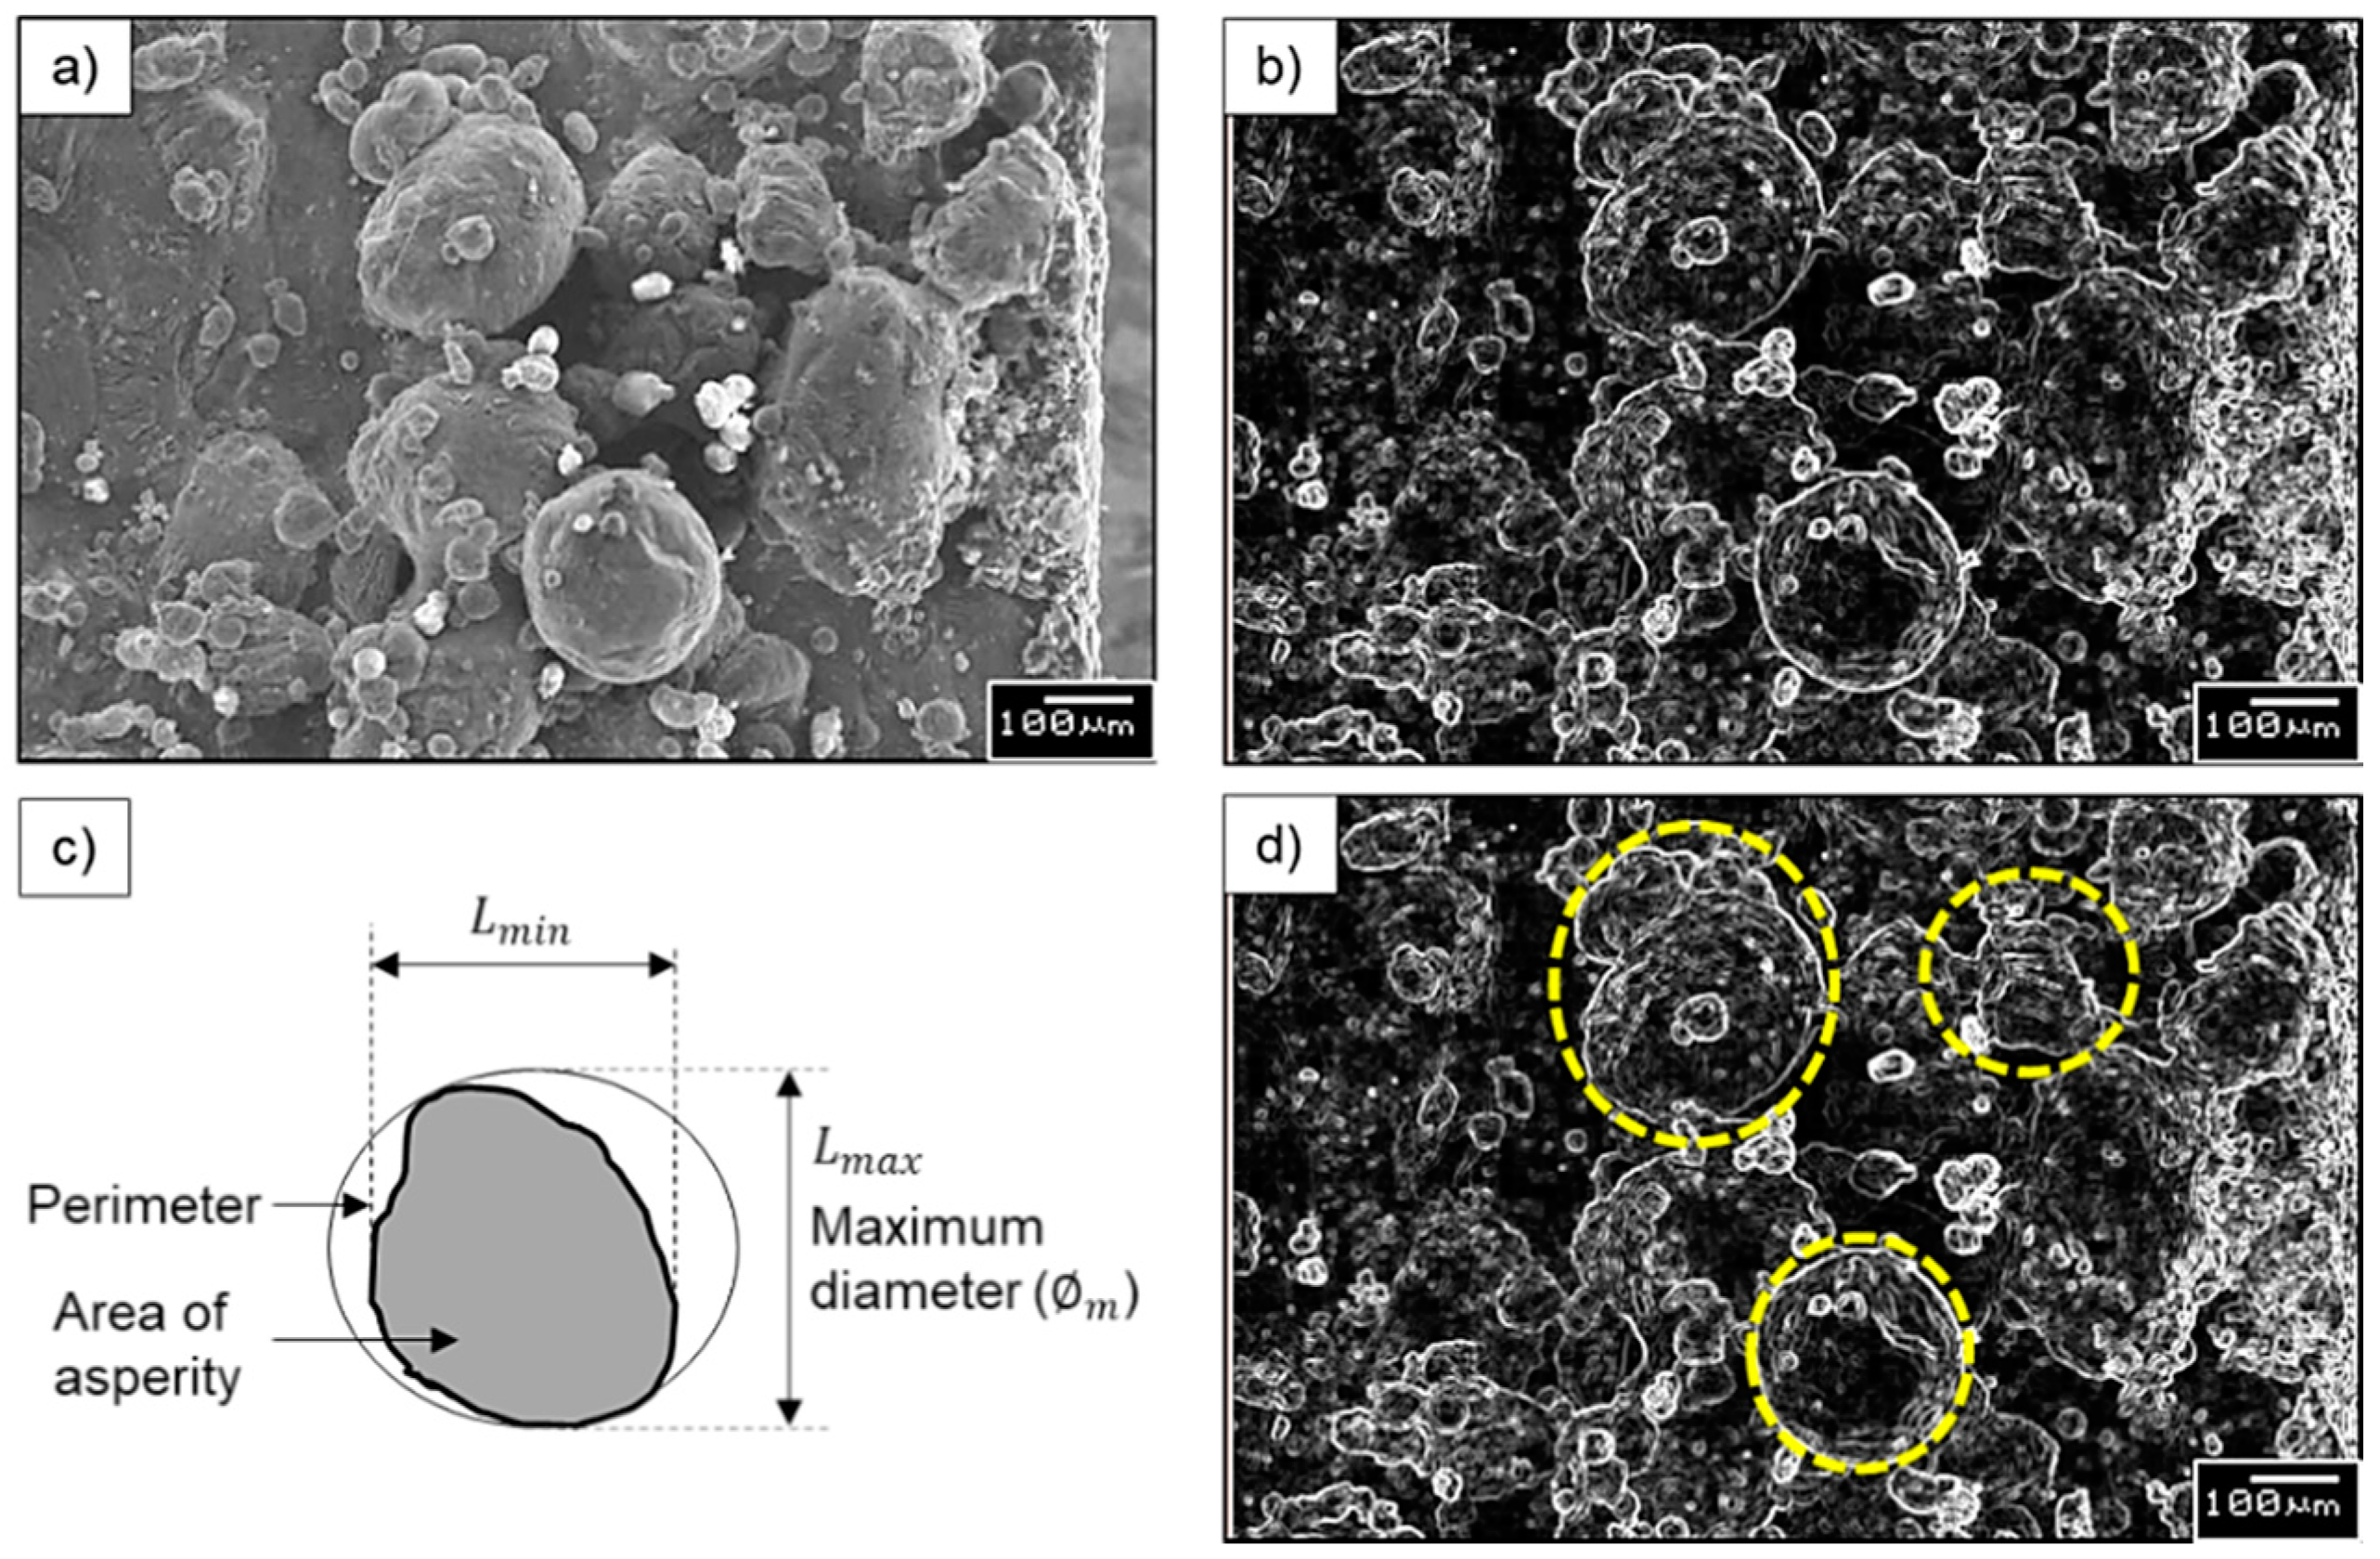
Scanning electron microscope analysis provided a better understanding of the type of surface asperities present in an AM component.
(2)
The maximum diameter (φm) of each type of asperity can be used as a cut-off value for profile and areal surface texture characterization.
(3)
Changing the λc values used for profile surface texture leads to significant percentage deviations in the resulting profile surface texture parameters. Minimum deviations were noticed by reducing the evaluation length. Therefore, if the users experience insufficient sample length for measurement, it is recommended to maintain the λc suggested by ISO and compromise the evaluation length.
(4)
The length and width of the evaluation area for the areal surface texture analysis of AM surface should be five times the selected λc. If there is an insufficient area to measure, select the length and width of the area to be at least twice the λc selected.
(5)
To characterize the AM surface texture, smaller measurement areas (2 mm × 2 mm or even less, but not below the size of large irregularities present) are sufficient.
(6)
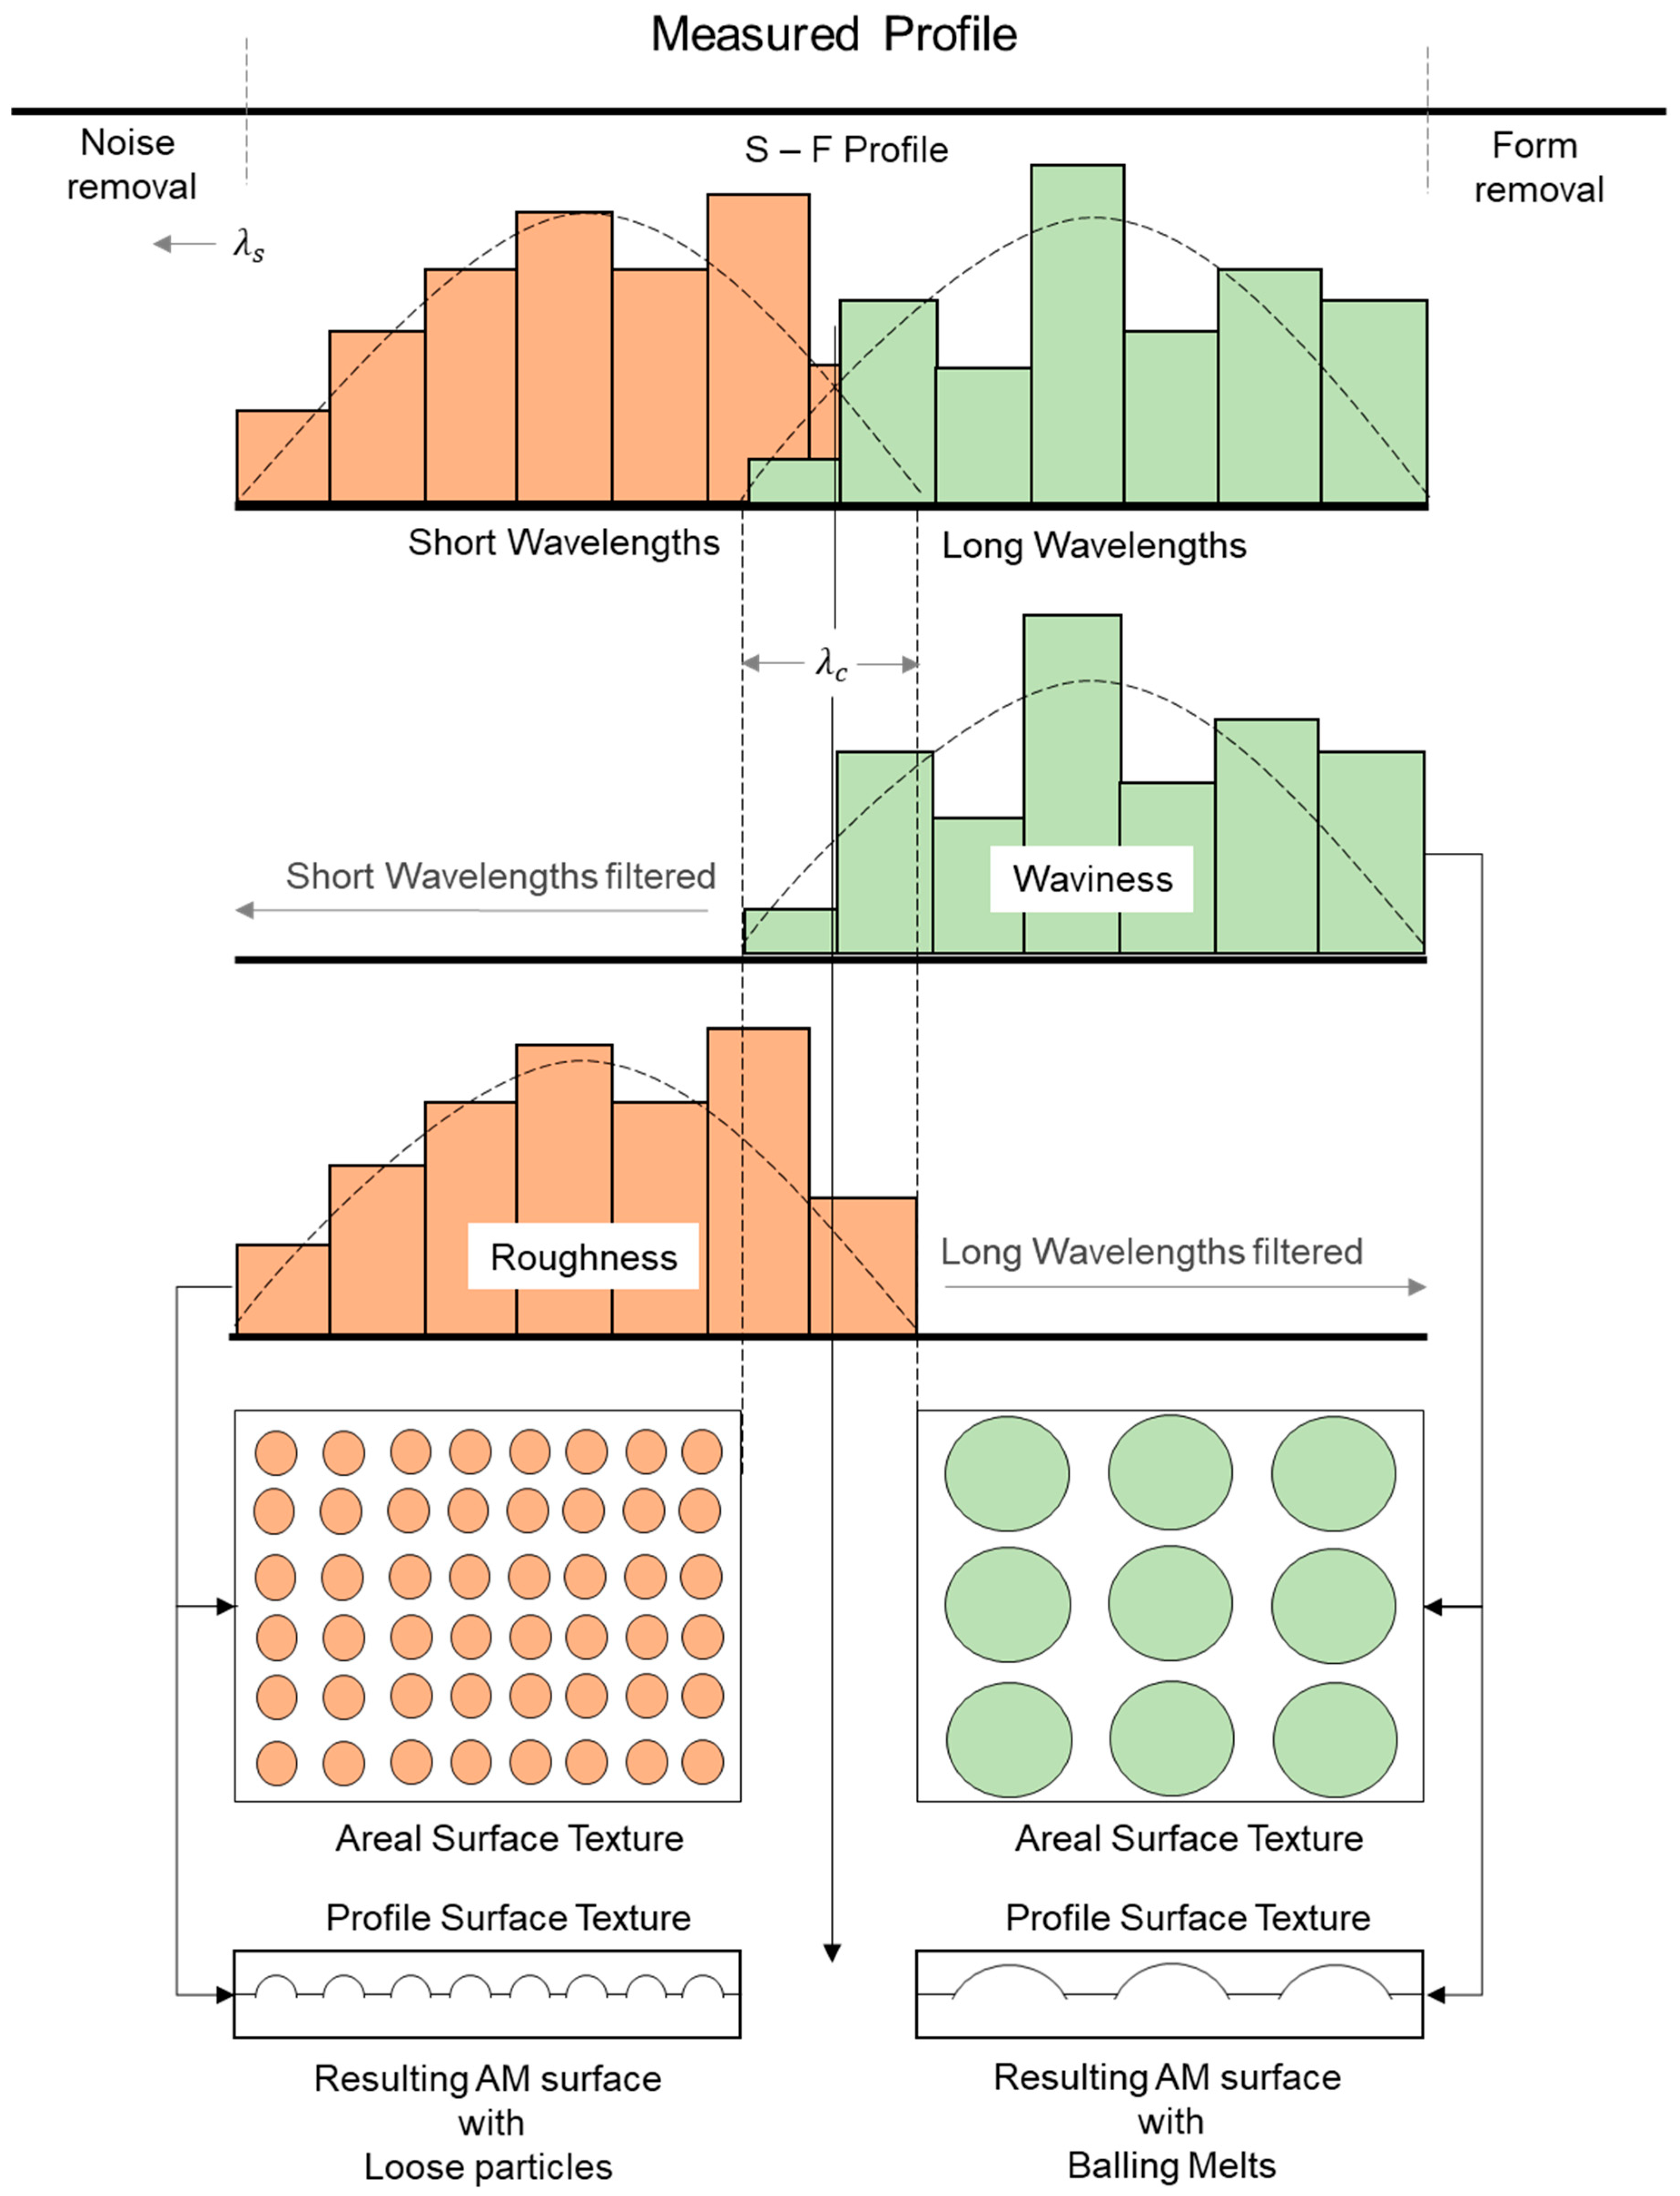
By measuring the size of asperities present on the surface and applying them as λc, it is possible to analyze the surface texture from short wavelengths (loose particles, partially melted particles) and long wavelengths (balling melts, semi-welded structures, and staircase effect) separately.
Some of the major challenges and limitations in this work include categorizing the type of surface asperities present in AM components based on visual observation, measurement accuracy of asperities through image analysis, and the percentage transmission of wavelengths in roughness/waviness topography. Notwithstanding the limitations, the above findings address all the questions (in Section 1) arising during AM surface texture measurements. The significance of this study helps to eliminate user speculations on selecting a particular measurement setting for roughness evaluation, improves confidence to select the appropriate measurement area for roughness evaluation, and improves awareness of the changes in the roughness results due to changes in measurement settings. This helps resolve the discrepancies observed while applying standards originally formulated for conventional surfaces on non-uniform AM surfaces. The work performed also proves that the investigated framework can characterize different materials and AM techniques.

Author Contributions

Conceptualization: A.P.N., M.S.V., and P.K.; Methodology: M.S.V., and P.K.; validation, M.S.V., and P.K.; Investigation: A.P.N.; Data curation: A.P.N., M.S.V., and P.K.; Writing—original draft preparation: A.P.N.; Writing—review and editing: M.S.V., and P.K., and S.H.Y.; Supervision: S.H.Y. All authors have read and agreed to the published version of the manuscript.

Funding

This research received no external funding.

Acknowledgments

This work was performed within the Rolls-Royce@NTU Corporate Lab, a joint university technology center between Nanyang Technological University and Rolls-Royce, with support from the National Research Foundation (NRF) of Singapore. The authors would like to thank the Manufacturing Technologies team at Rolls-Royce@NTU corporate lab, Singapore, for their support and contributions.

Conflicts of Interest

The authors declare no conflict of interest.

Nomenclature

Profile Surface Texture ParametersGeneral Terms
RaArithmetic mean deviation of the assessed profileφmMaximum diameter
RqRoot mean square deviation of the assessed profileSEMScanning Electron Microscope
RzMaximum height of the profileDMLSDirect Metal Laser Sintering
λcCut-off wavelengthSLMSelective Laser Melting
lnEvaluation lengthEBMElectron Beam Melting
ltTransverse lengthLENSLaser Engineered Net Shaping
VsStylus velocityAMAdditive Manufacturing
SpreStylus pre-travel length
SpostStylus post-travel length
Areal Surface Texture Parameters
SaArithmetical mean height of the scale limited surface
SzMaximum height of the scale-limited surface

References

  1. Gao, W.; Zhang, Y.; Ramanujan, D.; Ramani, K.; Chen, Y.; Williams, C.B.; Wang, C.C.L.; Shin, Y.C.; Zhang, S.; Zavattieri, P.D. The status, challenges, and future of additive manufacturing in engineering. Comput. Aided Des. 2015, 69, 65–89. [Google Scholar] [CrossRef]
  2. Tofail, S.A.M.; Koumoulos, E.P.; Bandyopadhyay, A.; Bose, S.; O’Donoghue, L.; Charitidis, C. Additive manufacturing: Scientific and technological challenges, market uptake and opportunities. Mater. Today 2018, 21, 22–37. [Google Scholar] [CrossRef]
  3. Lee, J.-Y.; Nagalingam, A.P.; Yeo, S.H. A review on the state-of-the-art of surface finishing processes and related ISO/ASTM standards for metal additive manufactured components. Virtual Phys. Prototyp. 2021, 16, 68–96. [Google Scholar] [CrossRef]
  4. Thompson, A.; Senin, N.; Maskery, I.; Körner, L.; Lawes, S.; Leach, R. Internal surface measurement of metal powder bed fusion parts. Addit. Manuf. 2018, 20, 126–133. [Google Scholar] [CrossRef]
  5. Grimm, T.; Wiora, G.; Witt, G. Characterization of typical surface effects in additive manufacturing with confocal microscopy. Surf. Topogr. Metrol. Prop. 2015, 3, 014001. [Google Scholar] [CrossRef]
  6. Jamshidinia, M.; Kovacevic, R. The influence of heat accumulation on the surface roughness in powder-bed additive manufacturing. Surf. Topogr. Metrol. Prop. 2015, 3, 014003. [Google Scholar] [CrossRef]
  7. Triantaphyllou, A.; Giusca, C.L.; Macaulay, G.D.; Roerig, F.; Hoebel, M.; Leach, R.K.; Tomita, B.; Milne, K.A. Surface texture measurement for additive manufacturing. Surf. Topogr. Metrol. Prop. 2015, 3. [Google Scholar] [CrossRef]
  8. Pyka, G.; Kerckhofs, G.; Papantoniou, I.; Speirs, M.; Schrooten, J.; Wevers, M. Surface Roughness and Morphology Customization of Additive Manufactured Open Porous Ti6Al4V Structures. Materials 2013, 6, 4737. [Google Scholar] [CrossRef] [PubMed] [Green Version]
  9. Olakanmi, E.O. Selective laser sintering/melting (SLS/SLM) of pure Al, Al–Mg, and Al–Si powders: Effect of processing conditions and powder properties. J. Mater. Process. Technol. 2013, 213, 1387–1405. [Google Scholar] [CrossRef]
  10. Yasa, E.; Poyraz, O.; Solakoglu, E.U.; Akbulut, G.; Oren, S. A Study on the Stair Stepping Effect in Direct Metal Laser Sintering of a Nickel-based Superalloy. Procedia CIRP 2016, 45, 175–178. [Google Scholar] [CrossRef] [Green Version]
  11. Gu, D.; Dai, D.; Chen, W.; Chen, H. Selective Laser Melting Additive Manufacturing of Hard-to-Process Tungsten-Based Alloy Parts With Novel Crystalline Growth Morphology and Enhanced Performance. J. Manuf. Sci. Eng. 2016, 138. [Google Scholar] [CrossRef]
  12. ISO 4288 BE. BS EN ISO 4288. Geometric Product Specification (GPS): Surface Texture: Profile Method: Rules and Procedures for the Assessment Ofsurface Texture; British Standards Institute: London, UK, 1988. [Google Scholar]
  13. ISO 25178-3 BE. BS EN ISO 25178-3. Geometrical Product Specifications(GPS): Surface Texture: Areal: Part 3: Specification Operators; British Standards Institute: London, UK, 2012. [Google Scholar]
  14. ISO 25178-2 BE. BS EN ISO 25178-2. Geometrical Product Specifications(GPS): Surface Texture: Areal 2: Terms, Definitions and Surface Texture Parameters; British Standards Institute: London, UK, 2012. [Google Scholar]
  15. Heinl, M.; Greiner, S.; Wudy, K.; Pobel, C.; Rasch, M.; Huber, F.; Papke, T.; Merklein, M.; Schmidt, M.; Körner, C.; et al. Measuring procedures for surface evaluation of additively manufactured powder bed-based polymer and metal parts. Meas. Sci. Technol. 2020, 31, 095202. [Google Scholar] [CrossRef]
  16. Nagalingam, A.P.; Yuvaraj, H.K.; Santhanam, V.; Yeo, S.H. Multiphase hydrodynamic flow finishing for surface integrity enhancement of additive manufactured internal channels. J. Mater. Process. Technol. 2020, 283, 116692. [Google Scholar] [CrossRef]
  17. Nagalingam, A.P.; Lee, J.-Y.; Yeo, S.H. Multi-jet hydrodynamic surface finishing and X-ray computed tomography (X-CT) inspection of laser powder bed fused Inconel 625 fuel injection/spray nozzles. J. Mater. Process. Technol. 2021, 291, 117018. [Google Scholar] [CrossRef]
  18. Nagalingam, A.P.; Yeo, S.H. Surface finishing of additively manufactured Inconel 625 complex internal channels: A case study using a multi-jet hydrodynamic approach. Addit. Manuf. 2020, 36, 101428. [Google Scholar] [CrossRef]
  19. Mumtaz, K.; Hopkinson, N. Top surface and side roughness of Inconel 625 parts processed using selective laser melting. Rapid Prototyp. J. 2009, 15, 96–103. [Google Scholar] [CrossRef]
  20. Fox, J.C.; Moylan, S.P.; Lane, B.M. Effect of Process Parameters on the Surface Roughness of Overhanging Structures in Laser Powder Bed Fusion Additive Manufacturing. Procedia CIRP 2016, 45, 131–134. [Google Scholar] [CrossRef] [Green Version]
  21. Nagalingam, A.P.; Yeo, S.H. Controlled hydrodynamic cavitation erosion with abrasive particles for internal surface modification of additive manufactured components. Wear 2018, 414–415, 89–110. [Google Scholar] [CrossRef]
  22. Cabanettes, F.; Joubert, A.; Chardon, G.; Dumas, V.; Rech, J.; Grosjean, C.; Dimkovski, Z. Topography of as built surfaces generated in metal additive manufacturing: A multi scale analysis from form to roughness. Precis. Eng. 2018, 52, 249–265. [Google Scholar] [CrossRef]
  23. Todhunter, L.D.; Leach, R.K.; Lawes, S.D.A.; Blateyron, F. Industrial survey of ISO surface texture parameters. CIRP J. Manuf. Sci. Technol. 2017, 19, 84–92. [Google Scholar] [CrossRef]
  24. ISO 4287 BE. BS EN ISO 4287. Geometrical Product Specification (GPS): Surface Texture: Profile Method: Terms, Definitions and Surface Texture Parameters; British Standards Institute: London, UK, 2000. [Google Scholar]
  25. Muralikrishnan, B.; Raja, J. Chapter-5, Computational Surface and Roundness Metrology; Springer: London, UK, 2008. [Google Scholar]
Figure 1. Investigative measurement framework.
Applsci 11 05089 g001
Figure 2. Working principle of the investigative measurement framework.
Applsci 11 05089 g002
Figure 3. Surface morphology of as-built AM components.
Applsci 11 05089 g003
Figure 4. Image processing steps to determine the maximum diameter of asperities. (a) raw SEM image; (b) post-processing to determine the edges; (c) definition of maximum diameter; and (d) measuring the maximum diameter of asperities.
Applsci 11 05089 g004
Figure 5. Particle size distribution in various AM surfaces: (a) SLM; (b) DMLS; (c) EBM; (d) LENS.
Applsci 11 05089 g005aApplsci 11 05089 g005b
Figure 6. Percentage deviation in profile surface roughness results due to change in cut-off wavelength and evaluation length. (a) SLM; (b) DMLS; (c) EBM; (d) LENS.
Applsci 11 05089 g006
Figure 7. Leveled surface topography of as-built AM components. (a) SLM; (b) DMLS; (c) EBM; (d) LENS.
Applsci 11 05089 g007
Figure 8. Surface topography of as-built SLM surface after filtering.
Applsci 11 05089 g008
Figure 9. Surface topography of as-built DMLS surface after filtering.
Applsci 11 05089 g009
Figure 10. Surface topography of as-built EBM surface after filtering.
Applsci 11 05089 g010
Figure 11. Surface topography of as-built LENS surface after filtering.
Applsci 11 05089 g011
Figure 12. Comparison of areal surface texture parameter results from: (a) ISO; and (b) investigative framework.
Applsci 11 05089 g012
Table 1. Summary of manufacturing methodology.
AM TechniqueMaterialProcess ParametersPost-Processing
Technique
SLMAl-Si-10MgPower: 200 W
Layer thickness: 25 µm
Powder size: 10 µm
H:15 × W:15 × T:3 mm
NIL
DMLSIN625Power: 200 W
Layer thickness: 50 µm
Powder size: 10–55 µm
H:25 × W:25 × T:3 mm
Heat-treated (1 h; 870 °C)
EBMTi-6Al-4VPower: 750 W
Layer thickness: 50 µm
Powder size: 25–50 µm
H:25 × W:25 × T:3 mm
Heat-treated (1 h; 930 °C)
LENSCo-Cr alloyPower: 1000 W
Layer thickness: 250 µm
Powder size: 25–100 µm
H:15 × W:15 × T:3 mm
NIL
Table 2. Maximum diameter of asperities in AM surface.
Asperity Type Loose ParticlesPartial MeltsBalling Melts/Semi-Welds
TechniqueArithmetic Mean ± SD (µm)
SLM17.17 ± 4.11135.75 ± 22.24283.85 ± 53.10
DMLS20.26 ± 6.7466.11 ± 16.51119.88 ± 17.35
EBMNANA78.10 ± 14.69
LENSNA86.54 ± 11.14NA
Note 1: The large standard deviations in the observed values are inherent due to the following reasons (a) large size variations in the similar type of asperities present on the AM surface and (b) method used to measure the size of asperities. Note 2: The flexibility to apply the absolute φm value as cut-off (λc) was limited due to the machine’s measurement software constraints. E.g., in surface roughness measurements, for >90 % transmission in a Gaussian filter, 2*φm = 34.3 µm should be applied to analyze loose particles in SLM, 2*φm = 271.5 µm should be applied to analyze partial melts. Hence, the values are rounded-off. The next possible λc value available in the measurement software was applied 2*φm = 34.3 µm, was rounded off to 80 µm as (next closest option available in the software). The results to be discussed in upcoming sections are limited to the conditions above. Nevertheless, if advanced measurement analysis software allows the user to select λc values specifically, this limitation can be eliminated.
Table 3. Reference line roughness parameters of different AM techniques.
Profile Surface Texture Parameters RaRqRz
TechniqueΛC/ln (mm)Arithmetic Mean ± SD (µm)
SLM2.5/12.516.24 ± 1.4023.31 ± 1.88123.24 ± 9.23
DMLS2.5/12.56.94 ± 0.249.29 ± 0.6754.32 ± 5.69
EBM2.5/12.520.48 ± 0.6425.46 ± 0.80120.63 ± 6.67
LENS2.5/12.511.48 ± 0.6914.77 ± 0.8165.58 ± 9.82
Table 4. Profile surface texture results for various cut-off wavelengths and evaluation lengths.
S. NoProfile Surface Texture Parameters RaRqRz
TechniqueΛC/Ln MmArithmetic Mean ± SD (µm)
1SLM0.025/0.1250.62 ± 0.280.75 ± 0.312.41 ± 1.00
20.08/0.43.08 ± 0.624.05 ± 0.8714.86 ± 4.28
30.25/1.259.05 ± 2.5411.22 ± 3.0942.12 ± 10.71
40.8/411.64 ± 1.710.82 ± 2.5661.4 ± 13.31
50.8/12.514.65 ± 1.5119.65 ± 2.50160.50 ± 20.17
62.5/419.44 ± 3.0829.09 ± 4.95156.39 ± 31.45
78/12.5NANANA
1DMLS0.025/0.125 0.36 ± 0.200.47 ± 0.251.61 ± 0.89
20.08/0.41.25 ± 0.341.56 ± 0.424.56 ± 2.37
30.25/1.253.08 ± 0.573.97 ± 0.8416.02 ± 3.19
40.8/46.19 ± 0.687.98 ± 0.9738.12 ± 4.95
50.8/12.55.78 ± 0.607.95 ± 0.9469.45 ± 9.68
62.5/46.85 ± 0.719.22 ± 1.6260.51 ± 17.62
78/12.57.32 ± 0.399.71 ± 0.5580.88 ± 11.67
1EBM0.025/0.125 0.33 ± 0.060.42 ± 0.101.36 ± 0.27
20.08/0.41.93 ± 0.382.44 ± 0.368.85 ± 1.05
30.25/1.257.40 ± 1.418.95 ± 1.5034.30 ± 6.12
40.8/415.74 ± 0.6719.06 ± 0.5883.25 ± 4.68
50.8/12.516.68 ± 0.6220.65 ± 0.69126.29 ± 8.08
62.5/420.34 ± 1.3725.84 ± 1.48138.55 ± 9.11
78/12.522.28 ± 0.6327.88 ± 0.80173.75 ± 16.61
1LENS0.025/0.1250.095 ± 0.020.131 ± 0.040.396 ± 0.13
20.08/0.40.44 ± 0.140.58 ± 0.18 2.16 ± 0.95
30.25/1.254.83 ± 4.295.98 ± 5.2422.74 ± 19.13
40.8/44.38 ± 0.725.76 ± 0.9424.97 ± 4.25
50.8/12.54.22 ± 0.859.80 ± 1.2789.79 ± 17.11
62.5/411.91 ± 2.1518.03 ± 1.7184.20 ± 26.36
78/12.5NANANA
Table 5. Areal surface texture evaluation for various filtering conditions.
S. NoTechniqueλc
(mm)
Sa (µm)Sz (µm)
Arithmetic Mean
WavinessRoughnessWavinessRoughness
1SLM0.02522.91.2521258.9
20.0820.94.89143157
30.2515.711.750.6210
40.86.78180162
1DMLS0.0255.960.57661.716.2
20.084.932.4731.733.3
30.253.524.612.847.8
40.81.995.71058.6
1EBM0.02520.20.76712827.5
20.0818.54.0110259
30.2513.311.639.999.4
40.85.7118.90145
1LENS0.02519.10.2261257.73
20.0818.81.2210827
30.2517.85.24080.3
40.812.713.40127
Table 6. Comparison of profile surface texture parameters from ISO and investigative framework.
Profile Surface Texture Parameter RaRqRz
Techniqueλc/ln
mm
Arithmetic Mean ± SD
(µm)
DMLS
(ISO framework)
2.5/12.56.94 ± 0.249.29 ± 0.6754.32 ± 5.69
DMLS
(investigative framework)
0.08/0.41.25 ± 0.341.56 ± 0.424.56 ± 2.37
0.25/1.253.08 ± 0.573.97 ± 0.8416.02 ± 3.19
Publisher’s Note: MDPI stays neutral with regard to jurisdictional claims in published maps and institutional affiliations.

