Article

Round Window Reinforcement-Induced Changes in Intracochlear Sound Pressure

1
Department of Otorhinolaryngology, Head and Neck Surgery, University Hospital Zurich, University of Zurich, 8091 Zurich, Switzerland
2
Dorset County Hospital, Dorchester DT1 2JY, UK
*
Author to whom correspondence should be addressed.
Appl. Sci. 2021, 11(11), 5062; https://doi.org/10.3390/app11115062
Submission received: 13 April 2021 / Revised: 26 May 2021 / Accepted: 26 May 2021 / Published: 30 May 2021
(This article belongs to the Section Biomedical Engineering)

Abstract

:
Introduction: The round window membrane (RWM) acts as a pressure-relieving membrane for incompressible cochlear fluid. The reinforcement of the RWM has been used as a surgical intervention for the treatment of superior semicircular canal dehiscence and hyperacusis. The aim of this study was to investigate how RWM reinforcement affects sound pressure variations in the cochlea. Methods: The intracochlear sound pressure (ICSP) was simultaneously measured in the scala tympani (ST) and scala vestibuli (SV) of cadaveric human temporal bones (HTBs) in response to acoustic stimulation for three RWM reinforcement materials (soft tissue, cartilage, and medical-grade silicone). Results: The ICSP in the ST was significantly increased after RWM reinforcement for frequencies below 2 kHz. Between 400 and 600 Hz, all three materials demonstrated the highest median pressure increase. The higher the RWM stiffness, the larger the pressure increase: silicone (7 dB) < soft tissue (10 dB) < cartilage (13 dB). The ICSP in the SV was less affected by reinforcement. The highest median pressure increase was 3 dB. The experimental findings can be explained with numerical models of cochlear mechanics. Discussion and conclusions: RWM reinforcement increases the sound pressure in ST at lower frequencies but only has a minor influence on the SV pressure.

1. Introduction

The biomechanical hearing process relies on sound transmission from the outer ear via the middle ear ossicles toward the inner ear (cochlea). The mechanical vibration of the stapes footplate at the end of the middle ear drives sound energy into the cochlea. This transmitted sound creates intracochlear sound pressure (ICSP) in the cochlear fluid, particularly in the scala vestibuli (SV) and scala tympani (ST), which are interconnected at the apex. The ICSP difference (PDIFF) between the SV and ST triggers a passive traveling wave in the basilar membrane and leads to the excitation of sensorial structures [1].
The round window membrane (RWM) mechanically seals the fluid-filled cochlea from the middle ear cavity at the base of the ST. The RWM is an approximately 70 μm-thick, elliptically shaped, compliant biological structure that is anatomically located within the round window niche in the medial wall of the middle ear [2]. The RWM with its compliant characteristics serves as a pressure release mechanism for the incompressible fluid in the cochlea, enabling the PDIFF at the basal part of the cochlea.
Increasing the stiffness of the RWM by manipulating its intrinsic properties or by any artificial means is termed the “reinforcement of the RWM”. RWM reinforcement techniques for clinical applications have received attention for more than two decades [3]. Artificially reinforced RWMs are claimed to provide better hearing for patients suffering from diseases such as superior semicircular canal dehiscence, hyperacusis [4], and perilymphatic fistula [5]. The main materials used in clinical applications for RWM reinforcement are perichondrium, cartilage, and fascia [5,6].
After cochlear implantation surgery through the RWM, several clinical studies claimed post-operative low-frequency (<1 kHz) hearing loss in the range of 20–25 dB [7,8,9,10]. Among several causes (i.e., insertion trauma), the change in ICSP due to the stiffness increase in the RWM (artificially reinforced RWM) after the CI surgery is also regarded as a possible reason for this auditory defect. Thus far, sufficient data are missing to fully understand the cause of the potential loss in residual hearing after CI surgery.
To understand the influence of RWM reinforcement on hearing, Wegner et al. (2016) examined the changes in the middle ear sound transfer function (METF) after RWM reinforcement. The study involved cadaveric human temporal bones (HTBs) and RWM reinforcement with perichondrium and cartilage. A drop in METF with RWM reinforcement was attributed to the dominance of the cochlear input impedance in RWM stiffness at lower frequencies [5,11,12]. However, the authors concluded that the reinforcement of the RWM had no statistically significant effect on the METF. Similarly, Guan et al. (2018) claimed for one HTB sample that the effect on the METF after RWM reinforcement was negligible even after maximum reinforcement using perichondrium, cartilage and Jeltrate [13].
Beyond understanding the effects of RWM reinforcement on METF, sound pressure measurement in the SV (PSV) and ST (PST) provides insight into the ICSP changes caused by RWM reinforcement. Guan et al. (2018) reported an increased ICSP gain (PSV and PST relative to the ear canal pressure (PEC)) with RWM reinforcement in both scalae. The gain in ST and SV showed a maximum increase of 18 dB between 50 and 800 Hz and 10 dB below 500 Hz, respectively. In the lower-frequency spectrum (200–1000 Hz), the authors observed a reduced PDIFF of approximately 5 dB but no significant influence on PDIFF at higher frequencies. However, to verify the significance of these experimental claims, a study with a larger sample size is crucial.
Numerical models of the cochlea based on approximated physiological parameters are useful for understanding the experimental results and estimating values that are not directly measurable. A lumped element model (LEM) of the cochlea was introduced by Nakajima et al. (2009) to estimate the RWM impedance (ZRWM) behavior on the cochlear mechanics. Later, Elliot et al. (2016) carried out a study based on a finite element model (FEM) with an improved LEM of the cochlea. Elliot’s model could predict the above-mentioned post-operative hearing loss after cochlear implantation (CI) due to the stiffening of the RWM. Their numerical simulations predicted that while a 10-fold increase in RWM stiffness would significantly influence residual hearing loss, a 100-fold stiffness increase might cause a residual hearing loss of up to 20 dB [8].
In this study, we investigate the effects of the ICSP changes (PST, PSV, and PDIFF) caused by RWM reinforcement with three clinically used materials on HTBs. In addition, the experimental findings are compared with the simulation output of the numerical models developed by Nakajima et al. (2009) and Elliot et al. (2016). Up to date, this is the first study to report data of ICSP changes due to RWM reinforcement on a series of HTBs, and to compare experimental data with data from numerical models.

2. Materials and Methods

2.1. Human Temporal Bone Samples and Experimental Protocol

For this study, cadaveric HTBs (Science Care, Phoenix, AZ, USA) harvested within 48 h and immediately frozen after the death of the donors were used. The HTBs were stored at −19 °C in a temperature-regulated freezer until they were used in the experiments. The HTBs were thawed under atmospheric conditions for four to five hours prior to surgical preparation. Experiments with the HTBs were approved by the local ethics committee (KEK-ZH-Nr. 2014-0544) and were in accordance with the Helsinki Agreement of 1975 revised in 2013.
A total of 20 HTBs were used for the experiments. Three HTBs were used in pre-trial experiments to develop the experimental methods. Of the remaining 17 HTBs, 11 were excluded due to nonconformity during the experiment preparation or anomalous results. The age range of the final 6 samples (3 female and 3 male) was a mean of 74 years with a standard deviation (SD) of ±16 years. The experimental protocol consisted of surgical preparation (cp. 2.2) and functionality verification tests (cp. 2.4) of the HTBs before ICSP measurements were performed under several RWM reinforcement conditions (cp. 2.5).

2.2. Surgical Preparation

When preparing an HTB sample, first the excess soft tissue was removed. Then, the bony ear canal was carefully drilled until there was an unobstructed view of the tympanic membrane (TM). The upper end of the bony ear canal was kept approximately even and 1–2 mm above the TM. The middle ear cavity was opened wide from the facial recess structures and the facial nerve was removed to access the middle and inner ear. The surgical approach was optimized to gain a broader view of the stapes footplate and the RWM. The bony overhang in the round window niche was drilled to ensure an orthogonal view on the RWM [14]. The cochlear promontory near the oval and round window was thinned during preparation to perform a swift cochleostomy procedure for the insertion of hydrophone probes.
Furthermore, the soft tissue membrane on the stapes footplate and the outer epithelium of the RWM (pseudo-membrane) were carefully removed to prevent water retention and to provide optimal conditions for laser Doppler velocity measurement on the stapes and RWM [15].
As an artificial ear canal (AEC), a solid plastic tube with a volume of 2 mL was fixed above the TM with a strong adhesive product (BLUFIXX GmbH, Wesseling, Germany) and Play-Doh. Throughout the experiment, the HTB sample was kept moist by spraying water at five- to ten-minute time intervals.

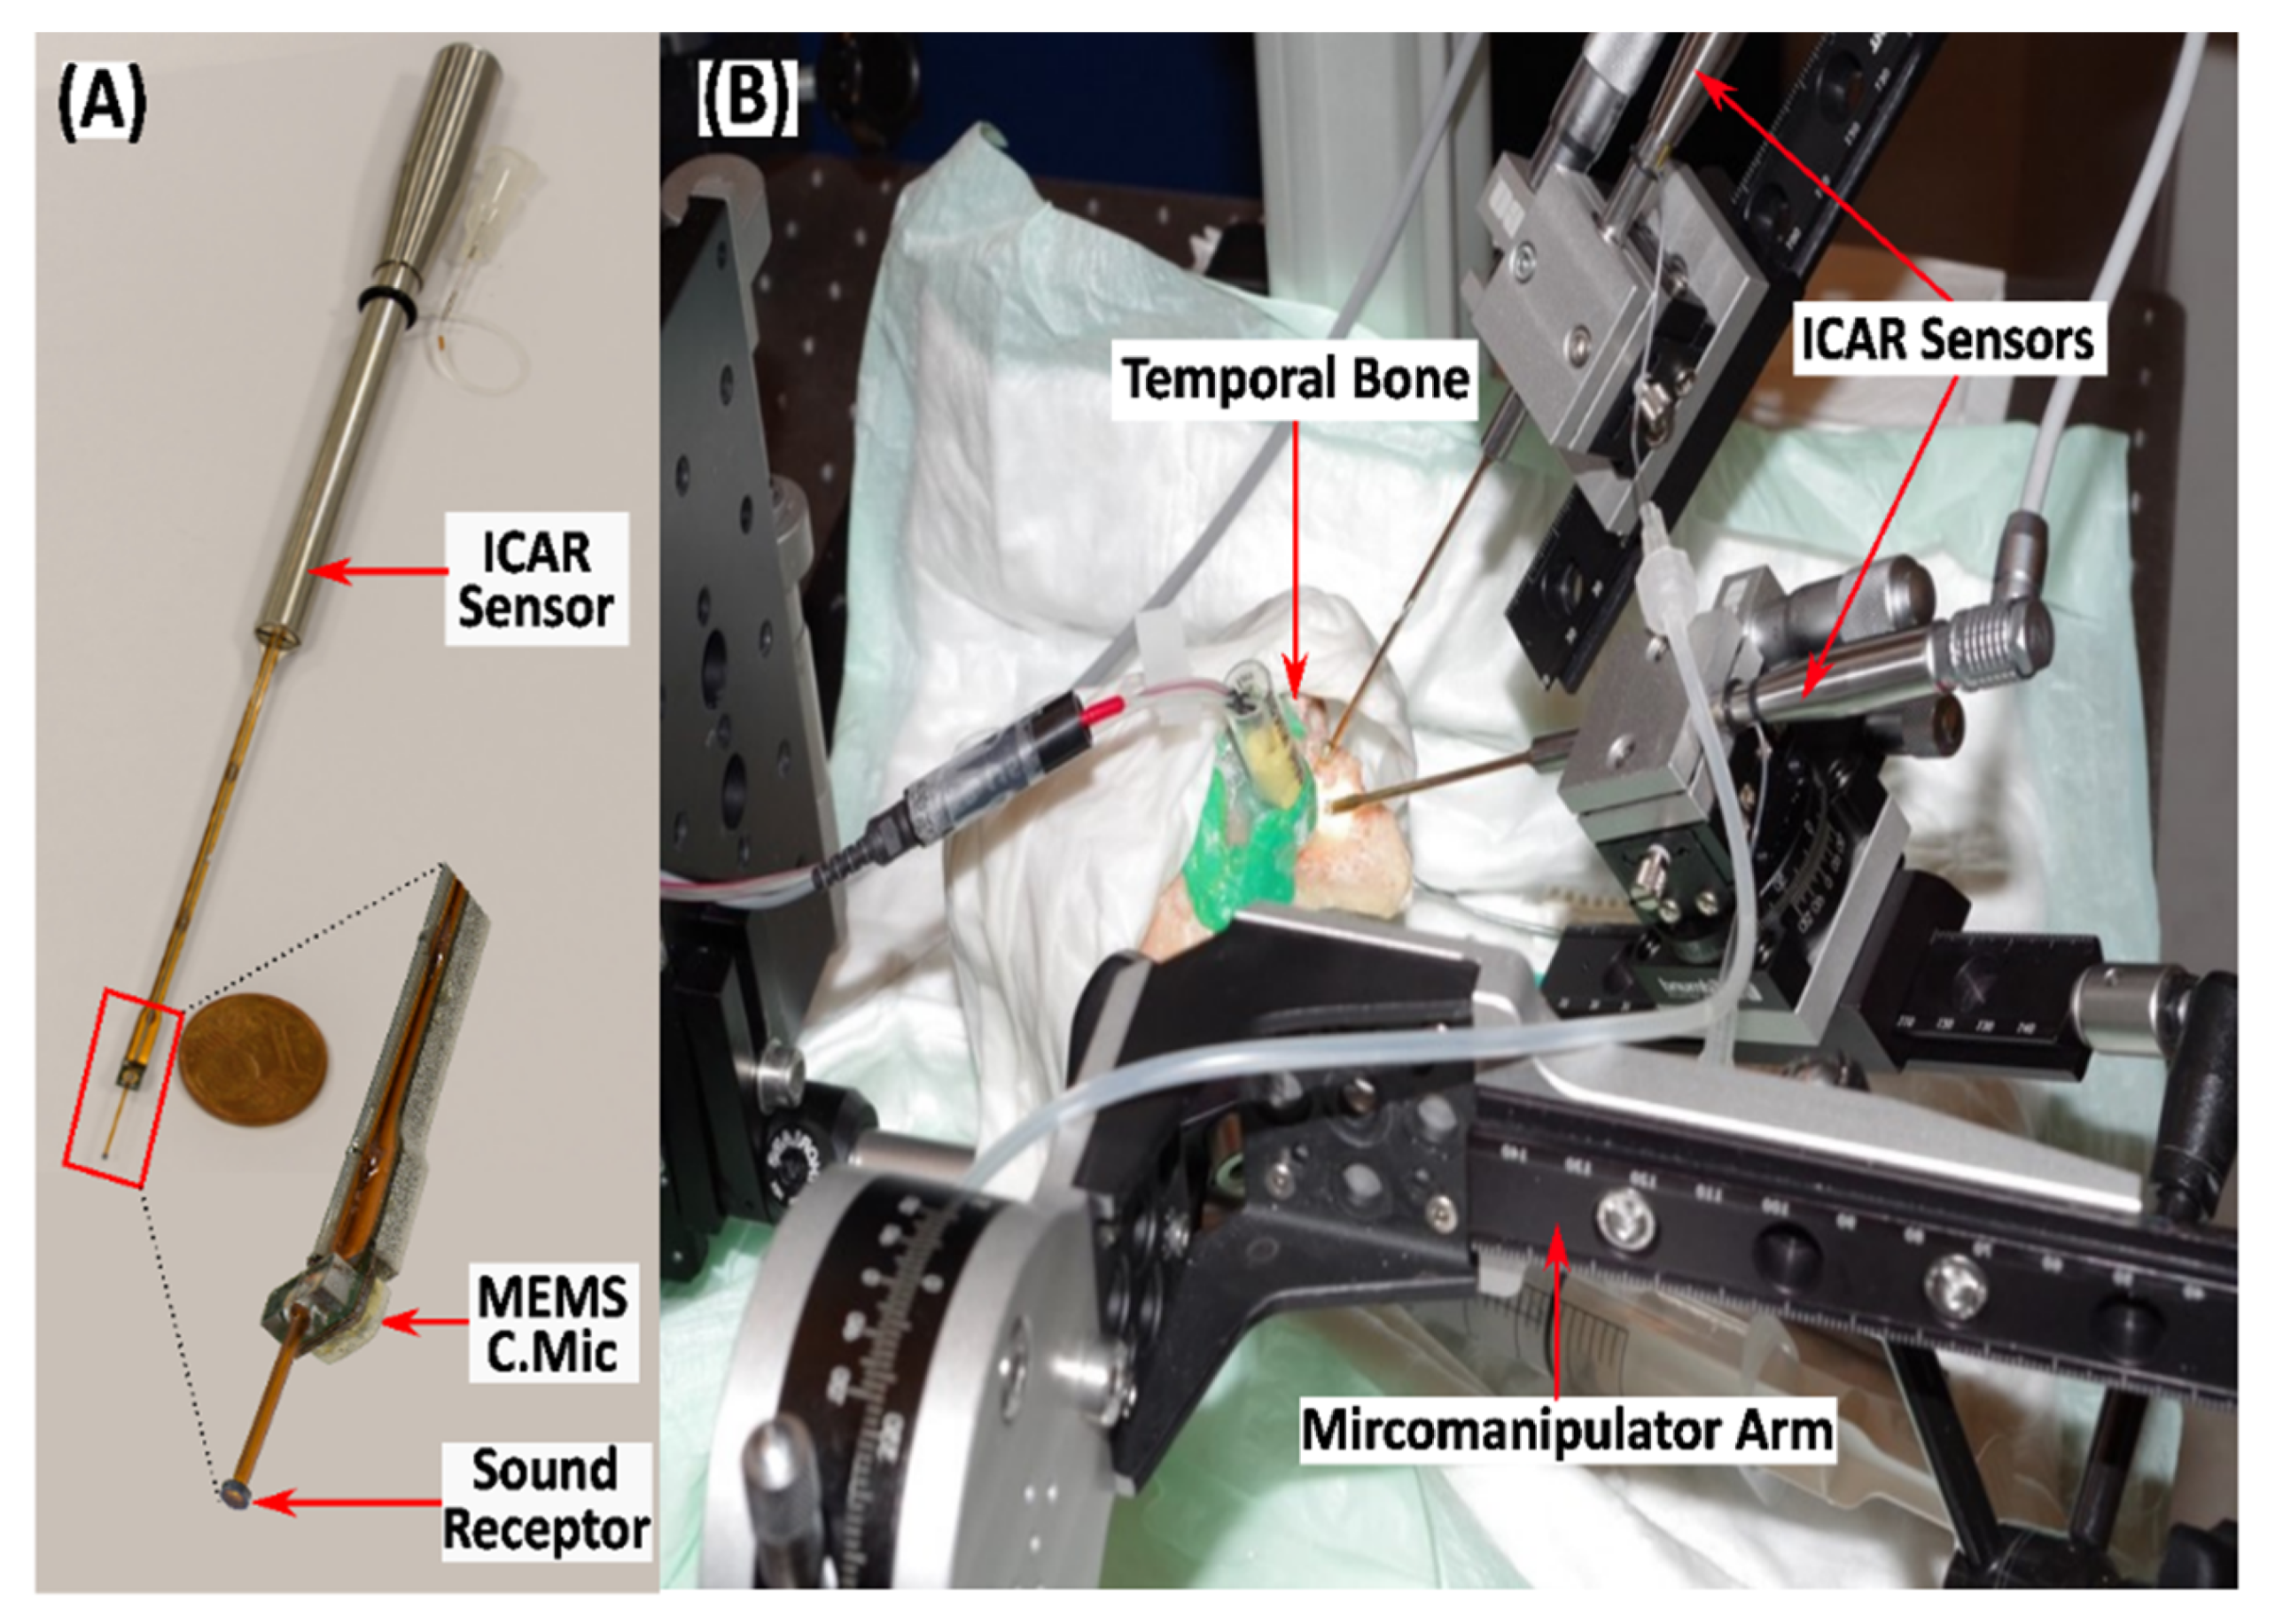
2.3. Measurement Setup

The HTB experiments were carried out on a passive damped optical table with pneumatic isolation to eliminate vibration artifacts from the environment. The prepared HTB was attached on the z-stage of a micromanipulator customized for ICSP measurement.
A loudspeaker and a reference microphone probe tip (ER-2 and ER-7C, Etymotic Research Inc., Elk Grove Village, IL, USA) fixed through a foam earplug were inserted into the AEC and placed 2–3 mm above the tympanic membrane. Acoustic stimulation was generated by an audio analyzer (APx585, Audio Precision Inc., Beaverton, OR, USA) and delivered to the loudspeaker through an audio amplifier (RMX 850, QSC Audio Products LLC, Costa Mesa, CA, USA) as a stepped sine stimulation signal consisting of at least 21 frequencies logarithmically distributed within the frequency range of 200–8000 Hz. The sound pressure levels in the ear canal were recorded by the reference microphone. All experiments were performed with sound pressure levels between 80 and 120 dB SPL at the TM.
A single-point laser Doppler vibrometer (LDV) (CLV-2534-3, Polytec GmbH, Germany) mounted on a surgical microscope was used to measure the velocities of the stapes footplate (VSTAP) and the RWM (VRWM). To maximize the intensity of the reflected laser beam, retro-reflective beads (aluminum-coated solid barium titanate glass microspheres, 50 µm diameter; Cospheric LLC, Goleta, CA, USA) were placed on the stapes footplate and the RWM.
ICSP was measured in the ST and SV in accordance with a previously described method by our group [16,17]. The probes for the ICSP recording (miniature hydrophones) were built on a commercial micro-electromechanical system (MEMS) condenser microphone (ADMP504, Analog Devices Inc., Norwood, MA, USA), whose pressure port was customized with a tiny micro-tube terminated with a polyimide diaphragm as the pressure sensing element (cf. Figure 1A). The sensors were calibrated before the experiments using a vibrating water column method, as described in [17].
The ICSP in the ST and SV and the AEC sound pressure level were recorded simultaneously using the Audio Analyzer APx585 (Audio Precision Inc., Beaverton, OR, USA). The raw data were post-processed by a bandpass filter based on a digital third-order Butterworth filter. An average of over 3 subsequent measurements was performed for each step of the applied stepped acoustic stimulation frequency sweep. The measurement data obtained from a LabVIEW 2017 (NI, Austin, TX, USA) virtual interface for data acquisition and signal processing were further analyzed and plotted using MATLAB 2019a (MathWorks, Natick, MA, USA).

2.4. HTB Functionality and ICSP Measurements

After the surgical preparation, the METF and the inner ear hydrodynamic condition of the cochlea were assessed to confirm proper sound transmission from the ear canal to the cochlea.
The METF was assessed as the VSTAP in response to acoustic stimulation. It was calculated and compared with the standard reference values published by the American Society for Testing and Materials (ASTM) [18].
To verify that no air bubbles that could modify the hydrodynamics of the ICSP were present in the cochlear fluid, the phase difference between the VSTAP and VRWM was calculated. A phase difference of 180° (SD ± 7.2°) between the VSTAP and VRWM in the frequency range between 100 and 500 Hz is an indication that no air bubbles are present in the cochlear ducts [19].
For sensor insertion, a cochleostomy was performed by an experienced surgeon (A.D., M.C.) in the exposed bony basal turn of the cochlea. The first cochleostomy was performed in the ST and the second in the SV, approximately 1–2 mm medial to the ventral edge of the RWM. A skeeter drill (Medtronic Xomed, Jacksonville, FL, USA) with a diameter (0.6 mm) slightly larger than that of the sensor head (0.5 mm) was used. The drilling process was carried out under saline water to prevent air infiltration to the cochlea through the cochleostomies. The surgeon confirmed that no damages occurred to the anatomical structures during the cochleostomy procedure.
The HTBs were fixed with the cochleostomies located approximately at the highest point of the cochlea, as depicted in Figure 1B. The sensor used for ST measurements was navigated using a micromanipulator with seven degrees of freedom and a 10 μm adjustment precision. The second sensor (SV measurement) was mounted on an articulated arm with a 2-axis micromanipulator at the base and an additional micro-positioning stage at the front end to control sensor insertion. A surgical microscope was used to insert the sensors into the cochlea. The insertion depth of the sensors was adjusted between 0.5 and 1.0 mm for all samples. The liquid level of the cochlea was maintained constant during sensor insertion to avoid air being entrained in the cochlea fluid. The gap between the outer rim of the sound receptor tube and the bony cochlear surface was sealed with a thin layer of soft tissue topped with a layer of Jeltrate to reinforce the seal (cf. Figure 2).
The first ICSP measurement after sensor fixation was used as the baseline measurement for comparison with the ICSP data reported in the literature. The noise floor and signal-to-noise ratio (SNR) were determined while the acoustic stimulation was switched off. Only data with an SNR higher 7 dB were considered as results in the present study.

2.5. Reinforcement of RWM

For the reinforcement of the RWM, three clinically used materials were applied: soft tissue, cartilage, and medical-grade silicone (Invotec International, Inc., Jacksonville, FL, USA). Soft tissue and cartilage samples were harvested during the surgical preparation of the HTB sample and kept in a saline solution until use. The reinforcement material was approximately shaped to the size of the RWM to uniformly cover the whole RWM surface area. The reinforcement material was applied during the experiment in a specific order that was defined by an increasing stiffness of the material: soft tissue, cartilage, and silicone. The order in which the material was applied was defined to minimize the risk of damaging the RWM during reinforcement.
Remnants of water on the RWM or in the middle ear cavity were removed carefully by suction before and after each experiment. The structural integrity of the RWM was inspected with a surgical microscope and verified for any damage that might have occurred during the manipulation. The ICSP was recorded after the removal of each material to exclude RWM impedance changes caused by the manipulation and as a baseline measurement for the next material reinforcement step.
In general, only the effect of the RWM reinforcement on the ICSP was investigated in the present study. However, in samples HTB-11, HTB-12, and HTB-20, VSTAP was additionally recorded after RWM reinforcement to verify its effect on the METF and for comparison with Wegner et al. (2016) research findings (Appendix A).

2.6. Numerical Approach to Assess the Effect of RWM Reinforcement on Cochlear Hydrodynamics

Numerical simulations using two models of the cochlea [8,11] were conducted to support our experimental data from the ICSP measurements after the RWM reinforcement. The simulations enabled us to estimate the RWM impedance after reinforcement and its components, including inertia and stiffness. Quantifying the RWM impedance by the simultaneous measurement of PST and the RWM volume velocity (URWM) is challenging, since the RWM motion modes differ from simple piston movement across frequencies [20,21]. Additionally, after the reinforcement process, the RWM is occluded and the reliable measurement of the URWM is not possible.
Both numerical models considered in the present study are LEMs that rely on the analogy between electrical, mechanical, fluidic, and acoustic domains to describe the behavior of a specific physical system as a circuit of lumped elements. The analogy only holds if the wavelength of the sound wave in the given system’s fluidic or solid medium is much larger than the largest geometrical dimension of the system [22]. A LEM of the cochlea transforms its fluid dynamic behavior into an electrical system and represents the fluidic characteristics by electrical components: inductors (L), capacitors (C), and resistors (R). The sound pressure (P) and volume velocity (U) are equivalent to the voltage (V) and current (I), respectively, of an electrical system.
The model published by Nakajima et al. [11] used the stapes volume velocity (USTAP) to calculate the ZRWM of a normal RWM using the assumption that USTAP = URWM [20]. Due to the RWM reinforcement, it is doubtful whether this assumption is still valid, as other anatomical channels (vestibular aqueduct (VA) and cochlear aqueduct (CA)) can be activated to relieve the pressure. Considering this model limitation, Elliot et al. (2016) [8] presented an extended model of the cochlea by including VA and CA leakage pathways into their model to act as high-impedance pressure-relieving channels when the RWM is stiffened. Despite the mentioned weakness of the Nakajima model if applied on a cochlea with reinforced RWM, we still considered it for comparison with the experimental data due to its simplicity and the need for fewer modeling assumptions compared to the Elliot model. A detailed description of both models, the corresponding model parameters, and a discussion of the results from the numerical simulations and the experiments are added to Section 4.3.

3. Results

3.1. Validation of the Experimental Method

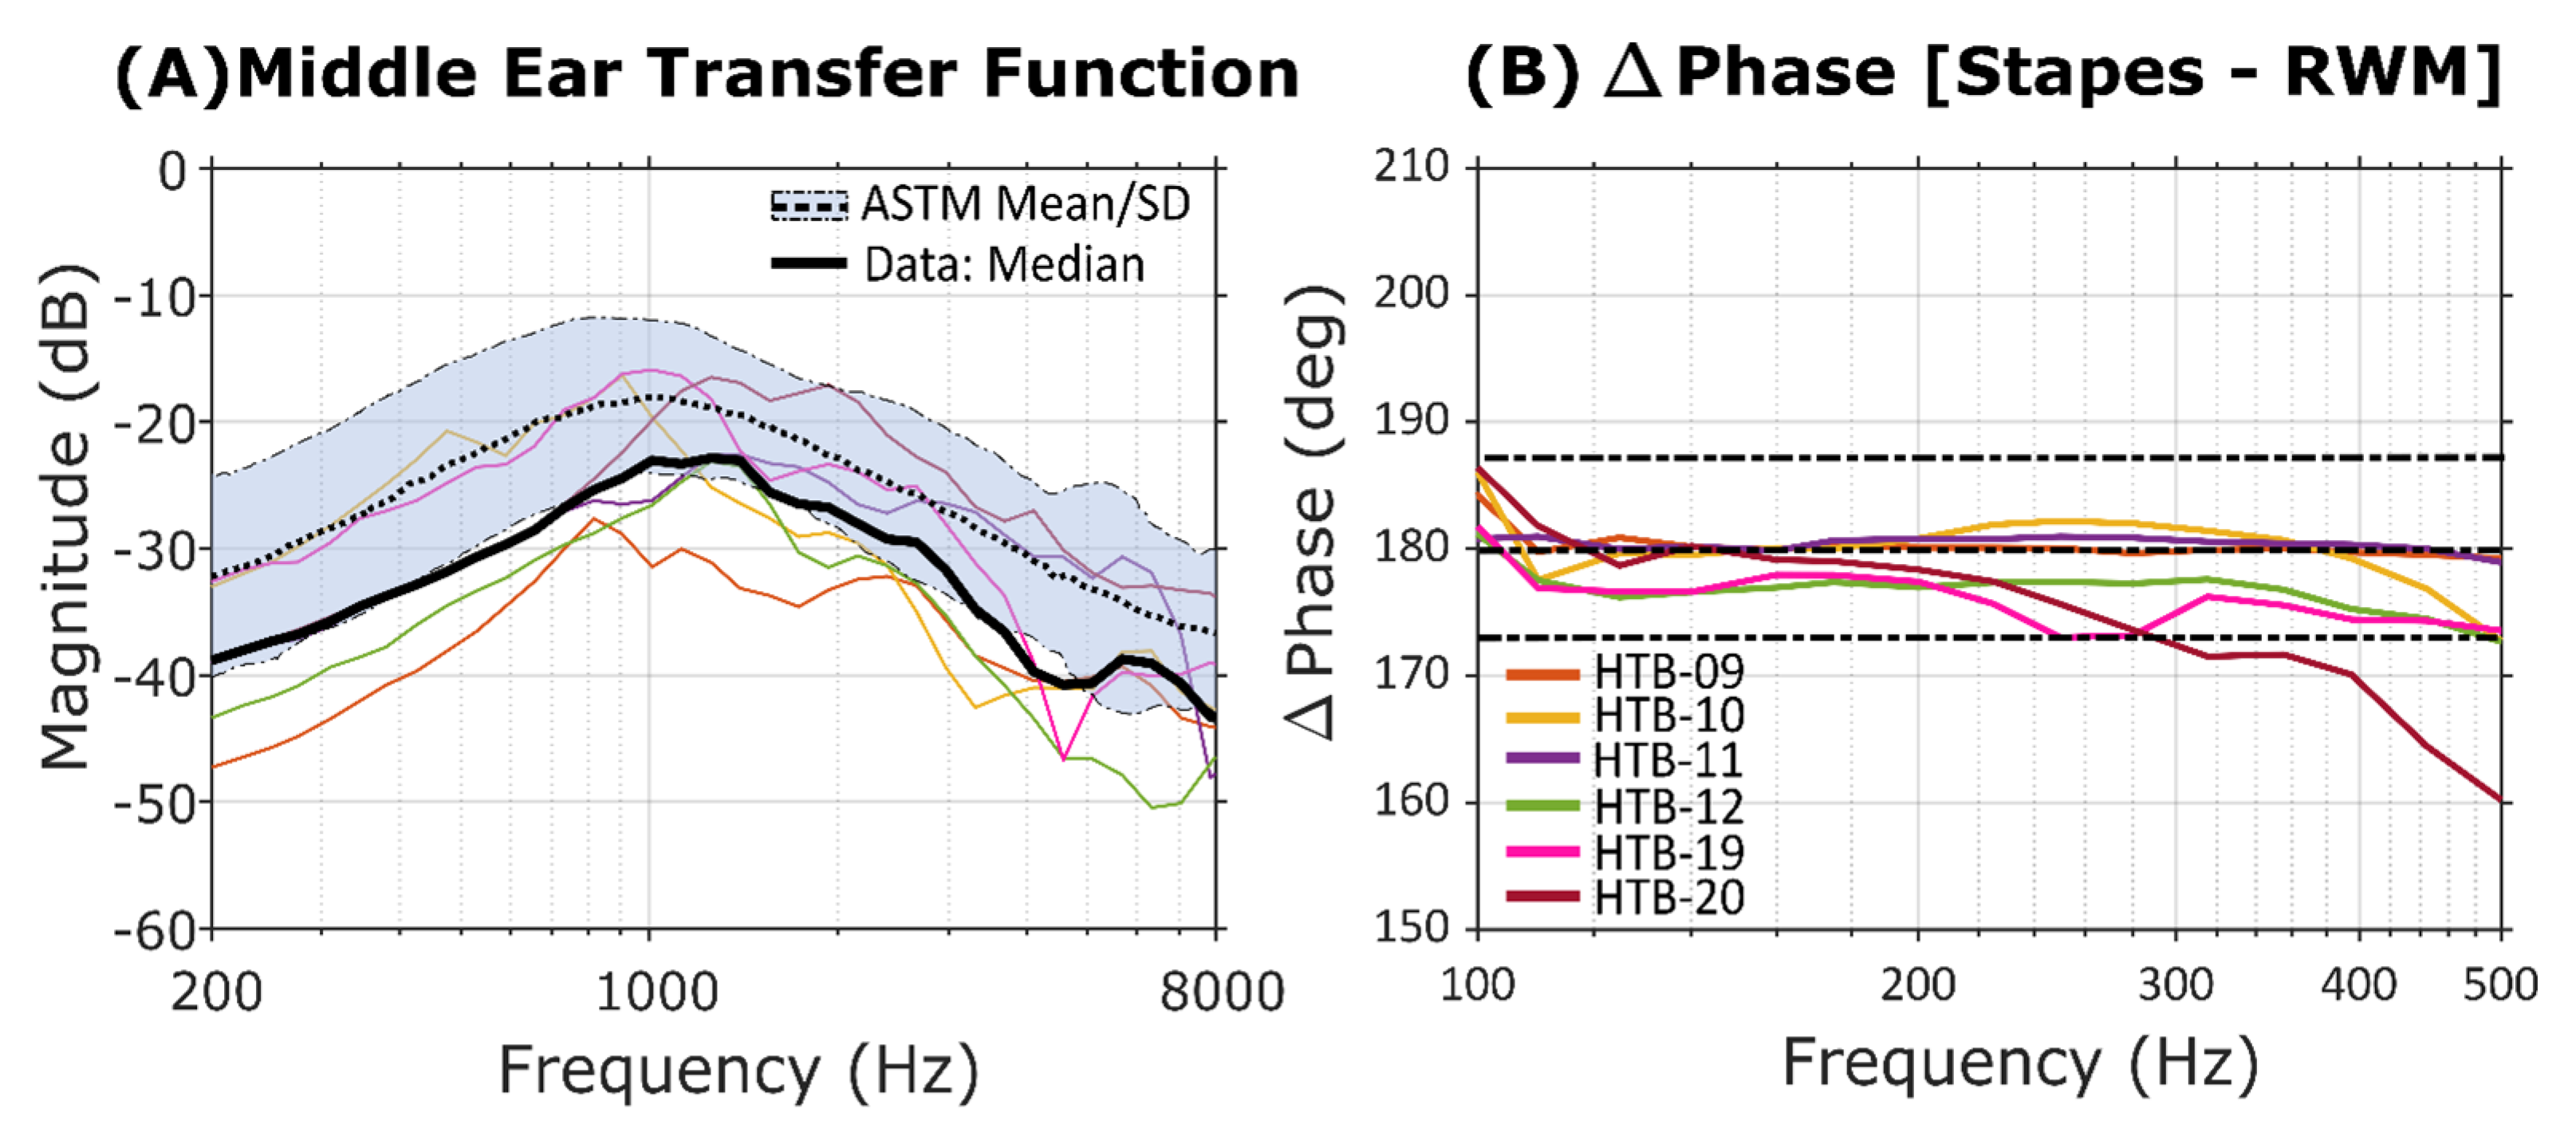
3.1.1. Assessment of the Middle Ear Function and the Hydrodynamic Condition of the Cochlea

The METF of each HTB and the corresponding median of all samples are shown in Figure 3A in comparison to the ASTM mean and SD [18]. The median METF follows the lower end of the ASTM standard range, with a peak at approximately 1.1 kHz. Although not every HTB showed an METF within the ASTM standard, the corresponding samples were still considered for the current study, as the main aim was to investigate the relative ICSP changes caused by RWM reinforcement.
The phase difference between the stapes and the RWM in the low-frequency spectrum (100–500 Hz) is shown in Figure 3B. Except for HTB-20, all the other HTBs are within a range defined as a ±7.2° phase deviation from half a cycle phase difference. The cochlear duct system of these HTB samples was therefore considered as free of air bubbles. In HTB-20, the phase difference decays with increasing frequency and deviates by 20° at 500 Hz. Therefore, HTB-20 was not considered for further investigations with reinforced RWM.

3.1.2. Intracochlear Pressure Measurements in Scala Tympani and Scala Vestibuli

Figure 4A (magnitude) and Figure 4B (phase) display the individual experimental ICSP data for ST, while Figure 4C (magnitude) and Figure 4D (phase) display the corresponding data for SV. The ICSP data are normalized with respect to the ear canal pressure PEC and denoted as the ICSP gain. For comparison, the minimum/maximum range of the ICSP gain data reported by Nakajima et al. (2009) was plotted in the same graphs as a shaded area. In general, the ICSP gain values of both scalae were lower compared to the reference data. For ST, at approximately 500 Hz the median ICSP gain drops below the lower limit of the reference data range by up to 12 dB. At frequencies above 800 Hz, the median ICSP gain generally coincides with the lower limit of the reference data range. For SV, the deviation from the reference data follows a similar trend as for ST, except that the comparatively low ICSP gain values within the low-frequency range are seen at up to 1.1 kHz. The phase data for ST and SV can be considered in fair agreement with the reference data.

3.1.3. Effect of RWM Reinforcement on ICSP Measurement

The typical change in ICSP gain due to RWM reinforcement that was observed in the present study is illustrated in the data from four simultaneous ICSP measurements on HTB-10 and HTB-11 using cartilage and soft tissue as reinforcement material (cf. Figure 5). The individual figures show the ICSP gain for both scalae before (baseline) and after the RWM reinforcement. In general, a considerable increase in ICSP after RWM reinforcement was identified in ST at frequencies below 1 kHz. In SV, the corresponding pressure increase is moderate or even negligible.
The sample HTB-10 experienced the largest increase in ST pressure by more than 15 dB after adding soft tissue to the RWM (cf. Figure 5A). The cartilage showed similar behavior to the soft tissue, despite its higher material stiffness (cf. Figure 5B). It was expected that soft tissue could be better adapted to the surface geometry of the RWM and hence allow for a more repeatable and efficient means of RWM reinforcement than using stiffer cartilage material. However, using HTB-11 cartilage led to a higher pressure in ST than using soft tissue (13 dB versus 5 dB, cf. Figure 5C,D), but overall, the change in ST pressure was less pronounced compared to that for HTB-10, especially if the effect of reinforcement on the SV pressure was considered. The investigations on HTB-10 nicely demonstrate that the pressure difference across the partition can be considerably reduced or can even vanish after RWM reinforcement and at frequencies below 500 Hz. Consequently, a reduced hearing sensation within that frequency range might result from RWM manipulation.
To highlight the effect of RWM reinforcement on the ICSP in ST and SV for all considered HTBs, the ratio between the ICSP after (indicated with an apostrophe) and before (indicated as the baseline) reinforcement was calculated and denoted as the relative pressure gain.
The corresponding data are shown in Figure 6. Figure 6A,B quantify the effect of cartilage reinforcement in ST and SV for all considered HTBs together with the respective medians, and Figure 6C,D show the same but for silicone used as a reinforcement material. Finally, the median curves for all the reinforcement materials are summarized in Figure 6E,F. The individual data for soft tissue are not shown, since they do not provide more insight into the effect of RWM reinforcement on the inner ear sound pressure. The data confirm the aforementioned considerably higher increase in sound pressure in ST compared to SV after RWM reinforcement and within the low-frequency range (<2 kHz), where pressure changes are attributed to RWM reinforcement. The large variation in relative pressure gain between the individual samples is noticeable. With cartilage reinforcement, the gain in ST can reach a maximum gain of up to 25 dB (HTB-12), but in another trial a maximum gain as small as 5 dB was identified (HTB-9). The other reinforcement materials show similar variations between the samples. Considering the median values, cartilage provides the highest increase in ST pressure, followed by soft tissue. Although silicone is regarded as the material with the highest stiffness of the three materials considered in the present study, it shows the lowest efficiency for RWM reinforcement. We believe that the proper placement of the reinforcement materials that are in good contact with the RWM is crucial for a high and repeatable reinforcement effect. The relatively stiff silicone material makes it challenging to achieve this requirement. Furthermore, larger anatomical variations in the RWM niche between samples and the lack of ability to objectively assess the placement of the material on the RWM make it difficult to achieve a better repeatability between individual samples.

4. Discussion

4.1. Validation of the HTB Functionality

The functionality of the HTB samples was assessed by using the METF against the standard ASTM and verifying the phase difference between the stapes and the RWM at low frequencies (cf. Figure 3). The METF of several samples was below the ASTM standard range across the whole considered frequency range (200 Hz–8 kHz). We assume that the lower METF is mostly the result of age-related effects, such as a less compliant tympanic membrane that reduces the sound energy transmitted to the middle ear [23]. The mean age of the sample was 74 years. In addition, the ossicles and soft tissue structures in the middle ear are subjected to common diseases that can affect the METF [24]. The freezing of the HTBs after extraction might affect the membranous structures such as the RWM and TM. Therefore, using fresh samples might lower the variability of the RWM reinforcement effect on the ICSP between individual samples. During the experiment, the samples were kept from drying with assisted moisturization. However, the drying of the sample during the time taken for preparations and measurements cannot be completely ignored [25]. After the cochleostomy in ST and SV were drilled and the sensors were inserted the surgeon visually confirmed that no damages occurred to the middle or inner ear structures. Additional confirmation of the HTB functionality after sensor insertion by measuring the stapes and RWM motion was not feasible due to the obstructed visual access to the stapes by the two hydrophones.
The measured ICSP data were compared with the corresponding data reported by Nakajima et al. [11]. A trend towards lower values than the reference data was also observed during the ICSP measurements. Mainly at frequencies below 2 kHz, where the effect of RWM reinforcement on the ICSP is significant, the measured ICSP data were well below the lower limit of the reference data. While in the present study we are more interested in changes in the ICSP due to RWM reinforcement than in absolute pressure values, it is important to assess the hydrodynamic condition of the cochlea under investigation and thus confirm that the comparatively low METF and ICSP data are not related to the inner ear mechanics. This was accomplished by calculating the input impedance (ZC) of the cochlea, which is defined as the ratio between the vestibuli pressure PSV and the volume velocity of the stapes (VSTAP * A), where A (3.2 mm2) indicates the area of the stapes footplate [11,23]. The VSTAP was measured prior hydrophone insertion, as simultaneous measurements of ICSP and the VSTAP were not possible due to space restrictions in the opened middle ear cavity. The data were then compared with several reference data from the literature [11,23,26]. The behavior of the ZC closely resembles resistive behavior, as the phase data show values close to zero across the considered frequency range and similar to the reference data (cf. Figure 7). The wider SD in the phase data above 1 kHz suggests that the complex motion of the stapes gains significance. This could have been alleviated by using a 3D LDV for stapes velocity measurements instead of a single-point LDV, as available for the present study [11]. The median magnitude of ZC is in good agreement with Aibara et al. (2001) and slightly below the data of Nakajima et al. (2009) until 6 kHz. Above 6 kHz, a larger deviation can be identified between our data and the reference data. Since the effect of RWM reinforcement on the ICSP is limited to frequencies below 2 kHz, the HTBs used in the present study can be classified as being valid for this study.

4.2. Effect of RWM Reinforcement on the ICSP

Using cartilage as a reinforcement material, a maximum median (of all samples) PST change of 13 dB was identified after the RWM reinforcement (cf. Figure 6). In general, significant RWM reinforcement-induced changes in PST were observed only at frequencies below 2 kHz. These results are in good agreement with the corresponding data reported previously by Guan et al. (2018) for one HTB [13]. The sound pressure in the basal part of the scala vestibule (PSV) did change considerably less (<3 dB) than in the scala tympani. This behavior indicates that pressure-relieving mechanisms such as the cochlear and vestibular aqueducts prevent a strong increase in ZC due to the stiffened RWM. The fact that RWM reinforcement did not have a significant influence on the stapes velocity (cf. Figure A1, Appendix A) further confirms the relevance of the aqueducts as soon the RWM is reinforced. However, Guan et al. (2018) reported an increase in PSV of up to 10 dB after stiffening the RWM with a combination of perichondrium, cartilage, and Jeltrate, whereas in our study, we could only observe a pressure increase below 3 dB using cartilage. Nevertheless, it is important to note that the results of Guan et al. (2018) stem from only one HTB sample.
Considering the individual samples instead of the averaged data, RWM reinforcement-induced changes in PST of up to 25 dB but also below 5 dB were observed. We expect that the large variation in the reinforcement effect between individual samples was mainly due to the manipulation of the material during the reinforcement of the RWM. The comparatively small effect of the reinforcement on the ICSP using silicone with the highest material stiffness of the three considered materials confirms our assumption. Using a stiff reinforcement material makes it challenging to firmly attach the material to the 3D curvature of the RWM. In addition, the placement of the material must be conducted with great care to minimize the risk of RWM damage and, hence, loss of the sample.
To assess the effectiveness of the reinforcement procedure, one would need to quantify the RWM impedance after reinforcement from the simultaneous measurement of the RWM volume velocity and PST (ZRWM = PST/URWM). This is difficult to accomplish, mainly due to the opaque nature of the reinforcement material, which prevents the direct interrogation of the RWM motion using the LDV. Estimating the RWM motion from the velocity measurements on the surface of the reinforcement material is inappropriate because of the relatively thick reinforcement material and its uncontrolled interface with the RWM. A better alternative to the reinforcement material used in the present study would be a transparent material that also provides a good binding with the RWM. A transparent hydrogel compound developed by Wei et al. [27] which directly reacts with biological tissues might be an option for further research. Besides the advantages of a well-controlled interface between the hydrogel and the RWM and direct optical access to the RWM, the hydrogel might also allow for a stepwise increase in RWM stiffness during the curing process. A reinforcement material with such properties would allow for more repeatable and controllable measurement conditions, which we see as crucial in order to gain a more quantitative knowledge of the RWM reinforcement effect on the cochlear hydrodynamics.

4.3. Comparison with Numerical Calculations and RWM Impedance Estimation

In the present study, we were not able to estimate the RWM impedance after reinforcement by experimental means. Instead, two numerical LEM models of the cochlea proposed by Nakajima et al. (2009) and Elliot et al. (2016) were used to approximate the missing quantity from the best fit between the model and the experiment. Nakajima proposes a simple model of the cochlea that assumes an equal volume velocity between the oval and round window, an assumption that is not compatible with a reinforced RWM leading to a reduced vibrational motion of the RWM but a similar stapes velocity as before the reinforcement. Elliot’s model tries to account for this effect by considering cochlear and vestibular aqueducts that act as pressure relief elements in parallel with the RWM.

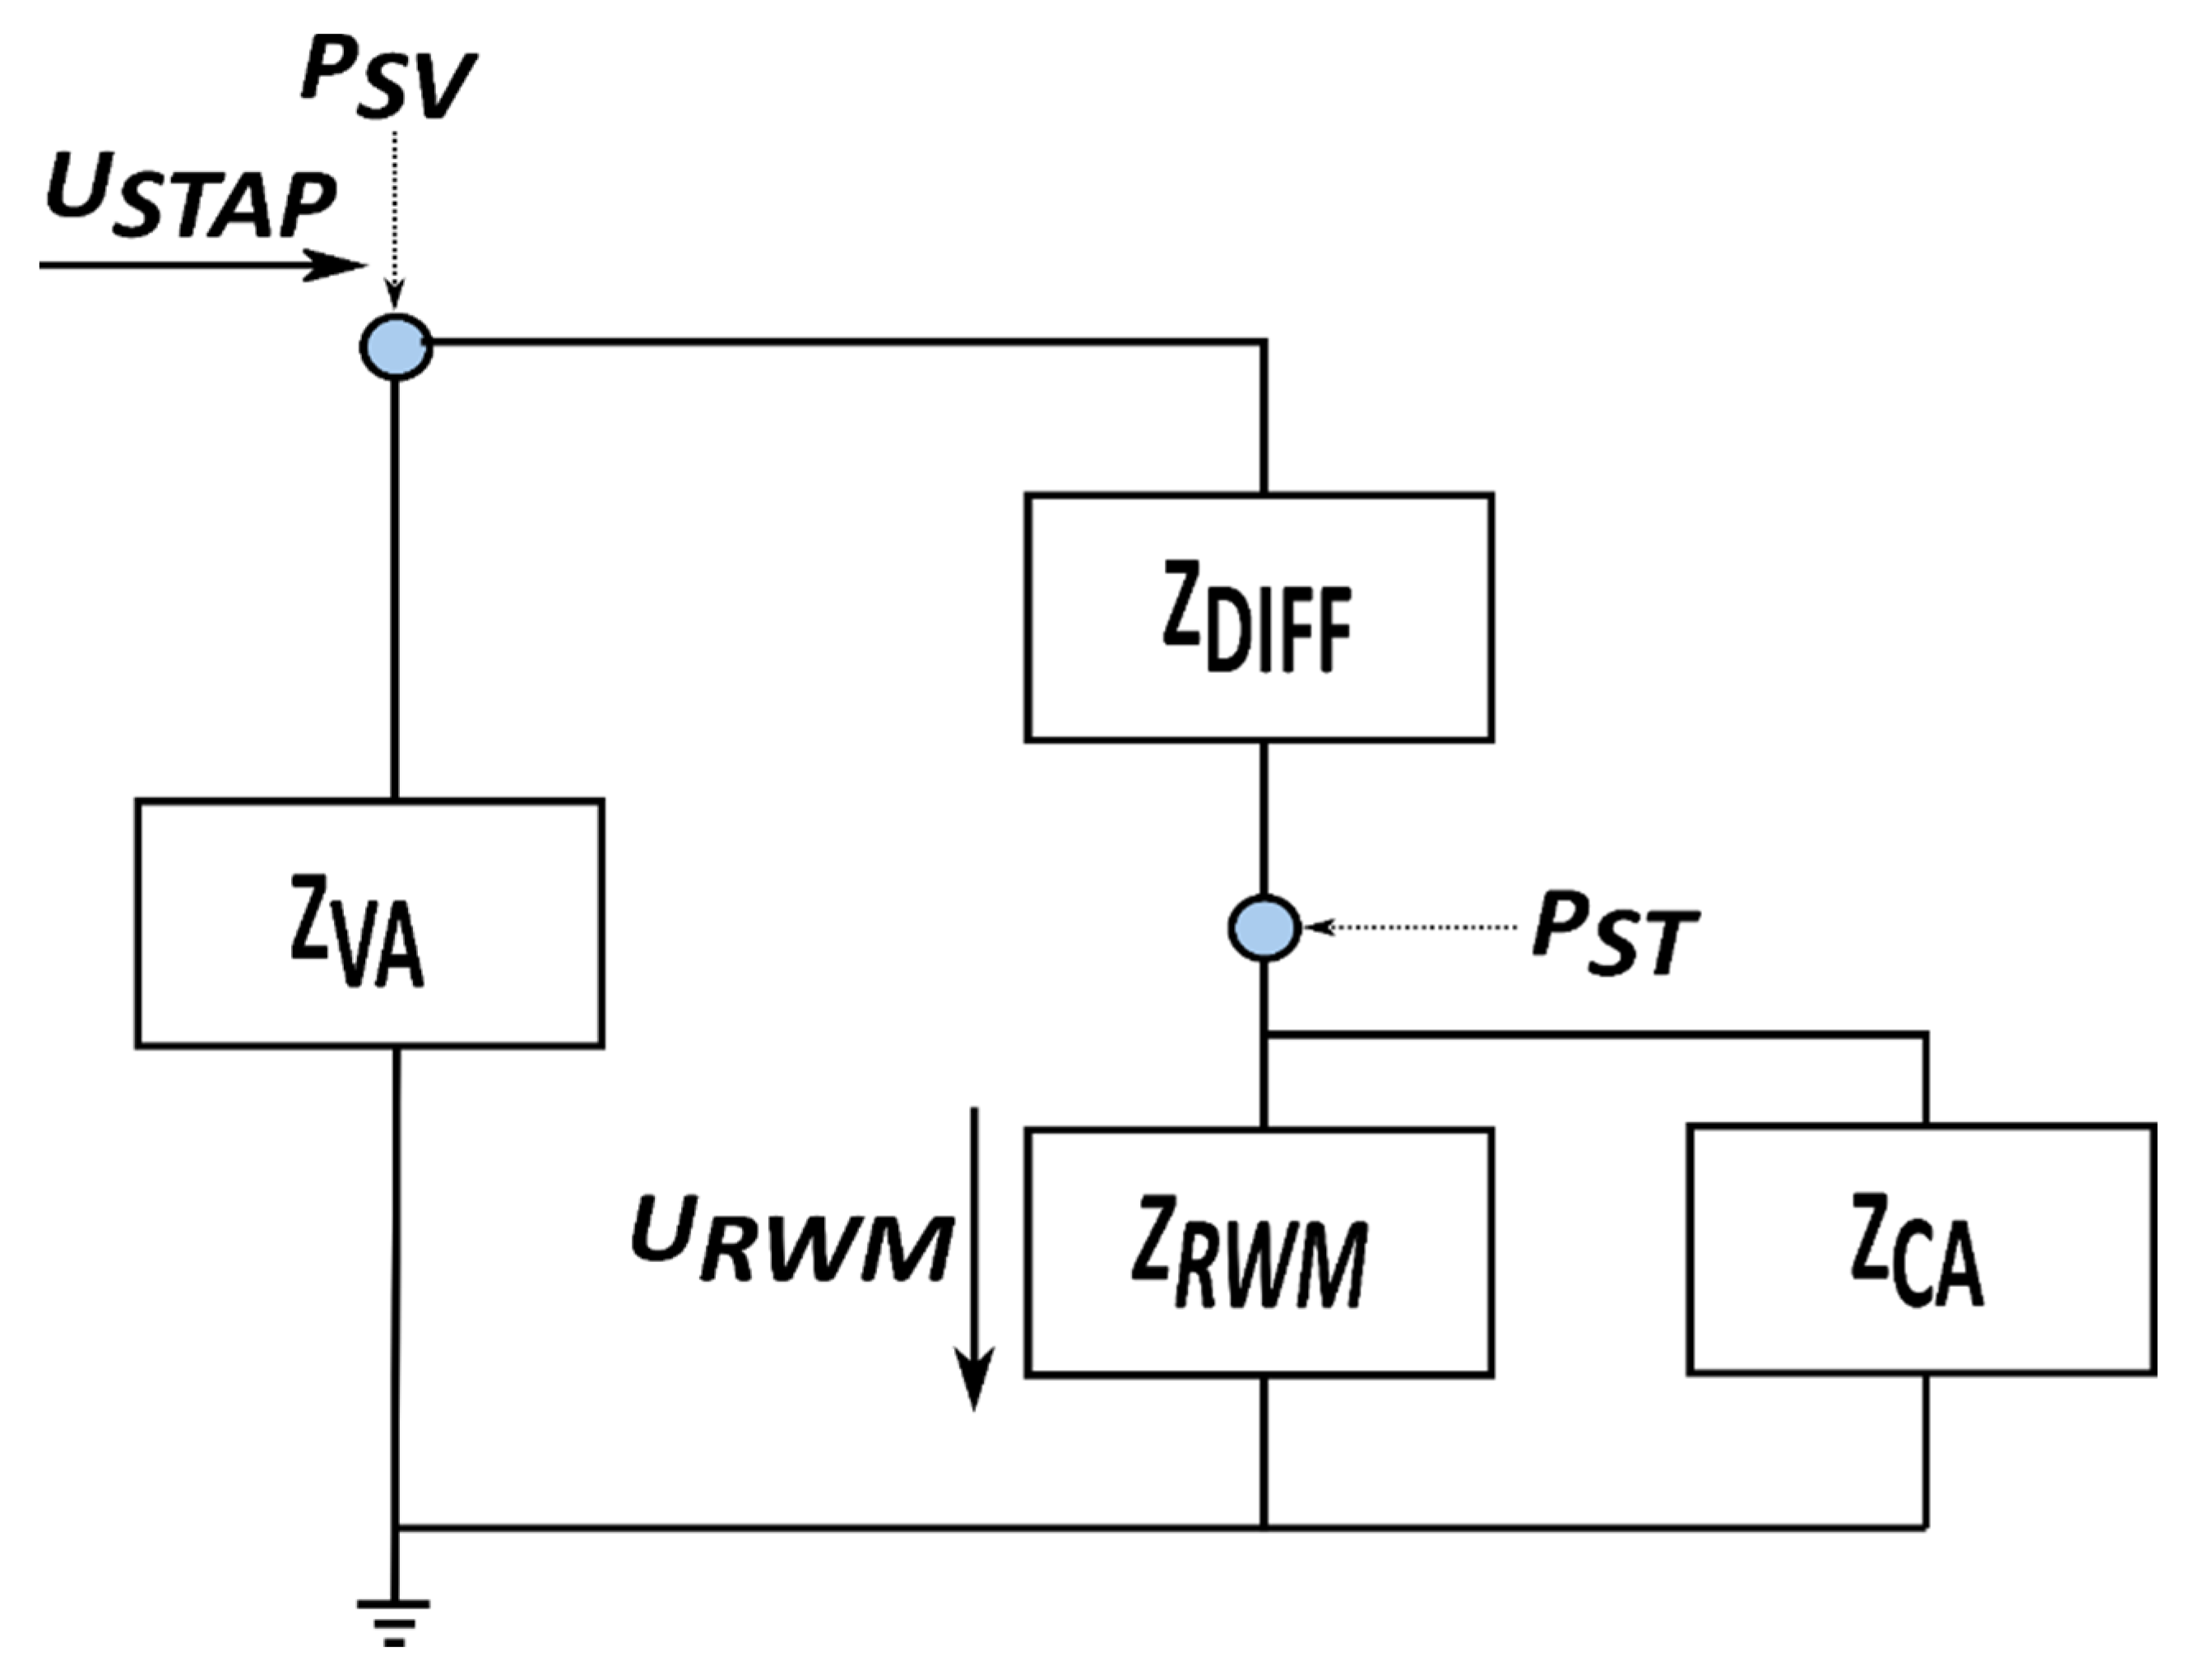
4.3.1. LEM of the Cochlea Proposed by Nakajima et al. (2009)

Nakajima et al. proposed a simple LEM of the cochlea (cf. Figure 8) that describes the cochlea input impedance ZC as a serial circuit containing two lumped parameters, the impedance of the cochlear partition (ZDIFF) and ZRWM (Equation (1)):
Z C = Z D I F F + Z R W M
ZDIFF was experimentally determined in several studies [8,11,19,23]. The magnitude of ZDIFF represents a resistive behavior independent of the frequency, and the phase is approximately close to zero cycles for most frequencies. Hence, ZDIFF can be approximated with one lumped parameter describing the resistive behavior (RDIFF). The ZDIFF value from Aibara et al. (2001) was used in both models. ZRWM was calculated using the proposed iterative Foster form network model with predetermined parameter values (Table 1). An adapted figure of the RWM LEM from Nakajima et al. (2009) is added for clarification in Table 1 [11].
The USTAP is considered as the input to the cochlea. According to Stenfelt et al. (2004)’s findings, the magnitude of USTAP approximately equals the magnitude of URWM [20].
U S T A P = U R W M
Z D I F F = ( P S V P S T ) / U S T A P
As we have confirmed by experiments (cf. Appendix A), and as is also reported in the literature [5,13], the input to the cochlea can be assumed to not be affected by the RWM reinforcement—i.e., USTAP = U’STAP, where the apostrophe denotes the conditions after RWM reinforcement. The model further assumes equal RWM motion before and after reinforcement (URWM = U’RWM). Considering these assumptions and using the equations for PST (P’ST) ((4) and (5)) and PSV (P’SV) ((7) and (8)), respectively, the relative pressure gain ( P S T P S T and P S V P S V ) caused by the RWM reinforcement can be derived as the ratio between the RWM impedance after and before reinforcement for ST (6) and the ratio between the cochlea input impedance after Zc′ and before reinforcement Zc for SV (9).
Before reinforcement for ST:
P S T = U R W M     Z R W M
After reinforcement for ST:
P S T = U R W M     Z R W M
From Equations (4) and (5) and the assumption URWM = U′RWM:
P S T P S T = Z R W M Z R W M
Similarly, before reinforcement for SV:
P S V = U S T A P     ( Z D I F F + Z R W M )
After reinforcement (for SV):
P S V = U S T A P     ( Z D I F F + Z R W M )
Since USTAP = U′STAP:
P S V P S V = Z D I F F + Z R W M Z D I F F + Z R W M

4.3.2. LEM of the Cochlea Proposed by Elliot et al. (2016)

In contrast to the LEM of Nakajima et al., the model proposed by Elliot et al. (2016) includes high-impedance leakage pathways. These are the CA connected to ST and the VA connected to SV. The circuitry describing the model is shown in Figure 9. As a consequence of the alternative pressure-relieving paths that are considered in the model, the URWM and U′RWM (after reinforcement) can be of different magnitudes. However, USTAP (the input to the cochlea), ZVA, and ZCA are assumed to not be affected by the reinforcement of the RWM. Based on these assumptions, the relative pressure gain can be calculated for the ST and SV using Equations (10) and (11).
P S T P S T = Z R W M Z R W M   [ ( Z D I F F + Z V A ) ( 1 + Z R W M Z C A ) + Z R W M ( Z D I F F + Z V A ) ( 1 + Z R W M Z C A ) + Z R W M ]
P S V P S V = [ ( Z D I F F + Z V A ) ( 1 + Z R W M Z C A ) + Z R W M ( Z D I F F + Z V A ) ( 1 + Z R W M Z C A ) + Z R W M ]   [ Z D I F F ( 1 + Z R W M Z C A ) + Z R W M Z D I F F ( 1 + Z R W M Z C A ) + Z R W M ]
The parameters and their respective values are summarized in Table 2.

4.3.3. Results

Considering cartilage as a reinforcement material, the best fit between the two models and the experiment (median data) is achieved if a compliance value that is five times smaller than the initial RWM compliance (C0) and an inertance (added mass) that is twice the initial inertance (L0) are considered for the lumped parameter representing the reinforced RWM. Cartilage reinforcement was chosen for the comparison, as it produced, on average, the highest increase in inner ear pressure (cf. Figure 6E). As a comparison, Elliot et al. (2016) reported a reduction in the RWM compliance by a factor of 10 to 100 after the implantation of a cochlear implant.
As illustrated in Figure 10A, Nakajima’s model with twice the initial RWM inertance (2L0) and one fifth of the initial RWM compliance (0.2 C0) is in fair agreement with the experimentally determined relative pressure gain in ST and SV at frequencies above 500 Hz. Below 500 Hz, the model overestimates the relative pressure gain by up to 6 dB in ST and 3 dB in SV. In comparison, Elliot’s model overestimates the reinforcement effect at low frequencies even more but predicts lower values in ST than the experiment between 500 Hz and 1 kHz. The relative pressure gain curve peaks below 200 Hz in the positive direction and shows a negative peak at 800 Hz. If the initial RWM compliance is reduced by a factor of 100 (the highest stiffening of the RWM Elliot observed after CI implantation), both peaks become more pronounced, rise in magnitude, and are shifted towards a higher frequency (700 Hz and 3.6 kHz). This curve characteristic stems from the cochlear and vestibular aqueducts ZCA and ZVA. The peak magnitude and frequency of occurrence are dependent on the RWM compliance. The experimental data representing the ST show a clear indication of a positive peak in the relative pressure gain curve, but a negative peak cannot be identified in the averaged data. Looking at the data of the individual HTBs, a negative peak is obvious in the relative pressure gain curve for certain HTBs and reinforcement materials (cf. Figure 6A,C). The reason why the negative peak is damped out for certain samples has not yet been clarified. To obtain a better agreement (especially in the frequency) between Elliot’s model and the experimental data, a closer parameter optimization of the lumped elements representing the aqueducts or even an adaption of the whole model seems to be necessary. Such model optimization was beyond the scope of the present study. The limitation of Nakajima’s model becomes obvious at high RWM reinforcements, where the assumption of equal volume velocities at the oval and round window (USTAPURWM) breaks down. For a 0.01 C0 RWM impedance, the model predicts a high relative pressure gain above 40 dB that we were not able to reproduce with our experiments and that does not appear very realistic.

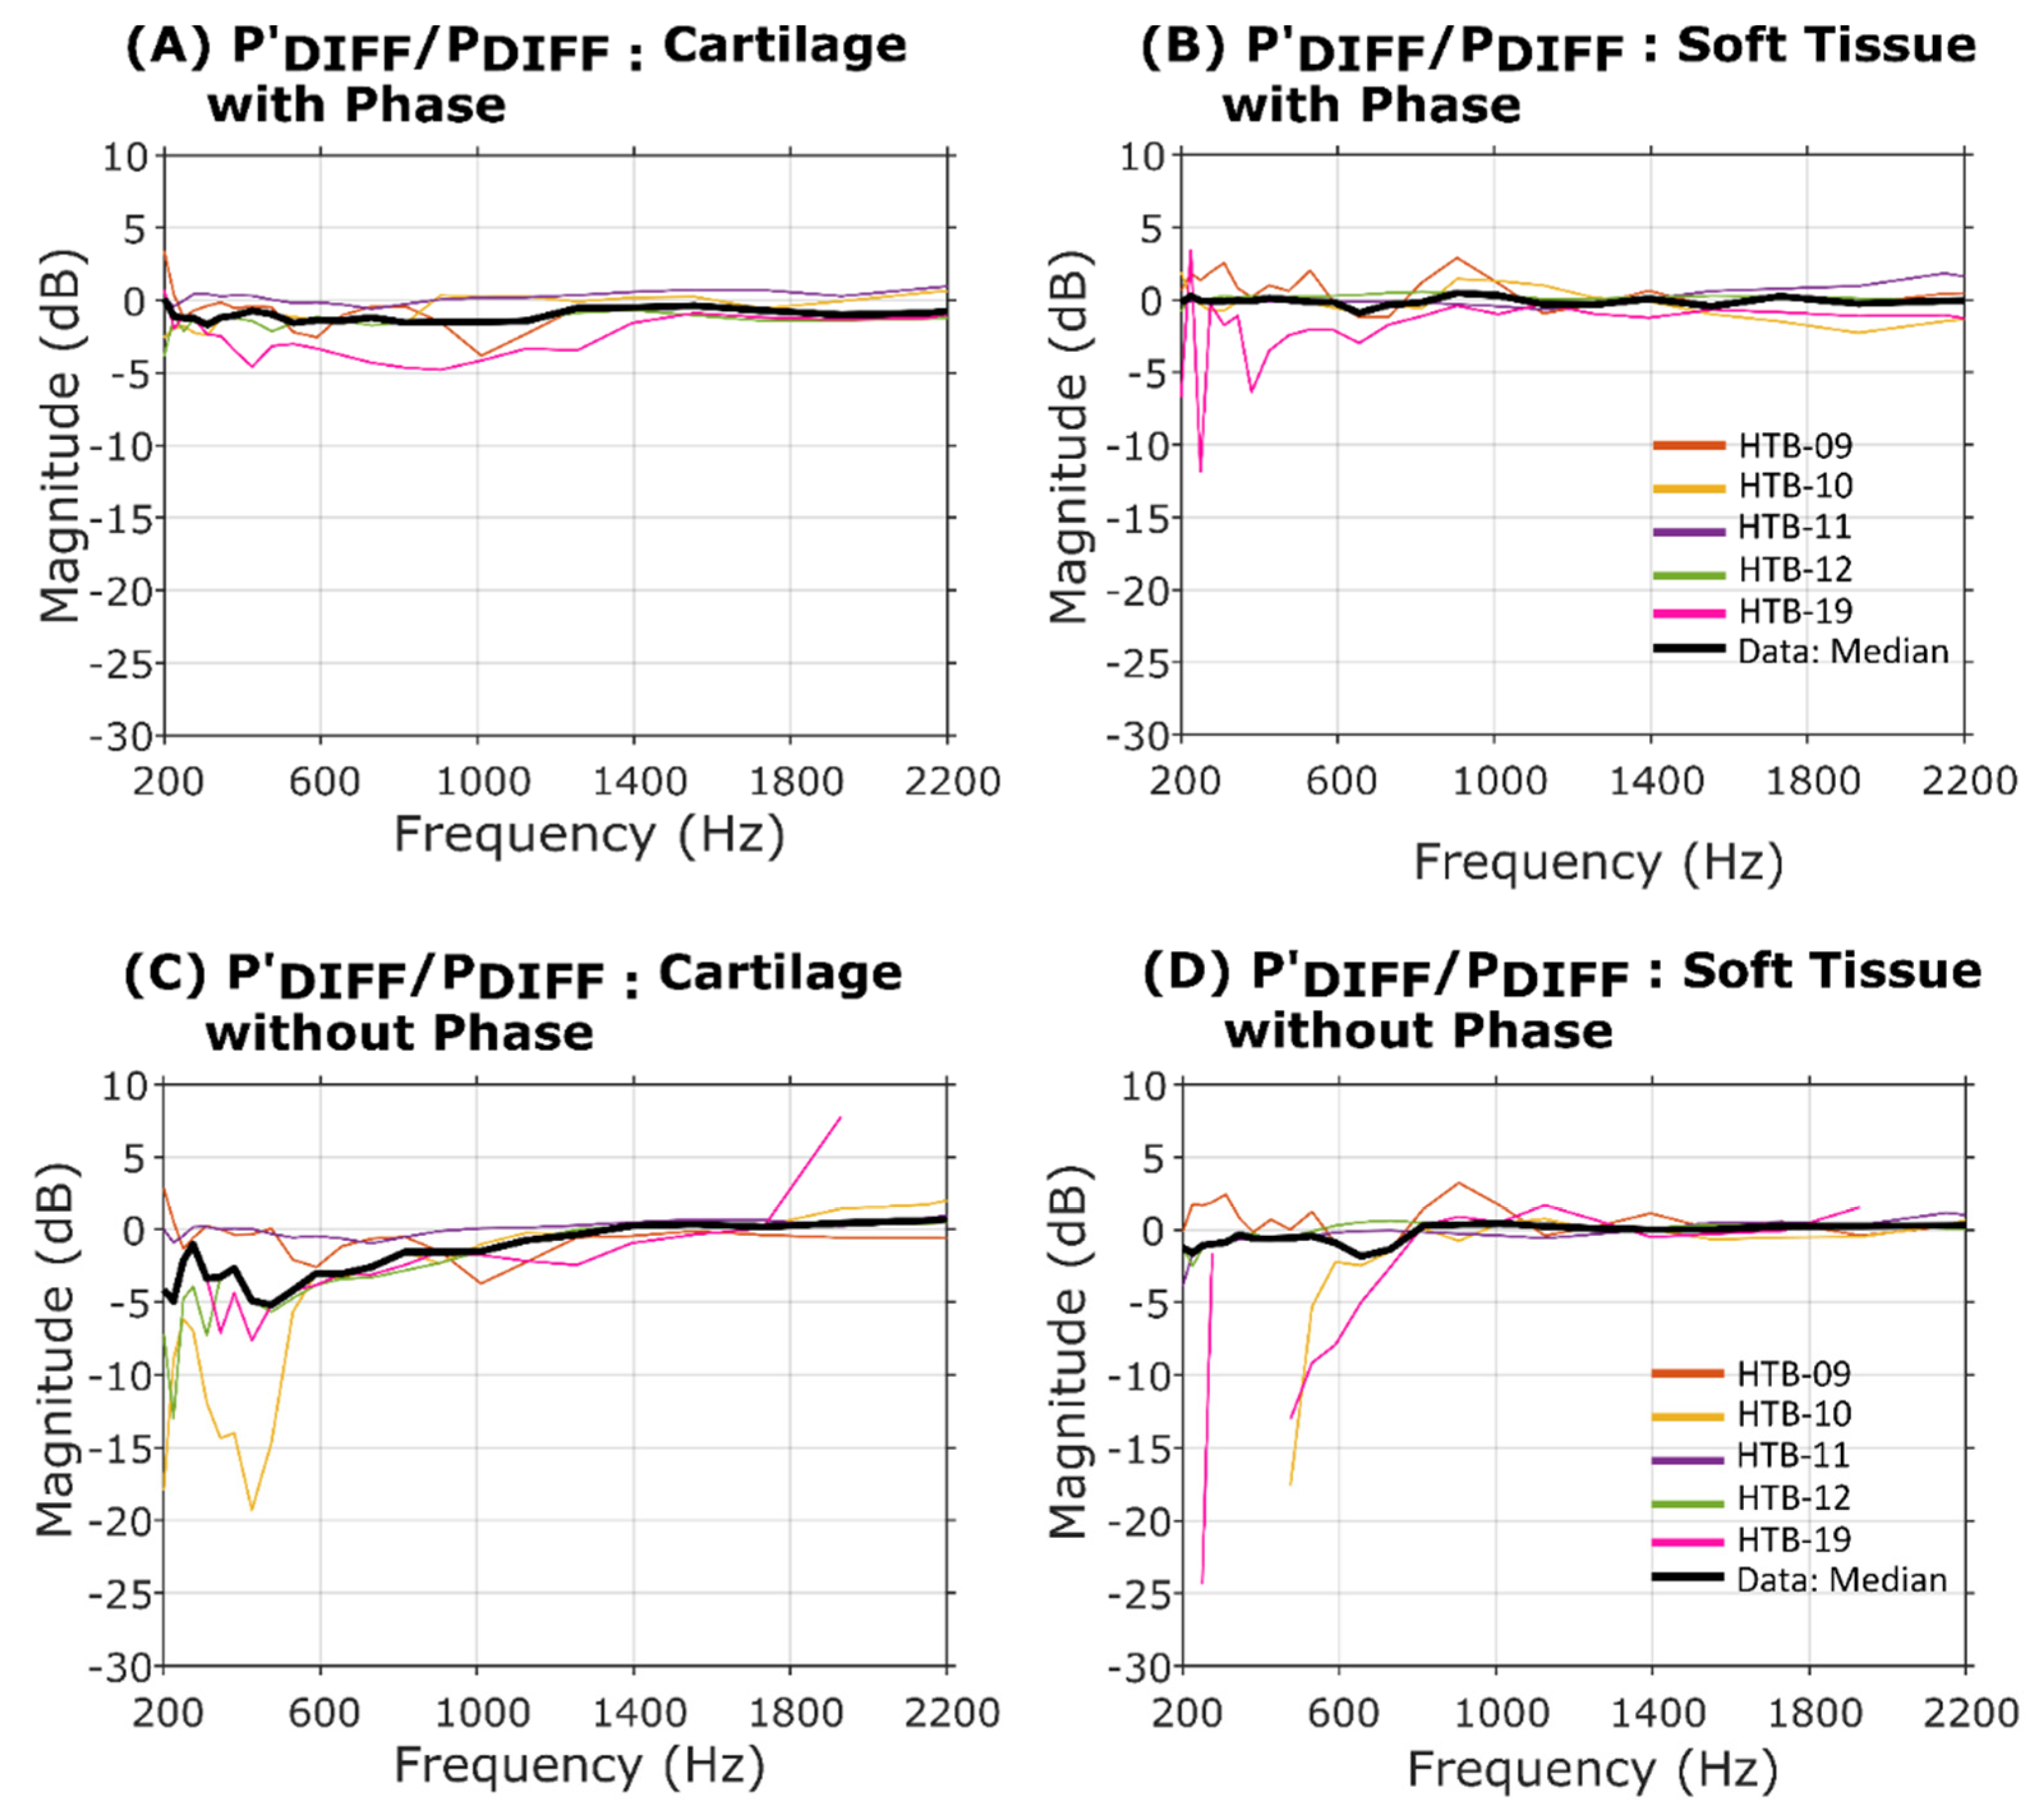
4.4. Effect of RWM Reinforcement on the Pressure Difference across the Partition

The pressure difference PDIFF across the basal part of the cochlear partition triggers the propagation of the traveling wave on the basilar membrane and, hence, is an important measure to assess the influence of RWM reinforcement on the hearing sensation. The PDIFF of each HTB sample was calculated in the complex domain as the difference in pressure in the SV and ST normalized with the ear canal pressure PEC. To illustrate the RWM reinforcement-induced change in PDIFF, the ratio between PDIFF after and before RWM reinforcement was calculated and depicted in dB. Figure 11A shows the corresponding ratio for cartilage and Figure 11B shows it for soft tissue reinforcement. Only data at frequencies below 2.2 kHz are considered where changes in ISCP can be attributed to RWM manipulations. For certain HTB samples, reinforcement materials, and frequencies, the pressure in SV and ST showed almost the same magnitude or an even higher pressure in ST than in SV (cf. Figure 5). Such pressure conditions are not physical and are attributed to the measurement uncertainty of the sensor system and other interfering effects. However, these invalid data were removed and not considered for further analysis (certain curves not continuous). Except for HTB-19, where the PDIFF was reduced by up to 5 dB using cartilage and up to 10 dB using soft tissue, the change in PDIFF was small or even negligible. The reason for this is that the PDIFF is mainly pretended by the vestibuli pressure, which is significantly larger than the pressure in ST. Despite the clear increase in ST pressure after reinforcement that is obvious throughout the samples, it has a mostly negligible effect on PDIFF or is compensated by an increased vestibuli pressure.
Another reason for this that might explain the small effect of RWM reinforcement on the PDIFF is the phase shift between the pressure in SV and ST, which deviates significantly from zero for certain HTB samples (cf. Figure 4C,D) and, hence, reduces the effective PDIFF. An existing phase shift between the two pressure readings at low frequencies contradicts the theory of a fast wave propagating down the perilymph-filled cochlea duct [28]. Considering an approximately 70 mm-long channel between the oval and round window [29] and a propagation speed similar to the speed of sound in water, a phase shift of less than 18° at 1 kHz should arise between the pressure in the basal part of the SV and ST. Moreover, the phase shift of 180° that was measured in the present study between the motion of the oval and round window at low frequencies (cf. Figure 3B) stipulates a vanishing phase shift in the simultaneous ICSP readings at low frequencies. Thus far, it is not clear why for certain HTBs the phase shift deviates from the expected range. We do not assume a measurement (system)-related problem, mainly because a similar phase shift in the pressure readings can also be observed in the study of Nakajima et al. (2009), where another pressure measurement system was used. We believe, rather, that the hydrophone signals might be distorted by mechanical vibrations of the sample, which are triggered by the acoustic stimulation and inducing pressure fluctuations in the cochlear fluid. However, Figure 11C,D illustrate the effect of RWM reinforcement on the PDIFF if no phase shift in the pressure readings is assumed. In this case, HTB-10, HTB-12, and HTB-19 show an RWM reinforcement-induced change in the PDIFF of up to 20 dB for cartilage and even more than 20 dB with soft tissue as the reinforcement material. The other samples still show a negligible influence of RWM reinforcement on PDIFF that can be attributed to a less effective reinforcement due to the difficultly in handling the material. A change in PDIFF of 20 dB or more might be an indication that the clinically observed loss in residual hearing at low frequencies after CI implantation through the RWM might be attributed to an RWM that is stiffened by the CI electrode.

5. Conclusions

In the present study, we performed simultaneous ICSP measurements on HTBs to investigate the influence of RWM reinforcement on the sound pressure in the basal part of the ST and SV. The resulting pressure difference induces the traveling wave on the basilar membrane and, hence, is regarded as an important measure for hearing sensation.
The experiments revealed RWM reinforcement-induced changes in ICSP within the low-frequency range (<2.2 kHz), with the largest effect in ST below 1 kHz. In ST, a sound pressure increase of up to 25 dB was observed after RWM reinforcement. In contrast to the literature, we could identify a considerably smaller pressure rise in SV (<10 dB). The effect of the RWM reinforcement on ICSP varied largely between the individual HTB samples. The poor repeatability was mainly attributed to the difficult handling of the reinforcement material during RWM reinforcement, together with the lack of a direct measurement of the RWM impedance after reinforcement. Suggestions for a more appropriate reinforcement material that could considerably improve the repeatability of the experiment were made. The question raised in the literature—whether an artificially or pathologically reinforced RWM may cause conductive hearing loss at low frequencies—cannot be conclusively answered by this study. However, some data indicate a drop in the pressure difference across the partition of almost 10 dB. If the phase shift between the pressure readings in SV and ST is neglected, the resulting PDIFF can even drop by more than 20 dB after RWM reinforcement. This is in the range of the clinically observed low-frequency hearing loss that can occur after CI surgeries. To provide better evidence in this context, the methodology of RWM reinforcement and ICSP measurement would require further improvement to increase the reinforcement effectiveness and the repeatability of the experiment.

Author Contributions

Conceptualization, F.P., L.P., N.L., and I.D.; methodology, N.L., L.P., A.D., M.C., and F.P.; software, L.P. and N.L.; formal analysis, N.L., J.G., and L.P.; resources, A.H., T.K., and F.P.; data curation, N.L., J.G., and S.T.; writing—original draft preparation, N.L.; writing—review and editing, L.P., F.P., S.T., A.D., M.C., and I.D.; visualization, N.L.; supervision, F.P., A.H., and T.K.; funding acquisition, T.K. All authors have read and agreed to the published version of the manuscript.

Funding

This research was funded by the European Union’s Horizon 2020 research and innovation program under the Marie Sklodowska-Curie grant agreement number 722046.

Institutional Review Board Statement

The study was conducted according to the guidelines of the Declaration of Helsinki and approved by the local ethics committee, Canton of Zurich, Switzerland (KEK-ZH-Nr. 2014-0544, approved on 25 February 2015).

Informed Consent Statement

Not applicable.

Acknowledgments

The authors would like to thank Jae Hoon Sim for his contributions in the model simulation validation and result interpretation and valuable insights into the experimental results, as well as all the members of the “Otology and Biomechanics of Hearing” research group for their support.

Conflicts of Interest

The authors declare no conflict of interest. The funders had no role in the design of the study; in the collection, analysis, or interpretation of data; in the writing of the manuscript; or in the decision to publish the results.

Appendix A. Stapes Velocity Measurements with RWM Reinforcement

The effect of RWM reinforcement on the METF (VSTAP normalized to PEC) was determined in three HTBs. It is plotted in Figure A1 as the difference between the METF in dB after and before reinforcement. Beside the data from the individual HTBs, the corresponding median and the reference data from Wegner et al. (2016) are also added to the plots. The left figure represents the case with soft tissue and the right one with cartilage as the reinforcement material.
Figure A1. Effect of RWM reinforcement on the METF expressed as the difference between the METF in dB before and after the reinforcement with (A) soft tissue and (B) cartilage. The thick dashed-dotted lines represent the corresponding median values. The solid lines with circular markers indicate the reference data extracted from Wegner et al. for perichondrium (n = 9) and cartilage (n = 4), respectively.
Applsci 11 05062 g0a1
Within the low-frequency range (<2 kHz), where piston-like motion pretends the vibration behavior of the stapes footplate, a RWM reinforcement-induced change in the METF of less than 1 dB was identified. This confirms the work of Wegner et al. (2016) and Guan et al. (2018) claiming a negligible effect on the METF due to RWM reinforcement [5,13].

References

  1. Obrist, D. Flow phenomena in the inner ear. Annu. Rev. Fluid Mech. 2019, 51, 487–510. [Google Scholar] [CrossRef]
  2. Duan, M.-L.; Zhi-Qiang, C.J. Permeability of round window membrane and its role for drug delivery: Our own findings and literature review. J. Otol. 2009, 4, 34–43. [Google Scholar] [CrossRef] [Green Version]
  3. Ahmed, W.; Rajagopal, R.; Lloyd, G. Systematic review of round window operations for the treatment of superior semicircular canal dehiscence . J. Int. Adv. Otol. 2019, 15, 209. [Google Scholar] [CrossRef] [PubMed]
  4. Silverstein, H.; Kartush, J.M.; Parnes, L.S.; Poe, D.S.; Babu, S.C.; Levenson, M.J.; Wazen, J.; Ridley, R.W. Round window reinforcement for superior semicircular canal dehiscence: A retrospective multi-center case series . Am. J. Otolaryngol. 2014, 35, 286–293. [Google Scholar] [CrossRef] [PubMed]
  5. Wegner, I.; Eldaebes, M.M.; Landry, T.G.; Adamson, R.B.; Grolman, W.; Bance, M.L. Effect of round window reinforcement on hearing: A temporal bone study with clinical implications for surgical reinforcement of the round window . Otol. Neurotol. 2016, 37, 598–601. [Google Scholar] [CrossRef] [PubMed]
  6. Silverstein, H.; Wu, Y.-H.E.; Hagan, S. Round and oval window reinforcement for the treatment of hyperacusis. Am. J. Otolaryngol. 2015, 36, 158–162. [Google Scholar] [CrossRef] [PubMed]
  7. Causon, A.; Verschuur, C.; Newman, T.A. A retrospective analysis of the contribution of reported factors in cochlear implantation on hearing preservation outcomes . Otol. Neurotol. 2015, 36, 1137–1145. [Google Scholar] [CrossRef]
  8. Elliott, S.J.; Ni, G.; Verschuur, C.A. Modelling the effect of round window stiffness on residual hearing after cochlear implantation . Hear. Res. 2016, 341, 155–167. [Google Scholar] [CrossRef]
  9. Friedmann, D.R.; Peng, R.; Fang, Y.; McMenomey, S.O.; Roland, J.T.; Waltzman, S.B. Effects of loss of residual hearing on speech performance with the CI422 and the Hybrid-L electrode . Cochlear Implant. Int. 2015, 16, 277–284. [Google Scholar] [CrossRef]
  10. Verschuur, C.; Hellier, W.; Teo, C. Hearing impairment as a determinant of function in the elderly . Cochlear Implant. Int. 2016, 17 (Suppl. 1), S62–S65. [Google Scholar] [CrossRef]
  11. Nakajima, H.H.; Dong, W.; Olson, E.S.; Merchant, S.N.; Ravicz, M.E.; Rosowski, J.J. Differential intracochlear sound pressure measurements in normal human temporal bones . Assoc. Res. Otolaryngol. 2009, 10, 23. [Google Scholar] [CrossRef] [Green Version]
  12. Puria, S.; Allen, J.B.J. A parametric study of cochlear input impedance . Acoust. Soc. Am. 1991, 89, 287–309. [Google Scholar] [CrossRef] [PubMed]
  13. Guan, X.; Cheng, Y.S.; Galaiya, D.; Nakajima, H.H. The Effect of Round Window Reinforcement on Human Hearing. In AIP Conference Proceedings; AIP Publishing LLC: Melville, NY, USA, 2018; p. 150004. [Google Scholar]
  14. Sim, J.H.; Chatzimichalis, M.; Röösli, C.; Laske, R.D.; Huber, A.M.J.E. Objective Assessment of Stapedotomy Surgery from Round Window Motion Measurement. Ear Hear. 2012, 33, e24–e31. [Google Scholar] [CrossRef]
  15. Zhang, X.; Gan, R.Z. Dynamic properties of human round window membrane in auditory frequencies running head: Dynamic properties of round window membrane . Med. Eng. Phys. 2013, 35, 310–318. [Google Scholar] [CrossRef] [PubMed] [Green Version]
  16. Péus, D.; Dobrev, I.; Prochazka, L.; Thoele, K.; Dalbert, A.; Boss, A.; Newcomb, N.; Probst, R.; Röösli, C.; Sim, J.H. Sheep as a large animal ear model: Middle-ear ossicular velocities and intracochlear sound pressure . Hear. Res. 2017, 351, 88–97. [Google Scholar] [CrossRef] [PubMed]
  17. Pfiffner, F.; Prochazka, L.; Péus, D.; Dobrev, I.; Dalbert, A.; Sim, J.H.; Kesterke, R.; Walraevens, J.; Harris, F.; Röösli, C. A MEMS condenser microphone-based intracochlear acoustic receiver . IEEE Trans. Biomed. Eng. 2017, 64, 2431–2438. [Google Scholar] [CrossRef] [Green Version]
  18. Rosowski, J.J.; Chien, W.; Ravicz, M.E.; Merchant, S.N. Testing a method for quantifying the output of implantable middle ear hearing devices . Audiol. Neurootol. 2007, 12, 265–276. [Google Scholar] [CrossRef] [Green Version]
  19. Frear, D.L.; Guan, X.; Stieger, C.; Rosowski, J.J.; Nakajima, H.H. Impedances of the inner and middle ear estimated from intracochlear sound pressures in normal human temporal bones . Hear. Res. 2018, 367, 17–31. [Google Scholar] [CrossRef] [PubMed]
  20. Stenfelt, S.; Hato, N.; Goode, R.L.J. Fluid volume displacement at the oval and round windows with air and bone conduction stimulation . Acoust. Soc. Am. 2004, 115, 797–812. [Google Scholar] [CrossRef] [PubMed]
  21. Stenfelt, S.; Hato, N.; Goode, R.L. Round window membrane motion with air conduction and bone conduction stimulation . Hear. Res. 2004, 198, 10–24. [Google Scholar] [CrossRef] [PubMed]
  22. Prochazka, L.; Huber, A.; Dobrev, I.; Harris, F.; Dalbert, A.; Röösli, C.; Obrist, D.; Pfiffner, F. Packaging Technology for an Implantable Inner Ear MEMS Microphone . Sensors 2019, 19, 4487. [Google Scholar] [CrossRef] [Green Version]
  23. Aibara, R.; Welsh, J.T.; Puria, S.; Goode, R.L. Human middle-ear sound transfer function and cochlear input impedance . Hear. Res. 2001, 152, 100–109. [Google Scholar] [CrossRef]
  24. Zhou, L.; Shen, N.; Feng, M.; Liu, H.; Duan, M.; Huang, X. Study of age-related changes in Middle ear transfer function. Comput. Methods Biomech. Biomed. Eng. 2019, 22, 1093–1102. [Google Scholar] [CrossRef] [PubMed]
  25. Gerig, R.; Ihrle, S.; Röösli, C.; Dalbert, A.; Dobrev, I.; Pfiffner, F.; Eiber, A.; Huber, A.M.; Sim, J.H. Contribution of the incudo-malleolar joint to middle-ear sound transmission . Hear. Res. 2015, 327, 218–226. [Google Scholar] [CrossRef] [Green Version]
  26. Merchant, S.N.; Ravicz, M.E.; Rosowski, J.J. Acoustic input impedance of the stapes and cochlea in human temporal bones . Hear. Res. 1996, 97, 30–45. [Google Scholar] [CrossRef]
  27. Wei, K.; Senturk, B.; Matter, M.T.; Wu, X.; Herrmann, I.K.; Rottmar, M.; Toncelli, C. Mussel-inspired injectable hydrogel adhesive formed under mild conditions features near-native tissue properties . ACS Appl. Mater. Interfaces 2019, 11, 47707–47719. [Google Scholar] [CrossRef] [PubMed]
  28. Peterson, L.; Bogert, B. A dynamical theory of the cochlea . J. Acoust. Soc. Am. 1950, 22, 369–381. [Google Scholar] [CrossRef]
  29. Wysocki, J. Dimensions of the human vestibular and tympanic scalae . Hear. Res. 1999, 135, 39–46. [Google Scholar] [CrossRef]
Figure 1. (A) Custom-made intracochlear acoustic receiver (ICAR) sensor with a zoomed view on the sound receptor and micro-electromechanical system (MEMS) condenser microphone. (B) Experimental setup with a human temporal bone (HTB) sample, artificial ear canal (AEC), and two ICARs for simultaneous pressure measurement in SV and ST. For a precise sensor insertion into the cochlea, both hydrophones are positioned using multi-axis micromanipulator units.
Applsci 11 05062 g001
Figure 2. Schematic drawing of the RWM and the ICARs inserted into ST and SV (left) and a zoomed microscope image of the basal region of the cochlea (right). The spaces between the ICAR sound receptor tube and the bone were first sealed with a thin layer of soft tissue and then reinforced with Jeltrate.
Applsci 11 05062 g002
Figure 3. (A) METF data of 6 HTBs compared with the ASTM F2504e05 standard. The dotted black line represents the mean ASTM F2504e05 standard and the 95% confidence interval is in blue. The thick black line corresponds to the median of 6 HTBs. (B) Phase difference between stapes and RWM for six HTBs in the lower frequency range (100–500 Hz). The dotted black lines represent the ±7.2° deviation band from a 180° phase difference similar to the study of Frear et al. (2018) [19]. Each HTB sample is represented by a specific color.
Applsci 11 05062 g003
Figure 4. Simultaneous ICSP measurements in ST and SV: magnitude of the pressure gain in ST (PST/PEC) (A) and in SV (PSV/PEC) (B); respective phase data for ST (C) and SV (D).
Applsci 11 05062 g004
Figure 5. Two exemplary cases for the ICSP gain changes in ST and SV after the reinforcement of the RWM with soft tissue and cartilage compared to the respective baselines for HTB-10 (A,B) and HTB-11 (C,D). The bold lines represent the ICSP gain after reinforcement in each scenario for ST and SV (red and blue, respectively) and the dotted line pattern for the baselines in the same light color shades.
Applsci 11 05062 g005
Figure 6. Relative pressure gain in ST and SV observed after the RWM reinforcement with cartilage and silicone (AD). Median values are represented as a solid black line. (E,F) represent the median relative pressure gain values for all three materials, (E) ST, and (F) SV.
Applsci 11 05062 g006
Figure 7. Input cochlea impedance (Zc) compared to the reference data: (A) magnitude of the Zc and (B) respective phase data. The bold black line and the shaded area represent the study data median and the SD, respectively. The literature data are indicated in individual colors.
Applsci 11 05062 g007
Figure 8. LEM circuit of the cochlea proposed by Nakajima et al. (2009). Ground connection represents the sound pressure at the surgically opened middle ear cavity that is assumed to be zero.
Applsci 11 05062 g008
Figure 9. Adapted LEM circuit of the cochlea from Elliot et al. (2016). For descriptive purposes, the individual circuit components describing the four indicated equivalent impedance are not shown.
Applsci 11 05062 g009
Figure 10. Experimental relative pressure gain values of reinforced RWM with simulated data. Experimental data with cartilage reinforcement (median and SD) and simulated values from two models (Nakajima et al. and Elliot et al.) are represented for (A) ST and (B) SV. After reinforcement, the RWM inertance is set to twice the initial value to mimic the added mass effect with materials during reinforcement. RWM compliance after reinforcement was set to an initial compliance (C0) of 0.2 and 0.01.
Applsci 11 05062 g010
Figure 11. Ratio between the pressure difference across the cochlea partition normalized to the ear canal pressure ( P S V P S T P E C ) after and prior RWM reinforcement with cartilage (A,C) and soft tissue (B,D). In (A,B), PDIFF was calculated in the complex space considering the phase shift between PSV and PST. In (C,D), zero phase shift was assumed for the PDIFF calculation. Invalid data (discontinuous curves) arise due to the uncertainties in the sensor measurements, and other interfering effects were neglected.
Applsci 11 05062 g011
Table 1. Parameter values used in Nakajima et al.’s lumped element model (LEM).
Lumped ElementInclusive ElementsSI UnitValueReference
ZDIFFRDIFFNsm−52.0 × 10¹⁰[23]
ZRWM
Applsci 11 05062 i001
CN−1m59.0 × 10−14[11]
Lkgm−44.62 × 10⁷
RNsm−52.34 × 10⁸
X (spacing) 10
N (number of branches) 6
Table 2. Parameters and respective values used in Elliot et al.’s LEM.
Lumped ElementInclusive ElementsSI UnitsValueReference
ZDIFFRDIFFNsm−52.0 × 10¹⁰[23]
ZRWMLRWMNs2m−51.0 × 10⁶[8]
RRWMNsm−52.5 × 10⁹
CRWMN−1m51.0 × 10−13
ZVALVANs2m−55.1 × 10⁷
RVANsm−51.1 × 10¹⁰ × f 1000   Hz
ZCALCANs2m−55.6 × 10⁸
RCANsm−53.5 × 10¹¹ × f 1000   Hz
Publisher’s Note: MDPI stays neutral with regard to jurisdictional claims in published maps and institutional affiliations.

