Article

The Effect of Dust Transport on the Concentration of Chlorophyll-A in the Surface Layer of the Black Sea

by
Alla V. Varenik
1,* and
Darya V. Kalinskaya
2
1
Marine Biogeochemistry Department, Marine Hydrophysical Institute of RAS, Kapitanskaya str., 299011 Sevastopol, Russia
2
Marine Optics and Biophysics Department, Marine Hydrophysical Institute of RAS, Kapitanskaya str., 299011 Sevastopol, Russia
*
Author to whom correspondence should be addressed.
Appl. Sci. 2021, 11(10), 4692; https://doi.org/10.3390/app11104692
Submission received: 22 April 2021 / Revised: 14 May 2021 / Accepted: 18 May 2021 / Published: 20 May 2021

Abstract

:
This paper focuses on the atmospheric dust transport effect on the changes in chlorophyll-A concentration in the Black Sea surface layer. In order to assess the input of nutrients with atmospheric precipitations at the Crimean coast of the Black Sea, the collected samples were analyzed for the content of inorganic nitrogen, phosphates, and silicon. The samples were taken into a wet-only sampler and into a permanently open one, to assess the effect of dust on the nutrients concentration in dry depositions. Cases of multi-fold excess of the nutrients content in the open sampler collected precipitation over that in the wet-only sampler were identified. For such high concentration cases, the 7-day back-trajectories analyses was carried out using the model of the international network AERONET and the HYSPLIT model. The results of our research showed that the influx of nutrients with the atmospheric depositions can result in increasing of chlorophyll-A concentration in 11–36% in the surface layer of the Black Sea. After atmospheric depositions, concentration of phosphates in the surface layer can increase more than five times compared with the background concentration. The increase of silicon concentration can reach 30%. The influx of atmospheric precipitation containing significant amounts of nutrients into the bay can shifts the Redfield ratio compared with background value up to three times.

1. Introduction

One of the most important aspects of rational nature management is the study of the state of the sea and ocean ecosystems [1]. North African deserts are an important source of mineral dust in the atmosphere [2]. This dust can be transported over thousands of kilometers to other continents and after deposition can affect oceanic and land biogeochemical cycles, even in very remote places. For example, the transport and subsequent deposition of African dust into the Amazon basin provide nutrients that make a significant contribution to the productivity of rainforests [3]. Recent decades have shown an increase in the frequency of dusty rains, including in northeastern Spain.
Guo et al. [4] noted that the intake of gases and suspended matter from the atmosphere associated with the air masses from the Sahara is an important source of nutrients for the Mediterranean Sea. The authors’ studies show that even sporadic precipitation of this kind can affect the biological community (its diversity, activity, and quantity) over a certain period of time, and thus regulate the function of the microbial community and the carbon cycle in oligotrophic waters.
In [5], articles were collected by different authors dedicated to the impact of dust from the Sahara on the ecosystem of the eastern Mediterranean. The deposition of atmospheric dust contributes to the input of macronutrients, such as phosphorus [6,7,8], nitrogen [9,10,11], iron [12,13], and silicon [14] to the surface waters of the seas and oceans. Ridame and Guieu [6] argued that additional inorganic phosphorus input can reach up to 15% of “new” production and up to 14% of the total primary production in the upper mixed layer. Such input of phosphorus can contribute to the fixation of atmospheric nitrogen, which, in turn, can intensify the “new” primary production. In [15], the authors determined the effect of the input of phosphates with dust in the Mediterranean Sea. Their research results showed that primary production increased on average by 6–10%. However, the strongest influence was observed in the summer when the sea was in its most oligotrophic state: during the summer stratification, it increased up to 30% for several months. Richon et al. argued that the effect of dust aerosols may be more significant in case of extreme precipitations. The paper also showed that nitrogen input, mainly associated with combustion processes, also has a great impact on the biological processes all over the sea.
Silicon is one of the largest components of soil mineral aerosol. In recent decades, vigorous human activity has affected the natural cycle of silicon and its entry into the ocean [16,17,18]. In the coastal surface waters, this is especially distinct in changes in the concentrations of silicon, nitrogen, and phosphorus [19]. As a result, the stoichiometry of nutrients in the Black Sea has also changed: the Si:N ratio on the Danube shelf, for example, decreased tenfold [20], which created unfavorable conditions for the development of diatoms. Tŕeguer [21] believed that about 10 Tmol (280 Tg) of suspended Si reaches the ocean surface due to the transport of aeolian dust, of which about 5–10% dissolve in the seawater, according to their rough estimates. Thus, transport of soil dust to the atmosphere is an effective way of redistributing Si in the environment. Taking into account the lack of silicon in the Black Sea, the atmospheric input of this nutrient with dust and atmospheric precipitation may have a positive effect on the development of phytoplankton.
According to [22], the relationship between annual chlorophyll-A cycles and dust deposition could account for, on average, 11.5% of chlorophyll variability in most of the Mediterranean. At the same time, the eight-year analysis (2000–2007) of the SeaWIFS and BSC-DREAM8b model shows that the deposition of mineral dust from dust sources in the deserts of North Africa and the Middle East correlates well with the concentration of chlorophyll-A in large areas of the Mediterranean Sea. For example, [23] showed that mixed Saharan dust events can be especially powerful during the period of stratification. A positive correlation between dust deposition and chlorophyll-A concentration has been found in large parts of the Mediterranean Sea with a clear gradient of decreasing correlation coefficient from south to north [24]. The chlorophyll concentration increased drastically after significant dust deposition events with concentration peaks between days 1 and 6 after the event; the chlorophyll growth ranged from 13% to 345% in different cases.
The study [22] considered weekly data (2000–2007) on chlorophyll concentration obtained from the satellite observations by SeaWiFS, and dust deposition data obtained using the BSC-DREAM8b model. The data were examined for the entire Mediterranean basin to describe the geographic distribution and dynamics of both variables and to find the potential relationships between them. The results indicated that the central Mediterranean had the highest chlorophyll-A sensitivity to mineral dust deposition, with an annual contribution of seasonal variability, and stimulation from major events. These results highlight the importance of African and Middle Eastern dust deposition in the potential stimulation of phytoplankton production in the nutrient-depleted surface layers of the Mediterranean.
In recent years, the Black Sea has shown a tendency to an increase in the role of coccolithophorids in the formation of the biomass of communities [25]. Coccolithophorids produce half of CaCO3 in the ocean [26], so additional input of phosphates with dust aerosol can largely affect the biological characteristics of the surface layer of the Black Sea.
Thus, most of the previous studies of the Saharan dust impact on phytoplankton have been limited to a few specific areas of the Mediterranean. In recent years, a number of papers about registration of the dust aerosols in the Arctic region have also been published [27,28,29]. However, such aspect for the Black Sea has been insufficiently explored, the first estimates are provided in [30].
The purpose of this research is to identify patterns and features of the Saharan and Syrian dust deposition and determination of the dynamics and distribution of surface chlorophyll in the Black Sea.

2. Materials and Methods
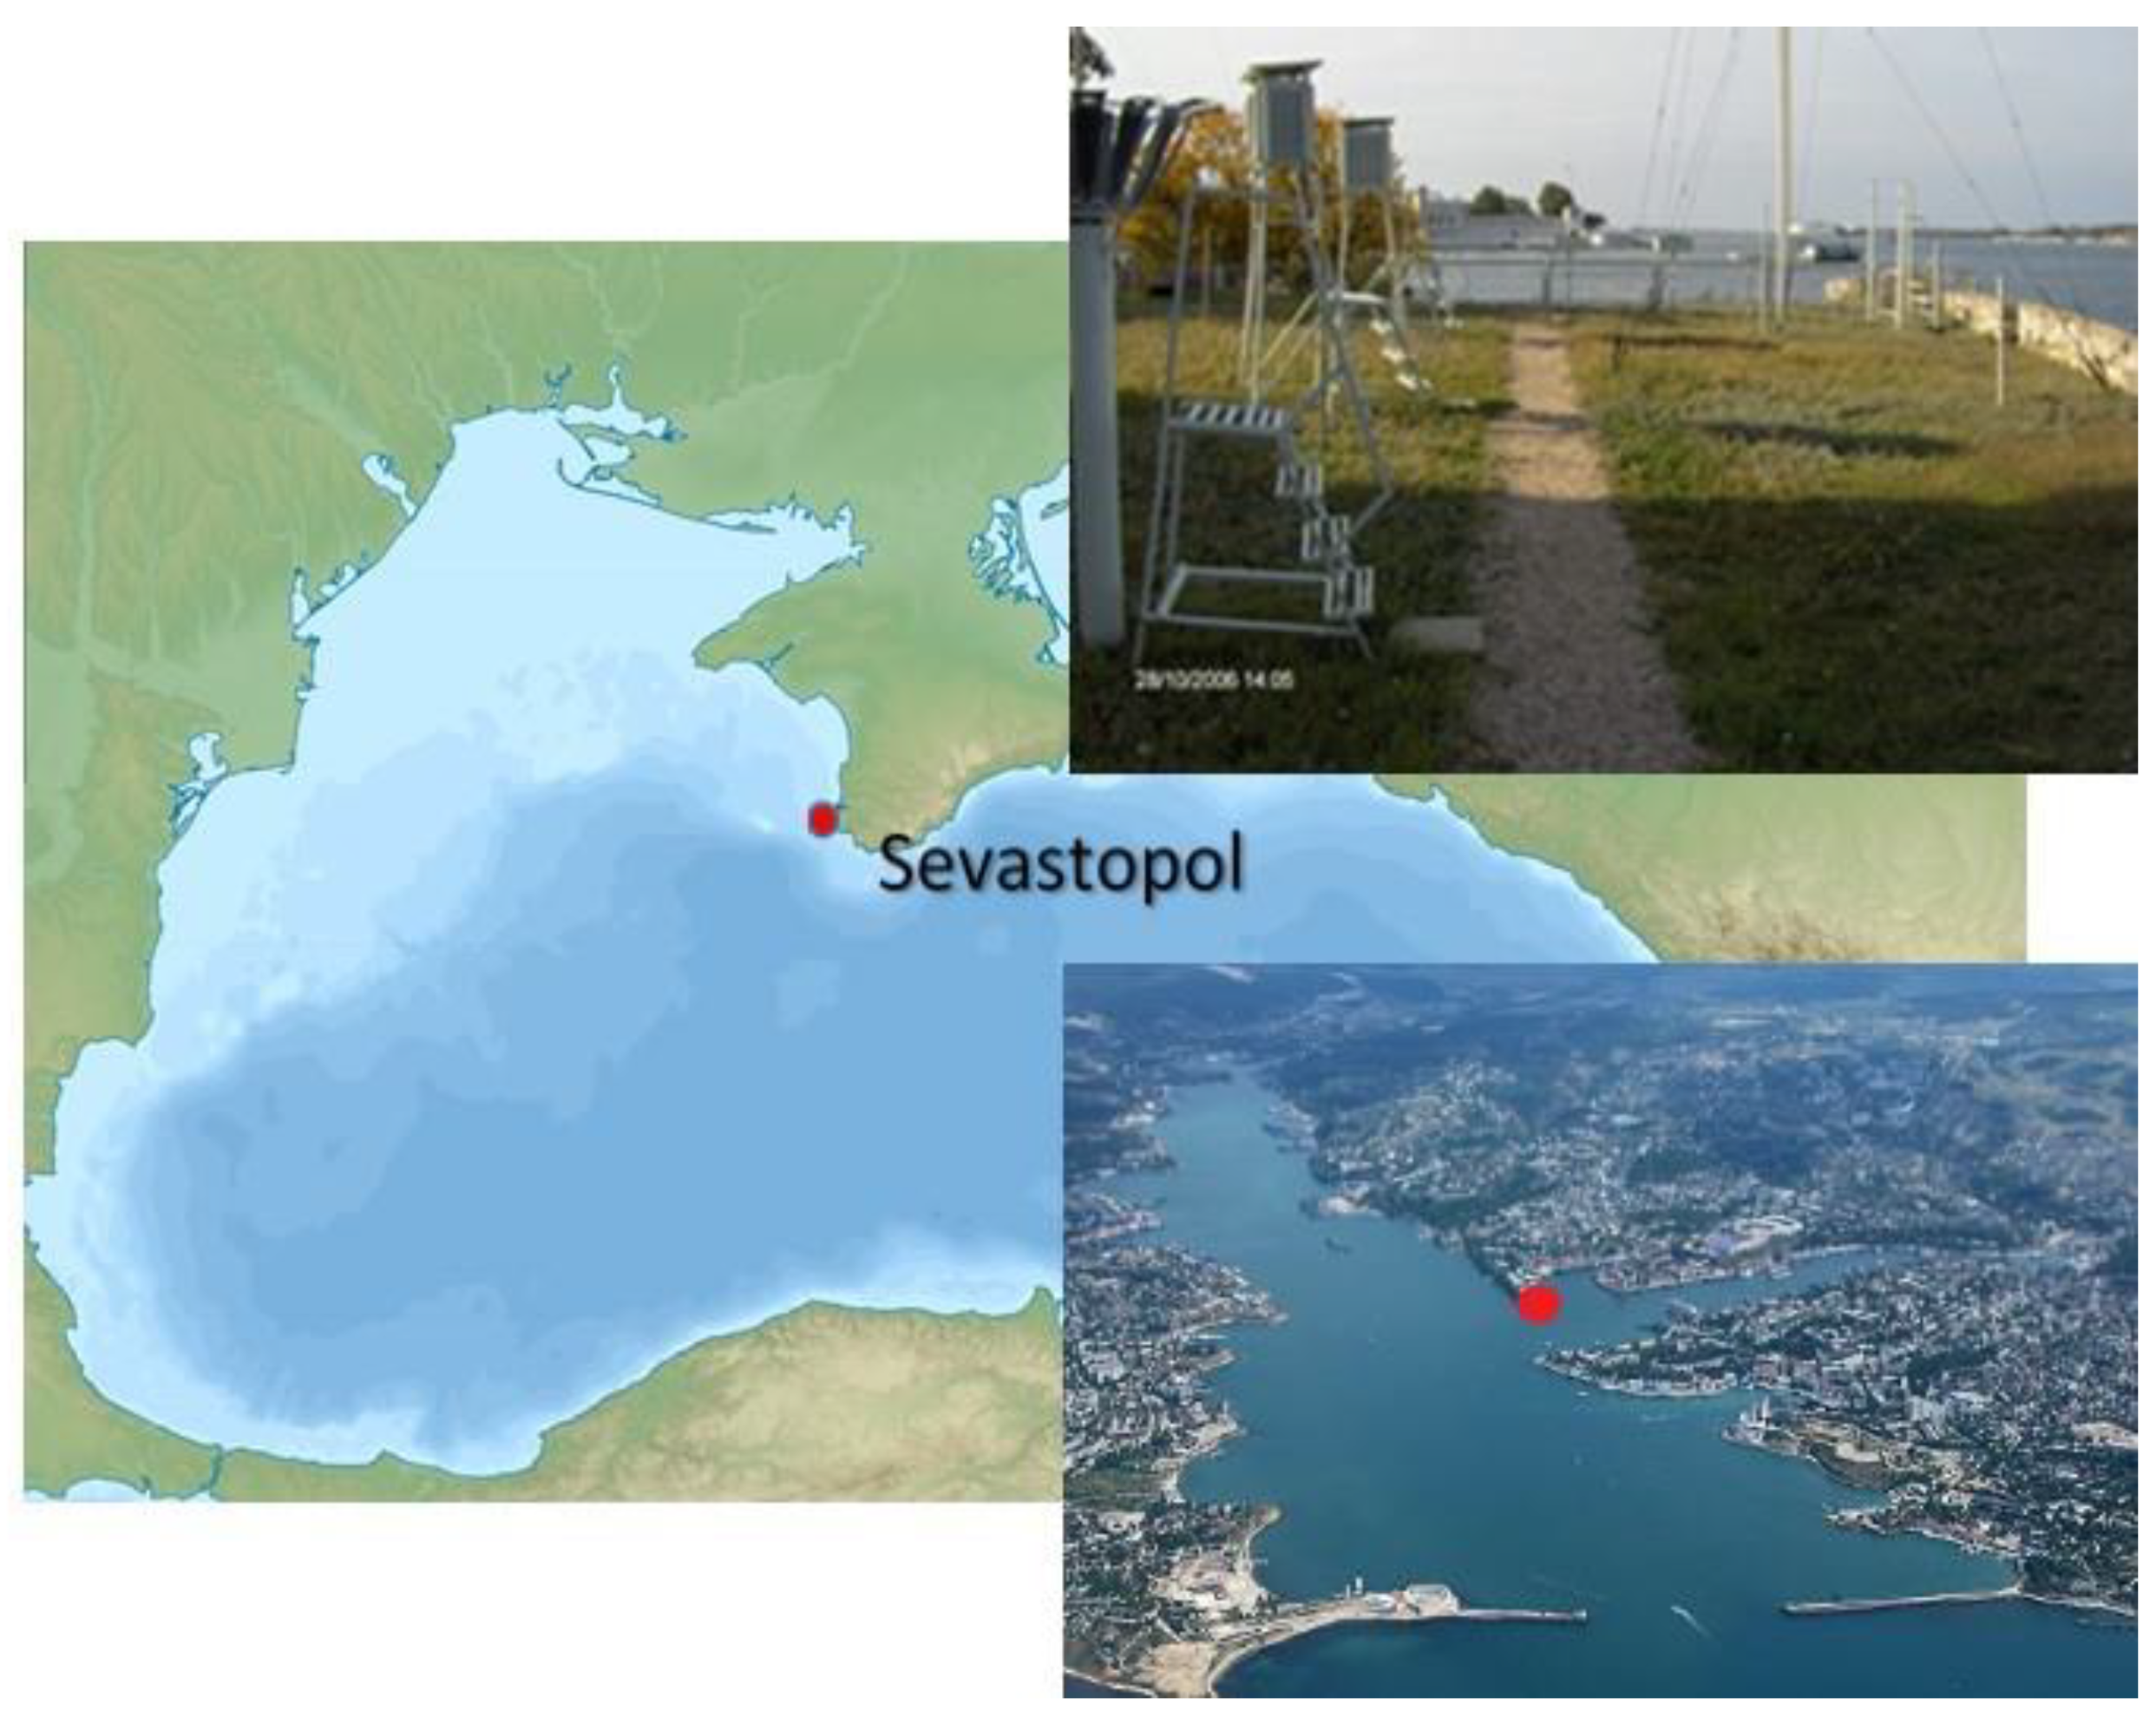
2.1. Sampling Site

Monitoring of nutrients concentration in the atmospheric precipitations has been organized in Sevastopol (southwestern coast of Crimea) since 2003 (inorganic nitrogen) and since 2010 (inorganic phosphorus and silicon) with some with a break. Continuous observations have been carried out since 2015. The meteorological station “Sevastopol”, where the samples have been collected, is located at the junction of the south and north bays, on the Pavlovsky cape (Figure 1) since 1909.
During this time, the situation around the station has not changed much in terms of the construction of high-rise buildings, new tall trees, etc. The same sea, the same bay—all the same, that is, almost perfect conditions, in an ideal location. The station works 24/7, which allowed us to collect the first, most important, portions of atmospheric precipitation. Samples of wet depositions were collected after each rain or snow event into a closed (wet-only) sampler, which opened with the onset of precipitation and closed immediately after it ended, and into a permanently open one, to assess the effect of dust on the nutrients concentration in dry depositions. Precipitation samples were frozen after sampling if it was not possible to analyze them immediately after sampling. Collected samples were analyzed in the Marine Biogeochemistry Department, Federal State Budgetary Scientific Institution Federal Research Center “Marine Hydrophysical Institute of the Russian Academy of Sciences” (FSBSI FRC MHI). Only those samples were analyzed whose volume allowed for chemical analysis.

2.2. Analytical Methods

In order to assess the input of nutrients with atmospheric precipitations, the collected samples of wet atmospheric precipitations were analyzed for the content of inorganic nitrogen, phosphates, and silicon at the Crimean coast of the Black Sea. Nitrates and nitrites were analyzed photometrically on a flowing system of AutoAnalyzer. Ammonium was determined using a modified Sadgi–Solorzano method for seawater, which is based on determining the indophenolic dye forming in an alkaline medium from phenol, ammonia, and hypochlorite [31]. The method uses nitroprusside as a catalyst for the reaction, which largely increases its sensitivity. The sensitivity of this method is 0.05 µM [32]. To determine the nitrate–nitrite concentration, we used the method of reducing nitrates to nitrites with copper-bonded cadmium. Minimum detectable nitrates are 0.36 µM with the method error at ±0.20 µM [33]. The error in determining the inorganic phosphorus by the method based on the formation of a blue phosphomolybdenum complex is ±2–15% (the maximum error occurs when concentration is less than 0.2 μM) [33]. The silica acid was determined based on the formation of a blue silicomolybdenum complex. The method error ranges from 3 to 20%, with the maximum error corresponding to concentration less than 0.36 μM [33]. Correction for salinity was applied [34] when determining the silica acid.
As a result, a concentration data array in the samples from each of the samplers was obtained, cases of multi-fold excess of the nutrients content in the open sampler collected precipitation over that in the wet-only sampler were identified.

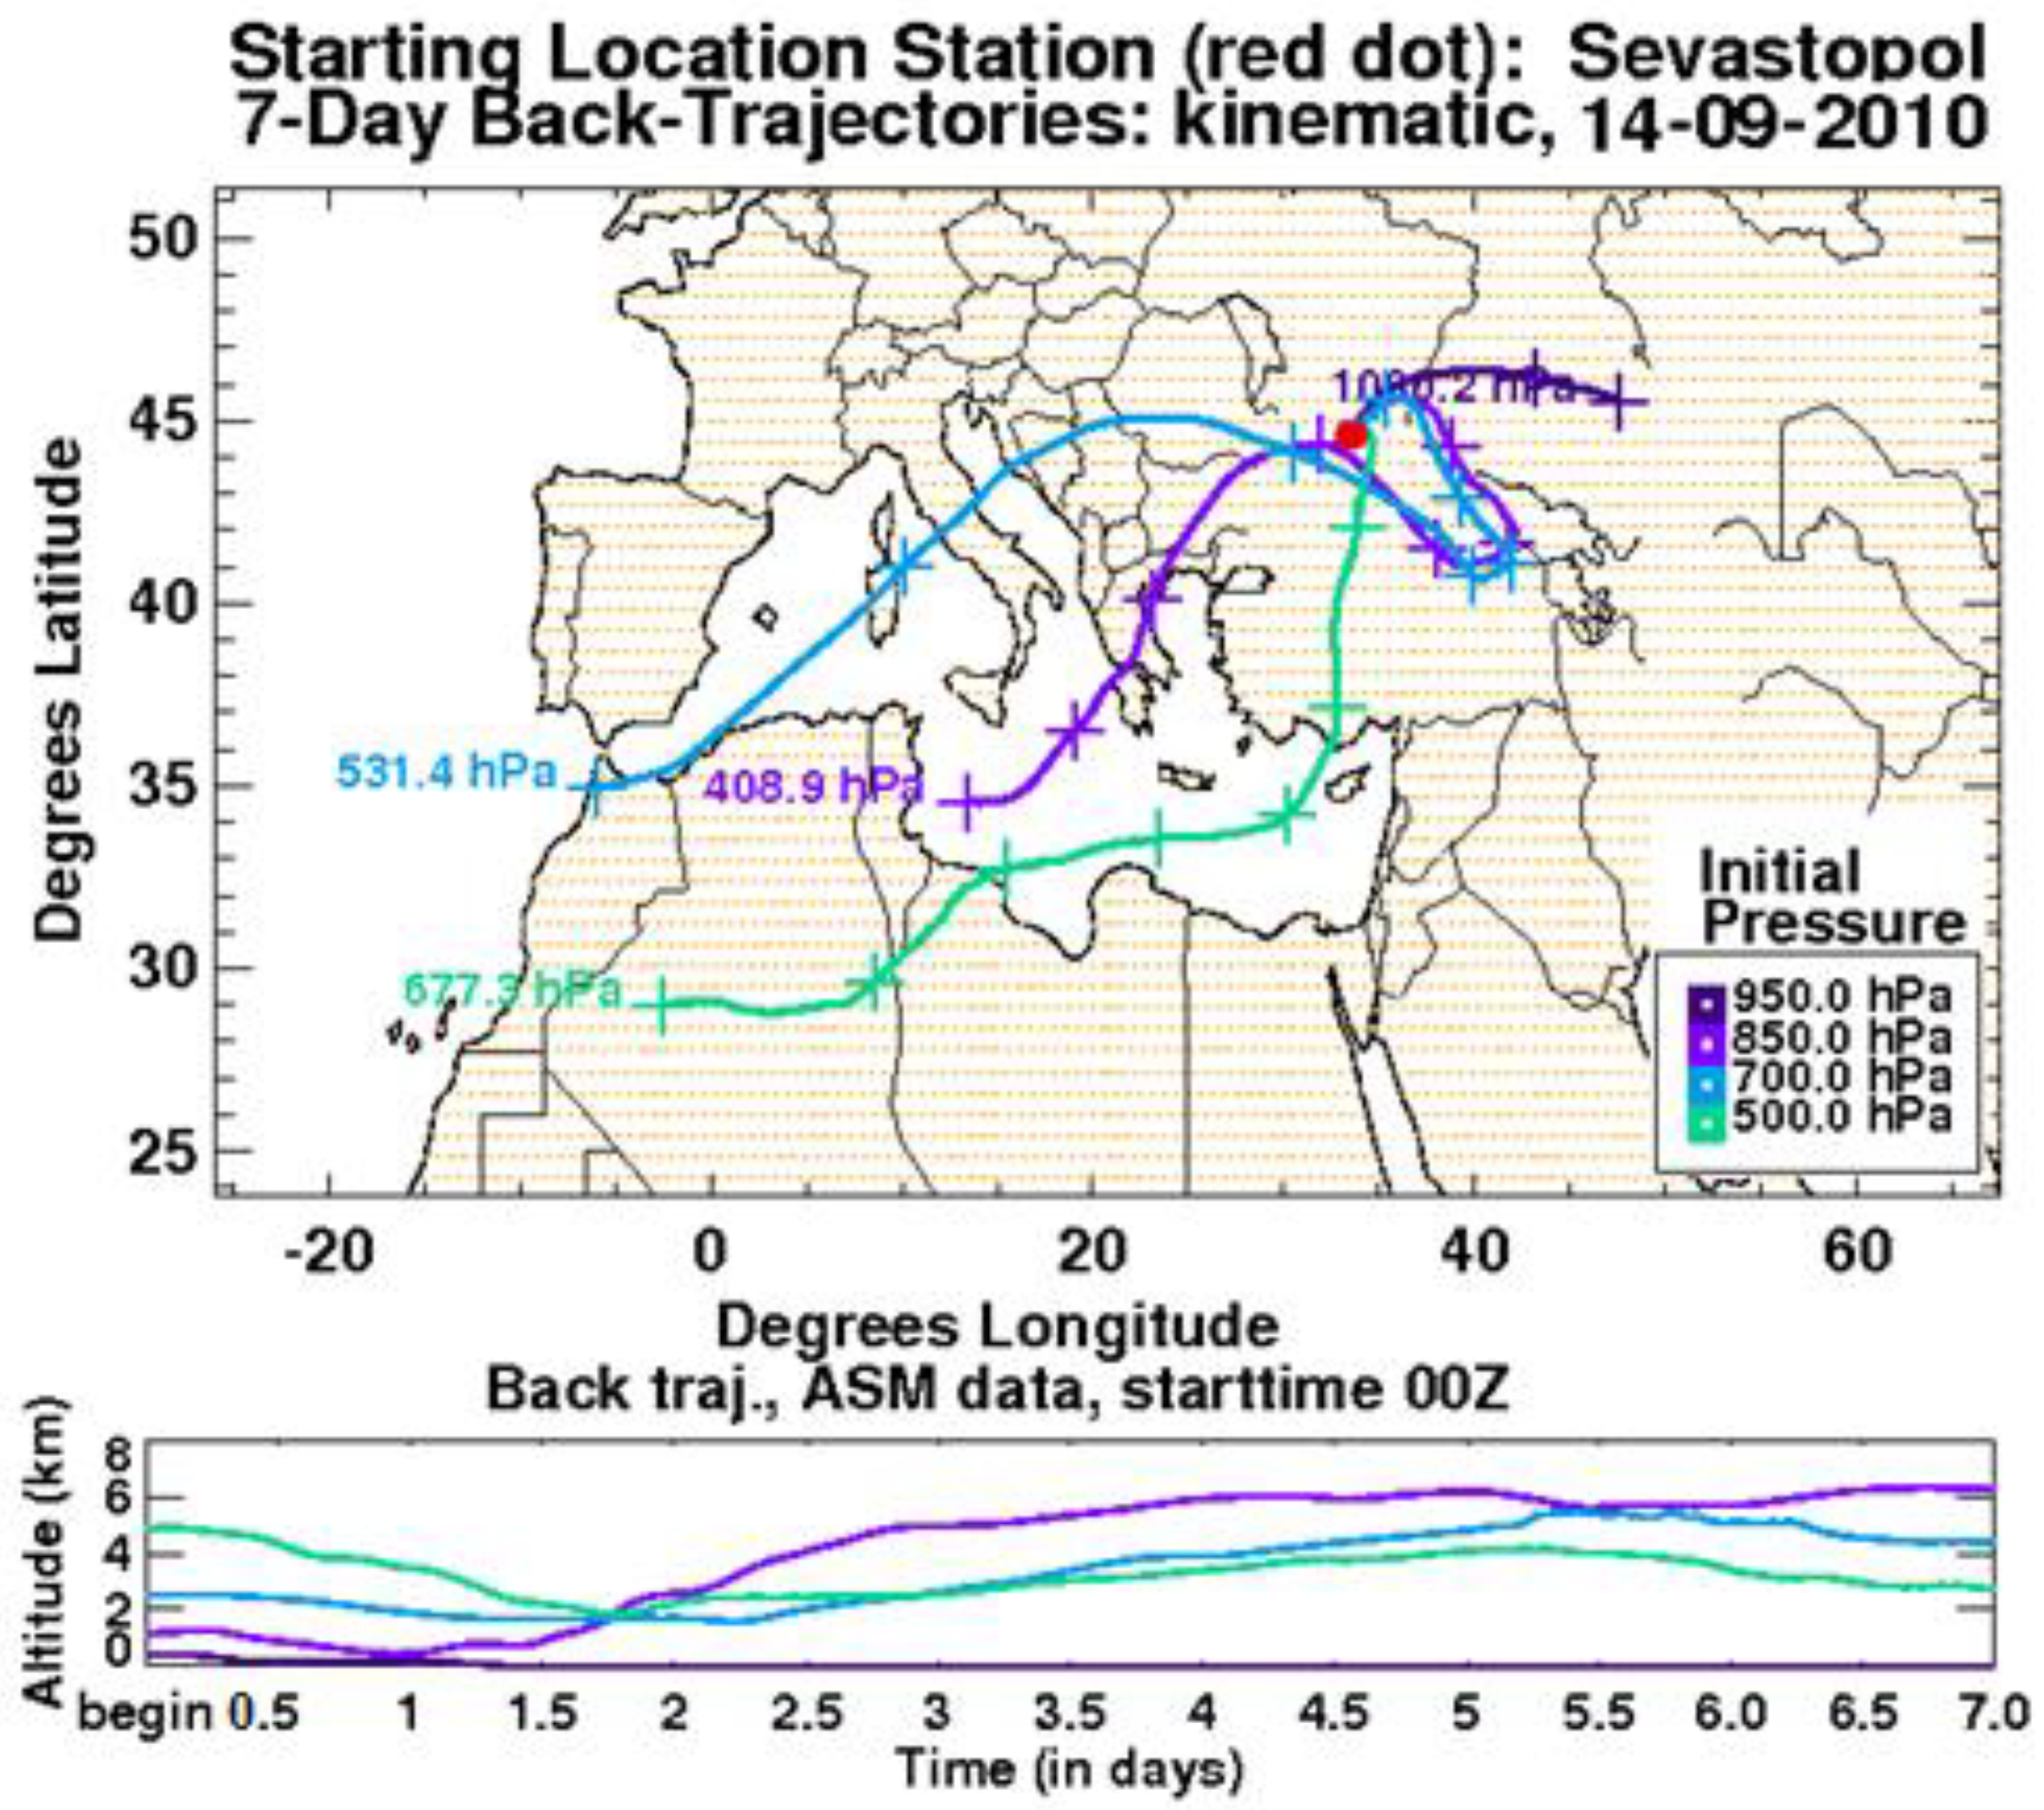
2.3. Air Masses Trajectories Analyses

The 7-day back-trajectories were analyzed in order to identify dust transfer for the dates with high nutrients concentrations. Some of these dates are analyzed in [30,35]. We used the model of the international network AERONET (Aerosol Robotic Network) and the HYSPLIT (Hybrid Single-Particle Lagrangian Integrated Trajectory) model. The air flow trajectory is a set of points in space, each of them is determined by the coordinates of the Lagrangian particle at a moment in time. Trajectories of air movement can be forward and reverse depending on the method of counting the time along the trajectory. A forward trajectory shows the path that an air particle makes as it moves away from the start point. A negative time step in the AERONET model is used to determine the back-trajectory, i.e., the trajectory characterizes the path that the air particle moved before it reached the monitoring point. Back-trajectories corresponding to the position of the air masses at 0 and 12 h GMT are generated twice a day. The reliability of the atmosphere dynamics data confirmed by a number of papers in which the accuracy of model calculations of forward and backward trajectories of air particles is estimated [36,37,38,39,40]. Such estimates are performed based on comparing the simulation results with the real trajectories obtained as a result of tracking the movement of special probes or markers. The markers can be various impurities released during the experiment (inert gases) or entering the atmosphere as a result of natural (pollen, volcanic ash) and man-made phenomena (radioactive substances), as well as physical quantities (potential temperature, specific humidity, potential vortex), which persist along the trajectories of the air movement [41].
The HYSPLIT model is a complete system for computing simple air parcel trajectories, as well as complex transport, dispersion, chemical transformation, and deposition simulations. HYSPLIT continues to be one of the most extensively used atmospheric transport and dispersion models in the atmospheric sciences community. A common application is a back trajectory analysis to determine the origin of air masses and establish source–receptor relationships. HYSPLIT has also been used in a variety of simulations describing the atmospheric transport, dispersion, and deposition of pollutants and hazardous materials. The model calculation method is a hybrid between the Lagrangian approach, using a moving frame of reference for the advection and diffusion calculations as the trajectories or air parcels move from their initial location, and the Eulerian methodology, which uses a fixed three-dimensional grid as a frame of reference to compute pollutant air concentrations (The model name, no longer meant as an acronym, originally reflected this hybrid computational approach). HYSPLIT has evolved over more than 30 years, from estimating simplified single trajectories based on radiosonde observations to a system accounting for multiple interacting pollutants transported, dispersed, and deposited over local to global scales (http://ready.arl.noaa.gov/HYSPLIT.php, accessed on 14 May 2021).

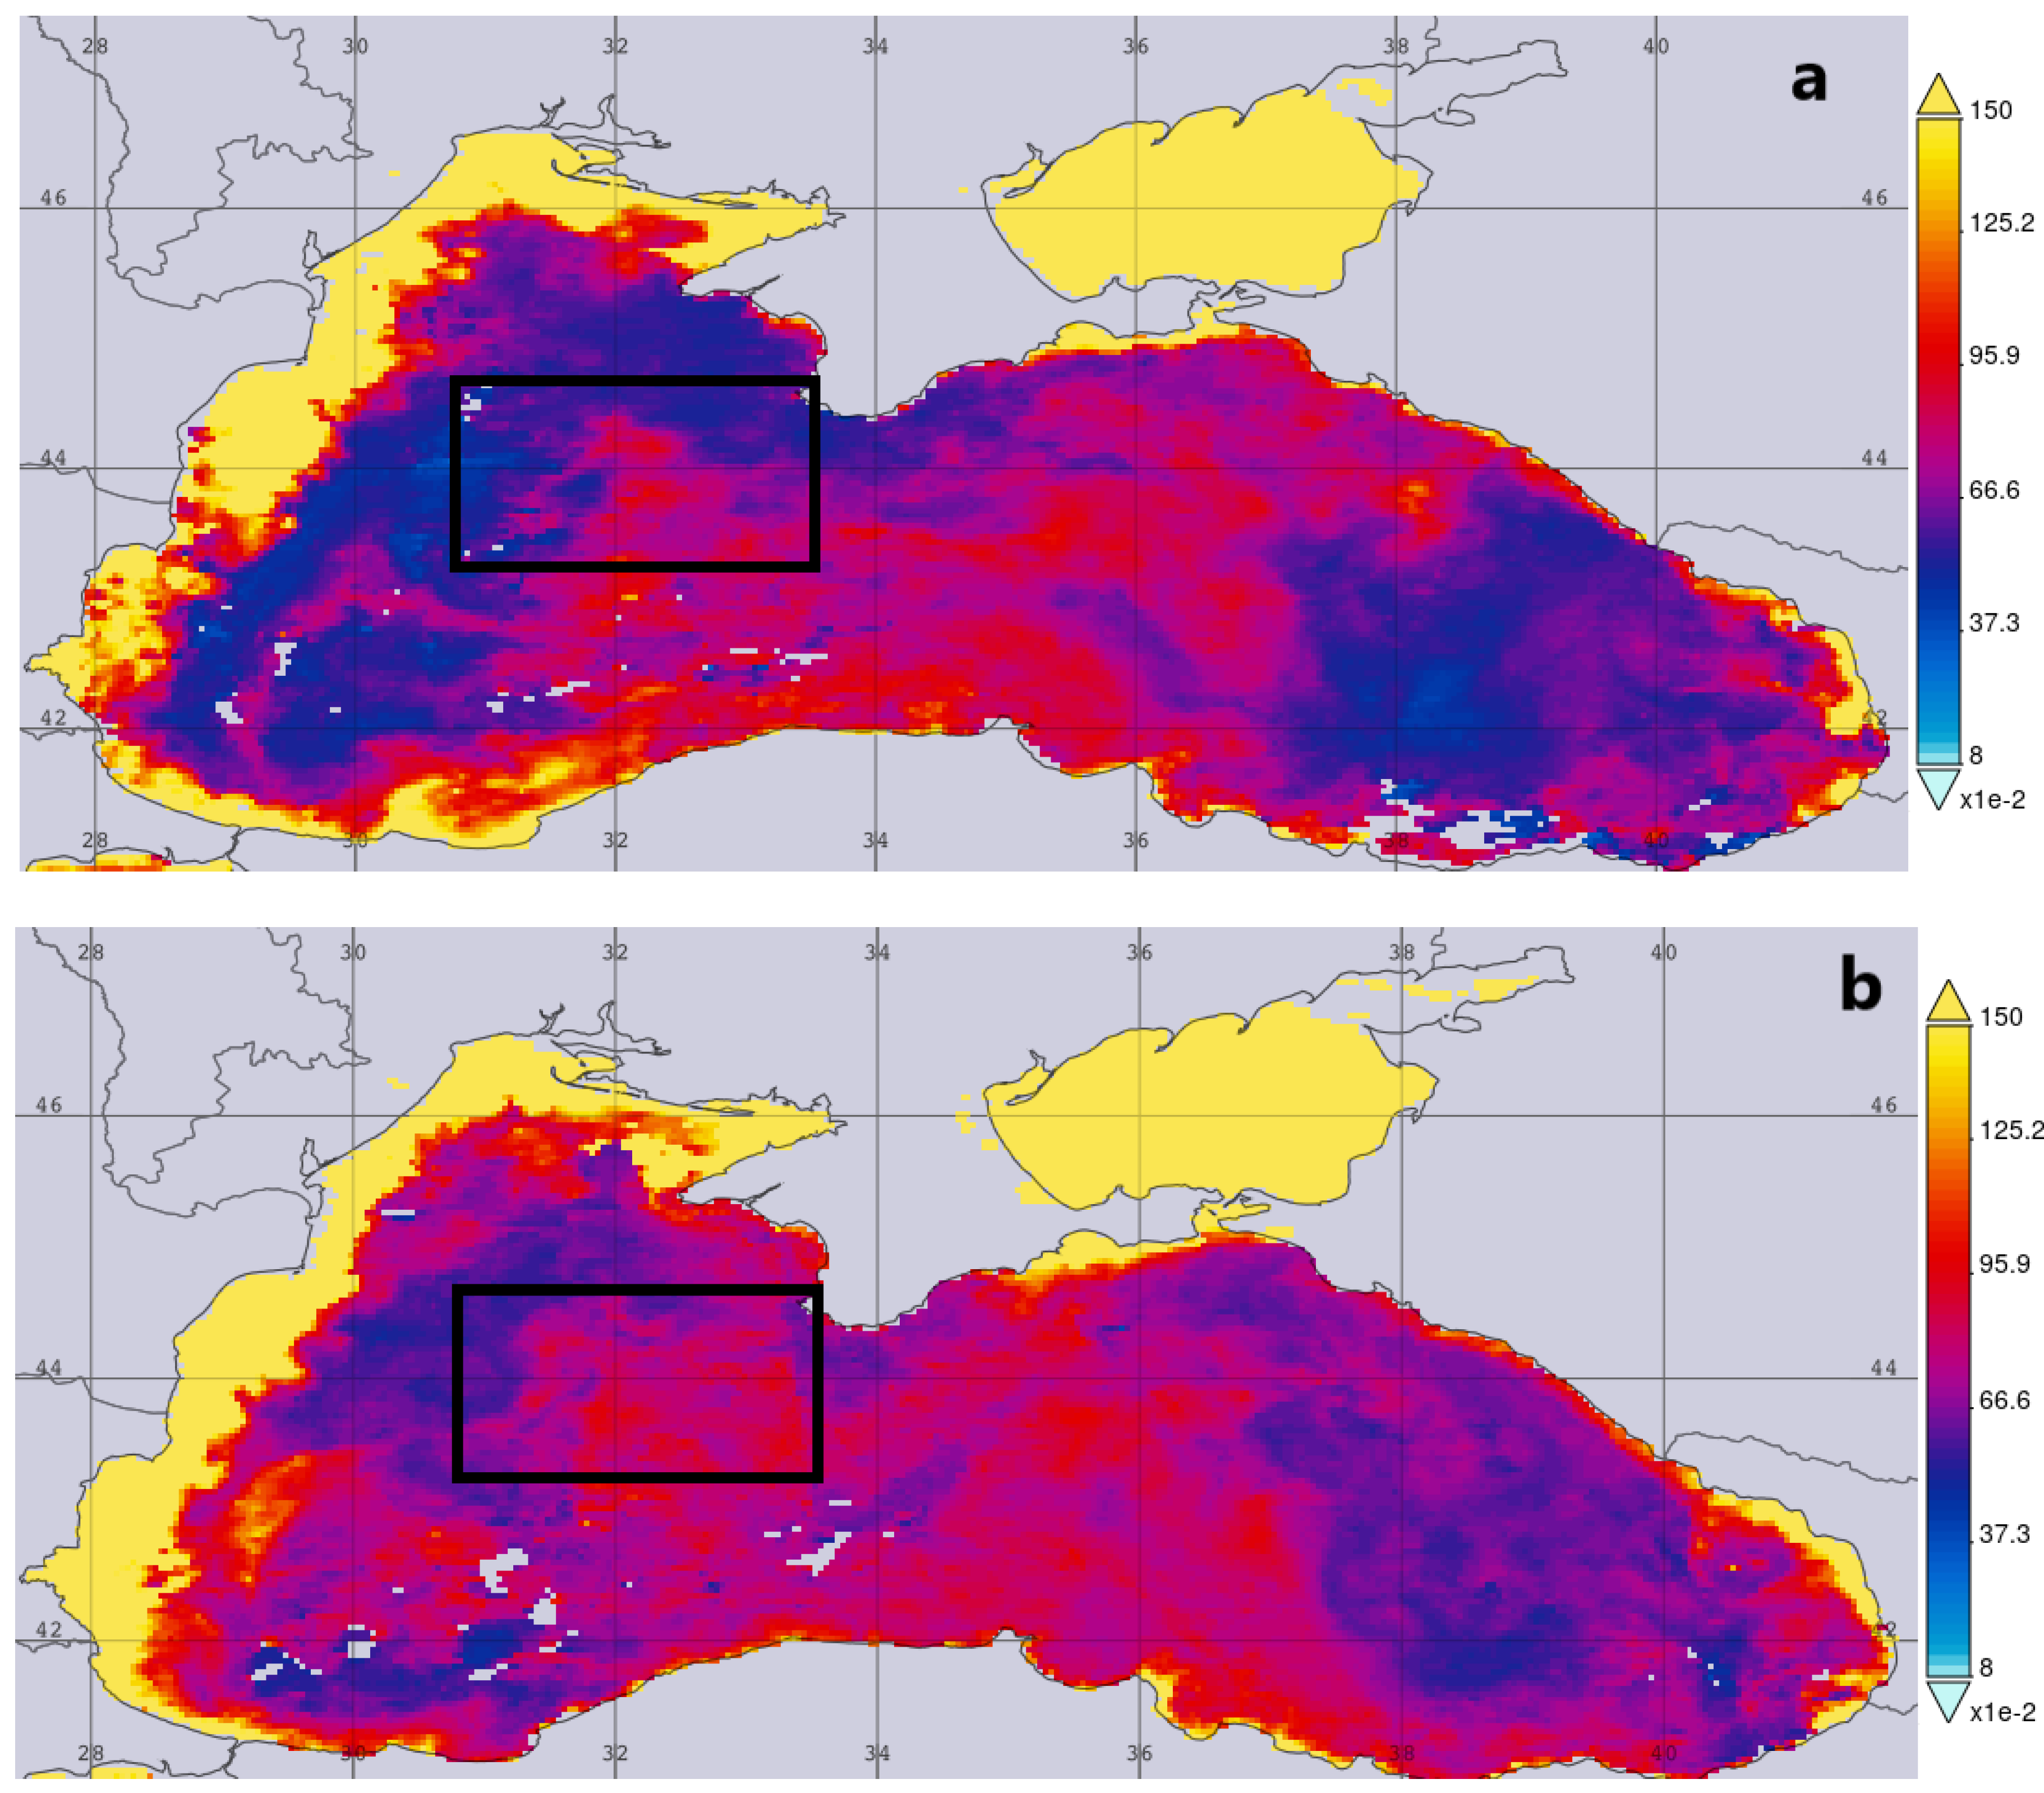
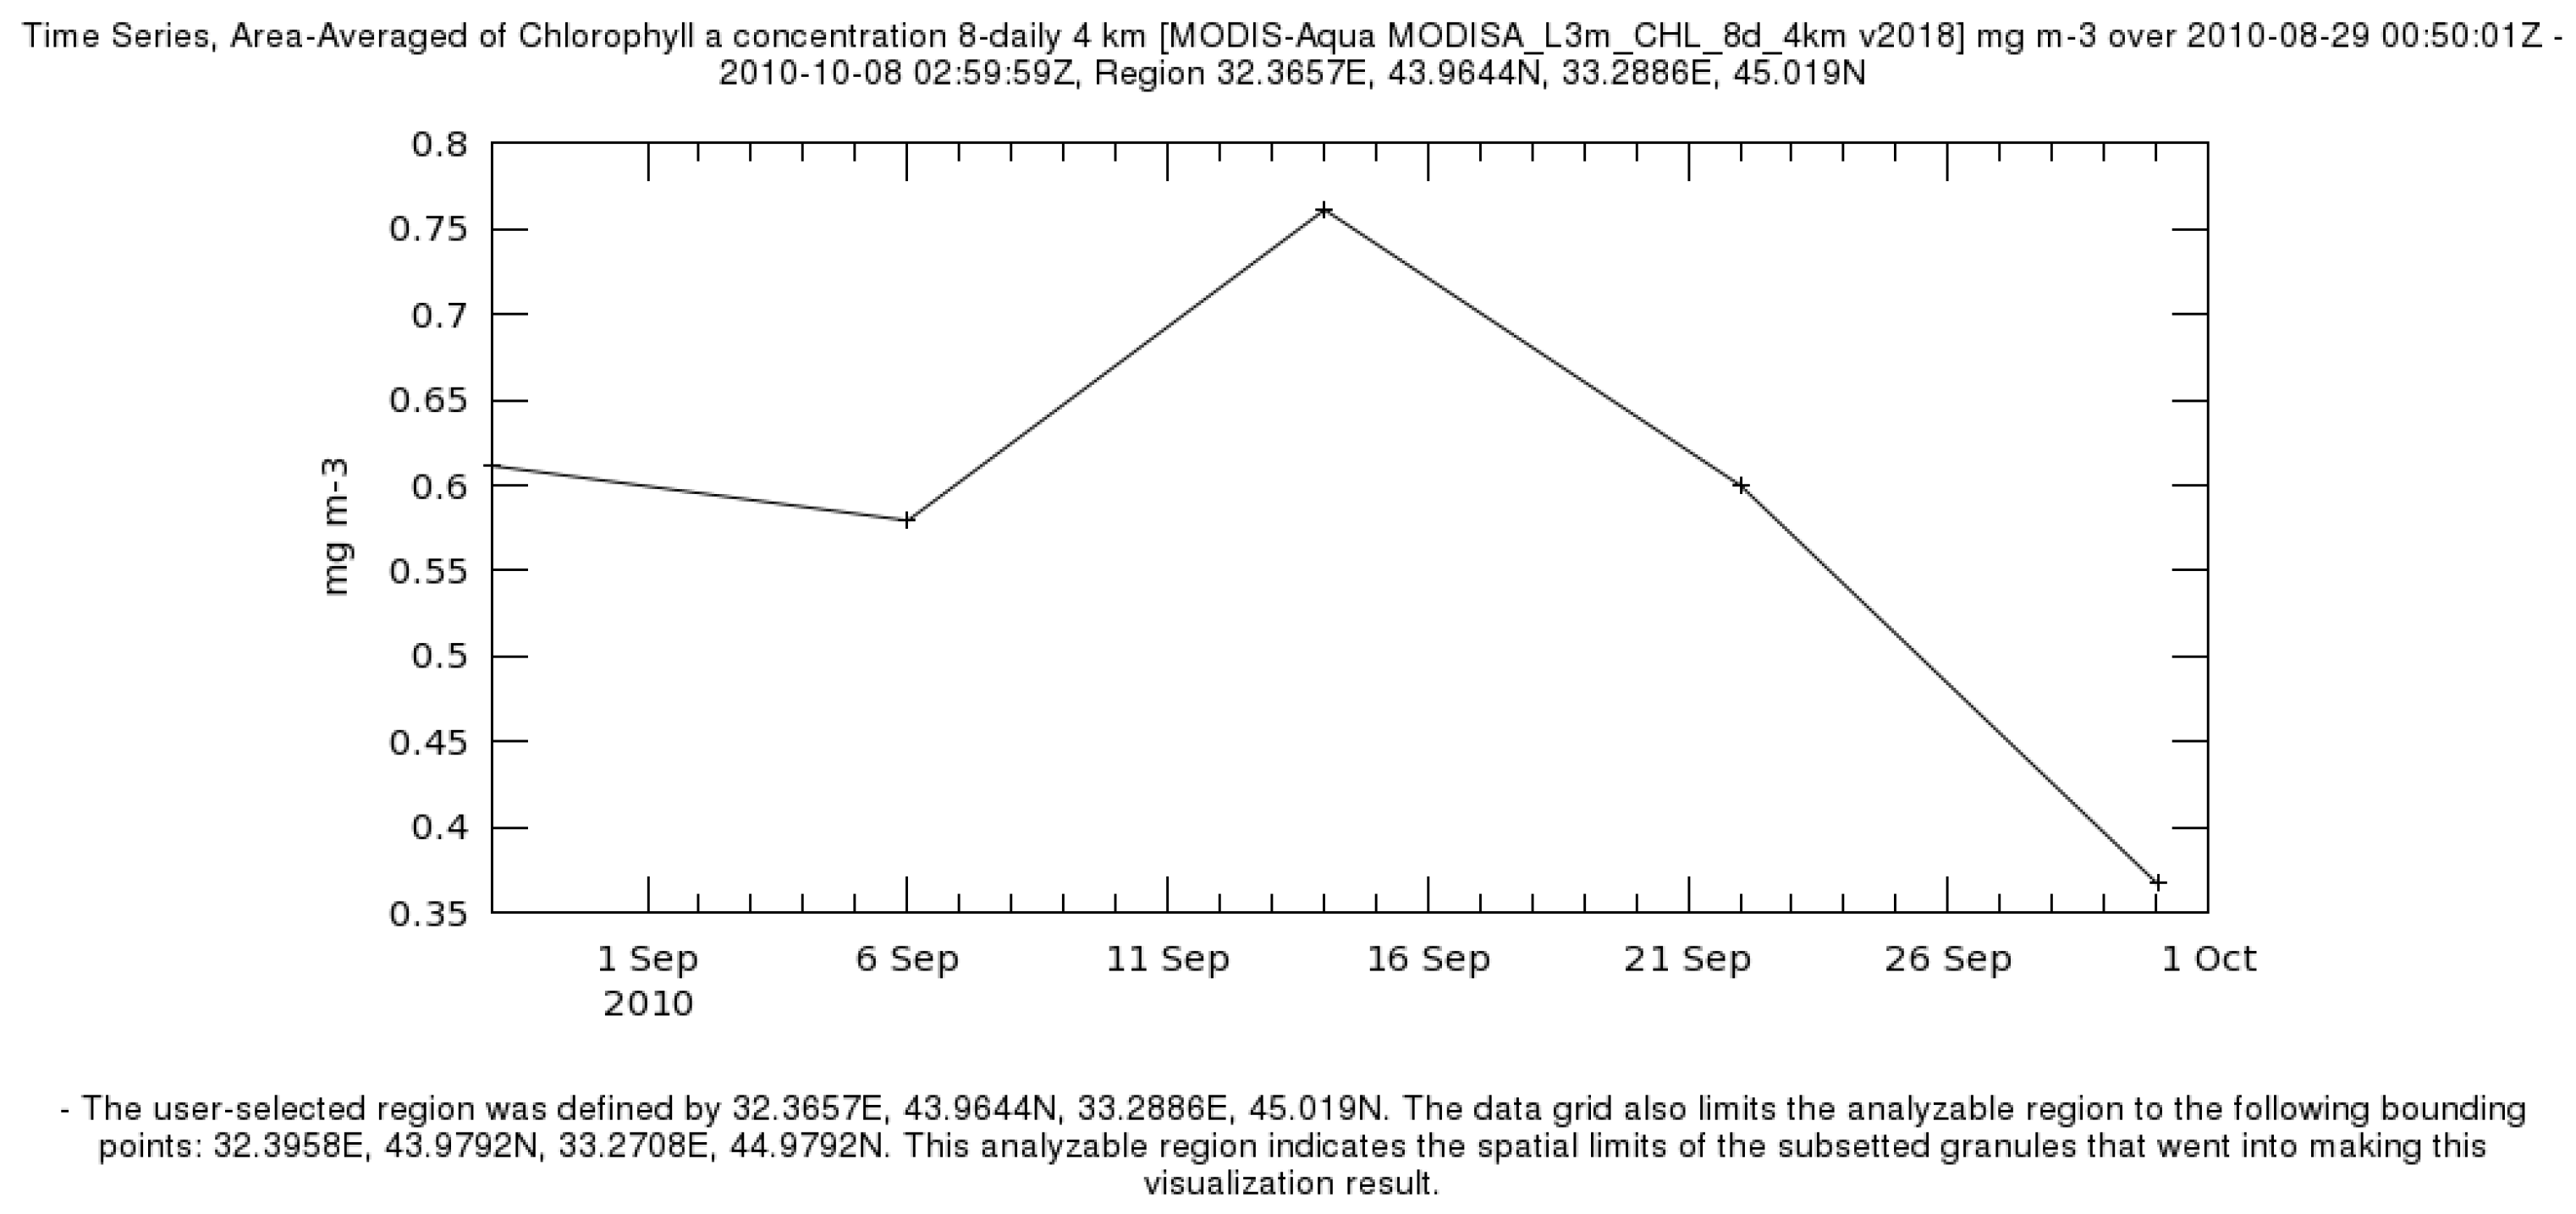
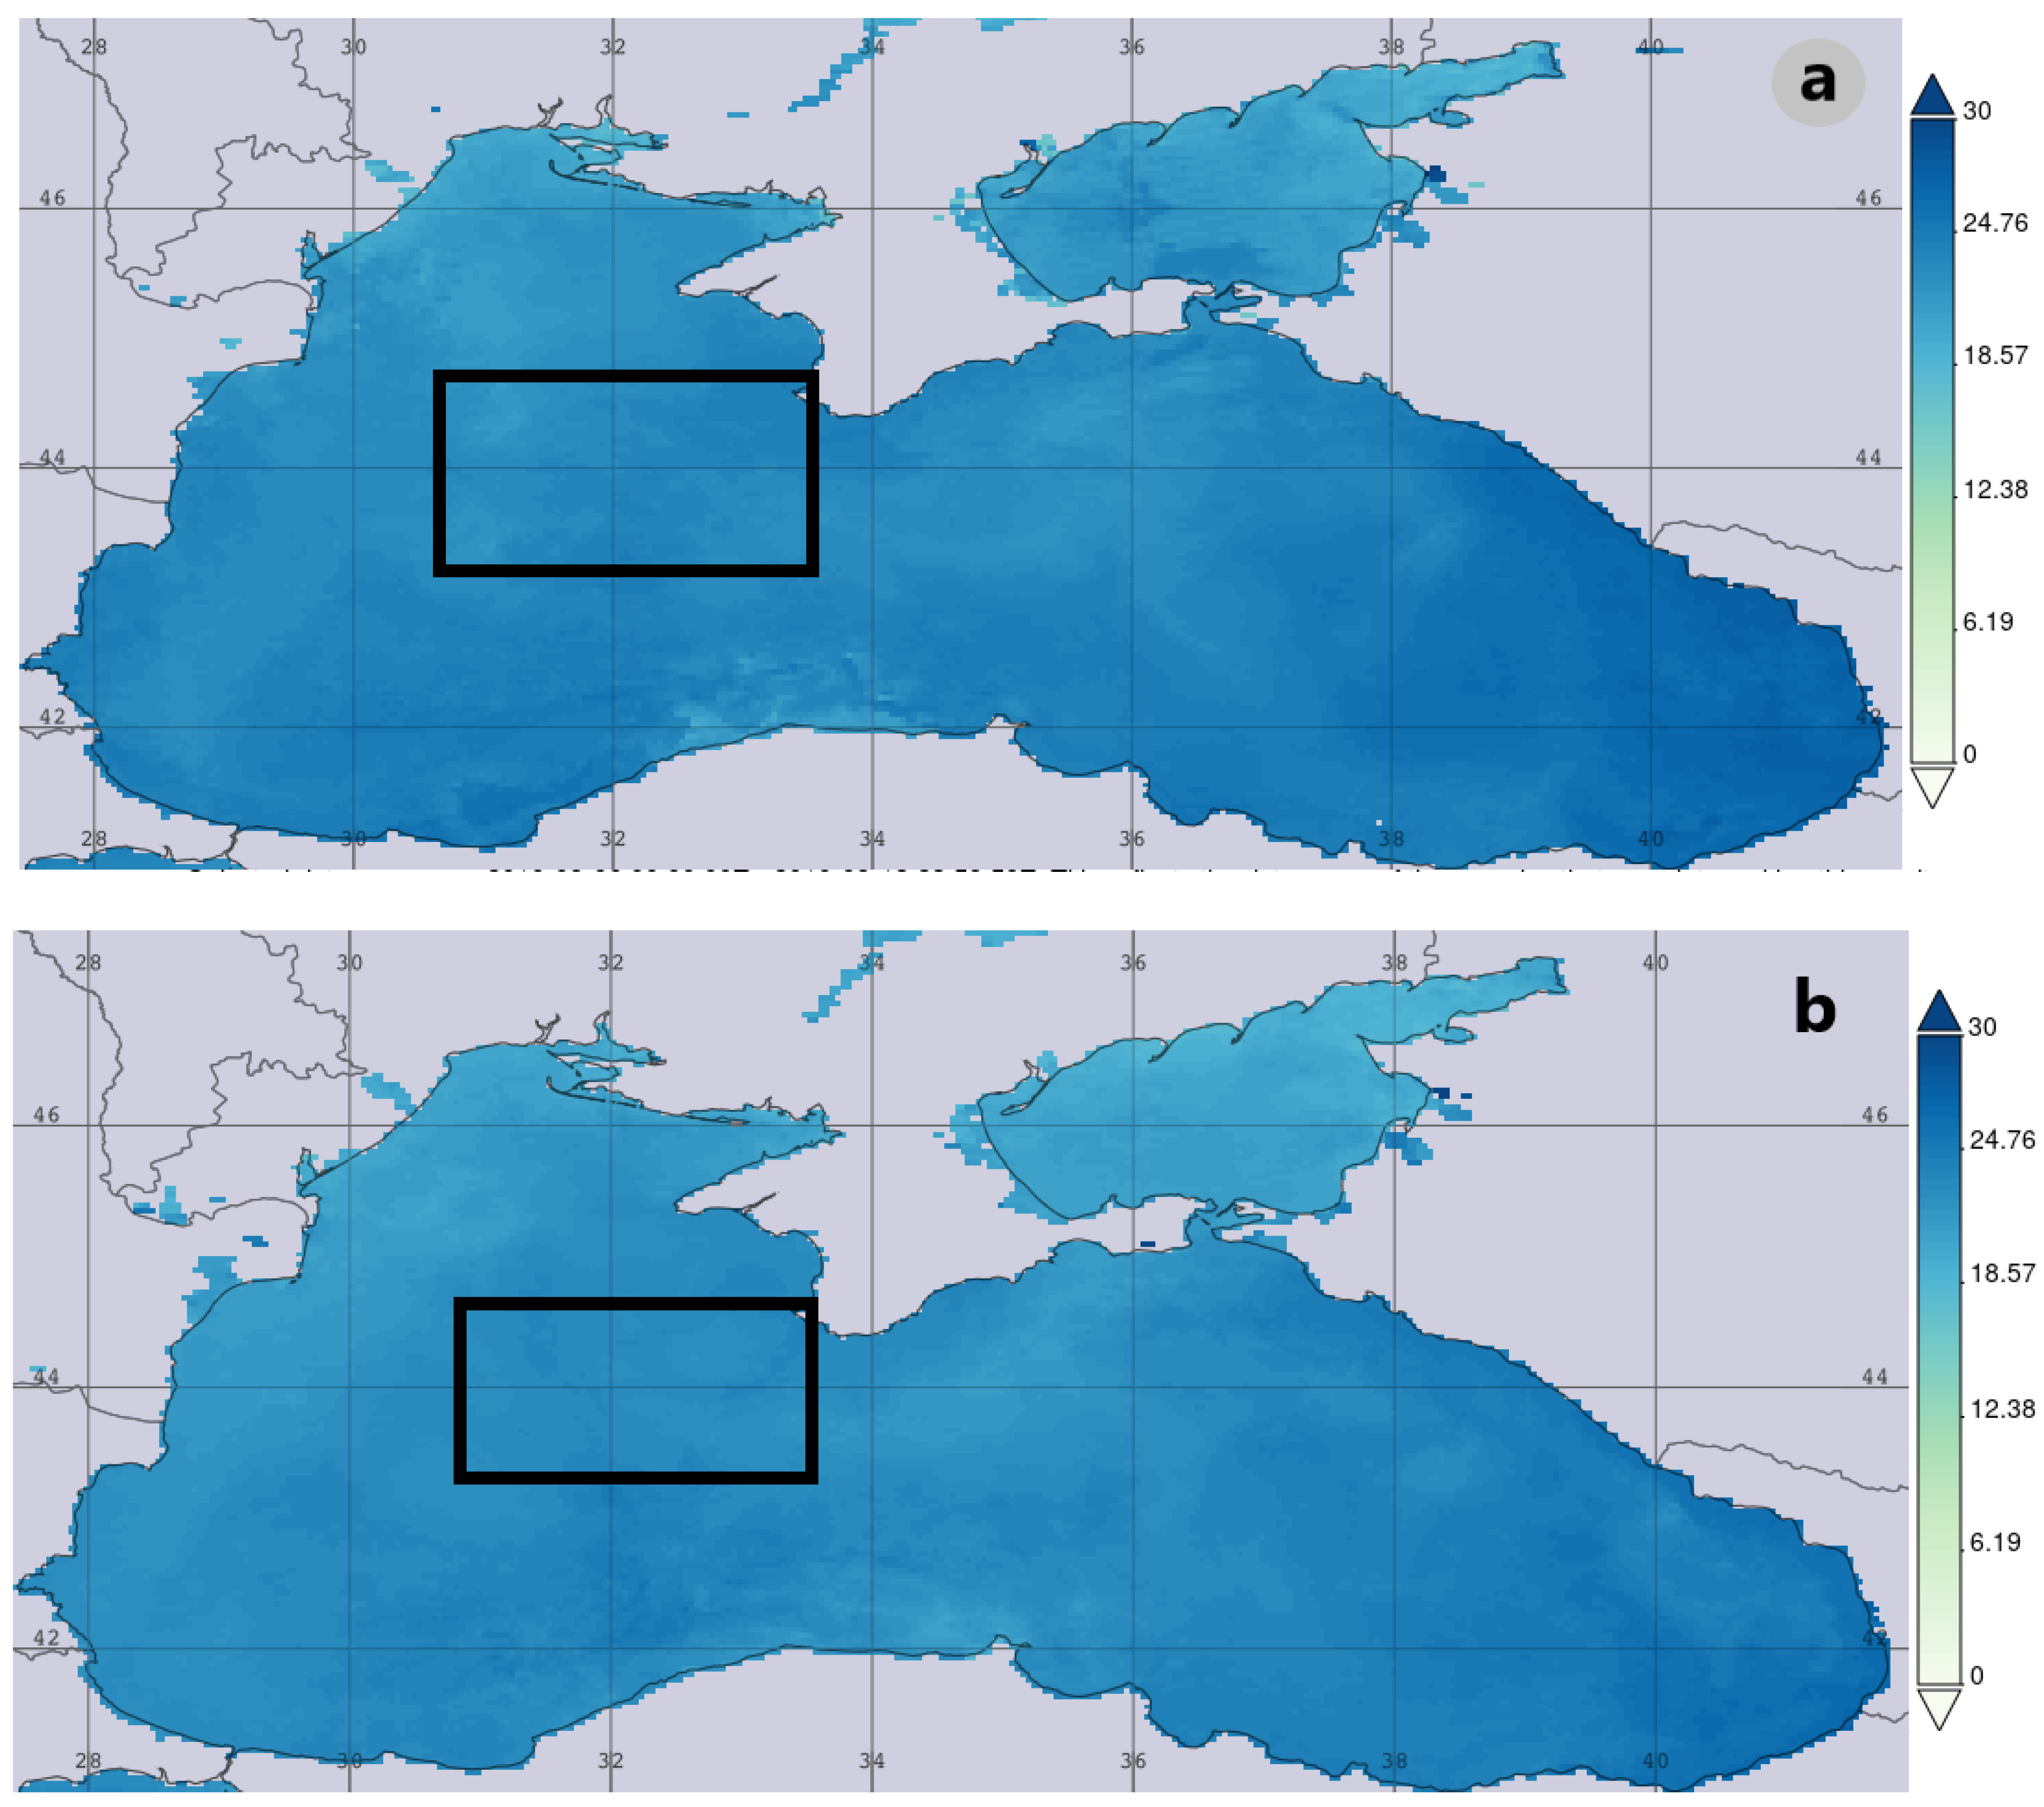
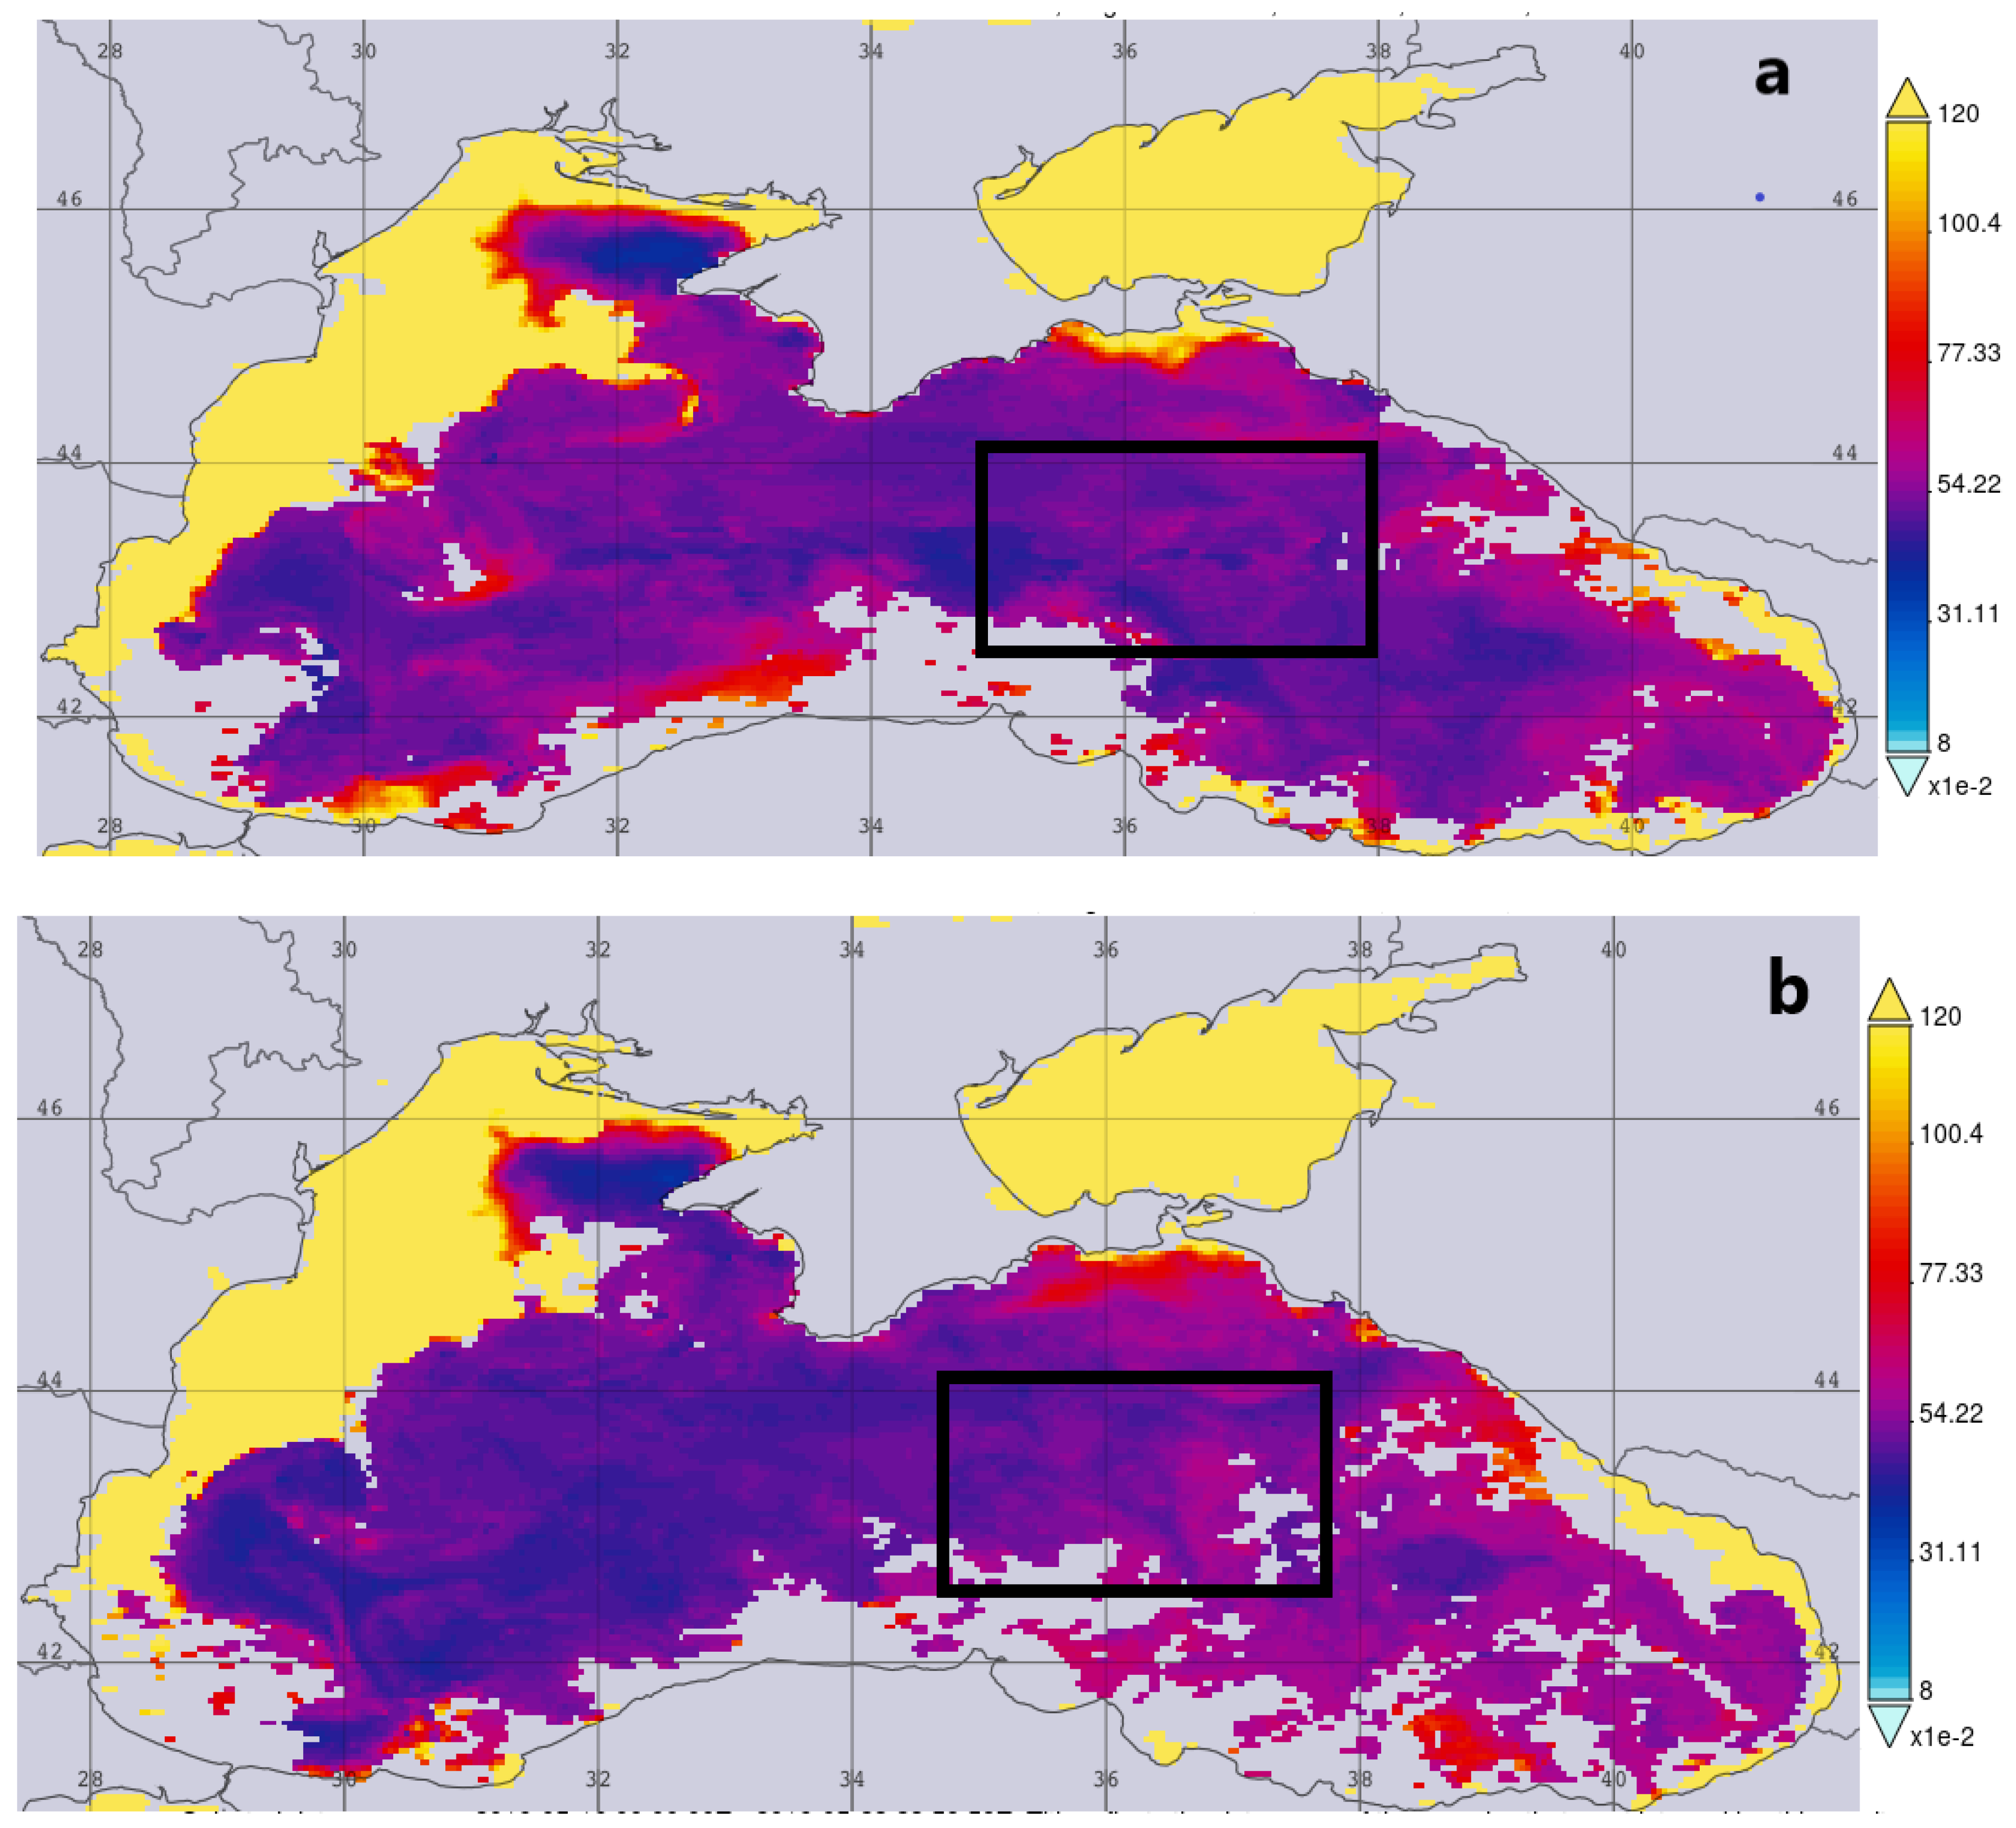
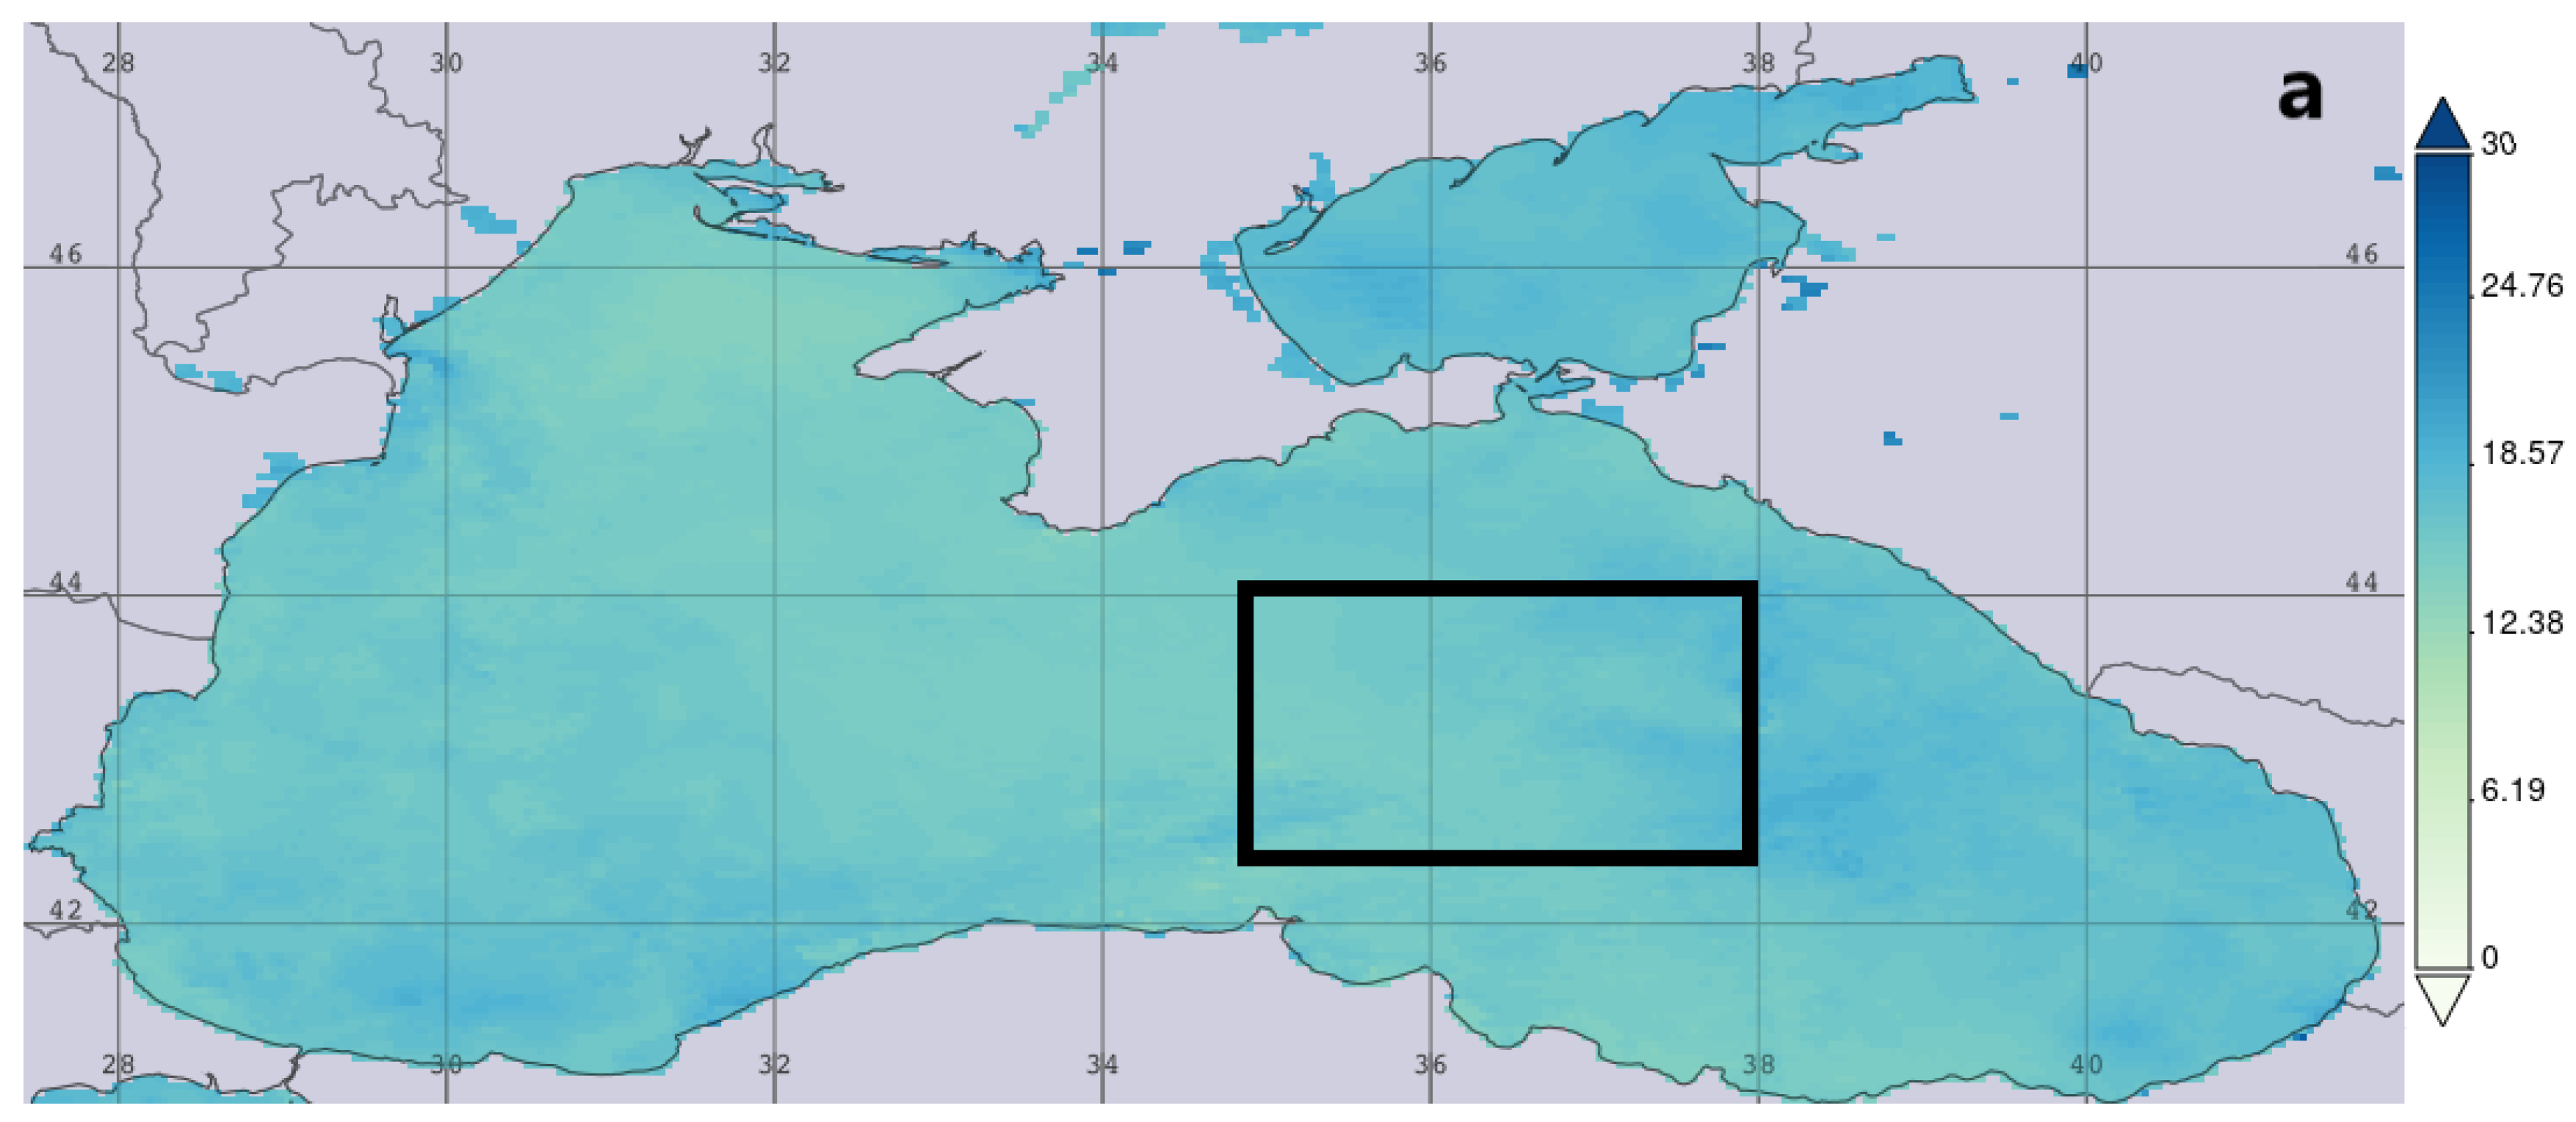
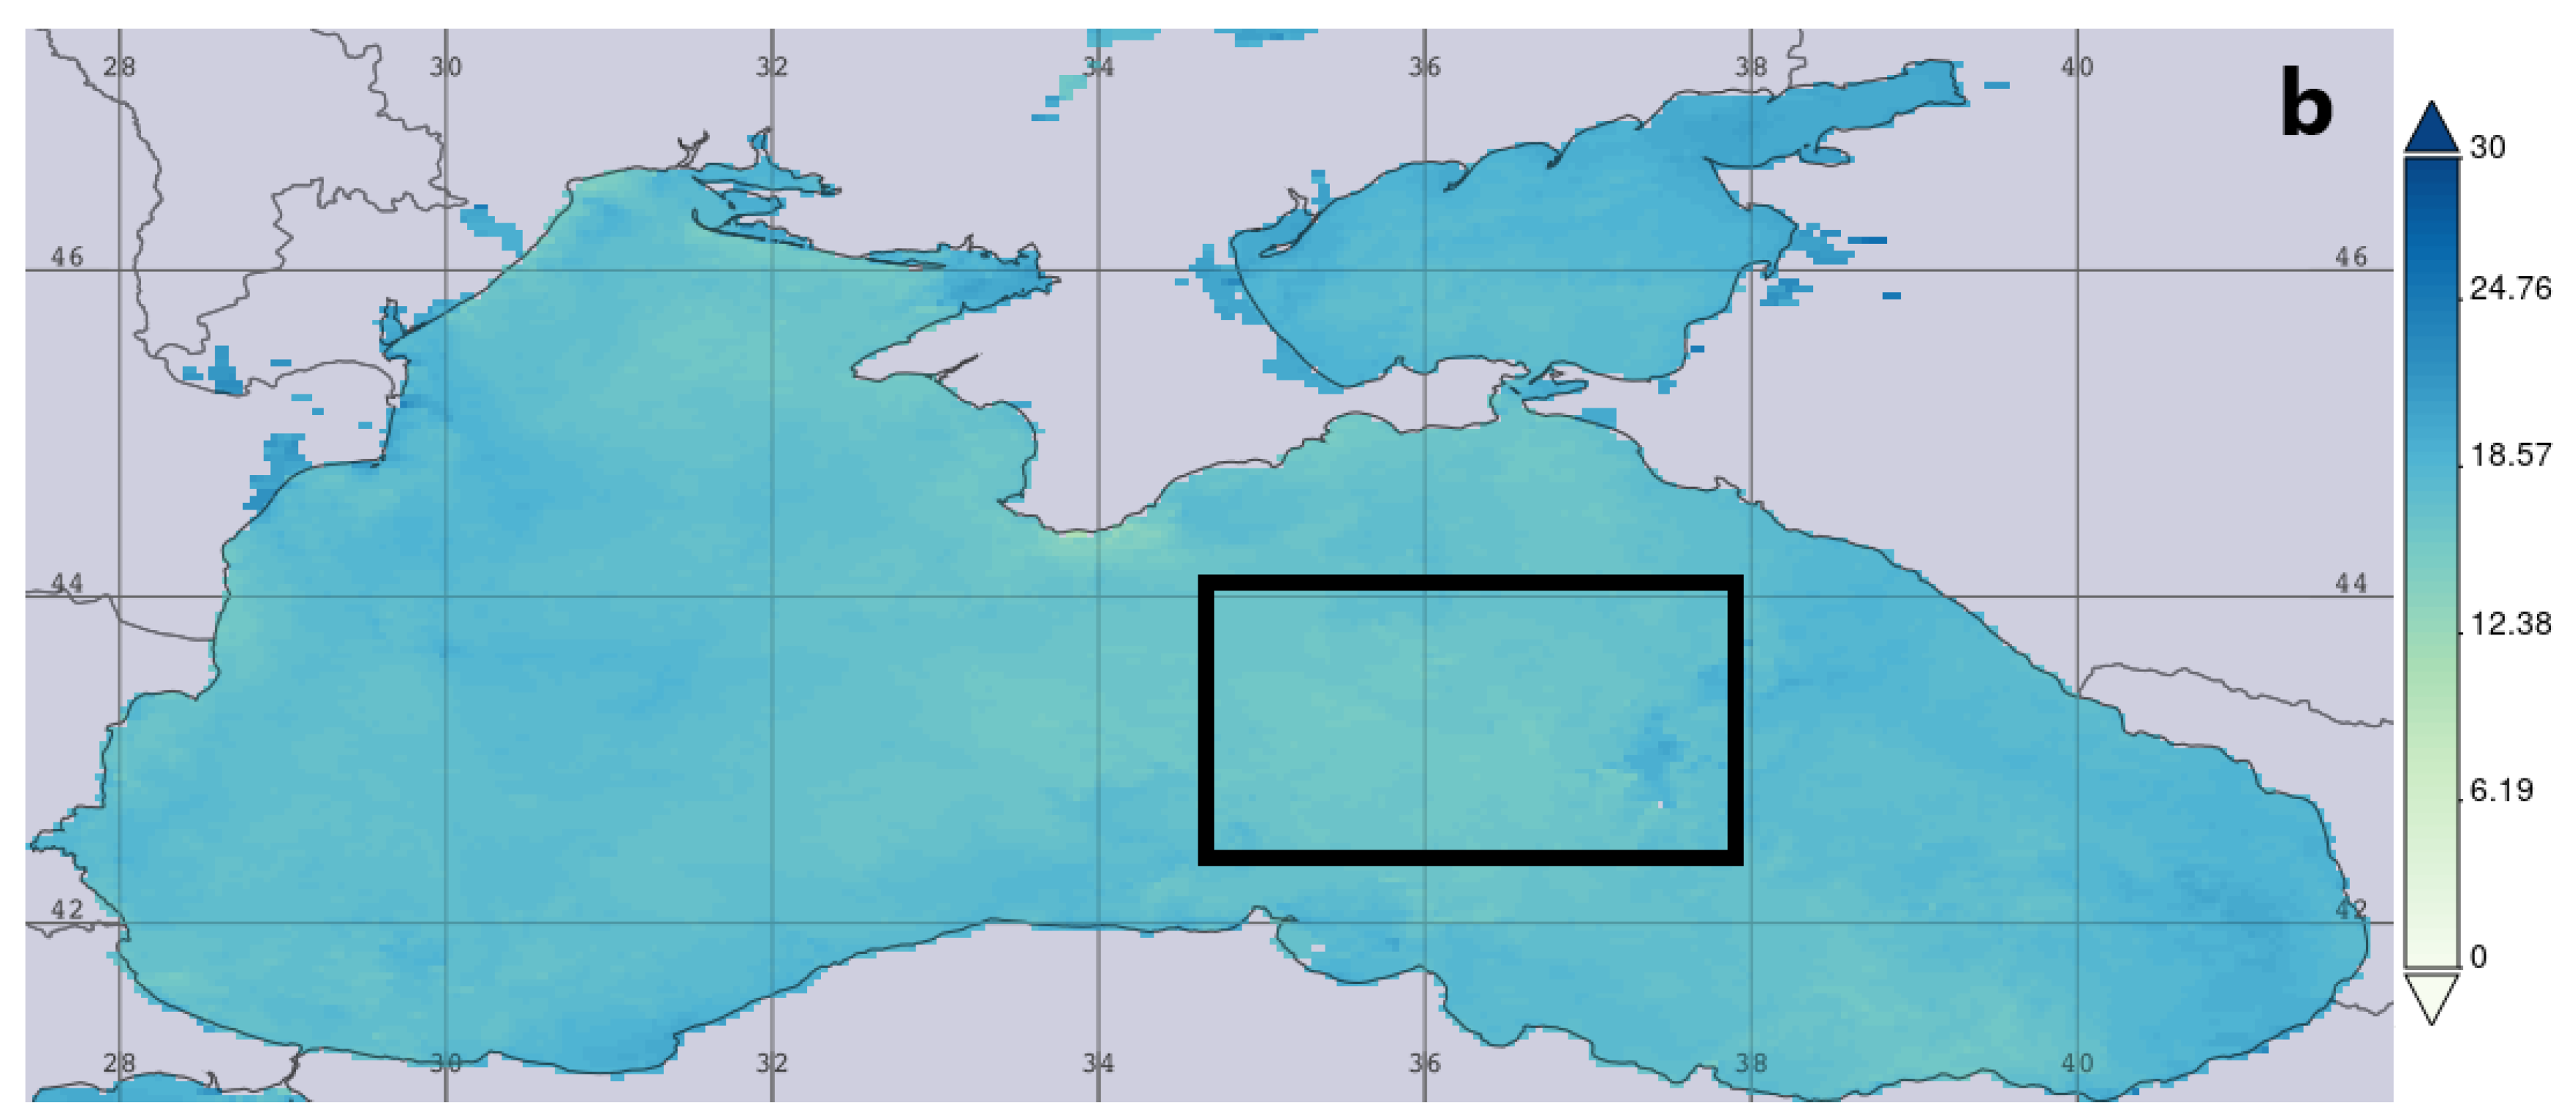
2.4. The Distribution of Chlorophyll-A Concentration and Sea Surface Temperature in the Black Sea

The next step was to analyze the distribution of chlorophyll-A concentration data in the Black Sea. We considered the dates in different years and seasons during the study period with the greatest difference in the nutrients concentrations in the open and closed samplers, as well as for those precipitation samples in which the nutrients concentrations were much higher than the volume-weighted mean (VWM) concentration. Concentration data of chlorophyll-A in the Black Sea surface layer, as well as the sea surface layer temperature data to exclude the influence of upwelling, were analyzed before and in few days after these dates. aAll recorded cases of dust transport distribution of chlorophyll-A and sea temperature were obtained using MODIS-Aqua satellite radiometric measurements, which were taken from the online data system Giovanni (http://disc.sci.gsfc.nasa.gov/giovanni, accessed on 14 May 2021). The temporal resolution is 8 days. To assess the influence of atmospheric depositions on the change in the concentration of chlorophyll-a, cases when the visibility of the atmosphere made it possible to obtain satellite data on the distribution of the concentration of chlorophyll-a in the Black Sea were considered.

2.5. Redfield Ratio

To analyze the effect of precipitation on aquatic ecosystems, we can use the common molar elemental ratio. In 1934, Redfield discovered that the ratio of carbon (C) to inorganic nitrogen (N) to inorganic phosphorus (P) is a nearly constant 106:16:1 throughout the oceans. In 1985, Brzezinski [42] improved this ratio, which is 16:1: 15 for marine ecosystems. One of the properties of the Redfield ratio is that it allows an estimate to be calculated of the impact of a process on one nutrient’s concentration from knowledge of the impact on another [43]. A second use of Redfield ratio—is for calculating the magnitudes of deviations from the normally observed covariation of biogeochemical variables, which can be used to diagnose some biogeochemical processes.

3. Results

In total, for the period 2010–2019, about 400 atmospheric precipitations samples were collected and processed (Table 1).
The contribution of dry depositions to the nutrient’s content in atmospheric precipitation over the study period was on average 33% for inorganic nitrogen, 281% for phosphates, and 405% for silica acid. The maximum concentrations of inorganic phosphorus and silicon in the open sampler over those in the wet-only one was 105 times.
The results of the analysis of the chemical composition of atmospheric precipitation make it possible not only to assess the contribution of local sources of pollutant emissions, but also the transfer of these pollutants with air masses. Air masses circulating over the Black Sea and beyond bring into the atmosphere significant amounts of various mineral dust, the suspension of which contains soil particles from other regions, industrial emissions, gases from mud volcanoes, etc.
The maximum concentration of silica acid in the entire period was observed on 14 September 2010. Analysis of the back trajectories according to the AERONET and HYSPLIT data showed the presence of transport from the Sahara Desert on this day [35] (Figure 2).
Operational monitoring has demonstrated that atmospheric precipitation is one of the main sources of inorganic nitrogen, phosphorus, and silicon on the surface of the Black Sea. It results in more intensive primary production in regions where precipitations were observed. An increase of chlorophyll-A concentration in the Black Sea surface layer after precipitation is noticeable in the region where dust air masses pass (Figure 3a,b). The rectangle shows the area of passage of dusty air masses with subsequent atmospheric precipitation, in which a change in the concentration of chlorophyll-A is observed.
The numerical change in the concentration of chlorophyll-A in the sea surface layer during the study period is shown in Figure 4. As we can see, the concentration of chlorophyll-A increased after precipitations by ~36%.
As seen in Figure 3 and Figure 4, after precipitation on September 14, the concentration of chlorophyll-A increased by 1.3 times. At the same time, the sea surface temperature in the study area showed no decrease (Figure 5a,b), i.e., the involvement of the lower, colder, and nutrient-rich sea water could not affect the chlorophyll-A concentration. These sea surface temperature maps are based on observations by the MODIS sensors on NASA’s Terra and Aqua satellites. The rectangle shows the area of passage of dust air masses with subsequent atmospheric precipitation, in which a change in the concentration of chlorophyll-A is observed.
The concentration of phosphates in atmospheric precipitation on 13 May 2016 was over 20 times higher than the annual value. The satellite image taken during this period showed the transfer of the air mass containing a large amount of dust aerosol [41]. An increase in the concentration of chlorophyll in several days after precipitations is seen in the distribution maps of chlorophyll-A (Figure 6), which was not accompanied by a lowering in water temperature (Figure 7). The rectangle shows the area of passage of dusty air masses with subsequent atmospheric precipitation, in which a change in the concentration of chlorophyll-A is observed.
The graph in Figure 8 also shows the chlorophyll-A concentration in the surface layer of the Black Sea before precipitation and a few days after. As we can see, the concentration of the chlorophyll-A increased by ~11%.
Within a few days, the concentration of chlorophyll-a decreases, reaching background values due to removing of nutrients from the euphotic zone of this region.
Because of its inner locations and surrounding by six countries, the Black Sea could be especially vulnerable to climate changes and anthropogenic influences. A characteristic feature of the Black Sea—existing strong stratification of the water column in the summer. Due to this stratification, the possibility of mixing between the bottom and surface layer decreases which leads to limited quantity of nutrients in the surface layer of the Sea. This restriction, in turn, results in decrease of the plankton community’s capability to grow. Atmospheric precipitation and river runoff are the dominant sources of “new” primary production in the Black Sea under conditions of stable stratification in the spring–autumn period [44,45].
In addition to direct change in the nutrients concentration in the sea surface layer after atmospheric precipitation, the Redfield ratio at this water area also changes. Considering that it is not possible to carry out a comparative analysis of the nutrients content in the sea surface layer before and immediately after precipitation over the Black Sea, we carried out a similar work for the surface layer of the Sevastopol Bay. The results of the studies have shown that after precipitation, the value of the concentrations of nutrients in the surface layer of the bay in many cases was much higher than the background concentration and comparable to their concentration in areas subject to stormwater drainage and domestic wastewater runoff. However, several days after precipitation, nitrogen concentration, phosphorus, and silicon decreased linearly (Figure 9).
Moreover, the content ammonium nitrogen reached the background level significantly faster than nitrates. This fact can be explained by the fact that that ammonium nitrogen is more available for consumption for some phytoplankton species.
Table 2 shows the Redfield ratio calculated from the data on the background nutrients concentration in different seasons in the Sevastopol Bay, and the maximum values of this ratio calculated after atmospheric precipitation, deposited after dust transport.
The influx of atmospheric precipitation containing significant amounts of nutrients into the bay can largely shift the Redfield ratio. This shift may reach three times compared with background value, especially during the stratification period. A shift in the ratio towards one or another nutrient, in turn, can cause blooming of some phytoplankton species and limit the development of others.
Some works have argued that changes in the molar ratio of nitrogen/phosphorus/silicon in river runoff and atmospheric precipitation affect the biological and chemical properties of the entire Black Sea [44,46,47]. In turn, a shift in the value of the ratio towards one or other nutrients can cause blooming of some phytoplankton species and limit the development of others. This can be especially significant for the open regions of the Black Sea, where the contribution of coastal sources of nutrient input to the surface layer is insignificant.

4. Discussion

The deserts of the Earth are huge sources of dust [48], the maximum influx of dust occurs in winter and spring, and its compositions (including nutrients) vary between seasons [49]. The presence and quantity of the main nutrients (inorganic nitrogen and phosphorus, as well as silicon) along with the light intensity determines the growth and development of various phytoplankton species in marine ecosystems. Many authors have studied the influence of dust aerosols on the characteristics of marine ecosystems. It is considered that in comparison with the input of nutrients from the bottom layers nutrients-enriched, as well as in a result of water mixing, the atmospheric source of these elements is not so significant [22]. At the same time, it is noted that the nutrient load added as a result of atmospheric deposition at a certain time can be very important to primary production [22,49,50,51]. However, most papers are dedicated to the influence of dust aerosols on the Mediterranean Sea. The influence of the nutrients transfer contained in the dust aerosol on the Black Sea surface layer remains insufficiently studied.
The aim of this work was to study the patterns and features of dust deposition of the Sahara and Syria with high nutrients concentrations in the Black Sea region, as well as its influence on the dynamics and distribution of the concentration of chlorophyll-A in the surface layer of the Black Sea. In our work, we showed the change in the chlorophyll-A in the surface layer of the Black Sea waters after precipitation containing high concentrations of inorganic nitrogen, phosphorus, and silicon. At the same time, we excluded the influence of upwelling on this change.
In total, for the period 2010–2019, it was collected and processed about 400 atmospheric precipitations samples. We also collected and analyzed samples of seawater after precipitations. In these samples, the concentration of inorganic nitrogen, phosphorus, and silicon has been measured. Our results demonstrate that in some cases dust transport can be one of the important source of nutrients (inorganic nitrogen, phosphorus, and silicon) for the surface layer of the Black Sea. Under certain conditions, influx of nutrients via atmospheric depositions can result in an increase of chlorophyll-A concentration in the surface layer of the Black Sea (Figure 3 and Figure 6). This increase is observed in a few days after precipitations and its value depends on the concentration of nutrients in the atmospheric depositions and underlying biogeochemical conditions in the water column [52]: concentration of chlorophyll-A in the surface layer before dust storm and atmospheric depositions, etc.
Our data are in agreement with some results obtained by other researchers for different areas (Mediterranean Sea, Arctic region, etc.). For example, results [53] demonstrated that a single deposition event is enough to induce changes in the microbial food web up to zooplankton. Refs. [22,52] showed that atmospheric phosphorus can contribute ~1% of primary production in the NW Mediterranean. However, occasional events may contribute about 30–50% of annual new production. Ref. [50] confirmed an increase of chlorophyll-A concentration in the Mediterranean Sea in April 2015 by 59% a week after precipitation. According to our data obtained during this research, concentration of chlorophyll-A in the surface layer of the Black Sea can increase up to 11–36% after atmospheric depositions (Figure 4 and Figure 8). In spring or in conditions of stratification, this could indicate that dust deposition would make the system more productive. In the next few days after precipitations or dust storm, the concentration of chlorophyll-a decreases, reaching background values.
Ref. [52] also considered the response of inorganic phosphorus concentration in the surface water layer on the atmospheric impact. It is shown that depending on productivity, different regions respond differently. In very unproductive regions such as the South Ionian basin, very low impacts of deposition on phosphates concentrations (5–12% enhancement) are observed. The fluxes of nutrients in these regions are probably consumed very fast and do not yield a high concentration enhancement. Some areas respond more strongly to P deposition—phosphates surface enhancement over 40% can be observed. Our results indicate that after atmospheric depositions, concentration of phosphates in the surface layer of the Sevastopol Bay can increase more than five times compared with background concentration. Increase of silicon concentration can reach 30%. Moreover, the influx of atmospheric precipitation containing significant amounts of nutrients into the bay can shift the Redfield ratio compared with background value up to three times.

5. Conclusions

The results of our study are as follows:
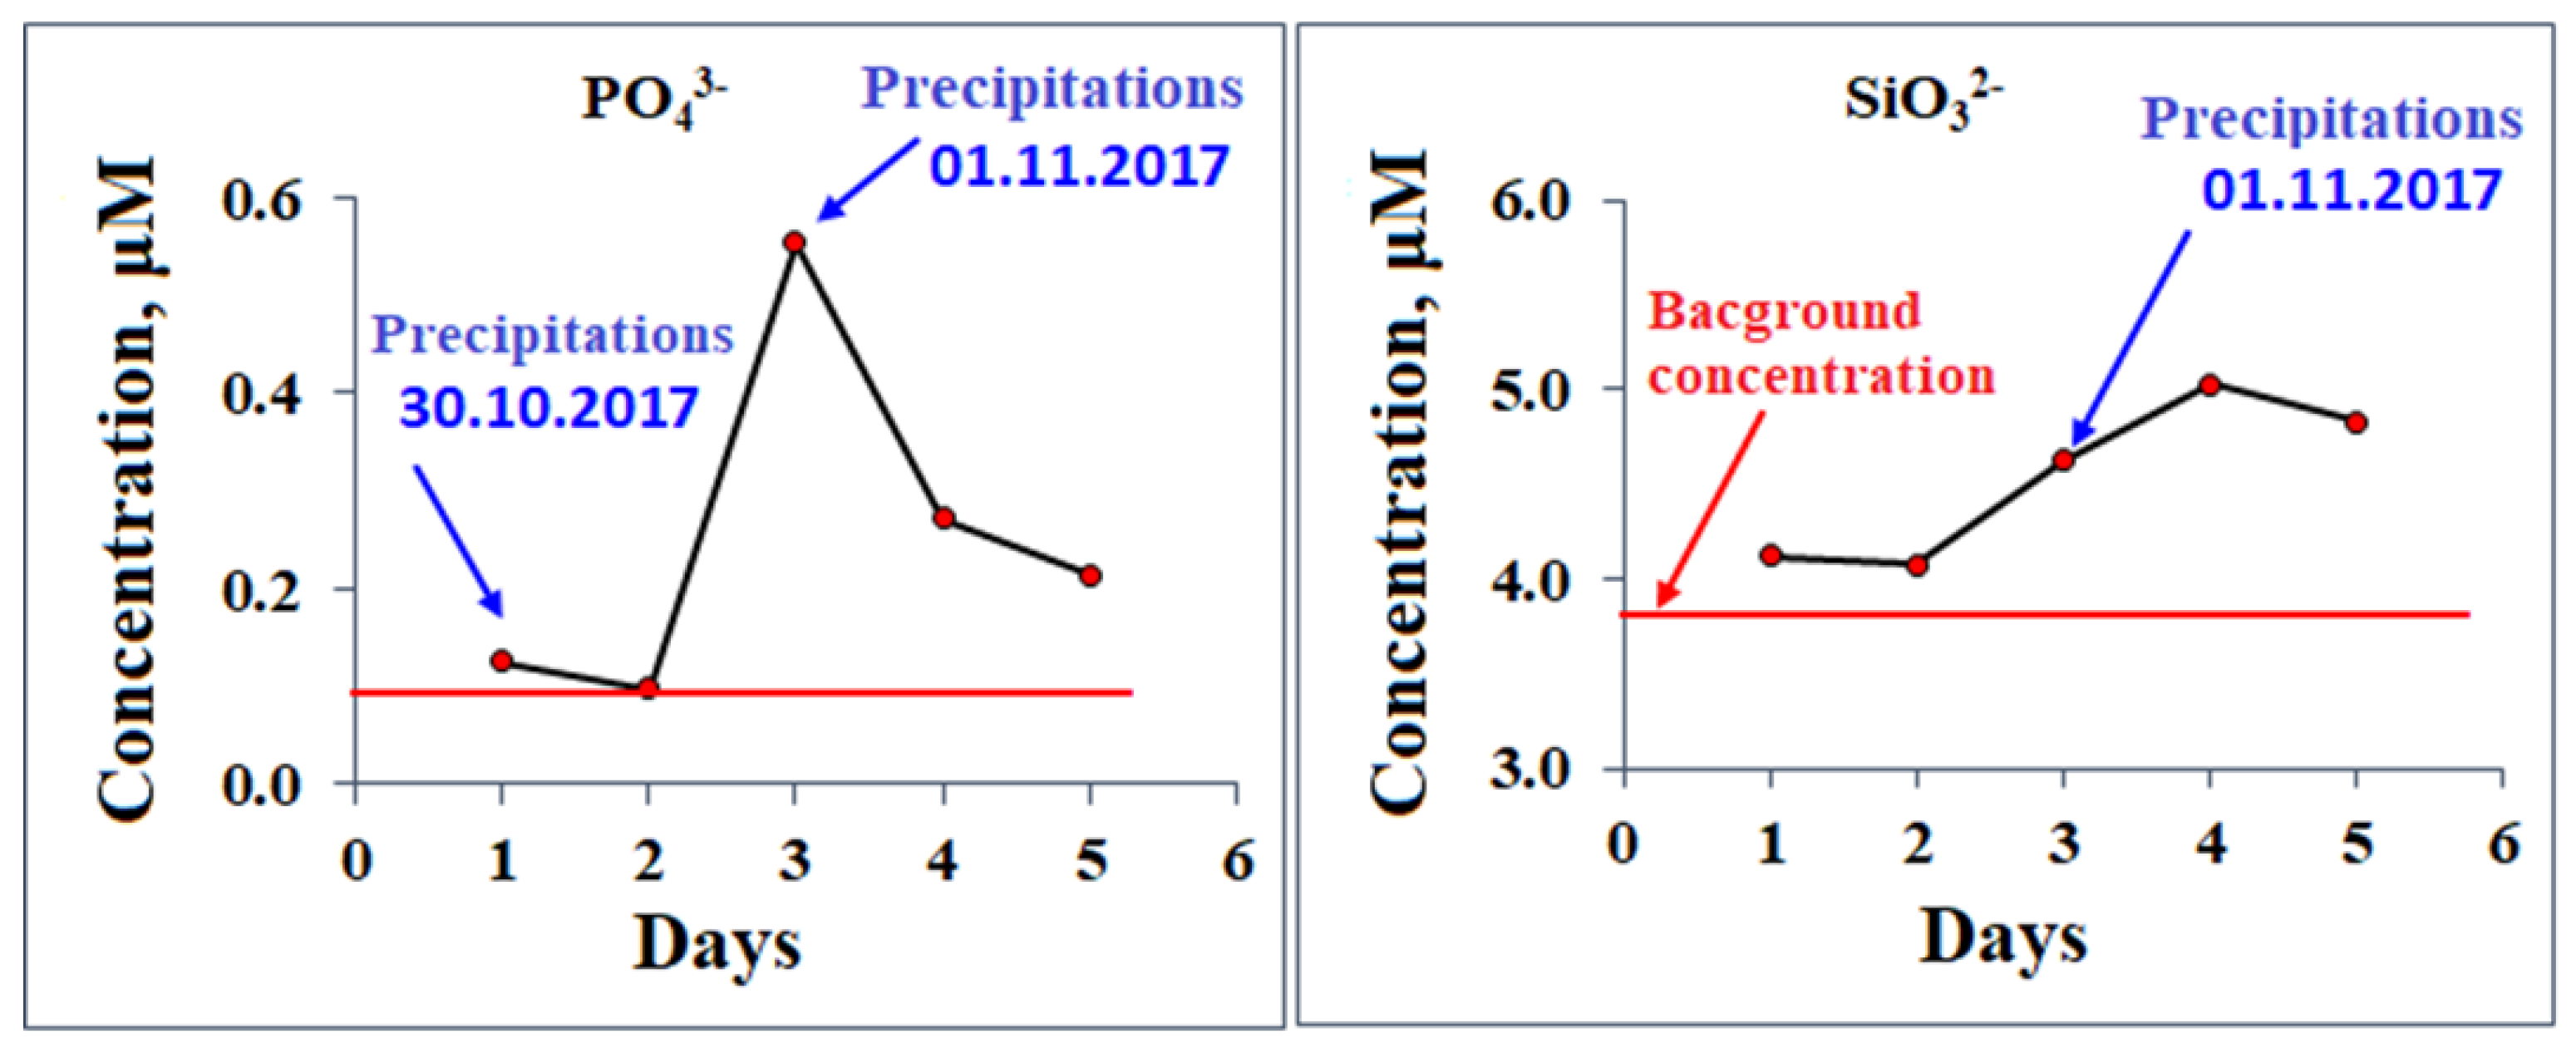
  • Dust transport can be one of the important sources of nutrients (inorganic nitrogen, phosphorus, and silicon) for the surface layer of the Black Sea. After atmospheric depositions concentration of phosphates in the surface layer of the Sevastopol Bay can increase more than five times compared with background concentration. Increase of silicon concentration can reach 30%.
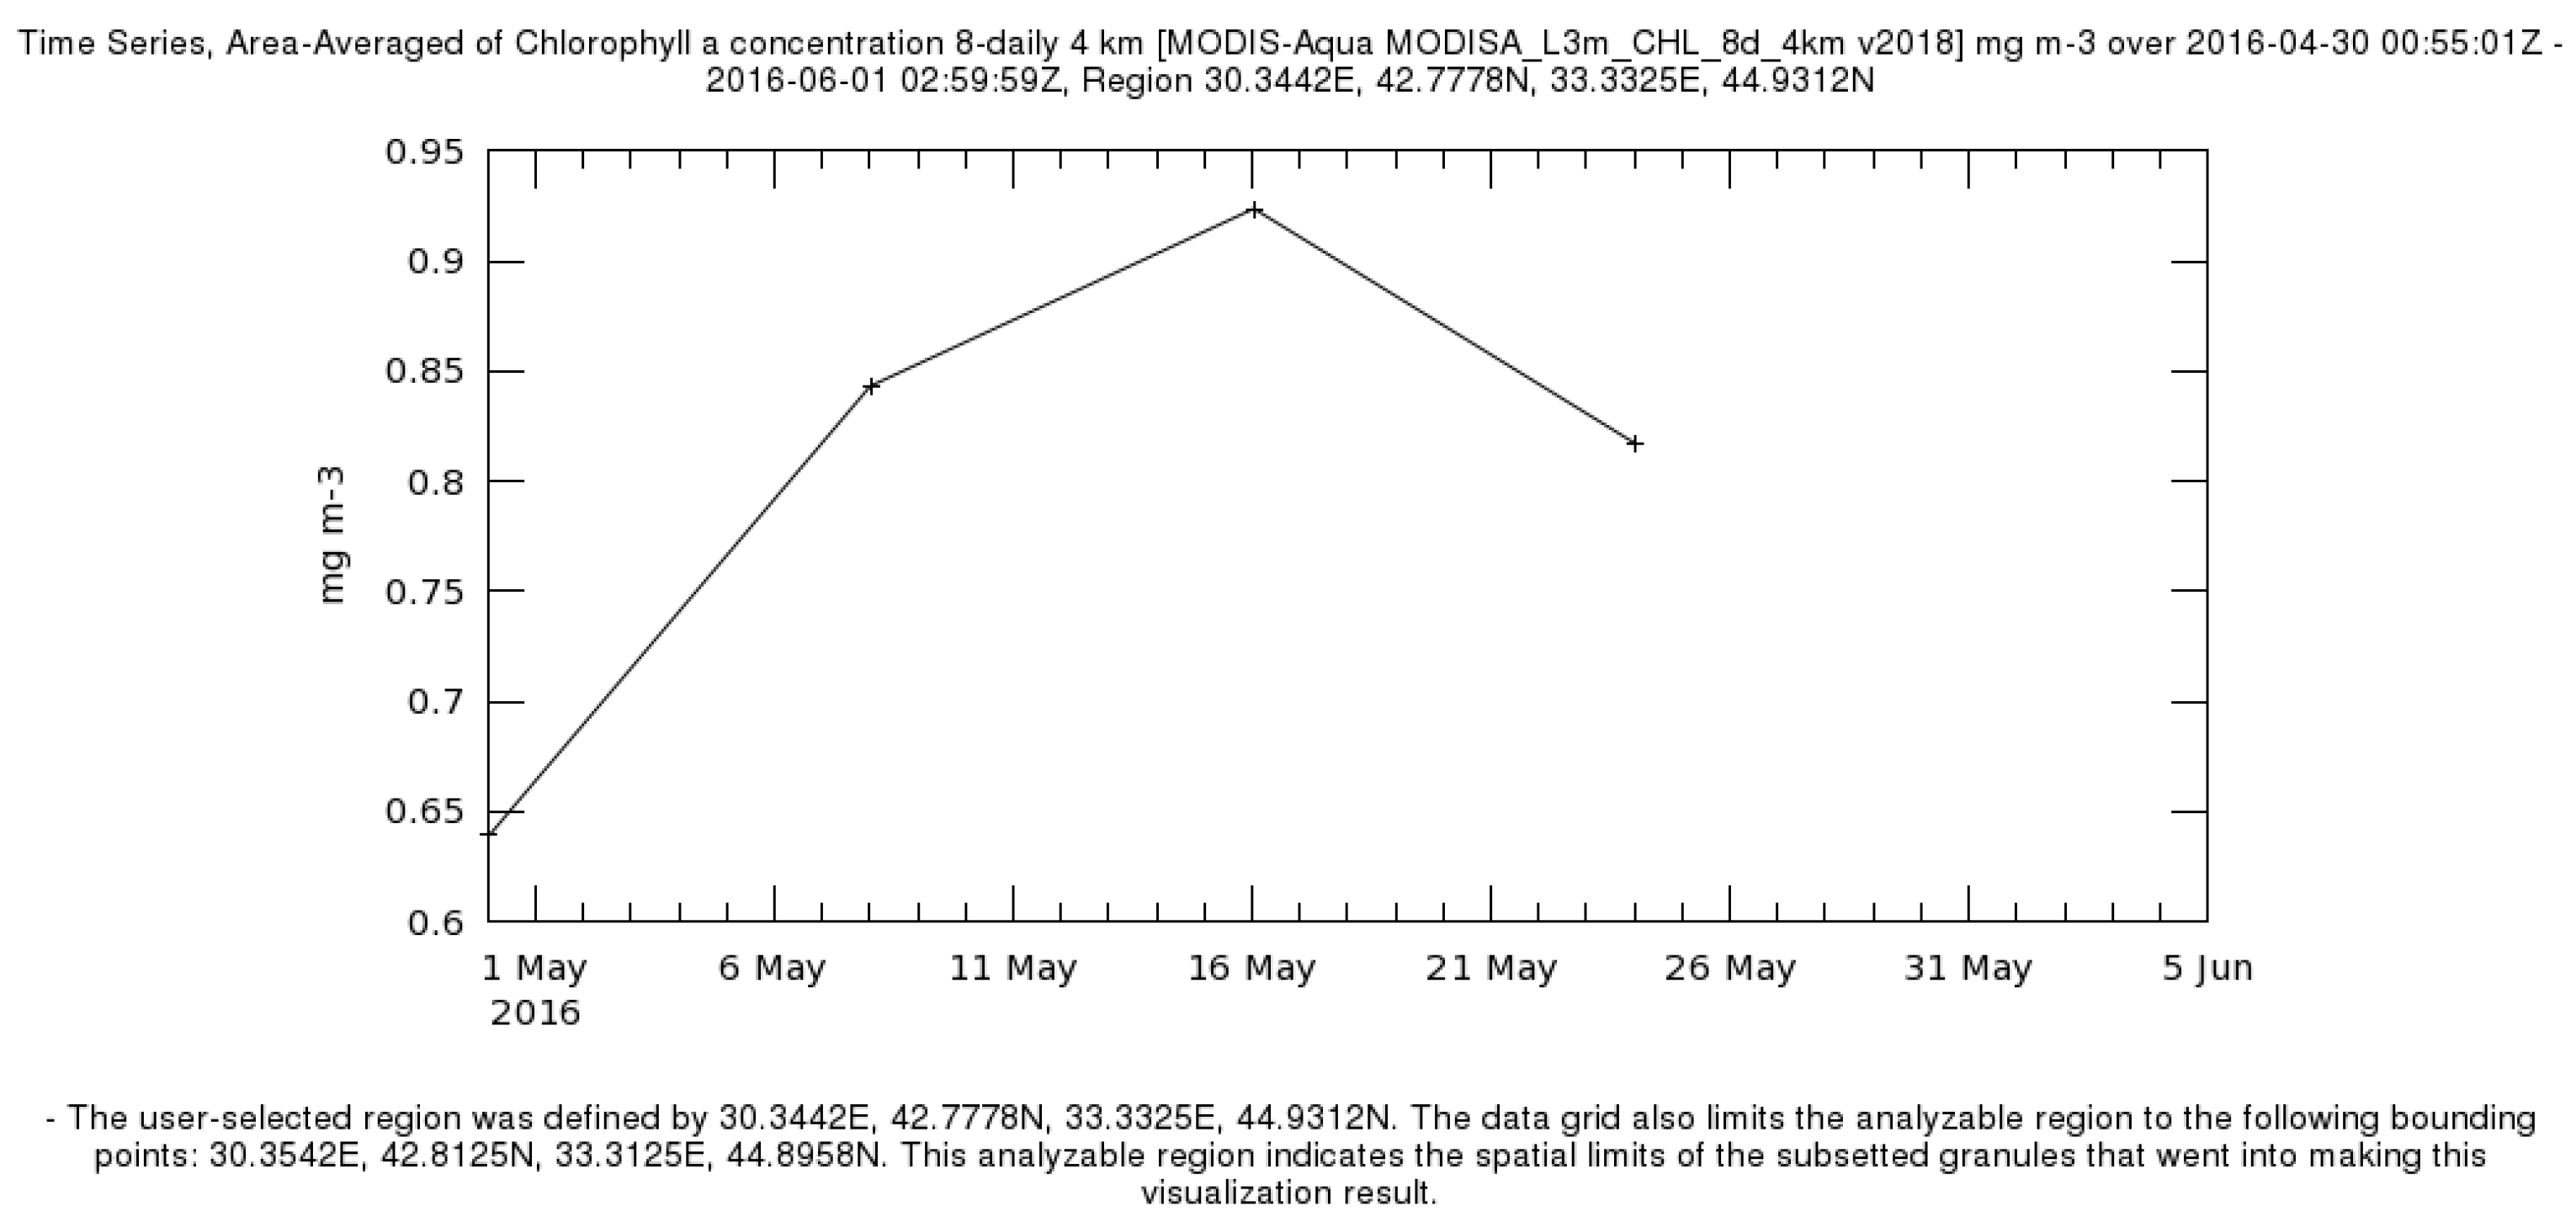
  • The influx of nutrients with the atmospheric depositions can result in an increase of chlorophyll-A concentration by 11–36%.
  • The influx of atmospheric precipitation containing significant amounts of nutrients into the bay can shift the Redfield ratio compared with the background value up to three times.
For the Black Sea, such research is very restricted. Thus, we can assume the data obtained during our work are the first evaluation characteristics for this region and these data can be used as basic information to study the role of global sources of nutrients deposition to the Black Sea.

Author Contributions

A.V.V.—scientific supervision of research; formulation of scientific hypotheses; chemical analysis of the atmospheric precipitations samples; interpretation of the results obtained, funding acquisition. D.V.K.—7-day back-trajectories analyses using the model of the international network AERONET and the HYSPLIT model. All authors have read and agreed to the published version of the manuscript

Funding

This work was carried out within the framework of the state assignments of Marine Hydrophysical Institute of RAS No. 0555-2021-0004 and Russian Foundation for Basic Research (RFBR) projects No. 19-05-00140 and No. 19-05-50023.

Institutional Review Board Statement

Not applicable.

Informed Consent Statement

Not applicable.

Data Availability Statement

All the data and additional information supporting the findings of this study are available from the corresponding authors upon reasonable request.

Acknowledgments

The authors thank Tom Kuscera, Brent Holben, Giuseppe Zibordi, and the Gene Feldman group from NASA for providing AOT data, calculating the BTA data, processing the measurements obtained at the Sevastopol AERONET station, and for the possibility of using qualitative data of photometric measurements. The authors also express appreciation to Sakerin S.M. and Kabanov D.M. for providing an SPM photometer and software to it.

Conflicts of Interest

The authors declare no conflict of interest.

References

  1. Sukhikh, L.; Dorofeyev, V. The Study of Sensitivity of the Black Sea Hydrophysical Fields Reanalysis Results to the Applied Atmospheric Forcing. Phys. Oceanogr. 2016. [Google Scholar] [CrossRef] [Green Version]
  2. Avila, A.; Peñuelas, J. Increasing frequency of Saharan rains over northeastern Spain and its ecological consequences. Sci. Total Environ. 1999, 228, 153–156. [Google Scholar] [CrossRef]
  3. Swap, R.; Garstang, M.; Greco, S.; Talbot, R.; Kållberg, P. Saharan dust in the Amazon Basin. Tellus B Chem. Phys. Meteorol. 1992, 44, 133–149. [Google Scholar] [CrossRef] [Green Version]
  4. Guo, C.; Xia, X.; Pitta, P.; Herut, B.; Rahav, E.; Berman-Frank, I.; Giannakourou, A.; Tsiola, A.; Tsagaraki, T.M.; Liu, H. Shifts in Microbial Community Structure and Activity in the Ultra-Oligotrophic Eastern Mediterranean Sea Driven by the Deposition of Saharan Dust and European Aerosols. Front. Mar. Sci. 2016, 3, 170. [Google Scholar] [CrossRef] [Green Version]
  5. Pitta, P.; Herut, B.; Tsagaraki, T. Impact of Aerosols (Saharan Dust and Mixed) on the East Mediterranean Oligotrophic Ecosystem, Results from Experimental Studies; Frontiers Media: Lausanne, Switzerland, 2017; p. 264. [Google Scholar]
  6. Ridame, C.; Guieu, C. Saharan input of phosphate to the oligotrophic water of the open western Mediterranean Sea. Limnol. Oceanogr. 2002, 47, 856–869. [Google Scholar] [CrossRef]
  7. Markaki, Z.; Oikonomou, K.; Kocak, M.; Kouvarakis, G.; Chaniotaki, A.; Kubilay, N.; Mihalopoulos, N. Atmospheric deposition of inorganic phosphorus in the Levantine Basin, eastern Mediterranean: Spatial and temporal variability and its role in seawater productivity. Limnol. Oceanogr. 2003, 48, 1557–1568. [Google Scholar] [CrossRef] [Green Version]
  8. Guieu, C.; Loÿe-Pilot, M.-D.; Benyahya, L.; Dufour, A. Spatial variability of atmospheric fluxes of metals (Al, Fe, Cd, Zn and Pb) and phosphorus over the whole Mediterranean from a one-year monitoring experiment: Biogeochemical implications. Mar. Chem. 2010, 120, 164–178. [Google Scholar] [CrossRef]
  9. Herut, B.; Krom, M.D.; Pan, G.; Mortimer, R. Atmospheric input of nitrogen and phosphorus to the Southeast Mediterranean: Sources, fluxes, and possible impact. Limnol. Oceanogr. 1999, 44, 1683–1692. [Google Scholar] [CrossRef] [Green Version]
  10. Sandroni, V.; Raimbault, P.; Migon, C.; Garcia, N.; Gouze, E. Dry atmospheric deposition and diazotrophy as sources of new nitrogen to northwestern Mediterranean oligotrophic surface waters. Deep. Sea Res. 2007, 54, 1859–1870. [Google Scholar] [CrossRef]
  11. Markaki, Z.; Loÿe-Pilot, M.; Violaki, K.; Benyahya, L.; Mihalopoulos, N. Variability of atmospheric deposition of dissolved nitrogen and phosphorus in the Mediterranean and possible link to the anomalous seawater N/P ratio. Mar. Chem. 2010, 120, 187–194. [Google Scholar] [CrossRef]
  12. Guieu, C.; Bonnet, S.; Wagener, T.; Loÿe-Pilot, M.-D. Biomass burning as a source of dissolved iron to the open ocean? Geophys. Res. Lett. 2005, 32. [Google Scholar] [CrossRef]
  13. Theodosi, C.; Markaki, Z.; Mihalopoulos, N. Iron Speciation, solubility and temporal variability in wet and dry deposition in the Eastern Mediterranean. Mar. Chem. 2010, 120, 100–107. [Google Scholar] [CrossRef]
  14. Moreno, T.; Querol, X.; Alastuey, A.; Viana, M.; Gibbons, W. Exotic dust incursions into central Spain: Implications for legislative controls on atmospheric particulates. Atmos. Environ. 2005, 39, 6109–6120. [Google Scholar] [CrossRef]
  15. Richon, C.; Dutay, J.-C.; Dulac, F.; Wang, R.; Balkanski, Y.; Nabat, P.; Aumont, O.; Desboeufs, K.; Laurent, B.; Guieu, C.; et al. Modeling the impacts of atmospheric deposition of nitrogen and desert dust-derived phosphorus on nutrients and biological budgets of the Mediterranean Sea. Prog. Oceanogr. 2018, 163, 21–39. [Google Scholar] [CrossRef]
  16. Humborg, C.; Conley, D.J.; Rahm, L.; Wulff, F.; Cociasu, A.; Ittekkot, V. Silicon retention in river basins: Far-reaching effects on biogeochemistry and aquatic food webs in coastal marine environments. AMBIO A J. Hum. Environ. 2000, 29, 45–50. [Google Scholar] [CrossRef]
  17. Ragueneau, O.; Chauvaud, L.; Moriceau, B.; Leynaert, A.; Thouzeau, G.; Donval, A.; Le Loc’H, F.; Jean, F. Biodeposition by an Invasive Suspension Feeder Impacts the Biogeochemical Cycle of Si in a Coastal Ecosystem (Bay of Brest, France). Biogeochemistry 2005, 75, 19–41. [Google Scholar] [CrossRef]
  18. Tŕeguer, P.J.; De La Rocha, C.L. The World Ocean silica sycle. Ann. Rev. Mar. Sci. 2013, 5, 477–501. [Google Scholar] [CrossRef]
  19. Rabalais, N.N.; Turner, R.E.; Justic, D.; Dortch, Q.; Wiseman, W.J.J.; Sen Gupta, B.K. Nutrient changes in the Mississippi River and system responses on the adjacent continental shelf. Estuaries 1996, 19, 386–407. [Google Scholar] [CrossRef]
  20. Yunev, O.A.; Velikova, V.; Carstensen, J. Effects of changing nutrient inputs on the ratio of small pelagic fish stock and phytoplankton biomass in the Black Sea. Estuar. Coast. Shelf Sci. 2017, 197, 173–184. [Google Scholar] [CrossRef]
  21. Tŕeguer, P.; Nelson, D.M.; Van Bennekom, A.J.; DeMaster, D.J.; Leynaert, A.; Queguiner, B. The balance of silica in the world ocean: A re-estimate. Science 1995, 268, 375–379. [Google Scholar] [CrossRef]
  22. Gallisai, R.; Peters, F.; Basart, S.; Baldasano, J.M. Mediterranean basin-wide correlations between Saharan dust deposition and ocean chlorophyll concentration. Biogeosciences 2012, 9, 8611–8639. [Google Scholar] [CrossRef] [Green Version]
  23. Ternon, E.; Guieu, C.; Loÿe-Pilot, M.-D.; Leblond, N.; Bosc, E.; Gasser, B.; Miquel, J.-C.; Martín, J. The impact of Saharan dust on the particulate export in the water column of the North Western Mediterranean Sea. Biogeosciences 2010, 7, 809–826. [Google Scholar] [CrossRef] [Green Version]
  24. Gallisai, R. Saharan Dust Deposition Effects on Production in the Mediterranean Sea. Ph.D. Thesis, Universitat Politècnica de Catalunya, Departament d’Enginyeria Civil i Ambiental, Barcelona, Spain, 2016. Available online: http://hdl.handle.net/2117/105829 (accessed on 14 May 2021).
  25. Pautova, L.A.; Mikaelyan, A.S.; Silkin, V.A. Structure of plankton phytocoenoses in the shelf waters of the northeastern Black Sea during The Emiliania Huxley bloom in 2002–2005. Oceanology 2007, 3, C377–C385. [Google Scholar] [CrossRef]
  26. Milliman, J.D. Production and accumulation of calcium carbonate in the ocean: Budget of a non-steady state. Glob. Biogeochem. Cycles 1993, 7, 927–957. [Google Scholar] [CrossRef]
  27. Yli-Tuomi, T.; Venditte, L.; Hopke, P.K.; Basunia, M.; Landsberger, S.; Viisanen, Y.; Paatero, J. Composition of the Finnish Arctic aerosol: Collection and analysis of historic filter samples. Atmos. Environ. 2003, 37, 2355–2364. [Google Scholar] [CrossRef]
  28. Vinogradova, A.A. Anthropogenic pollutants in the Russian Arctic atmosphere: Sources and sinks in spring and summer. Atmos. Environ. 2000, 34, 5151–5160. [Google Scholar] [CrossRef]
  29. Popovicheva, O.B.; Makshtas, A.P.; Movchan, V.V.; Persiantseva, N.M.; Timofeev, M.A.; Sitnikov, N.M. Aerosol component of the atmospheric surface layer according observations of the expedition “North-2015”. Arct. Antarct. Res. 2017, 4, 57–65. [Google Scholar] [CrossRef] [Green Version]
  30. Kalinskaya, D.V.; Varenik, A.V. The research of the dust transport impact on the biogeochemical characteristics of the Black Sea surface layer. In Proceedings of the 25th International Symposium on Atmospheric and Ocean Optics: Atmospheric Physics, Novosibirsk, Russia, 30 June–5 July 2019; Volume 11208, p. 1120845. [Google Scholar]
  31. Solorzano, L. Determination of ammonia in natural waters by phenolhypochlorite method. Limnol. Oceanogr. 1969, 14, 799–801. [Google Scholar]
  32. Sapozhnikov, V.V. Guidelines for the Chemical Analysis of Sea and Fresh Waters in the Environmental Monitoring of Fishery Water Bodies and Promising Areas for Fishing in the World Ocean; VNIRO: Moscow, Russia, 2003; p. 202. (In Russian) [Google Scholar]
  33. Oradovsky, S.G. Guidance on the Methods of Chemical Analysis of Seawater; Hydrometeoizdat: St. Petersburg, Russia, 1993; p. 264. (In Russian) [Google Scholar]
  34. Bordovskiy, O.K.; Chernyakova, A.M. (Eds.) Modern Methods of the Ocean Hydrochemical Investigations; P.P. Shirshov Institute of Oceanology: Moscow, Russia, 1992; p. 200. (In Russian) [Google Scholar]
  35. Kalinskaya, D.; Varenik, A.; Papkova, A. Phosphorus and silicon as markers of dust aerosol transport over the Black Sea region. Mod. Probl. Remote Sens. Earth Space 2018, 15, 217–225. [Google Scholar]
  36. Kalinskaya, D.; Kudinov, O. Methodology of ground aerosol sources determination based on AERONET and HYSPLIT models data results. In Proceeding of the 23rd International Symposium on Atmospheric and Ocean Optics: Atmospheric Physics, Irkutsk, Russian, 3–7 July 2017. [Google Scholar]
  37. Penenko, V.V.; Korotkov, M.G. Application of numerical models to predicting emergency and environmentally unfavorable situations in the atmosphere. Opt. Atmos. 1998, 11, 567–572. (In Russian) [Google Scholar]
  38. Poddubny, V.A.; Nagovitsyna, E.S. Methods of back-trajectories for the interpretation of monitoring data. Geoinformation technologies and space monitoring: Materials. In Proceedings of the III Young Scientists Conference, Rostov-on-Don, Russia, 6–11 September 2010; pp. 96–100. (In Russian). [Google Scholar]
  39. Sviridenkov, M.A. Determination of the characteristics of atmospheric aerosol from spectral measurements of transparency and small-angle scattering. Opt. Atmos. 2001, 14, 1115–1118. (In Russian) [Google Scholar]
  40. Veretennikov, V.V.; Menshchikova, S.S. Features of reconstructing aerosol microstructural parameters from aerosol optical thickness measurements. Part I. Technique for solving the inverse problem. Opt. Atmos. Ocean 2013, 26, 306–312. (In Russian) [Google Scholar]
  41. Baumann, K.; Stohl, A. Validation of a long-range trajectory model using gas balloon tracks from the Gordon Bennett Cup 95. J. Appl. Meteorol. 1997, 36, 711–720. [Google Scholar] [CrossRef]
  42. Brzezinski, M.A. The Si:C:N ratio of marine diatoms: Interspecific variability and the effect of some environmental variables. J. Phycol. 1985, 21, 347–357. [Google Scholar] [CrossRef]
  43. Cochran, J.K.; Bokuniewicz, H.J.; Yager, P.L. Encyclopedia of Ocean Sciences, 3rd ed.; Elsevier Science & Technology: San Diego, CA, USA, 2019. [Google Scholar]
  44. Cociasu, A.; Dorogan, L.; Humborg, C.; Popa, L. Long-term ecological changes in Romanian coastal Waters of the Black Sea. Mar. Pollut. Bull. 1996, 32, 32–38. [Google Scholar] [CrossRef]
  45. Medinets, S.; Medinets, V. Investigations of atmospheric wet and dry nutrient deposition to marine surface in western part of the Black Sea. Turk. J. Fish. Aquat. Sci. 2012, 12, 497–505. [Google Scholar] [CrossRef]
  46. Yunev, O.A.; Vedernikov, V.I.; Basturk, O.; Yilmaz, A.; Kideyes, A.E.; Moncheva, S.; Konovalov, S.K. Long-term variations of surface chlorophyll a and primary production in the open Black Sea. Mar. Ecol. Prog. Ser. 2002, 230, 11–28. [Google Scholar] [CrossRef]
  47. Kideys, A.E. Ecology. Fall and rise of the Black Sea ecosystem. Science 2002, 30, 1482–1484. [Google Scholar] [CrossRef]
  48. Prospero, J.M. Saharan dust transport over the North Atlantic Ocean and Mediterranean: An overview. In The Impact of Desert Dust Across the Mediterranean; Guerzoni, S., Chester, R., Eds.; Kluwer Academic Publishers: Amsterdam, The Netherlands, 1996; pp. 133–151. [Google Scholar]
  49. Pease, P.P.; Tchakerian, V.P.; Tindale, N.W. Aerosols over the Arabian Sea: Geochemistry and source areas for aeolian desert dust. J. Arid Environ. 1998, 39, 477–496. [Google Scholar] [CrossRef]
  50. Kotta, D.; Kitsiou, D. Exploring Possible Influence of Dust Episodes on Surface Marine Chlorophyll Concentrations. J. Mar. Sci. Eng. 2019, 7, 50. [Google Scholar] [CrossRef] [Green Version]
  51. Schulz, M.; Prospero, J.M.; Baker, A.R.; Dentener, F.; Ickes, L.; Liss, P.S.; Mahowald, N.M.; Nickovic, S.; García-Pando, C.P.; Rodríguez, S.; et al. Atmospheric Transport and Deposition of Mineral Dust to the Ocean: Implications for Research Needs. Environ. Sci. Technol. 2012, 46, 10390–10404. [Google Scholar] [CrossRef] [PubMed]
  52. Richon, C.; Dutay, J.-C.; Dulac, F.; Wang, R.; Balkanski, Y. Modeling the biogeochemical impact of atmospheric phosphate deposition from desert dust and combustion sources to the Mediterranean Sea. Biogeosciences 2018, 15, 2499–2524. [Google Scholar] [CrossRef] [Green Version]
  53. Tsagaraki, T.M.; Herut, B.; Rahav, E.; Frank, I.R.B.; Tsiola, A.; Tsapakis, M.; Giannakourou, A.; Gogou, A.; Panagiotopoulos, C.; Violaki, K.; et al. Atmospheric Deposition Effects on Plankton Communities in the Eastern Mediterranean: A Mesocosm Experimental Approach. Front. Mar. Sci. 2017, 4, 210. [Google Scholar] [CrossRef] [Green Version]
Figure 1. Sampling Site. Sevastopol, Crimea, Russia.
Applsci 11 04692 g001
Figure 2. Seven-day reverse trajectories of the air mass transfer on 14 September 2010 according to the AERONET model.
Applsci 11 04692 g002
Figure 3. Concentration of chlorophyll-A in the surface layer of the Black Sea before (a) and after (b) precipitation 14 September 2010; ((a) time period 6 September 2010–13 September 2010; (b) time period 14 September 2010–21 September 2010).
Applsci 11 04692 g003
Figure 4. Graph of changes in the chlorophyll-A concentration in the Black Sea surface layer from 29 August to 8 October 2010.
Applsci 11 04692 g004
Figure 5. Change in the Black Sea surface temperature before (a) and after precipitation (b) 14 September 2010; ((a) time period 6 September 2010–13 September 2010; (b) time period 14 September 2010–21 September 2010).
Applsci 11 04692 g005
Figure 6. Concentration of chlorophyll-A in the surface layer of the Black Sea before (a) and after (b) precipitation 13 May 2016; ((a) time period 8 May 2016–16 May 2016; (b) time period 16 May 2016–24 May 2016).
Applsci 11 04692 g006
Figure 7. Black Sea surface temperature before (a) and after (b) precipitation 13 May 2016; (a) time period 8 May 2016–16 May 2016; (b) time period 16 May 2016–24 May 2016).
Applsci 11 04692 g007aApplsci 11 04692 g007b
Figure 8. Graph of changes in the chlorophyll-A concentration in the Black Sea surface layer before and after precipitation 13 May 2016.
Applsci 11 04692 g008
Figure 9. Graph of changes in the silicon and inorganic phosphorus concentration in the surface layer of the Sevastopol Bay after atmospheric precipitation.
Applsci 11 04692 g009
Table 1. Some statistical characteristics of nutrients’ concentrations.
NitrogenPhosphorusSilicon
Wet-Only SamplerOpen SamplerWet-Only SamplerOpen SamplerWet-Only SamplerOpen Sampler
Amount of data391361385354387357
Max, μM464.8799.618.237.134.536.8
Min, μM19.517.00.00.00.00.0
VWM, μM75.690.50.41.30.92.0
St. deviation, μM68.497.21.73.53.15.1
Table 2. Redfield ratio in the surface layer of the Sevastopol Bay in 2019.
SeasonN:PSi:PN:PSi:P
Backgroundafter Deposition
Spring1296232690
Summer5938134119
Autumn784824861
Winter1885121764
Publisher’s Note: MDPI stays neutral with regard to jurisdictional claims in published maps and institutional affiliations.

