Article

Phase Change Material Integration in Building Envelopes in Different Building Types and Climates: Modeling the Benefits of Active and Passive Strategies

by
Francesco Carlucci
1,*,
Alessandro Cannavale
2,3,
Angela Alessia Triggiano
1,
Amalia Squicciarini
1 and
Francesco Fiorito
1
1
Department of Civil, Environmental, Land, Building Engineering and Chemistry, Polytechnic University of Bari, 70125 Bari, Italy
2
Department of Sciences in Civil Engineering and Architecture, Polytechnic University of Bari, 70125 Bari, Italy
3
National Research Council, Institute of Nanotechnology (CNR-NANOTEC), Via Monteroni, 73100 Lecce, Italy
*
Author to whom correspondence should be addressed.
Appl. Sci. 2021, 11(10), 4680; https://doi.org/10.3390/app11104680
Submission received: 8 April 2021 / Revised: 14 May 2021 / Accepted: 17 May 2021 / Published: 20 May 2021

Abstract

:

Featured Application

Reduction of energy consumption in residential and office buildings through the improvement of latent heat storage in active and passive strategies.

Abstract

Among the adaptive solutions, phase change material (PCM) technology is one of the most developed, thanks to its capability to mitigate the effects of air temperature fluctuations using thermal energy storage (TES). PCMs belong to the category of passive systems that operate on heat modulation, thanks to latent heat storage (LHS) that can lead to a reduction of heating ventilation air conditioning (HVAC) consumption in traditional buildings and to an improvement of indoor thermal comfort in buildings devoid of HVAC systems. The aim of this work is to numerically analyze and compare the benefits of the implementation of PCMs on the building envelope in both active and passive strategies. To generalize the results, two different EnergyPlus calibrated reference models—the small office and the midrise apartment—were considered, and 25 different European cities in different climatic zones were selected. For these analyses, a PCM plasterboard with a 23 °C melting point was considered in four different thicknesses—12.5, 25, 37.5, and 50 mm. The results obtained highlighted a strong logarithmic correlation between PCM thickness and energy reduction in all the climatic zones, with higher benefits in office buildings and in warmer climates for both strategies.

Graphical Abstract

1. Introduction

Thermal comfort and reduction of energy consumption are consolidated topics in scientific literature. Currently, an increasing interest in these fields is related to the benefits of adaptive technologies. These technologies, when applied to building envelopes, allow buildings to adjust their characteristics, in a reversible way, in response to external stimuli. As a result, an adaptation of their behavior to climate fluctuations is achieved, and, consequently, users’ comfort requirements can be more efficiently met [1,2]. Currently, the most promising results of adaptive envelopes [3] are related to wall-integrated PCMs [4,5], switchable glazing [6,7,8,9], adaptive solar shadings [10,11,12], dynamic insulation [13,14], and multifunctional facades [15,16].
Among this wide range of technologies, PCMs have constantly grown their importance in recent years, thanks to broad experimentation and diffusion in different scientific fields [17,18]. These include mainly the aerospace industry [19], the design of low-energy buildings [20], the preservation of products [21], the electronic industry [22], and waste heat recovery systems [5]. The spread of PCMs in all these fields is related to the advantages of latent heat storage (LHS), which allows the storage and release of naturally available heat in low-volume elements, increasing, therefore, the energy storage density of the material [23].
In the building design domain, the importance of PCMs is related mainly to two different topics usually investigated in scientific literature: the reduction of HVAC energy consumption (i.e., active strategies) and the reduction of local and global thermal discomfort (i.e., passive strategies). Many studies have highlighted that PCMs can reduce the energy demand of HVAC systems by up to 30% if applied as a retrofit solution in residential buildings located in cold climates [24]. Moreover, thanks to the stabilization of the indoor radiant temperature, a significant reduction of thermal discomfort can be obtained [25]. Starting from these two important results, the aim of this paper is to merge and generalize these studies by considering: (i) a broader range of climates, (ii) both passive and active strategies, (iii) different building types, and (iv) different thicknesses of PCMs. Therefore, the benefits of PCM implementation are assessed through numerical analyses.
To design and model a PCM-integrated building element correctly and maximize its benefits, it is fundamental to understand the functioning of this technology and the different products available. The functioning is strictly related to the different ways in which materials can store or release heat: sensible heat storage (SHS), latent heat storage (LHS), and thermochemical heat storage. While SHS and LHS are applicable to buildings, thermochemical heat storage technologies are currently not applied in the civil field [23]. Regarding SHS, the heat absorbed/released is related to the increase/decrease of temperature in relation to the mass of the body (m), the specific heat (c), and the variation of temperature (dT), as described in Equation (1).
Q S = T 1 T 2 m   c   d T
During LHS, the heat absorbed or released leads to a change of phase—for example, a melting from solid to liquid—without changing the temperature of the body. In this case, the heat stored depends on the mass, the fraction melted (fm), and the variation of enthalpy of fusion per unit mass (Δhm) (Equation (2)).
Q L = m f m Δ h m
Therefore, generalizing a phenomenon with SHS and LHS for a gypsum-PCM board, the heat exchanged corresponds to the total enthalpy variation ΔHtot that depends on the enthalpy variation of each material contained in the board, according to Equations (3)–(5) [26]:
Δ H t o t = m · [ ( 1 f ) · Δ h g y p s u m + f · Δ h P C M ]  
where, considering the complete melting of the PCM (fm = 1), the partial enthalpies are:
Δ h g y p s u m = ( 1 f ) T 1 T 2 m c S   d T
Δ h P C M = f ( T 1 T m c S   d T + Δ h m + T m T 2 c L   d T )
with f being the mass fraction of the PCMs in gypsum, cS and cL representing, respectively, the specific heat of the solid state and the liquid state, and Tm the melting temperature of the PCMs.
For this reason, in building applications, a PCM with a melting range within the thermal comfort range (20 °C–30 °C) can take advantage of LHS [27]. This is due to the storage of a good amount of heat in low-volume elements without increasing the surface temperature and therefore, without affecting thermal comfort. While, theoretically, PCMs work on four different possible changes of phase for building applications, namely, solid–solid, solid–liquid, gas–liquid, gas–solid [28], solid–liquid PCMs are usually considered.
PCMs can be classified into three main categories: organic, inorganic, and eutectic. Organic PCMs are composed of paraffins, fatty acids, fatty-acid esters, and sugar alcohols and, in general, can be classified as paraffin or non-paraffin. One of the main advantages of organic PCMs is that repeated melting–freezing does not lead to phase segregation; moreover, they are slightly affected by supercooling. Nevertheless, considering that paraffinic PCMs are derived from oil refining, organic PCMs have low ignition resistance, and, for this reason, envelope applications can be problematic. Organic PCMs can have a broad range of possible melting temperatures (−57 °C; +187 °C) with melting latent heat ranging from 85 to 300 J/g [29,30,31]; therefore, they should be accurately chosen to optimize their functioning. Inorganic PCMs are classified as salt-hydrates or metallic, and, despite having an enthalpy per mass similar to organic PCMs, they can reach higher melting latent heat per unit volume thanks to their higher density. Moreover, they have higher conductivity, can reach higher melting points, and are less expensive and less flammable than organic PCMs. However, inorganic PCMs present some limitations, such as supercooling, phase segregation, and corrosion. Lastly, eutectic PCMs are composed of at least two PCMs with the same melting point and can be classified as organic–organic, inorganic–inorganic, and organic–inorganic, depending on the types of PCMs used.
Often PCMs are encapsulated, primarily to hold both solid and liquid phases and to protect the PCMs from harmful interactions with the environment and other building materials. Encapsulation can also reduce phase segregation and corrosion, provide easier handling, and increase the heat transfer area [32,33]. Encapsulations can be classified, depending on capsule size, into macroencapsulation (d > 1 mm), microencapsulation (1 μm < d < 1 mm), or nanoencapsulation (d < 1 μm). Moreover, they can be made of different materials, e.g., aluminum, plastic, polyolefin, rubber, polymers, in different containers, such as balls, tubes, plates, and boxes [33].
Many studies have been performed to deepen the possible applications of PCMs to buildings, mainly classified into active storage systems and passive storage systems.
Active systems are characterized by heat exchangers and forced convection and can be, in turn, classified into direct and indirect systems. In direct systems, the heat transfer fluid is also the storage element of the system, while in indirect systems, the fluid serves as the transfer medium and another material is used as the storage element [34]. Active systems have been studied [35] and applied to suspended ceilings [36,37], ventilation systems [38,39], external double-skin façades [40], solar collectors [41,42], heat storage water tanks [43,44], integrated photovoltaics [45,46], and building cores enhanced with PCMs activated through the use of ducts or pipes [47].
When considering passive systems, there is no forced convection, and, in this case, these systems can be classified according to the way the PCMs are embedded in the building element: inside the material, as a new layer, and in windows or as sun protection [48]. Considering the PCMs embedded inside the material, encapsulated PCMs can be easily added to other construction materials such as concrete [49], plaster [50], cellulose, or glass fiber [51]. Another diffuse solution to applying PCMs in buildings is to add a new layer to increase the thermal inertia of lightweight constructions. The most common application of PCMs as a new layer is the PCM-enhanced gypsum plasterboard; many products, such as the Alba Balance (Rigips-Saint Gobain), are already commercially available. Other applications of PCMs as new layers are PCM sandwich panels [52] and macroencapsulated PCMs in plates or bags, such as the Delta-Cool24 (Dorken) or the Energain (Dupont). Lastly, PCMs can be used for both sun protection (for example, in internal blinds [53]) and inside windows (for example, with an extra air gap, behind the inner glass [54]).
Considering all these available PCMs, particular attention should be paid to their melting point because, due to the broad variability of this parameter, each application has its own more suitable range. Different studies concerning building energy performance [28,55,56,57] have identified that the most suitable melting points for cooling are up to 21 °C, while for heating, they are 22 °C or, in general, 2 °C higher than the heating setpoint temperature. Moreover, suitable melting point ranges for thermal comfort are between 22 and 28 °C; for hot water applications, they are between 29 and 60 °C. Finally, higher melting points—between 61 and 120 °C—are suitable for waste heat recovery applications. For the current study, a PCM layer was considered the inner layer of external walls, roofs, and floors, implementing a paraffinic microencapsulated organic PCM (Micronal) embedded in gypsum plasterboard with a melting point of 23 °C, the characteristics of which are described in the following sections. Considering that the models were run for active and passive strategies and for heating and cooling systems, the choice of this transition temperature allows us, as described before, to take advantage of heating, cooling, and thermal comfort applications.

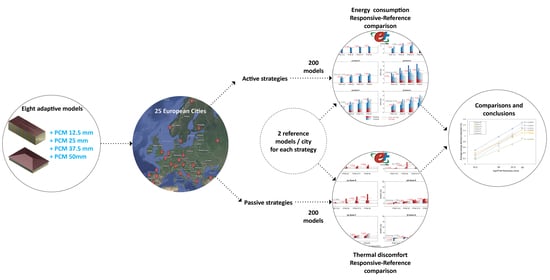
2. Materials and Methods

Energy and comfort analyses were performed using EnergyPlus v.9.3. The main advantage of EnergyPlus [58] is that it can guarantee multidomain integration and physical interaction accounting for thermal, visual, mass-flow, and building service interactions [3,59]. A good starting point for energy-efficiency-oriented research in EnergyPlus [60] is offered by the U.S. Department of Energy (DOE), which developed 16 reference building models in different climatic zones. These models have been calibrated using several references such as the Commercial Buildings Energy Consumption Survey (CBECS), ASHRAE Standards 90.1, and many other academic sources [61].
Offices and apartments represent two of the most diffused building types in Europe, and they respectively account for 6% and 75% of total European building stock [62]. Therefore, two representative reference models, the small office and the midrise apartment, were chosen for this study. The geometrical data and main characteristics of the two reference buildings are summarized in the table and pictures below (Table 1, Figure 1).
The HVAC equipment of the reference buildings is modeled in accordance with ASHRAE Standard 90.1 and consider, for both the small office and the midrise apartment, a boiler for heating generation, a packaged air conditioning unit for cooling generation, and a single-zone constant-volume system for air distribution.
Particular attention was paid to the reliability of consumption and, considering that the analyses were run for different building types and different locations, to the independence of the results from the HVAC system sizing process. Therefore, the original HVAC systems were substituted with properly calibrated ideal-load air systems. These systems are similar to a traditional HVAC unit in EnergyPlus; the main difference is that it is not connected to a central system, and each ideal-load air system provides heating or cooling to satisfy the zone setpoint [63]. Starting from the ideal heating and cooling loads, the energy consumption is calculated by dividing the loads by an ideal energy efficiency ratio (EER) equal to 3 in cooling mode and by a coefficient of performance (CoP) equal to 3 in heating mode, which can be considered average values for packaged direct expansion air conditioning systems.
Existing HVAC systems are characterized by a series of controls, such as the management of outdoor air and a night-cycle availability manager. Therefore, to guarantee the proper behavior of the ideal-load system, an energy management system (EMS) program was written in order to account for these controllers and obtain results close to the ones of the original DOE reference building.
To confirm the reliability of the calibrated ideal-load model, a statistical analysis was performed and values of mean bias error (MBE) and cumulative variation of root mean squared error (CVRMSE) were obtained from hourly values of heating and cooling energy consumption of the reference and modified models. The analysis was performed for each thermal zone, starting from three different reference models, one for each of the chosen locations (Miami—ASHRAE Zone 1A, Chicago—ASHRAE Zone 5A, Fairbanks—ASHRAE Zone 8), for both small office and midrise apartment.
Table 2 summarizes the results of these analyses, considering the average of whole thermal zones and cities and excluding only the zones where the HVAC system is off for at least 95% of total hours since the thermal behavior of these zones is not considered representative of the behavior of the entire building.
Values of MBE and CVRMSE were then compared with reference values from ASHRAE guideline 14 [64,65], which gives the hourly calibration criteria for real building modeling. Indeed, most of the thermal zones in all the configurations meet the ASHRAE hourly criteria, with |MBE| ≤ 10% and CVRMSE ≤ 30% [64,65]. All the results meet the criteria described before, except for the cooling CVRMSE of the small office, which was slightly over the threshold; in this case, the results were negatively influenced by the Fairbanks result, which can be considered nonrepresentative as it has a reduced functioning period (19% of total hours for small office, 17% for midrise apartment) and very low cooling energy consumption. Indeed, considering the Fairbanks yearly global HVAC consumption, the differences obtained by comparing reference and ideal-load models are very low: 1.1% and 1.5% for the office and apartment models, respectively. For these reasons, the model can be considered reliable.
The performance assessment of the integration of PCMs in buildings was carried out considering a whole year. In order to properly account for the transient behavior of PCMs, each simulation hour was divided into 20 analysis timesteps. Moreover, 25 different European cities were considered in order to assess the benefits of the integration of PCMs into buildings. To define a broad and nonredundant city sample, different European cities—most of them characterized by common EU directives—were studied, selecting cities with very different climates, as described in Figure 2 and Table 3.
In order to adapt the models to the European climates, all thermal properties were adjusted to meet the different energy requirements [66,67,68,69,70]. The selected cities were then grouped in six different climatic zones—B, C, D, E, F, and G, from warmer to colder—in accordance with their values of heating degree days (HDDs). Hence, the thermal properties of roofs, walls, slabs, and windows were changed according to the climatic zones, as described in Table 4.
To understand energy demand variations, an ideal-load HVAC system was considered for active strategies, while, for passive strategies, no HVAC system was implemented and natural ventilation strategies were adopted. HVAC operational schedules were kept as standard, and setpoints of 21 °C in heating operational mode and 24 °C in cooling mode were considered.
With regard to passive strategies, a supplementary EMS program was developed in order to calculate the adaptive thermal comfort optimal range, in accordance with current European recommendations (EN 16798-1:2019 [71]). This EMS program calculates, starting from the temperature of the previous 7 days (θed–i), the running mean outdoor temperature (θrm, Equation (6)) and the optimal operative temperature (θc, Equation (7)). Then, considering the first comfort class, the program calculates the operative temperature (TOP) comfort range (Equation (8)), as described in the following equations:
θ r m = ( θ e d 1 + 0.8   θ e d 2 + 0.6   θ e d 3 + 0.5   θ e d 4 + 0.4   θ e d 5 + 0.3   θ e d 6 + 0.2   θ e d 7 ) 3.8   [ ° C ] ,  
θ c = 0.33   θ r m + 18.8   [ ° C ] ,
θ c 3     T O P     θ c + 2   [ ° C ] .
Hence, the results of these calculations were used for both the definition of the number of discomfort hours—comparing the operative temperature with the optimal range in Equation (6)—and the definition of a natural ventilation schedule. Indeed, in the passive strategy case, natural ventilation is activated only when the operative temperature of the thermal zone oversteps the higher boundary of the optimal range and the outdoor dry-bulb air temperature is lower than the indoor dry-bulb air temperature. This choice is due to the behavior of the building users, who generally open windows only for warm thermal discomfort.
For both strategies, a linearly dimmable artificial lighting system was implemented, controlled by an illuminance sensor placed in the middle of each thermal zone, with a target illuminance of 300 lux in the apartments, 100 lux in the corridors, and 500 lux in the offices. Internal gains, occupancy, and indoor appliances were left in accordance with the original reference models. According to the ASHRAE Standards [72], indoor appliances consume a maximum of 10.76 W/m2 in small offices and 5.38 W/m2 in midrise apartments, with a radiant fraction equal to 0.5. An occupancy density of 0.054 persons/m2 was considered for the offices, while a maximum number of 2.5 people was assumed for the apartments. In both cases, the metabolic emission rate was considered equal to 120 W/person.
Another fundamental step in energy analyses is to properly model the PCM in EnergyPlus. To that end, a commercial PCM-enhanced plaster panel—the Alba Balance by Saint-Gobain Rigips—was considered as a reference. Two phase-transition temperatures, 23 and 26 °C, are commercially available for these boards. In this study, a 23 °C phase transition with a latent heat of 300 kJ/m2 is considered, as shown in Table 5, which reports the producer-declared technical data.
In order to suitably model this material in EnergyPlus, an enthalpy table, ranging from −30 to +100 °C, was calculated, starting from the areal density, the specific heat, the latent heat, and the following enthalpy equation.
H = m c   Δ T
Once the material reaches the melting point (23 °C), it stores latent heat (300 kJ/m2 = 12 kJ/kg). This heat storage is equally distributed as an increase of enthalpy at three temperature steps within the melting range (21, 22, and 23 °C). The plot of the enthalpy curve is included in Figure 3.
Finally, these calculated values were inputted in EnergyPlus, and, to model the behavior of the PCM properly, the heat balance algorithm was changed from the Conduction Transfer Function (CTF) to the Conduction Finite Difference (ConFD) algorithm, increasing the timesteps from 6 to 20 [73]. These settings significantly increase the running time but discretize the surfaces depending on the thermal diffusivity of the material and the time step, allowing us to model particular materials, such as PCMs or variable thermal conductivity materials [63]. This timestep setting has been largely validated and verified [63,73] and guarantees a good adherence of the numerical model with measured data. Further detailed hysteresis analysis would have led to errors of about 1% instead of a just-few-times-higher error [74], which can be considered acceptable for annual analyses.
The chosen plasterboards can be used in both walls and ceilings, and, for these analyses, they were considered the inner layer of all external walls and roofs. Despite Zwanzig et al. stating that in a multilayer wall, centrally located PCM better reduces heat fluxes [75], other studies have confirmed that PCMs located as an inner layer improve thermal comfort, thanks to the stabilization of radiant temperature [25]. Moreover, to understand how the thicknesses of the boards influence the results, four different boards, with thicknesses of 12.5, 25, 37.5, and 50 mm, were considered and modeled.

3. Results

The benefits of implementing PCMs were assessed by considering the reduction of energy demand in the active strategy and the reduction of total discomfort hours in the passive strategy. The following subparagraphs show the different results obtained for each strategy considered.

3.1. Active Strategies: Energy Demand Reduction

The reduction of energy demand is shown in the following figures (Figure 4 and Figure 5), where the results are grouped with reference to the climatic zones, showing the changes of the control parameter as a change of PCM thickness. The contribution of PCMs in the reduction of heating and cooling energy consumption was split so as to differentiate the strategies. The percentage of energy reduction (ER%) refers to the difference between the total energy demand in the baseline case (ET baseline)—without PCM—and the total energy demand in each PCM-implemented case (ET PCM). This difference was then divided by the total energy demand of the baseline case, as described in the following equation (Equation (10)):
E R % = 100 E T   b a s e l i n e E T   P C M E T   b a s e l i n e
Overall, it can be easily argued that the type and magnitude of energy reduction are strictly dependant on building typology, and outcomes show opposite trends when comparing the two models. On the one hand, in the small office model, the benefits of PCMs are clearer and increase in colder climates, with an average that rises from 2.57% for Zone B to 5.13% for Zone G. On the other hand, benefits for the midrise apartment model are lower and countertrend, considering that the main contribution is related to heating demand reduction and that the zone average decreases (with a less evident trend) in colder zones. However, both models confirm that an increase in PCM thickness corresponds to an increase in benefits, with a strong logarithmic correlation between thickness and energy reduction (Figure 6).

3.2. Passive Strategies: Thermal Discomfort Reduction

In this second set of analyses, the index of the advantages related to the implementation of PCMs is the reduction of total discomfort hours (DHT) in baseline (DHT Baseline) and PCM (DHT PCM) models, calculated by comparing the operative temperature of the thermal zones with the acceptance limits expressed in Equation (8). Analogously to the ER% described in the previous section, the percentage of discomfort hours reduction (DHR%) was calculated as described in Equation (11), and the results are reported in Figure 7 and Figure 8.
D H R % = 100 D H T   B a s e l i n e D H T   P C M D H T   B a s e l i n e
Analogies and differences with results obtained for the active strategies can be easily noted from the graphs. Firstly, these simulations confirm that the implementation of PCMs is more effective in small offices than in midrise apartments.
With regards to the small office model, a clear different behavior can be identified when comparing the climatic zones: warmer climates (Zones B, C, and D) show higher benefits, mainly related to the reduction of cold thermal discomfort, while colder zones (E, F, and G) show lower benefits related to the reduction of warm thermal discomfort. This different behavior is also confirmed by the zone averages that fluctuate between 4.5% and 9% for the first three zones while oscillating around 1.2% for the other zones.
On the contrary, in midrise apartments, there is hardly ever a reduction of cold thermal discomfort; the results are mainly pushed by the reduction of warm thermal discomfort. In this case, the major advantages are registered in the intermediate climates—Zones C and D—with average values of 3.45% and 2.15%, respectively, while for other zones, the average benefits are lower and range from 0.73% to 1.57%.
Finally, comparing the effect of different PCM thicknesses, the comfort analysis confirms that thicker panels show higher advantages (Figure 9).

4. Discussion

The analyses performed point out a complex frame of results, where a few trends can be deduced, in general, for PCMs while others should be referred to each specifically analyzed case.
Firstly, one of the clearest conclusions that can be drawn is that the benefits of PCMs, integrated into the envelope’s inner face, depend logarithmically on the thickness of the boards. The presented outcomes confirm that this trend is common to all analyses and does not depend on the climatic zones, building typology, or the comfort strategy adopted. Therefore, it can be stated that increasing board thickness is particularly advantageous, considering layers up to 50 mm; further increases lead to gradually lower improvements that may not be affordable. This behavior can be explained by considering the relatively low thermal conductivity of the boards (0.27 W/mK). In this case, increasing board thickness adds a further shift in the load peaks related to the thermal conduction inside the board that gradually reduces the effectiveness of the PCM.
Referring to different building typologies, the small office model shows higher benefits than the midrise apartment model, regardless of the climatic zone, PCM thickness, and comfort strategy adopted. The main reason for this trend can be identified in the different occupancy rates (35.3 m2/person for the midrise apartment and 18.6 m2/person for the small office) and the different internal loads of equipment and lights, which are sensibly higher in the office model. Considering the case of PCM boards located on the envelope’s inner face, increasing the internal loads can increase the number of melting cycles, improving energy and comfort, especially in cooling-dominated climates.
Lastly, considering the climatic zones analyzed, it can be stated in general that the advantages of PCMs are higher in warm climates—Zones B, C, and D—with the only countertrend exception represented by the energy demand of the small office model in active strategies, where colder zones correspond to higher benefits, thanks to a constant increase in heating energy reduction.
Beyond these general considerations on the results obtained, referring to each analyzed case, on the one hand, the small office model has shown:
  • significant overall benefits in the active approach, thanks to an important reduction of cooling demand; moreover, in colder zones, further reductions in heating consumption lead to higher benefits;
  • a significant reduction of cold discomfort in hot climates in the passive approach and a slight reduction of warm discomfort in cold climates; nevertheless, few increases of warm discomfort can be found in extremely cold climates (Reykjavik).
  • On the other hand, the midrise apartment model has shown:
  • primarily reductions of heating demand in the active approach, with slight improvements of cooling consumption only for hot climates; considering the overall trend, the hot climates register slightly higher benefits;
  • benefits in the passive approach are related mainly to warm discomfort, with higher effectiveness in intermediate climatic zones; moreover, in cold climates, reductions of cold discomfort have been registered, with a single case of increased cold discomfort in Bergen.
Comparing these results with those reported in similar studies, the main differences obtained can be explained by the positioning of the boards and the use of different building types, occupancy, and system availability schedules that can increase or decrease PCM effectiveness. Moreover, in this case, a PCM-embedded gypsum board was considered for adaptive implementation while, in other studies, pure PCM materials were applied to the envelope. Finally, as described by this study, the different locations can significantly change the effectiveness of the implementation of this technology.

5. Conclusions

The analyses presented in this paper are focused primarily on the effect of the PCM-enhanced boards studied, considering different boundary conditions, in order to define general trends and the specific behavior of this technology. To this end, the simulations considered different building typologies, climates, thicknesses, and active/passive strategies. Considering all the differences that can arise with this broad number of variables, the methodology adopted to create the energy building model tries to reduce all the fluctuations related to different national laws or the specific HVAC system in order to have comparable results.
Overall, this study highlights both general and specific trends for this technology, with interesting results. Undoubtedly, further studies could expand this research to other calibrated reference models or different climates in order to further generalize or specify the trends described in this paper. In this first work, our attention was focused on the European geographic area in order to analyze cities with similar energy containment directives. Future developments could expand this area—changing the envelope characteristics and also considering tropical and dry climates.
The economic aspects of PCM implementation are out of the boundaries of the current study as there are very different compositions of energy and energy prices in the considered countries. Future works could focus on smaller groups of locations and estimate a payback period on selected groups of cities with similar economic and energetic backgrounds.
Another interesting development of this first study could consider a simulation in future climatic scenarios. As shown in our research, office models are characterized by a strong cooling reduction in the active strategy and mainly by cold thermal discomfort in passive strategies. Considering future scenario simulations—characterized by warmer boundary conditions—the energy benefits should be higher than those obtained in our active strategy simulations while, on the contrary, in the passive strategy, the benefits could be lower. Finally, with regard to the midrise apartment model, the PCM benefits are related mainly to heating consumption reduction (active strategy) and the reduction of warm discomfort hours (passive strategy). Therefore, the benefits of PCM implementation could probably be reduced in future scenarios.

Author Contributions

Conceptualization, F.F. and A.C.; methodology, F.C., F.F. and A.C.; software, F.C.; validation, F.C. and F.F.; formal analysis, F.C.; investigation, A.S. and A.A.T.; resources, A.C.; data curation, F.C.; writing—original draft preparation, F.C.; writing—review and editing, F.F., A.C., A.A.T. and A.S.; visualization, F.C. and F.F.; supervision, F.F. and A.C. All authors have read and agreed to the published version of the manuscript.

Funding

This research received no external funding.

Institutional Review Board Statement

Not applicable.

Informed Consent Statement

Not applicable.

Data Availability Statement

Data is contained within the article.

Conflicts of Interest

The authors declare no conflict of interest.

References

  1. Aelenei, D.; Aelenei, L.; Vieira, C.P. Adaptive Façade: Concept, Applications, Research Questions. Energy Procedia 2016, 91, 269–275. [Google Scholar] [CrossRef] [Green Version]
  2. Fiorito, F.; Cannavale, A.; Santamouris, M. Development, testing and evaluation of energy savings potentials of photovoltachromic windows in office buildings. A perspective study for Australian climates. Sol. Energy 2020, 205, 358–371. [Google Scholar] [CrossRef]
  3. Loonen, R.C.G.M.; Favoino, F.; Hensen, J.L.M.; Overend, M. Review of current status, requirements and opportunities for building performance simulation of adaptive facades. J. Build. Perform. Simul. 2017, 10, 205–223. [Google Scholar] [CrossRef] [Green Version]
  4. Lee, K.O.; Medina, M.A.; Raith, E.; Sun, X. Assessing the integration of a thin phase change material (PCM) layer in a residential building wall for heat transfer reduction and management. Appl. Energy 2015, 137, 699–706. [Google Scholar] [CrossRef]
  5. Akeiber, H.; Nejat, P.; Zaimi, M.; Majid, A.; Wahid, M.A.; Jomehzadeh, F.; Zeynali, I.; Kaiser, J.; Richard, B.; Ahmad, S. A review on phase change material ( PCM ) for sustainable passive cooling in building envelopes. Renew. Sustain. Energy Rev. 2016, 60, 1470–1497. [Google Scholar] [CrossRef]
  6. Casini, M. Active dynamic windows for buildings: A review. Renew. Energy 2018, 119, 923–934. [Google Scholar] [CrossRef]
  7. Baetens, R.; Jelle, B.P.; Gustavsen, A. Properties, requirements and possibilities of smart windows for dynamic daylight and solar energy control in buildings: A state-of-the-art review. Sol. Energy Mater. Sol. Cells 2010, 94, 87–105. [Google Scholar] [CrossRef] [Green Version]
  8. Tällberg, R.; Jelle, B.P.; Loonen, R.; Gao, T.; Hamdy, M. Comparison of the energy saving potential of adaptive and controllable smart windows: A state-of-the-art review and simulation studies of thermochromic, photochromic and electrochromic technologies. Sol. Energy Mater. Sol. Cells 2019, 200, 109828. [Google Scholar] [CrossRef] [Green Version]
  9. Cannavale, A.; Martellotta, F.; Cossari, P.; Gigli, G.; Ayr, U. Energy savings due to building integration of innovative solid-state electrochromic devices. Appl. Energy 2018, 225, 975–985. [Google Scholar] [CrossRef]
  10. Fiorito, F.; Sauchelli, M.; Arroyo, D.; Pesenti, M.; Imperadori, M.; Masera, G.; Ranzi, G. Shape morphing solar shadings: A review. Renew. Sustain. Energy Rev. 2016, 55, 863–884. [Google Scholar] [CrossRef] [Green Version]
  11. Barozzi, M.; Lienhard, J.; Zanelli, A.; Monticelli, C. The Sustainability of Adaptive Envelopes: Developments of Kinetic Architecture. Procedia Eng. 2016, 155, 275–284. [Google Scholar] [CrossRef] [Green Version]
  12. Yi, H.; Kim, D.; Kim, Y.; Kim, D.; Koh, J.S.; Kim, M.J. 3D-printed attachable kinetic shading device with alternate actuation: Use of shape-memory alloy (SMA) for climate-adaptive responsive architecture. Autom. Constr. 2020, 114, 103151. [Google Scholar] [CrossRef]
  13. Favoino, F.; Jin, Q.; Overend, M. Design and control optimisation of adaptive insulation systems for office buildings. Part 1: Adaptive technologies and simulation framework. Energy 2017, 127, 301–309. [Google Scholar] [CrossRef]
  14. Jin, Q.; Favoino, F.; Overend, M. Design and control optimisation of adaptive insulation systems for office buildings. Part 2: A parametric study for a temperate climate. Energy 2017, 127, 634–649. [Google Scholar] [CrossRef]
  15. Favoino, F.; Goia, F.; Perino, M.; Serra, V. Experimental assessment of the energy performance of an advanced responsive multifunctional façade module. Energy Build. 2014, 68, 647–659. [Google Scholar] [CrossRef]
  16. Favoino, F.; Goia, F.; Perino, M.; Serra, V. Experimental analysis of the energy performance of an ACTive, RESponsive and Solar (ACTRESS) façade module. Sol. Energy 2016, 133, 226–248. [Google Scholar] [CrossRef]
  17. Kuznik, F.; David, D.; Johannes, K.; Roux, J.J. A review on phase change materials integrated in building walls. Renew. Sustain. Energy Rev. 2011, 15, 379–391. [Google Scholar] [CrossRef] [Green Version]
  18. Elias, C.N.; Stathopoulos, V.N. A comprehensive review of recent advances in materials aspects of phase change materials in thermal energy storage. Energy Procedia 2019, 161, 385–394. [Google Scholar] [CrossRef]
  19. Neri, G.; Koehler, A.; De Parolis, M.N.; Zolesi, V. ESA conditioned container: A system for passive temperature controlled transportation of experiments for the international space station. In Proceedings of the International Astronautical Congress, Naples, Italy, 1–5 October 2012. [Google Scholar]
  20. Soares, N.; Costa, J.J.; Gaspar, A.R.; Santos, P. Review of passive PCM latent heat thermal energy storage systems towards buildings’ energy efficiency. Energy Build. 2013, 59, 82–103. [Google Scholar] [CrossRef]
  21. Manivel, R.; Muthukumaran, V.; Nekilesh, S.; Kandharooban, S. Design of thermal storage using phase change material (PCM) for agro products preservation. Int. J. Recent Technol. Eng. 2019, 8, 1669–1671. [Google Scholar] [CrossRef]
  22. Farzanehnia, A.; Khatibi, M.; Sardarabadi, M.; Passandideh-Fard, M. Experimental investigation of multiwall carbon nanotube/paraffin based heat sink for electronic device thermal management. Energy Convers. Manag. 2019, 179, 314–325. [Google Scholar] [CrossRef]
  23. De Gracia, A.; Cabeza, L.F. Phase change materials and thermal energy storage for buildings. Energy Build. 2015, 103, 414–419. [Google Scholar] [CrossRef] [Green Version]
  24. Berardi, U.; Soudian, S. Benefits of latent thermal energy storage in the retrofit of Canadian high-rise residential buildings. Build. Simul. 2018, 11, 709–723. [Google Scholar] [CrossRef]
  25. Fiorito, F. Phase-change materials for indoor comfort improvement in lightweight buildings. A parametric analysis for Australian climates. Energy Procedia 2014, 57, 2014–2022. [Google Scholar] [CrossRef] [Green Version]
  26. De Matteis, V.; Cannavale, A.; Martellotta, F.; Rinaldi, R.; Calcagnile, P.; Ferrari, F.; Ayr, U.; Fiorito, F. Nano-encapsulation of phase change materials: From design to thermal performance, simulations and toxicological assessment. Energy Build. 2019, 188–189, 1–11. [Google Scholar] [CrossRef]
  27. Kośny, J. PCM-Enhanced Building Components—An Application of Phase Change Materials in Building Envelopes and Internal Structures; Springer: Berlin/Heidelberg, Germany, 2015; ISBN 9783319142852. [Google Scholar] [CrossRef]
  28. Cabeza, L.F.; Castell, A.; Barreneche, C.; De Gracia, A.; Fernández, A.I. Materials used as PCM in thermal energy storage in buildings: A review. Renew. Sustain. Energy Rev. 2011, 15, 1675–1695. [Google Scholar] [CrossRef]
  29. Kenisarin, M.M. Thermophysical properties of some organic phase change materials for latent heat storage. A review. Sol. Energy 2014, 107, 553–575. [Google Scholar] [CrossRef]
  30. Yuan, Y.; Zhang, N.; Tao, W.; Cao, X.; He, Y. Fatty acids as phase change materials: A review. Renew. Sustain. Energy Rev. 2014, 29, 482–498. [Google Scholar] [CrossRef]
  31. Su, W.; Darkwa, J.; Kokogiannakis, G. Review of solid-liquid phase change materials and their encapsulation technologies. Renew. Sustain. Energy Rev. 2015, 48, 373–391. [Google Scholar] [CrossRef]
  32. Milián, Y.E.; Gutiérrez, A.; Grágeda, M.; Ushak, S. A review on encapsulation techniques for inorganic phase change materials and the influence on their thermophysical properties. Renew. Sustain. Energy Rev. 2017, 73, 983–999. [Google Scholar] [CrossRef]
  33. Salunkhe, P.B.; Shembekar, P.S. A review on effect of phase change material encapsulation on the thermal performance of a system. Renew. Sustain. Energy Rev. 2012, 16, 5603–5616. [Google Scholar] [CrossRef]
  34. Gil, A.; Medrano, M.; Martorell, I.; Lázaro, A.; Dolado, P.; Zalba, B.; Cabeza, L.F. State of the art on high temperature thermal energy storage for power generation. Part 1-Concepts, materials and modellization. Renew. Sustain. Energy Rev. 2010, 14, 31–55. [Google Scholar] [CrossRef]
  35. Navarro, L.; de Gracia, A.; Colclough, S.; Browne, M.; McCormack, S.J.; Griffiths, P.; Cabeza, L.F. Thermal energy storage in building integrated thermal systems: A review. Part 1. active storage systems. Renew. Energy 2016, 88, 526–547. [Google Scholar] [CrossRef] [Green Version]
  36. Weinläder, H.; Körner, W.; Strieder, B. A ventilated cooling ceiling with integrated latent heat storage—Monitoring results. Energy Build. 2014, 82, 65–72. [Google Scholar] [CrossRef]
  37. Lizana, J.; de-Borja-Torrejon, M.; Barrios-Padura, A.; Auer, T.; Chacartegui, R. Passive cooling through phase change materials in buildings. A critical study of implementation alternatives. Appl. Energy 2019, 254. [Google Scholar] [CrossRef]
  38. Fiorentini, M.; Cooper, P.; Ma, Z. Development and optimization of an innovative HVAC system with integrated PVT and PCM thermal storage for a net-zero energy retrofitted house. Energy Build. 2015, 94, 21–32. [Google Scholar] [CrossRef] [Green Version]
  39. Real, A.; García, V.; Domenech, L.; Renau, J.; Montés, N.; Sánchez, F. Improvement of a heat pump based HVAC system with PCM thermal storage for cold accumulation and heat dissipation. Energy Build. 2014, 83, 108–116. [Google Scholar] [CrossRef]
  40. de Gracia, A.; Navarro, L.; Castell, A.; Cabeza, L.F. Energy performance of a ventilated double skin facade with PCM under different climates. Energy Build. 2015, 91, 37–42. [Google Scholar] [CrossRef] [Green Version]
  41. Sharif, M.K.A.; Al-Abidi, A.A.; Mat, S.; Sopian, K.; Ruslan, M.H.; Sulaiman, M.Y.; Rosli, M.A.M. Review of the application of phase change material for heating and domestic hot water systems. Renew. Sustain. Energy Rev. 2015, 42, 557–568. [Google Scholar] [CrossRef]
  42. Khan, M.M.A.; Ibrahim, N.I.; Mahbubul, I.M.; Ali, H.M.; Saidur, R.; Al-Sulaiman, F.A. Evaluation of solar collector designs with integrated latent heat thermal energy storage: A review. Sol. Energy 2018, 166, 334–350. [Google Scholar] [CrossRef]
  43. Navarro, L.; Barreneche, C.; Castell, A.; Redpath, D.A.G.; Griffiths, P.W.; Cabeza, L.F. High density polyethylene spheres with PCM for domestic hot water applications: Water tank and laboratory scale study. J. Energy Storage 2017, 13, 262–267. [Google Scholar] [CrossRef] [Green Version]
  44. Najafian, A.; Haghighat, F.; Moreau, A. Integration of PCM in domestic hot water tanks: Optimization for shifting peak demand. Energy Build. 2015, 106, 59–64. [Google Scholar] [CrossRef] [Green Version]
  45. Hasan, A.; McCormack, S.J.; Huang, M.J.; Norton, B. Energy and cost saving of a photovoltaic-phase change materials (PV-PCM) System through temperature regulation and performance enhancement of photovoltaics. Energies 2014, 7, 1318–1331. [Google Scholar] [CrossRef] [Green Version]
  46. Lu, W.; Liu, Z.; Flor, J.F.; Wu, Y.; Yang, M. Investigation on designed fins-enhanced phase change materials system for thermal management of a novel building integrated concentrating PV. Appl. Energy 2018, 225, 696–709. [Google Scholar] [CrossRef]
  47. Faheem, A.; Ranzi, G.; Fiorito, F.; Lei, C. A numerical study on the thermal performance of night ventilated hollow core slabs cast with micro-encapsulated PCM concrete. Energy Build. 2016, 127, 892–906. [Google Scholar] [CrossRef]
  48. Navarro, L.; de Gracia, A.; Niall, D.; Castell, A.; Browne, M.; McCormack, S.J.; Griffiths, P.; Cabeza, L.F. Thermal energy storage in building integrated thermal systems: A review. Part 2. Integration as passive system. Renew. Energy 2016, 85, 1334–1356. [Google Scholar] [CrossRef] [Green Version]
  49. Cabeza, L.F.; Castellón, C.; Nogués, M.; Medrano, M.; Leppers, R.; Zubillaga, O. Use of microencapsulated PCM in concrete walls for energy savings. Energy Build. 2007, 39, 113–119. [Google Scholar] [CrossRef]
  50. Ramakrishnan, S.; Wang, X.; Sanjayan, J.; Wilson, J. Thermal performance assessment of phase change material integrated cementitious composites in buildings: Experimental and numerical approach. Appl. Energy 2017, 207, 654–664. [Google Scholar] [CrossRef]
  51. Kosny, J.; Kossecka, E.; Brzezinski, A.; Tleoubaev, A.; Yarbrough, D. Dynamic thermal performance analysis of fiber insulations containing bio-based phase change materials (PCMs). Energy Build. 2012, 52, 122–131. [Google Scholar] [CrossRef]
  52. Castellón, C.; Medrano, M.; Roca, J.; Cabeza, L.F.; Navarro, M.E.; Fernández, A.I.; Lázaro, A.; Zalba, B. Effect of microencapsulated phase change material in sandwich panels. Renew. Energy 2010, 35, 2370–2374. [Google Scholar] [CrossRef]
  53. Weinlaeder, H.; Koerner, W.; Heidenfelder, M. Monitoring results of an interior sun protection system with integrated latent heat storage. Energy Build. 2011, 43, 2468–2475. [Google Scholar] [CrossRef]
  54. Weinläder, H.; Beck, A.; Fricke, J. PCM-facade-panel for daylighting and room heating. Solar Energy 2005, 78, 177–186. [Google Scholar] [CrossRef]
  55. Barrenechea, C.; Navarro, H.; Serrano, S.; Cabeza, L.F.; Fernández, A.I. New database on phase change materials for thermal energy storage in buildings to help PCM selection. Energy Procedia 2014, 57, 2408–2415. [Google Scholar] [CrossRef] [Green Version]
  56. Heim, D.; Clarke, J.A. Numerical modelling and thermal simulation of PCM-gypsum composites with ESP-r. Energy Build. 2004, 36, 795–805. [Google Scholar] [CrossRef]
  57. Zhang, Y.; Zhou, G.; Lin, K.; Zhang, Q.; Di, H. Application of latent heat thermal energy storage in buildings: State-of-the-art and outlook. Build. Environ. 2007, 42, 2197–2209. [Google Scholar] [CrossRef]
  58. US Department of Energy EnergyPlus Version 9.5 Documentation: Getting Started. EnergyplusTM. 2021. Available online: https://energyplus.net/sites/all/modules/custom/nrel_custom/pdfs/pdfs_v9.5.0/GettingStarted.pdf (accessed on 17 May 2021).
  59. Favoino, F.; Giovannini, L.; Loonen, R. Smart glazing in Intelligent Buildings: What can we simulate? In Proceedings of the All eyes on glass: Conference proceedings of Glass Performance Days 2017, Tampere, Finland, 28–30 June 2017; pp. 8–15. [Google Scholar]
  60. Field, K.; Deru, M.; Studer, D. Using Doe Commercial Reference Buildings for Simulation Studies. In Proceedings of the SimBuild 2010 Fourth National Conference of IBPSA-USA, New York, NY, USA, 11–13 August 2010. [Google Scholar]
  61. Deru, M.; Field, K.; Studer, D.; Benne, K.; Griffith, B.; Torcellini, P.; Liu, B.; Halverson, M.; Winiarski, D.; Rosenberg, M.; et al. U.S. Department of Energy Commercial Reference Building Models of the National Building Stock; National Renewable Energy Laboratory: Golden, CO, USA, 2011. [Google Scholar]
  62. Economidou, M. Europe’s Buildings under the Microscope. A Country-by-Country Review of the Energy Performance of Buildings; Buildings Performance Institute Europe (BPIE): Brussel, Belgium, 2011; ISBN 9789491143014. [Google Scholar]
  63. US Department of Energy EnergyPlus Engineering Reference: The Reference to EnergyPlus Calculations. US Dep. Energy 2021. Available online: https://energyplus.net/documentation (accessed on 17 May 2021).
  64. ANSI/ASHRAE ASHRAE Guideline 14-2002 Measurement of Energy and Demand Savings; ASHRAE: Atlanta, GA, USA, 2002.
  65. ASHRAE. Guideline 14-2014: Measurement of Energy, Demand, and Water Savings; ASHRAE: Atlanta, GA, USA, 2014. [Google Scholar]
  66. Decreto Ministeriale del 26 giugno 2015—Applicazione delle metodologie di calcolo delle prestazioni energetiche e definizione delle prescrizioni e dei requisiti minimi degli edifici. Gazz. Uff. Della Repubb. Ital. 2015. Attachment 1—Appendix A. Available online: https://www.gazzettaufficiale.it/eli/gu/2015/07/15/162/so/39/sg/pdf (accessed on 17 May 2021).
  67. Gagarin, V.G. Thermal performance as the main factor of energy saving of buildings in Russia. Procedia Eng. 2016, 146, 112–119. [Google Scholar] [CrossRef]
  68. Schettler-Kohler, H.-P.; Ahlke, I. EPBD implementation in Germany. Concert. Action Energy Perform. Build. 2019, 211–229. Available online: https://www.epbd-ca.eu/wp-content/uploads/2018/08/CA-EPBD-IV-Germany-2018.pdf (accessed on 17 May 2021).
  69. Danish Knolwledge Centre for Energy Savings in Buildings. Energy Requirements of BR18: A Quick Guide for the Construction Industry on the Danish Building Regulations 2018; Danish Knowledge Centre for Energy Savings in Buildings: Taastrup, 2018; Available online: https://byggeriogenergi.dk (accessed on 17 May 2021).
  70. Brekke, T.; Isachsen, O.K.; Strand, M. EPBD Implementation in Norway. Concert. Action Energy Perform. Build. 2019, 387–398. Available online: www.epbd-ca.eu (accessed on 17 May 2021).
  71. CEN EN 16798-1:2019—Energy Performance of Buildings—Ventilation for Buildings—Part 1: Indoor Environmental Input Parameters for Design and Assessment of Energy Performance of Buildings Addressing Indoor Air Quality, Thermal Environment, Lighting and Acoustics. 2019. Available online: https://www.cen.eu/news/brief-news/pages/en-2019-022.aspx (accessed on 17 May 2021).
  72. ANSI/ASHRAE/IES. Standard 90.1-2019—Energy Standard for Buildings Except Low-Rise Residential Buildings; American Society of Heating, Refrigerating and Air-Conditioning Engineers, Inc.: Atlanta, GA, USA, 2019. [Google Scholar]
  73. Tabares-Velasco, P.C.; Christensen, C.; Bianchi, M. Verification and validation of EnergyPlus phase change material model for opaque wall assemblies. Build. Environ. 2012, 54, 186–196. [Google Scholar] [CrossRef]
  74. Zastawna-Rumin, A.; Kisilewicz, T.; Berardi, U. Novel Simulation Algorithm for Modeling the Hysteresis of Phase Change Materials. Energies 2020, 13, 1200. [Google Scholar] [CrossRef] [Green Version]
  75. Zwanzig, S.D.; Lian, Y.; Brehob, E.G. Numerical simulation of phase change material composite wallboard in a multi-layered building envelope. Energy Convers. Manag. 2013, 69, 27–40. [Google Scholar] [CrossRef] [Green Version]
Figure 1. Reference buildings chosen from the DOE: small office (a) and mid-rise apartment (b).
Applsci 11 04680 g001
Figure 2. Individuation of the sample of 25 cities used for the analyses.
Applsci 11 04680 g002
Figure 3. Enthalpy curve for the PCM-enhanced plasterboard.
Applsci 11 04680 g003
Figure 4. Small office, total energy demand reduction for the analyzed cities: (a) Climatic Zone B, (b) Climatic Zone C, (c) Climatic Zone D, (d) Climatic Zone E, (e) Climatic Zone F, and (f) Climatic Zone G.
Applsci 11 04680 g004
Figure 5. Midrise apartment, total energy demand reduction for the analyzed cities: (a) Climatic Zone B, (b) Climatic Zone C, (c) Climatic Zone D, (d) Climatic Zone E, (e) Climatic Zone F, and (f) Climatic Zone G.
Applsci 11 04680 g005
Figure 6. Logarithmic correlation between zone average and PCM thickness for (a) small office and (b) midrise apartment in the active strategies case.
Applsci 11 04680 g006
Figure 7. Small office, total discomfort hours reduction for the analyzed cities: (a) Climatic Zone B, (b) Climatic Zone C, (c) Climatic Zone D, (d) Climatic Zone E, (e) Climatic Zone F, and (f) Climatic Zone G.
Applsci 11 04680 g007
Figure 8. Midrise apartment, total discomfort hours reduction for the analyzed cities: (a) Climatic Zone B, (b) Climatic Zone C, (c) Climatic Zone D, (d) Climatic Zone E, (e) Climatic Zone F, and (f) Climatic Zone G.
Applsci 11 04680 g008
Figure 9. Logarithmic correlation between zone average and PCM thickness for (a) small office and (b) midrise apartment in the passive strategies case.
Applsci 11 04680 g009
Table 1. Main characteristics of reference buildings from the DOE.
Building TypesNumber of Floors
[–]
Gross Floor Area
[m2]
Floor-to-Ceiling Height
[m]
Windows-to-Wall Ratio
[%]
Number of Thermal Zones
[–]
Midrise apartment43134.59320%32
Small office1511.16322%6
Table 2. Average values of MBE and CVRMSE for the considered models, excluding the results of zones with a system functioning period of less than 5% of total hours.
Building TypesHeatingCooling
Average |MBE|
[%]
Average CVRMSE
[%]
Average |MBE|
[%]
Average CVRMSE
[%]
Midrise apartment4.9%9.3%5.7%12.9%
Small office1.2%20.7%4.5%44.9% 1
1 Without considering Fairbanks’ cooling consumption, the cooling average CVRMSE is 19.6%.
Table 3. Characteristics of the 25 European cities considered (data from epw weather file).
CityCountryKöppen–Geiger ClassificationCDD18°HDD18°
LarnacaCyprusBSh1259759
SevilleSpainCsa1063916
AthensGreeceCsa10761112
BrindisiItalyCsa8341151
SantanderSpainCfb2091369
RomeItalyCsa6491444
PortoPortugalCsb1461491
MadridSpainCsa6281965
PlovdivBulgariaCfa5432471
MilanItalyCfa3802639
ParisFranceCfb1422644
LondonEnglandCfb322866
TimisoaraRomaniaDfa3652896
BrusselsBelgiumCfb962912
GenevaSwitzerlandDfb1932965
AnkaraTurkeyBSk2533307
LjubljanaSloveniaDfc1683383
CopenhagenDenmarkDfb293563
PragueCzech RepublicDfb843703
MunichGermanyDfb793738
BergenNorwayCfb213996
MoscowRussiaDfb994655
HelsinkiFinlandDfb334712
ReykjavikIcelandDfc04917
KirunaSwedenDfc06967
Table 4. Characteristics of the envelope properties for each climatic zone.
Climatic ZoneCityEnvelope ComponentThermal Transmittance [W/m2K]Solar Heat Gain Coefficient
[–]
BLarnaca
Seville
External wall0.43-
Slab0.44-
Roof0.35-
Window30.35
CAthens
Brindisi
Santander
External wall0.34-
Slab0.38-
Roof0.33-
Window2.20.35
DRome
Porto
Madrid
External wall0.29-
Slab0.29-
Roof0.26-
Window1.80.35
EPlovdiv
Milan
Paris
London
Timisoara
Brussels
Geneva
External wall0.26-
Slab0.26-
Roof0.22-
Window1.40.35
FAnkara
Ljubljana
Copenhagen
Prague
Munich
External wall0.24-
Slab0.20-
Roof0.21-
Window1.10.35
GBergen
Moscow
Helsinki
Reykjavik
Kiruna
External wall0.17-
Slab0.10-
Roof0.09-
Window0.80.35
Table 5. Characteristics of PCM-enhanced plaster panel.
Technical Data
Densityρ1000 kg/m3
Areal densityρA25 kg/m2
Latent heatdH300 kJ/m2 = 83 Wh/m2
Total storage capacity (10–30 °C)-866 kJ/m2
Specific heatc28.3 kJ/m2K
Thermal conductivityλ0.27 W/mK
Publisher’s Note: MDPI stays neutral with regard to jurisdictional claims in published maps and institutional affiliations.

