Article

Sightseeing Navigation System from Normal Times to Disaster Outbreak Times within Urban Tourist Areas in Japan

Graduate School of Informatics and Engineering, University of Electro-Communications, 1-5-1 Chofugaoka Chofu-shi, Tokyo 182-8585, Japan
*
Author to whom correspondence should be addressed.
Appl. Sci. 2021, 11(10), 4609; https://doi.org/10.3390/app11104609
Submission received: 29 April 2021 / Revised: 15 May 2021 / Accepted: 16 May 2021 / Published: 18 May 2021
(This article belongs to the Special Issue AR, VR: From Latest Technologies to Novel Applications)

Abstract

:
In tourist areas, it is necessary to prepare a method that supports tourists’ activities by providing information concerning disaster support facilities during normal times, in addition to sightseeing spots and tourism-related facilities, because there is a risk of confusion during disasters, as tourists are not aware of the locations of disaster support facilities. The present study aims to develop a navigation system that supports the activities of users during both normal times and disasters by integrating augmented reality (AR) and web geographic information systems (Web-GISs), as well as by using pictograms. The system can not only effectively provide users with information concerning sightseeing spots and tourism-related facilities but also information concerning disaster support facilities. The system was operated over a period of 6 weeks in Chofu City, Tokyo Metropolis, Japan. Based on the results of a questionnaire survey for 60 users, the system was highly evaluated for its originality in terms of displays and functions using pictograms, navigation using AR, and obtaining information during disasters. Additionally, based on the results of access log analysis, the system was continuously utilized by users during the operation period. Therefore, by continuously operating the system, it can be expected that users will further utilize each function of the system.

1. Introduction

In the advanced information and communications society of recent years, the spread of mobile information terminals such as smartphones and tablet PCs has enabled anyone to easily access the Internet and send and obtain information. However, because there is a mix of various information on the Internet, users themselves must efficiently search for the information they need. Additionally, searching for and obtaining the necessary information may take a long time, as there is an abundance of various information. Therefore, information literacy is required for users in order to make the appropriate judgment of necessary information and effectively utilize such information.
The above can be applied to the tourism field. Information can be searched before and while sightseeing using the Internet. However, it is inconvenient to obtain information concerning sightseeing spots and other locations that users want to visit, as this requires time and effort to do so from a significant amount of information. For this reason, a method to efficiently and appropriately present tourists with sightseeing information is necessary. In response to this necessity, Wise et al. [1] and Ojagh et al. [2] described the significance of the Internet of things (IoT) and its potential for smart cities, and they provided practical foundations for destination organizers and stakeholders by integrating social media, content marketing, and smart devices into the the emerging smart tourism paradigm. Additionally, Akdu [3] explained the concept of smart tourism and smart technologies, and described its issues, challenges and opportunities in the tourism sector.
As it has become easy to obtain information with the spread of mobile information terminals, anyone can easily research information concerning the places that they wish to visit. For example, tourists can look up information concerning the locations or destinations that they want to visit using their mobile information terminals while sightseeing. However, in areas that they are not familiar with, they may lose track of the routes or direction of their destinations even after referencing a map. Additionally, there is a risk of confusion during disasters, as tourists are not aware of the locations of disaster support facilities, such as evacuation sites and shelters in the tourist areas. Therefore, a method that supports tourists’ activities by providing information concerning disaster support facilities during normal times, in addition to sightseeing spots and tourism-related facilities, is necessary.
On the other hand, a technology called AR (augmented reality) has attracted attention as a method to efficiently provide information. AR is a technology that visualizes information by displaying digital contents such as images or videos in the real world using wearable devices such as smart glasses (Konoike) [4]. Additionally, Chatzopoulos et al. [5] surveyed mobile AR and presented its advances in tracking and registration and the existing challenging problems. There are various AR types, including location-based AR, which uses the location data obtained from a global positioning system (GPS), the image recognition-based AR, which recognizes images and markers, and markerless AR, which recognizes flat surfaces and spaces. Information technologies developed using AR include not only applications that support sightseeing and disaster prevention (GrapeCity) [6], but also applications such as Pokémon Go, which are developed together with a GPS that can be used in the real world. In this way, AR applications have become familiar to the general public. Additionally, AR is used in many ways and in various situations, and it is also used as a method to provide sightseeing information. The results of preceding studies, in which a navigation system for sightseeing as well as a system to provide sightseeing spot information were developed using AR, (Han et al. 2014, Zhou et al. 2016, Fujita et al., 2016, and Kečkeš et al. [7,8,9,10] indicate that AR is effective for providing sightseeing information.
Based on the social and academic background mentioned above, the present study aims to develop a navigation system that supports the activities of users during both normal times and disasters by integrating AR and web geographic information systems (Web-GIS), as well as by using pictograms. As the system enables users to obtain information concerning sightseeing spots and tourism-related facilities as well as disaster support facilities at any time, users can grasp the locations where they can evacuate to or receive support in advance. Even in the unlikely event of a disaster while sightseeing, users can use the system to ensure their own safety.

2. Related Work

The present study is connected to (1) the studies related to navigation systems using AR, (2) the studies related to the provision of sightseeing information using AR, (3) the studies related to information provision using pictograms, and (4) the studies related to the provision of disaster information when sightseeing. The following will introduce the major preceding studies of recent years in all parts of world in the above four study fields and demonstrate the technical novelty and originality of the present study in comparison with the others.
Regarding the studies related to navigation systems using AR, Kurihara et al. [11] and Amirian et al. [12] proposed AR navigation systems using markers. Zhou et al. [8] developed a navigation system of sightseeing spots integrating AR smart glasses, Web-GIS, recommendation systems and social networking services (SNSs). Morozumi et al. [13], Chung et al. [14], and Sasaki et al. [15] developed navigation systems to navigate users to their destinations. Hammady et al. [16] developed an AR guidance system adopting gamification in a museum, and Wang [17] presented an AR mobile navigation system that supports indoor positioning and content recommendation services. Lovreglio et al. (2020) [18] discussed the strengths, weaknesses, and opportunities (SWOT) of AR evacuation behavior. Gu et al. [19] presented an AR-based indoor navigation system that adopts simultaneous localization and mapping (SLAM) to create a point cloud map.
Regarding the studies related to the provision of sightseeing information using AR, Fukada et al. [20] proposed a sightseeing information provision system, Komoda et al. [21], Han et al. [7], Vecchio et al. [22], and Skorokhodovd et al. [23] developed a mobile sightseeing application that provides the information, and Miyajima et al. [24] proposed a sightseeing guidance system using a beacon. Zhou et al. [25] designed a tourist attraction guide system combining image recognition technology and AR technology. Makino et al. (2019) [26] developed a system that visualizes spatiotemporal information in both real and virtual spaces to provide sightseeing information, integrating SNS, Web-GIS, mixed reality (MR), and the original gallery system, as well as Wikitude and connections with external social media. Ikizawa-Naitou et al. [27] developed a support system of sightseeing tour planning in rural areas integrating AR and Web-GIS and adopting genetic algorism (GA).
Regarding the studies related to information provision using pictograms, Kusano et al. (2013) [28,29] proposed a disaster information sharing system, and Csiszár et al. [30] proposed an air passenger information system. Yamamoto (2018) [31] and Abe et al. [32] developed sightseeing information search systems using nonverbal information such as pictograms. Hayashi et al. [33] proposed an information-providing method to express train service situations in central urban areas by combining multiple pictograms, such as sign logo images. Reinolsmanna et al. [34] used the pictograms displaying traffic incidences to help drivers select the most appropriate routes along highways.
Regarding the studies related to the provision of disaster information when sightseeing, especially in Japan, as this topic attracts attention, there have been a lot of preceding studies until now. Because various kinds of disasters such as earthquakes, volcanic eruption, typhoons, and local torrential rainfall frequently occurred, especially recently in Japan. Suzuki et al. [35] provided disaster information for tourists using AR, and Fujita et al. [9] developed a navigation system that can be used during sightseeing and disasters, integrating AR smart glasses, Web-GIS, recommendation systems, and social media. Iwahara et al. [36] examined a tool to propose the information concerning sightseeing and disasters in local cities. Hamamura et al. [37] and Iino et al. [38] proposed support systems in normal conditions as well as evacuation in the event of disasters. Kajiwara et al. [39] developed an AR platform to share disaster information. Suzuki et al. [40] examined the use of an interpreter application to provide disaster information for international tourists. Psaroudakis et al. [41] presented Xenios, a system that provides early warning and risk communication services via web-based and mobile phone applications for the protection of visitors from natural hazards in important outdoor sites in Greece.
In the studies related to navigation systems using AR, the studies related to the provision of sightseeing information using AR, and the studies related to the provision of disaster information when sightseeing, there are no preceding studies to develop a system to provide the information concerning both sightseeing spots and tourism-related facilities and disaster support facilities at any time. Additionally, in the studies related to information provision using pictograms, there are no preceding studies to provide information concerning both sightseeing and disasters using nonverbal information such as pictograms.
In comparison with the preceding studies mentioned above, the present study demonstrates the technical novelty of the system developed in the present study by effectively providing users with information concerning their destinations by displaying information and routes to sightseeing spots and tourism-related facilities on the screen of their mobile information terminals by integrating AR that uses location information and pictograms for nonverbal information. This allows users to intuitively obtain information and grasp the routes to their destinations, even if they have difficulty reading maps. The originality of the present study is that the system effectively provides users with information concerning disaster support facilities such as evacuation sites and shelters, in addition to sightseeing spots and tourism-related facilities not only during disasters, but also in normal times by integrating Web-GIS. Therefore, on the digital map, the system allows users to easily obtain information concerning facilities that they can use in a disaster and during normal times, thereby providing adequate support for their activities at all times.

3. System Design

3.1. System Characteristics

Figure 1 displays the system design of the present study. As shown in Figure 1, the system is made up of location-based AR and Web-GIS. Additionally, by combining pictograms, the system can effectively provide users with information concerning disaster support facilities in addition to sightseeing spots and tourism-related facilities in an easy-to-understand manner. In this way, users can easily obtain information concerning both sightseeing and disasters while sightseeing during normal times.
In order to use the system, users can scan the QR code with their mobile information terminals and allow the application to be installed. By allowing this, the application will be installed, and users will be able to use various functions of the system by opening the application.
In the system, sightseeing spots include parks, art museums and museums, and historical buildings, while tourism-related facilities include restaurants and cafes, convenience stores, train stations, parking lots, restrooms, accommodations, and stores and shops. Additionally, disaster support facilities include evacuation sites and shelters, water supply stations, medical facilities, convenience stores, restaurants and cafes, gas stations, support stations for those returning home, automated external defibrillator (AED) stations, and places that provide Internet access. For pictograms that represent the spots and facilities above, the standard guidance symbols provided by the Foundation for Promoting Personal Mobility and Ecological Transportation [42] were adopted. These symbols meet the international standards of the Japanese Industrial Standards (JIS) and the International Organization for Standardization (ISO), and they are recognized by the exploratory committee for their comprehensiveness and visibility.

3.2. System Usability

The usability of the system is summarized in the following three points:
(1)
Provision of information and guidance using location-based AR.
The system enables users to grasp the direction of sightseeing spots and tourism-related facilities, as these are shown on the screen as pictogram images. As these images are displayed using AR, users can confirm the direction of their destinations through the screen of their mobile information terminals, even if they have difficulty reading maps.
(2)
Dynamic and real-time properties.
While using the system, the location data of users are updated by means of a GPS installed into their mobile information terminals, and the distances to all onscreen images of spots and facilities from their present locations are updated. Therefore, users can always know the distances to their destinations. Additionally, by means of the functions using AR, 10 pictogram images of sightseeing spots and tourism-related facilities are displayed in the order of their proximity to the users’ present locations, and the images showing the routes to their destinations are updated in real-time. In this way, users can easily grasp the closest sightseeing spots and tourism-related facilities without their views being obstructed.
(3)
Integration of sightseeing and disaster information.
In addition to the information concerning sightseeing spots and tourism-related facilities, the system can provide users with information concerning disaster support facilities. Therefore, users can know disaster information in addition to sightseeing information during normal times and check the disaster support facilities in case of a disaster even while sightseeing.

3.3. Target Devices and Operating Environment

The system is a mobile application that is mainly intended to be used on mobile information terminals both indoors and outdoors. Additionally, the system is an Android application that requires Android (5.0 or higher) for the OS. Android Studio, which is an integrated development environment for Android applications [43], the Wikitude Software Development Kit (SDK), which is an SDK for AR development provided by the Wikitude GmbH (Salzburg, Austria) [44], and Mapbox, which is used in the development of Web-GIS and is provided by the Mapbox Japan G.K. (Tokyo, Japan) [45], were used for application development. According to the system requirements of Wikitude SDK, in addition to a camera and GPS, mobile information terminals must also be equipped with a compass, network positioning, accelerometer, high-resolution device, high-performance CPU, and OpenGL (2.0 or higher).

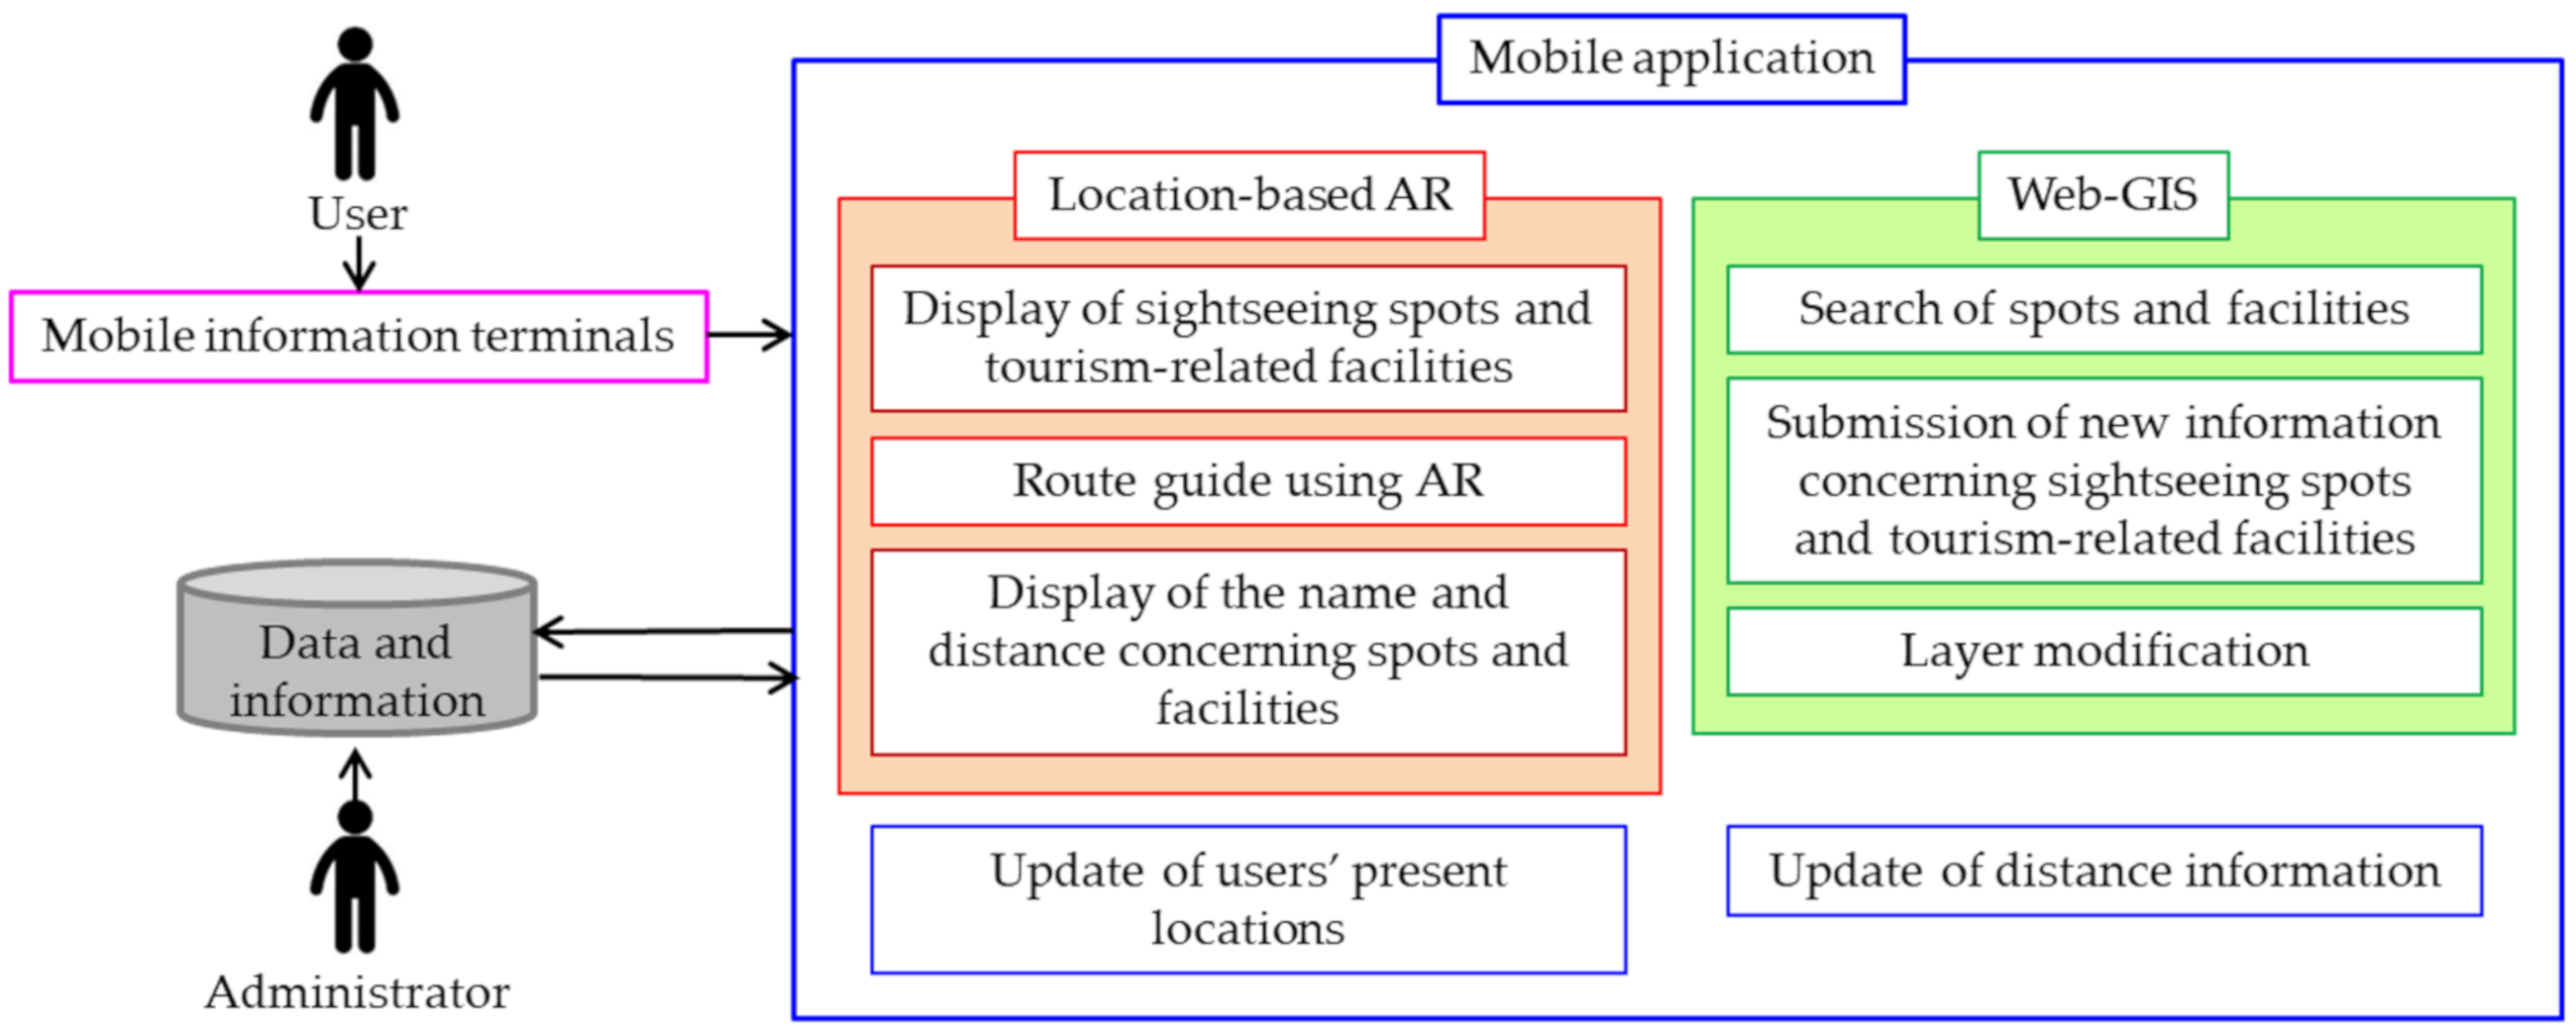
3.4. System Design Overview

3.4.1. Application

The system is an Android mobile application using location-based AR. For the development of the system, Android Studio, which is an integrated development environment for mobile applications, and Wikitude SDK, which can be incorporated into Android Studio, were used. Android Studio can be used for the layout development of applications, confirmation for the permissions of a camera and GPS of the Android mobile information terminal and loading the location information of users’ mobile information terminals. As Wikitude SDK uses web technologies such as HTML and JavaScript, the screen layout of the application can be developed using an HTML file and CSS file, in addition to an xml file of Android Studio.
The camera and location information of a mobile information terminal were configured using Java in Android Studio, while location-based AR was developed using JavaScript in the Wikitude SDK. The screen layout was designed using an HTML file and CSS file, and the user interface was designed using jQuery Mobile that is provided by the OpenJS Foundation (San Francisco, CA, USA).

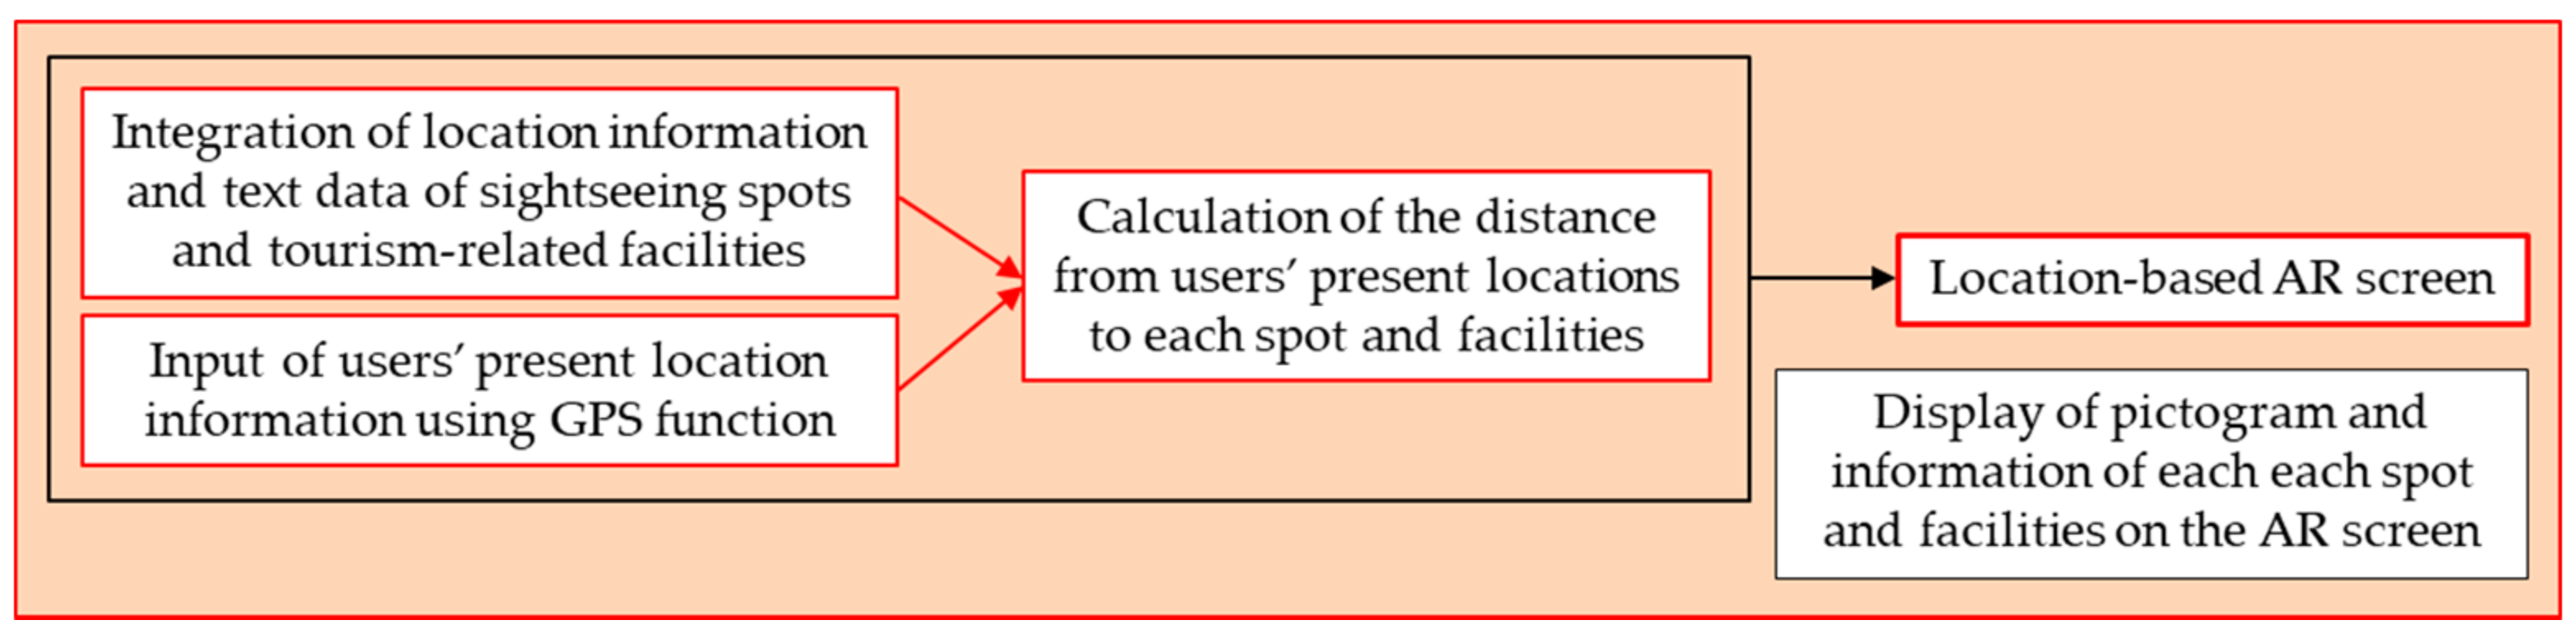
3.4.2. Location-Based AR
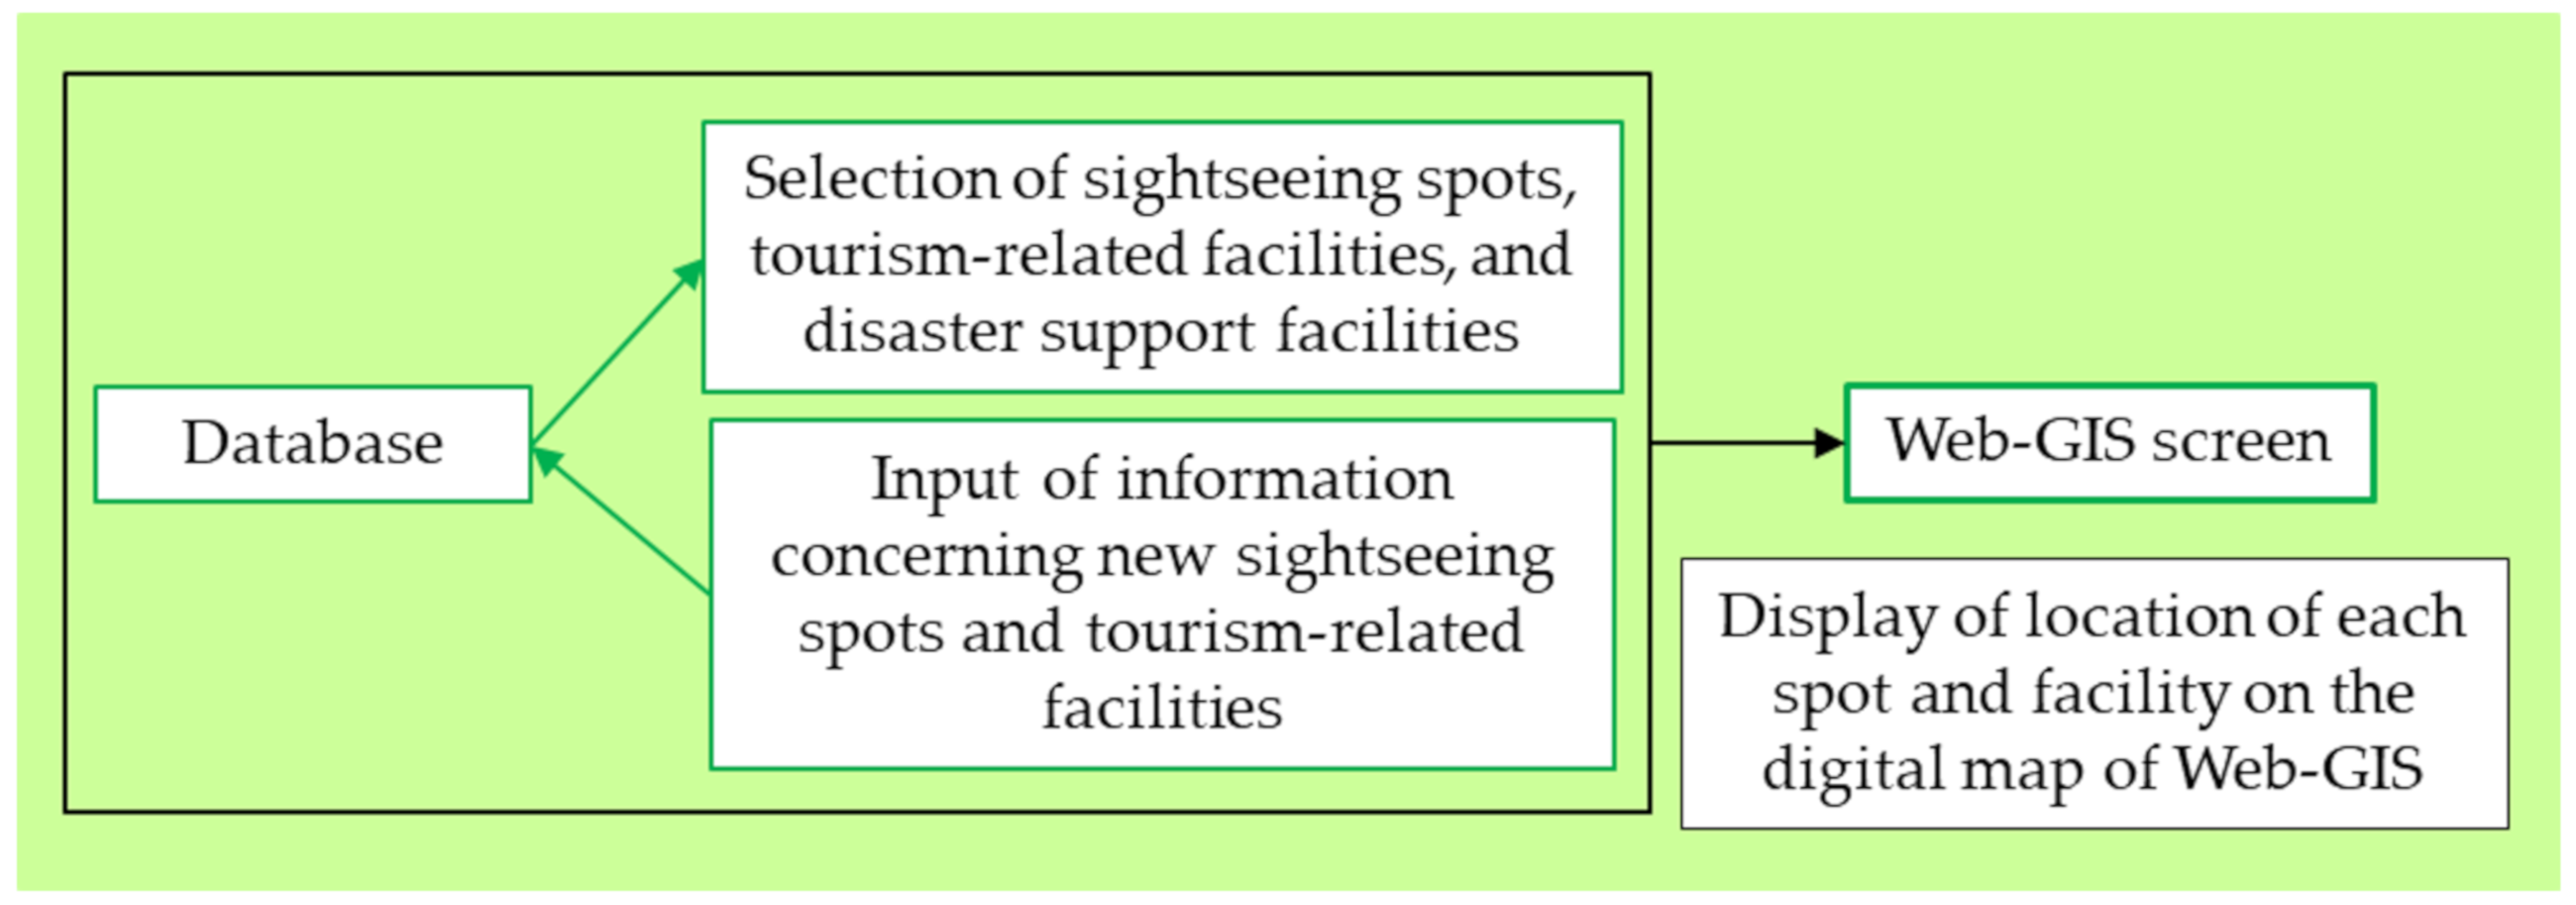
AR enables sightseeing spots and tourism-related facilities, which are displayed on the digital map of Web-GIS, to be overlapped with the real world through users’ mobile information terminals. As explained later in Section 4.1.1, when using the search function of spots and facilities, the subfunction that navigates users to the destinations they set is implemented on the digital map. As with Web-GIS, AR also enables the information concerning sightseeing spots and tourism-related facilities to be loaded from the database and pictogram images to be positioned in the appropriate areas on the AR screens based on their location information. While using AR, the top 10 sightseeing spots and tourism-related facilities that are the closest to the users’ present locations are displayed. Additionally, as the location information is updated by means of the GPS, the displayed and hidden images change based on the users’ locations. Sightseeing spots and tourism-related facilities can also be searched using AR, and such spots and facilities only in the category, once selected, are displayed on the screen of the mobile information terminal. The process mentioned above is shown in Figure 2.

3.4.3. Web-GIS

The system uses Mapbox as the digital map of Web-GIS. In Web-GIS, information concerning the name and its longitude and latitude of the spots and facilities from the database are loaded, and the pictograms that represent these in the appropriate areas are displayed on the screens of the users’ mobile information terminals. By selecting a pictogram on the digital map, the name and distance to that spot and facility will be displayed on the screen.
Additionally, users can search for sightseeing spots and tourism-related facilities using Web-GIS. When users are searching for a destination, once a category from the pictograms is selected, information concerning the sightseeing spots and tourism-related facilities within that category is loaded from the database, generating a list to be displayed. Users can select a destination from this list. Additionally, the system is implemented with a function for users to submit information concerning new sightseeing spots and tourism-related facilities, which is explained later in Section 4.1.3. Users can submit such information by selecting a location on the digital map concerning the information they want to submit, entering its name, and selecting the pictogram in the applicable category. The process mentioned above is shown in Figure 3.
Disaster support facilities can also be displayed on the digital map, where pictograms are shown in the location of the facilities on the digital map once users select the pictogram images of the facilities they want to display. Information concerning disaster support facilities is managed by csv files which are integrated into the application. Therefore, the locations of such facilities can be displayed even when offline, enabling users to receive support from the system, even if they are in a situation where the Internet is not available during disasters.

4. System Development

4.1. Frontend of the System

In the frontend of the system, the five unique functions for users are implemented as shown in detail below.

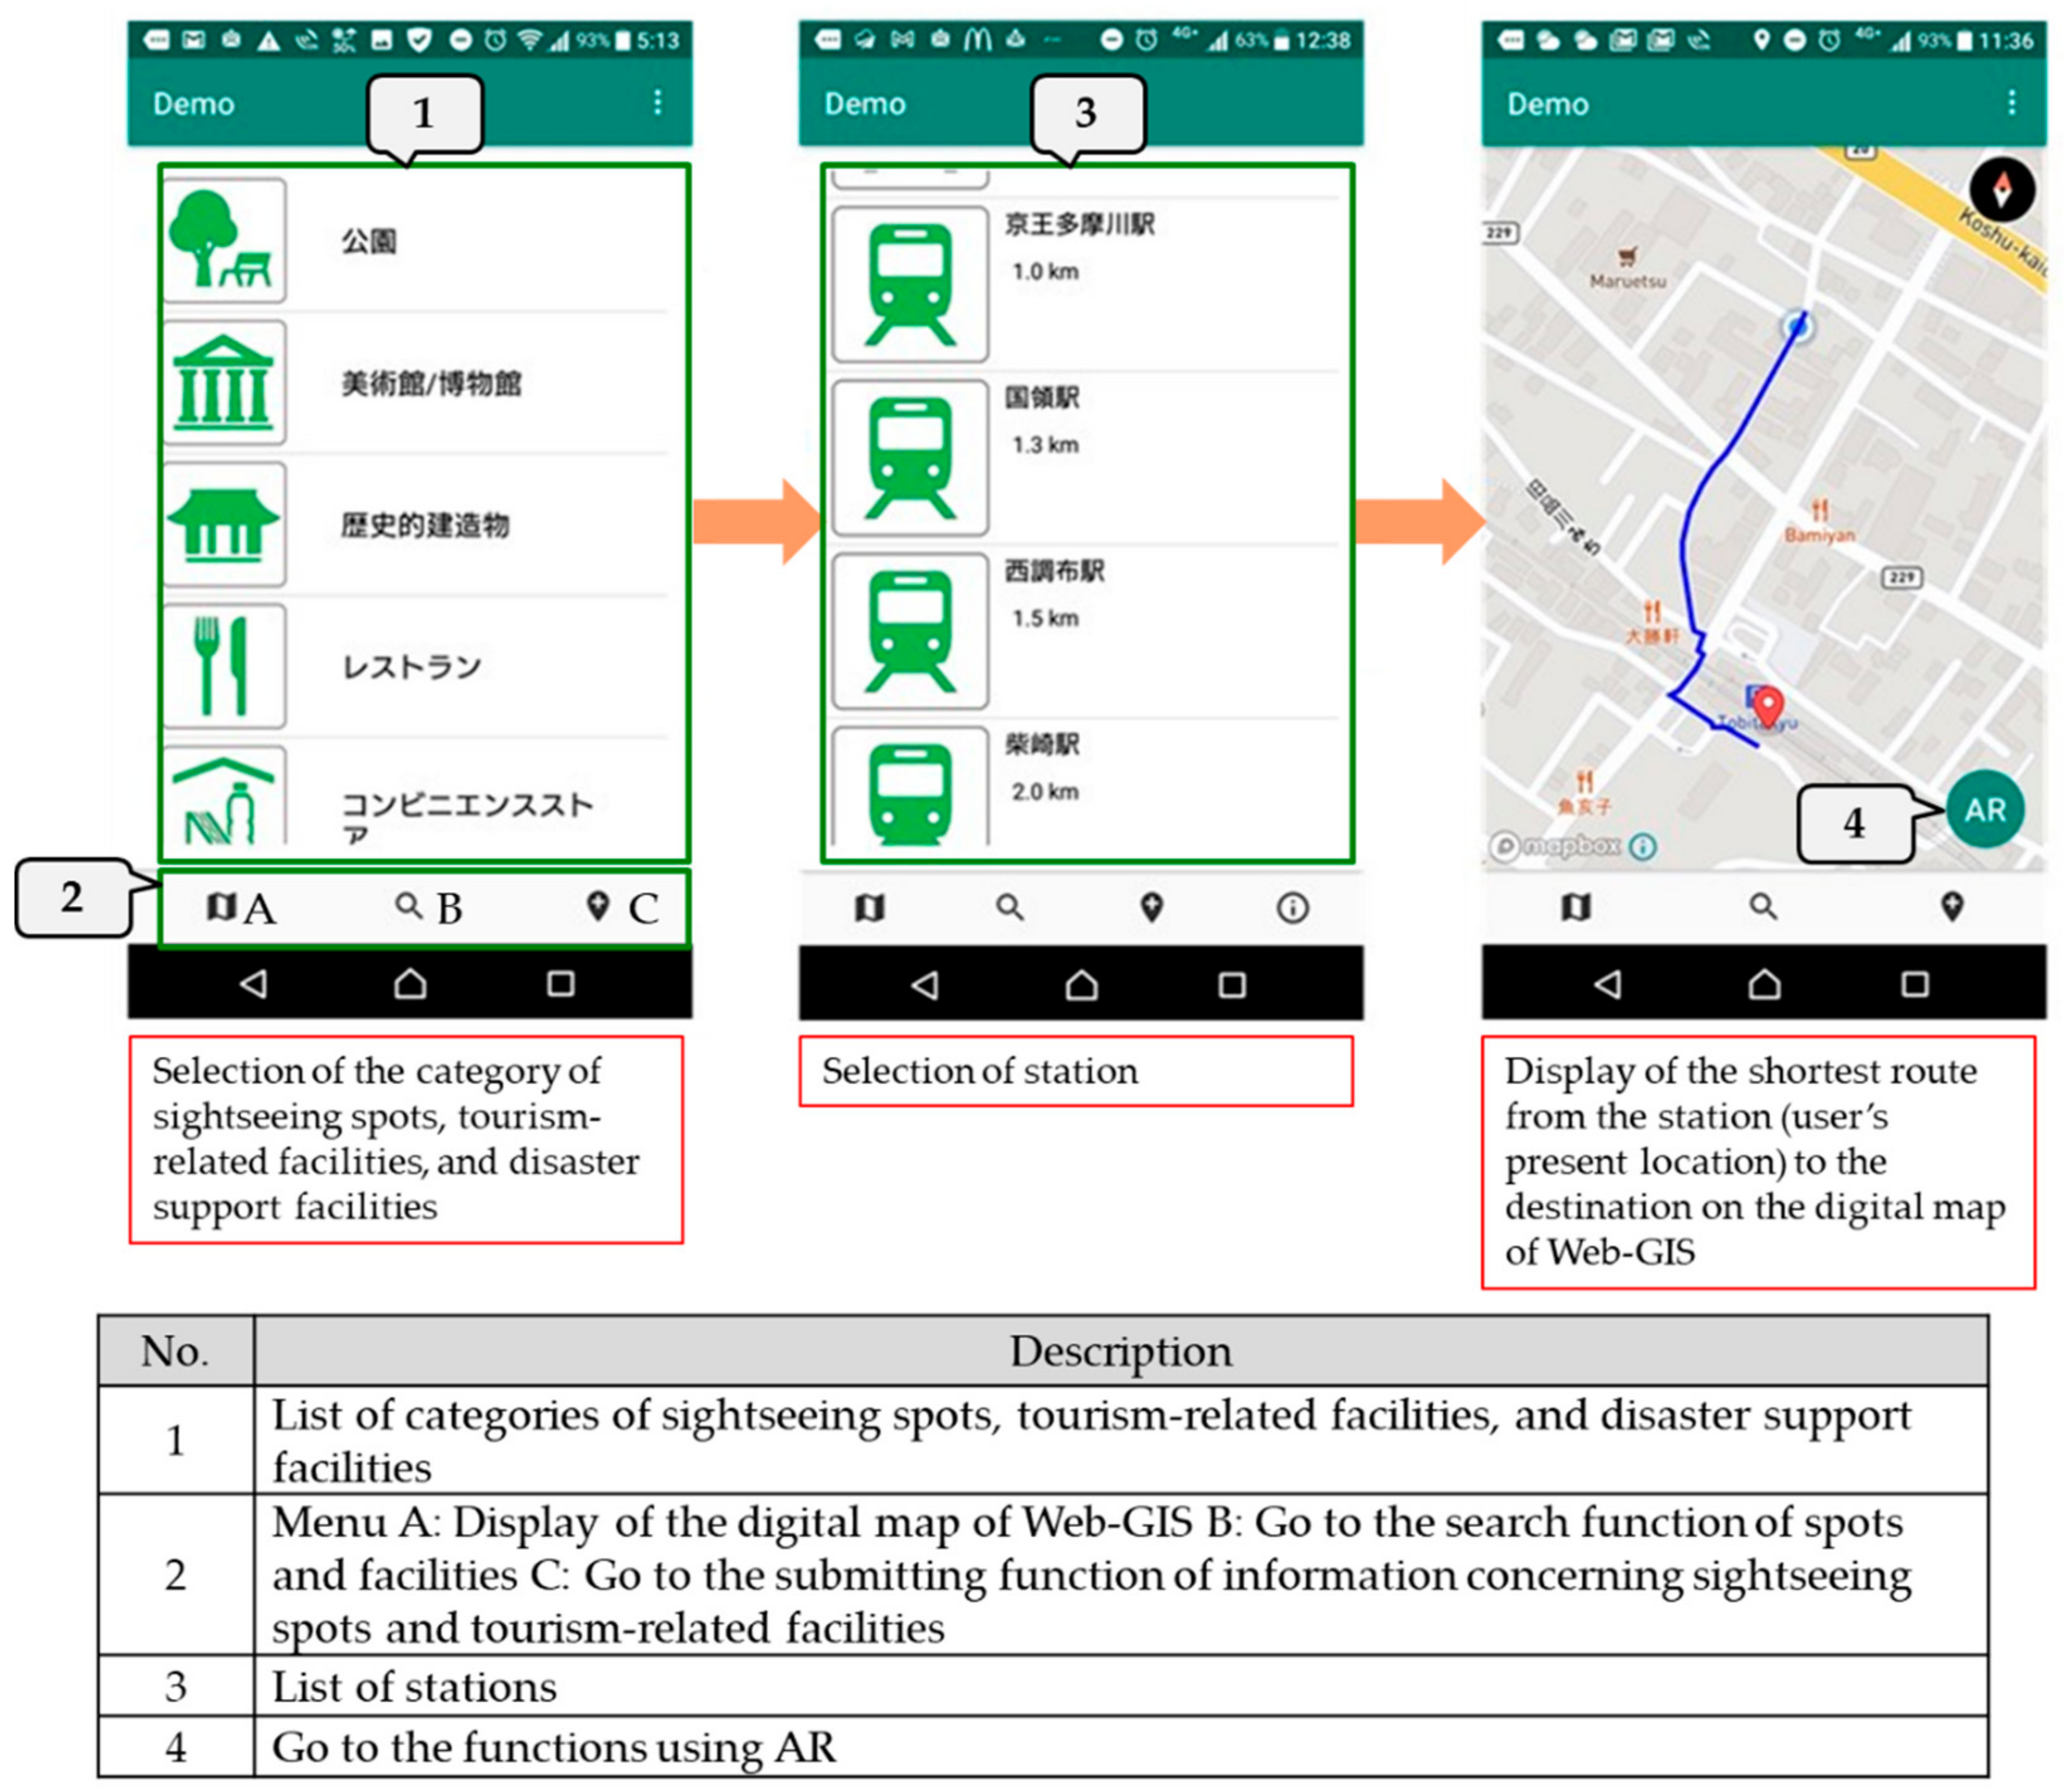
4.1.1. Search Function of Spots and Facilities

Figure 4 shows the screen for the search function of spots and facilities. When searching for a destination using the function, users select a category which the destination belongs to from among the pictograms list that is displayed. Then, a list of sightseeing spots, tourism-related facilities, and disaster support facilities under the selected category will be displayed on the screen. Users can select a destination from the above list and a station from among the station list. Next, the selected destination and station will be displayed on the digital map of Web-GIS. While using the GPS installed into the users’ mobile information terminals, the shortest route from the station to the destination will be displayed on the digital map. Additionally, using the function, users can search the alternative routes and display them on the digital maps of Web-GIS.

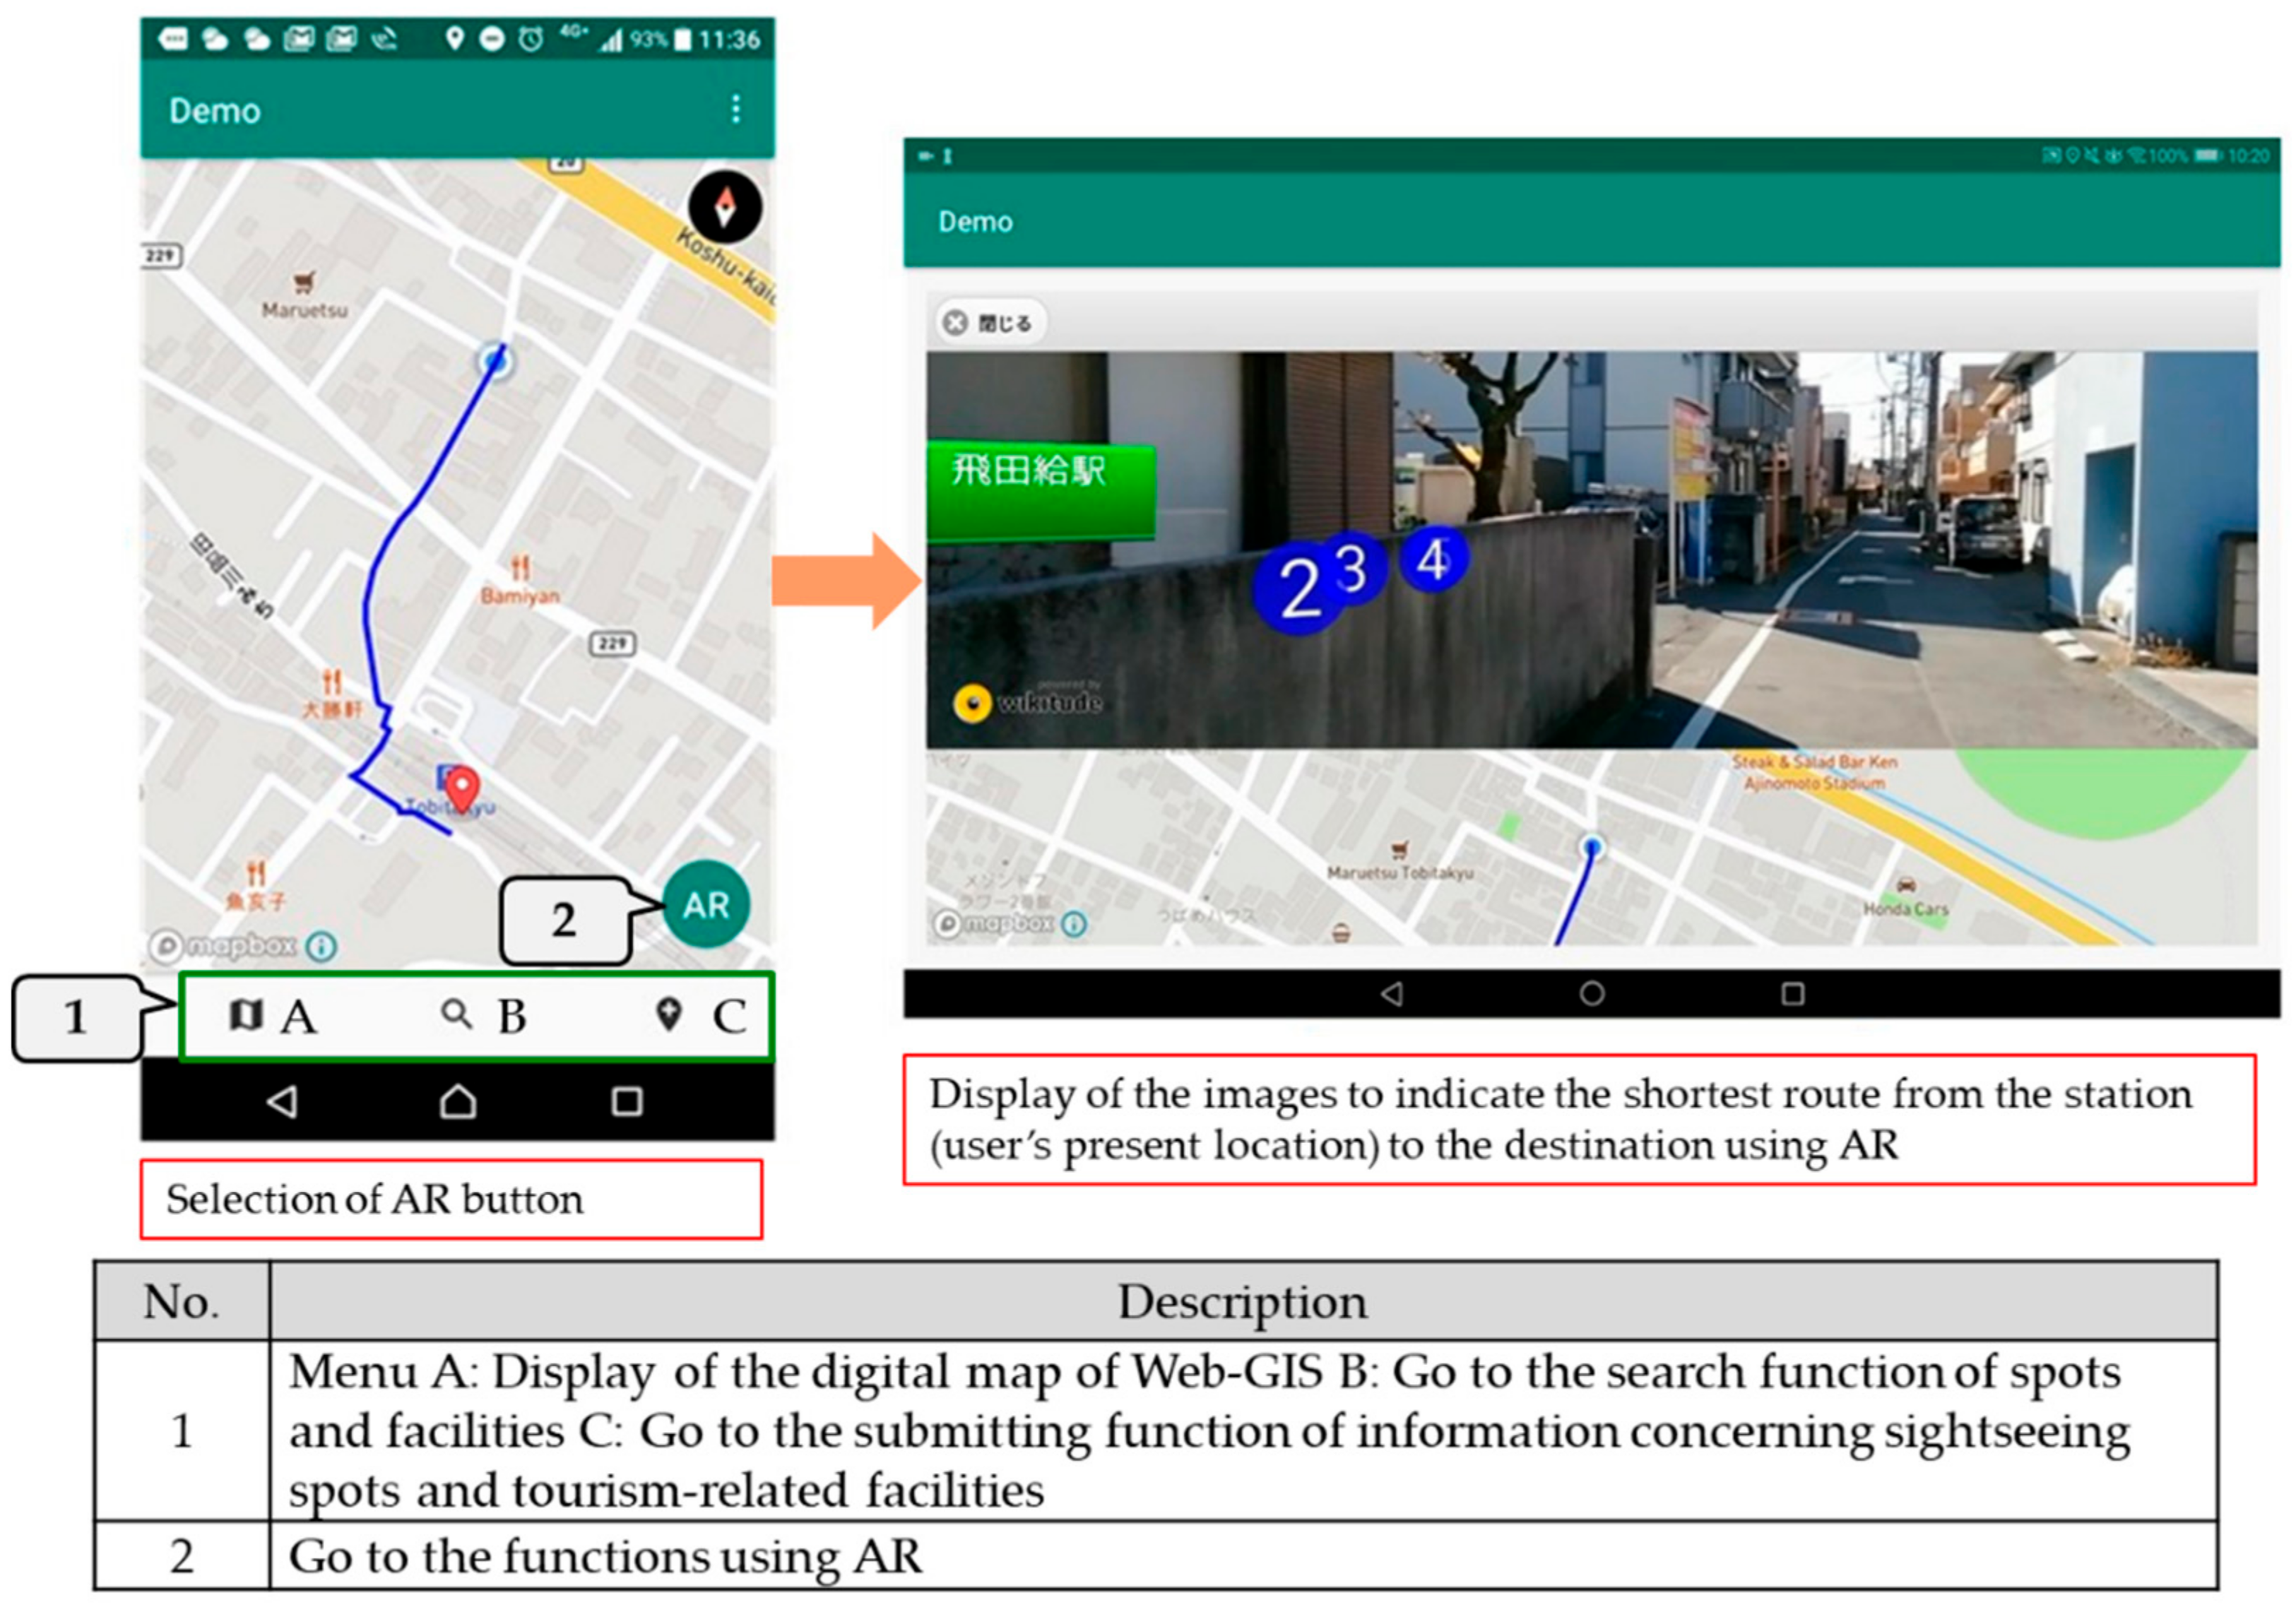
4.1.2. Navigation Function Using AR

Figure 5 shows the screen for the navigation function using AR. When users search for a sightseeing spot and a tourism-related facility using the spots and facilities search function, navigation to that destination is made available using AR. While the route to the destination is being displayed, users can select the AR button on the screen to enable the function. By selecting the AR button, an image of the spot or facility set as the destination, as well as an image of the route to the destination, will be displayed on the AR screen. In the image showing the route, numbers are applied to each part, enabling users to proceed in the order of those numbers to their destinations.

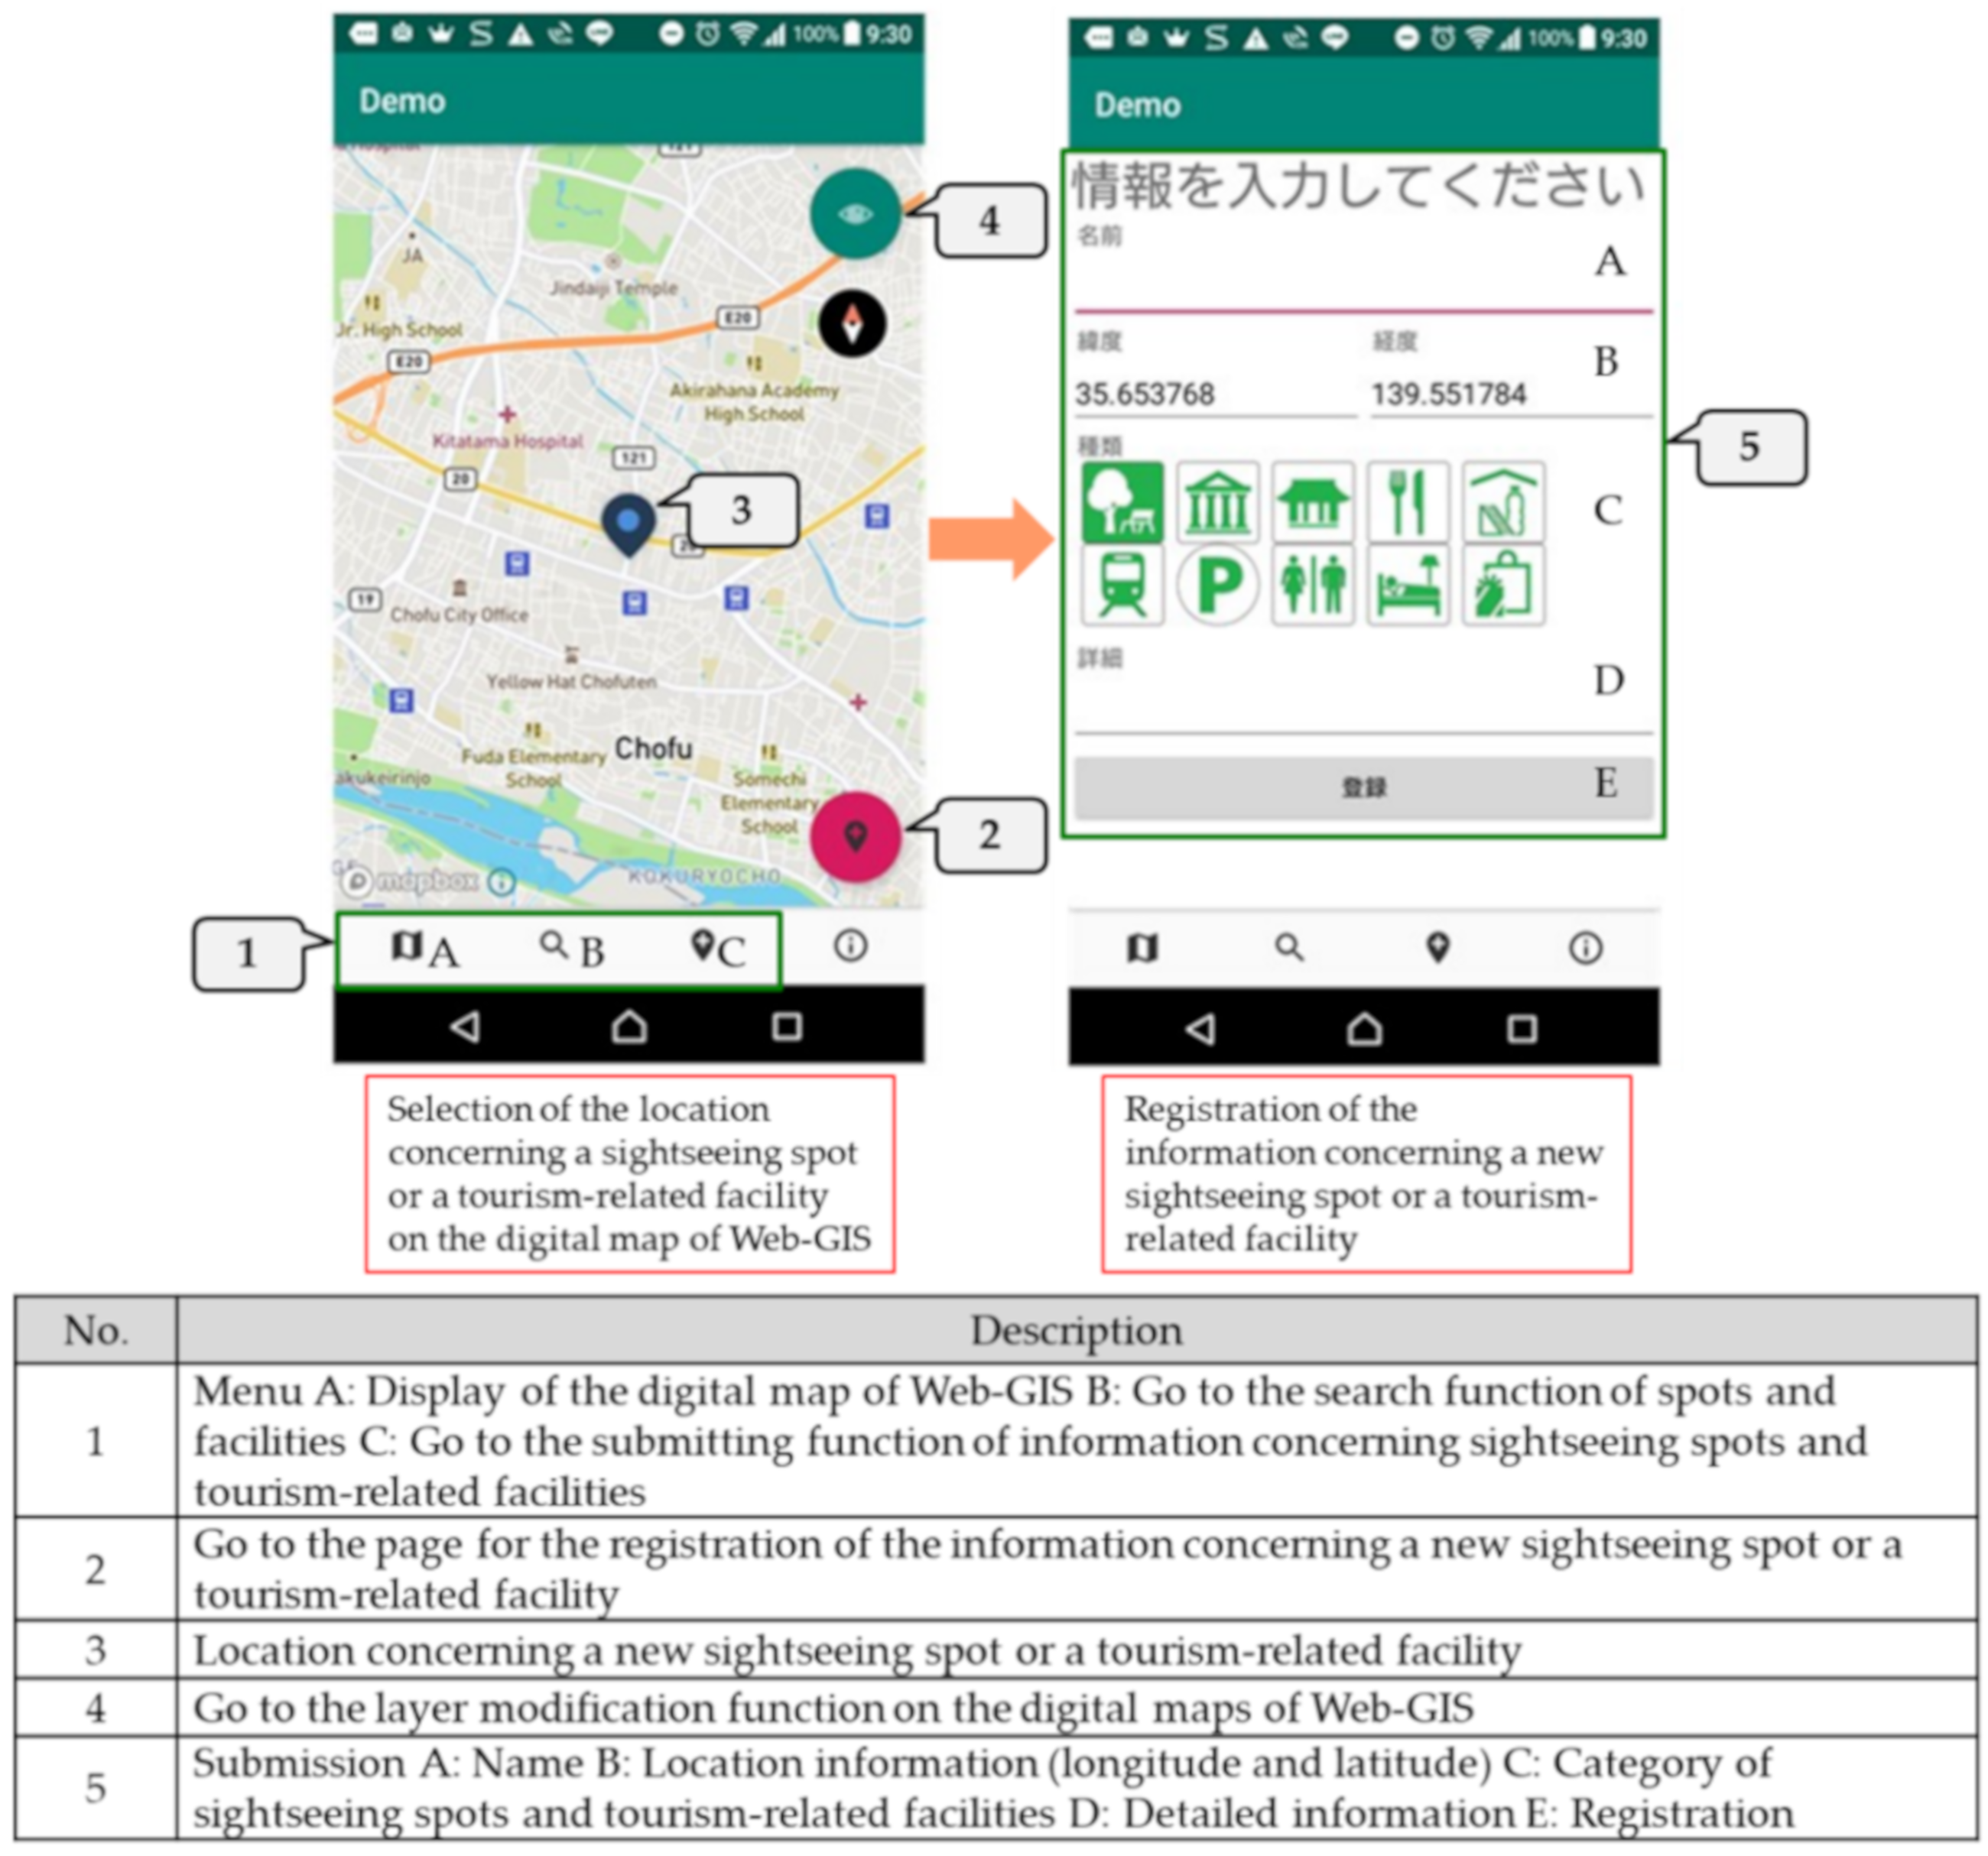
4.1.3. Submitting Function of the Information Concerning Sightseeing Spots and Tourism-Related Facilities

Figure 6 shows the screen for the submission function of information concerning sightseeing spots and tourism-related facilities. Users select a relevant location on the digital map of Web-GIS when submitting the information concerning a sightseeing spot or a tourism-related facility. They can submit information by entering the name and longitude and latitude of the sightseeing spot or tourism-related facility they wish to submit, as well as select the applicable category. The submitted information is immediately reflected in the database and displayed on the digital map, as well as in the list on the screen for the search function of spots and facilities. The submitting function enables users to not only register new information that has not yet been accumulated in the database of the system, but also share their favorite sightseeing spots and tourism-related facilities with other users.

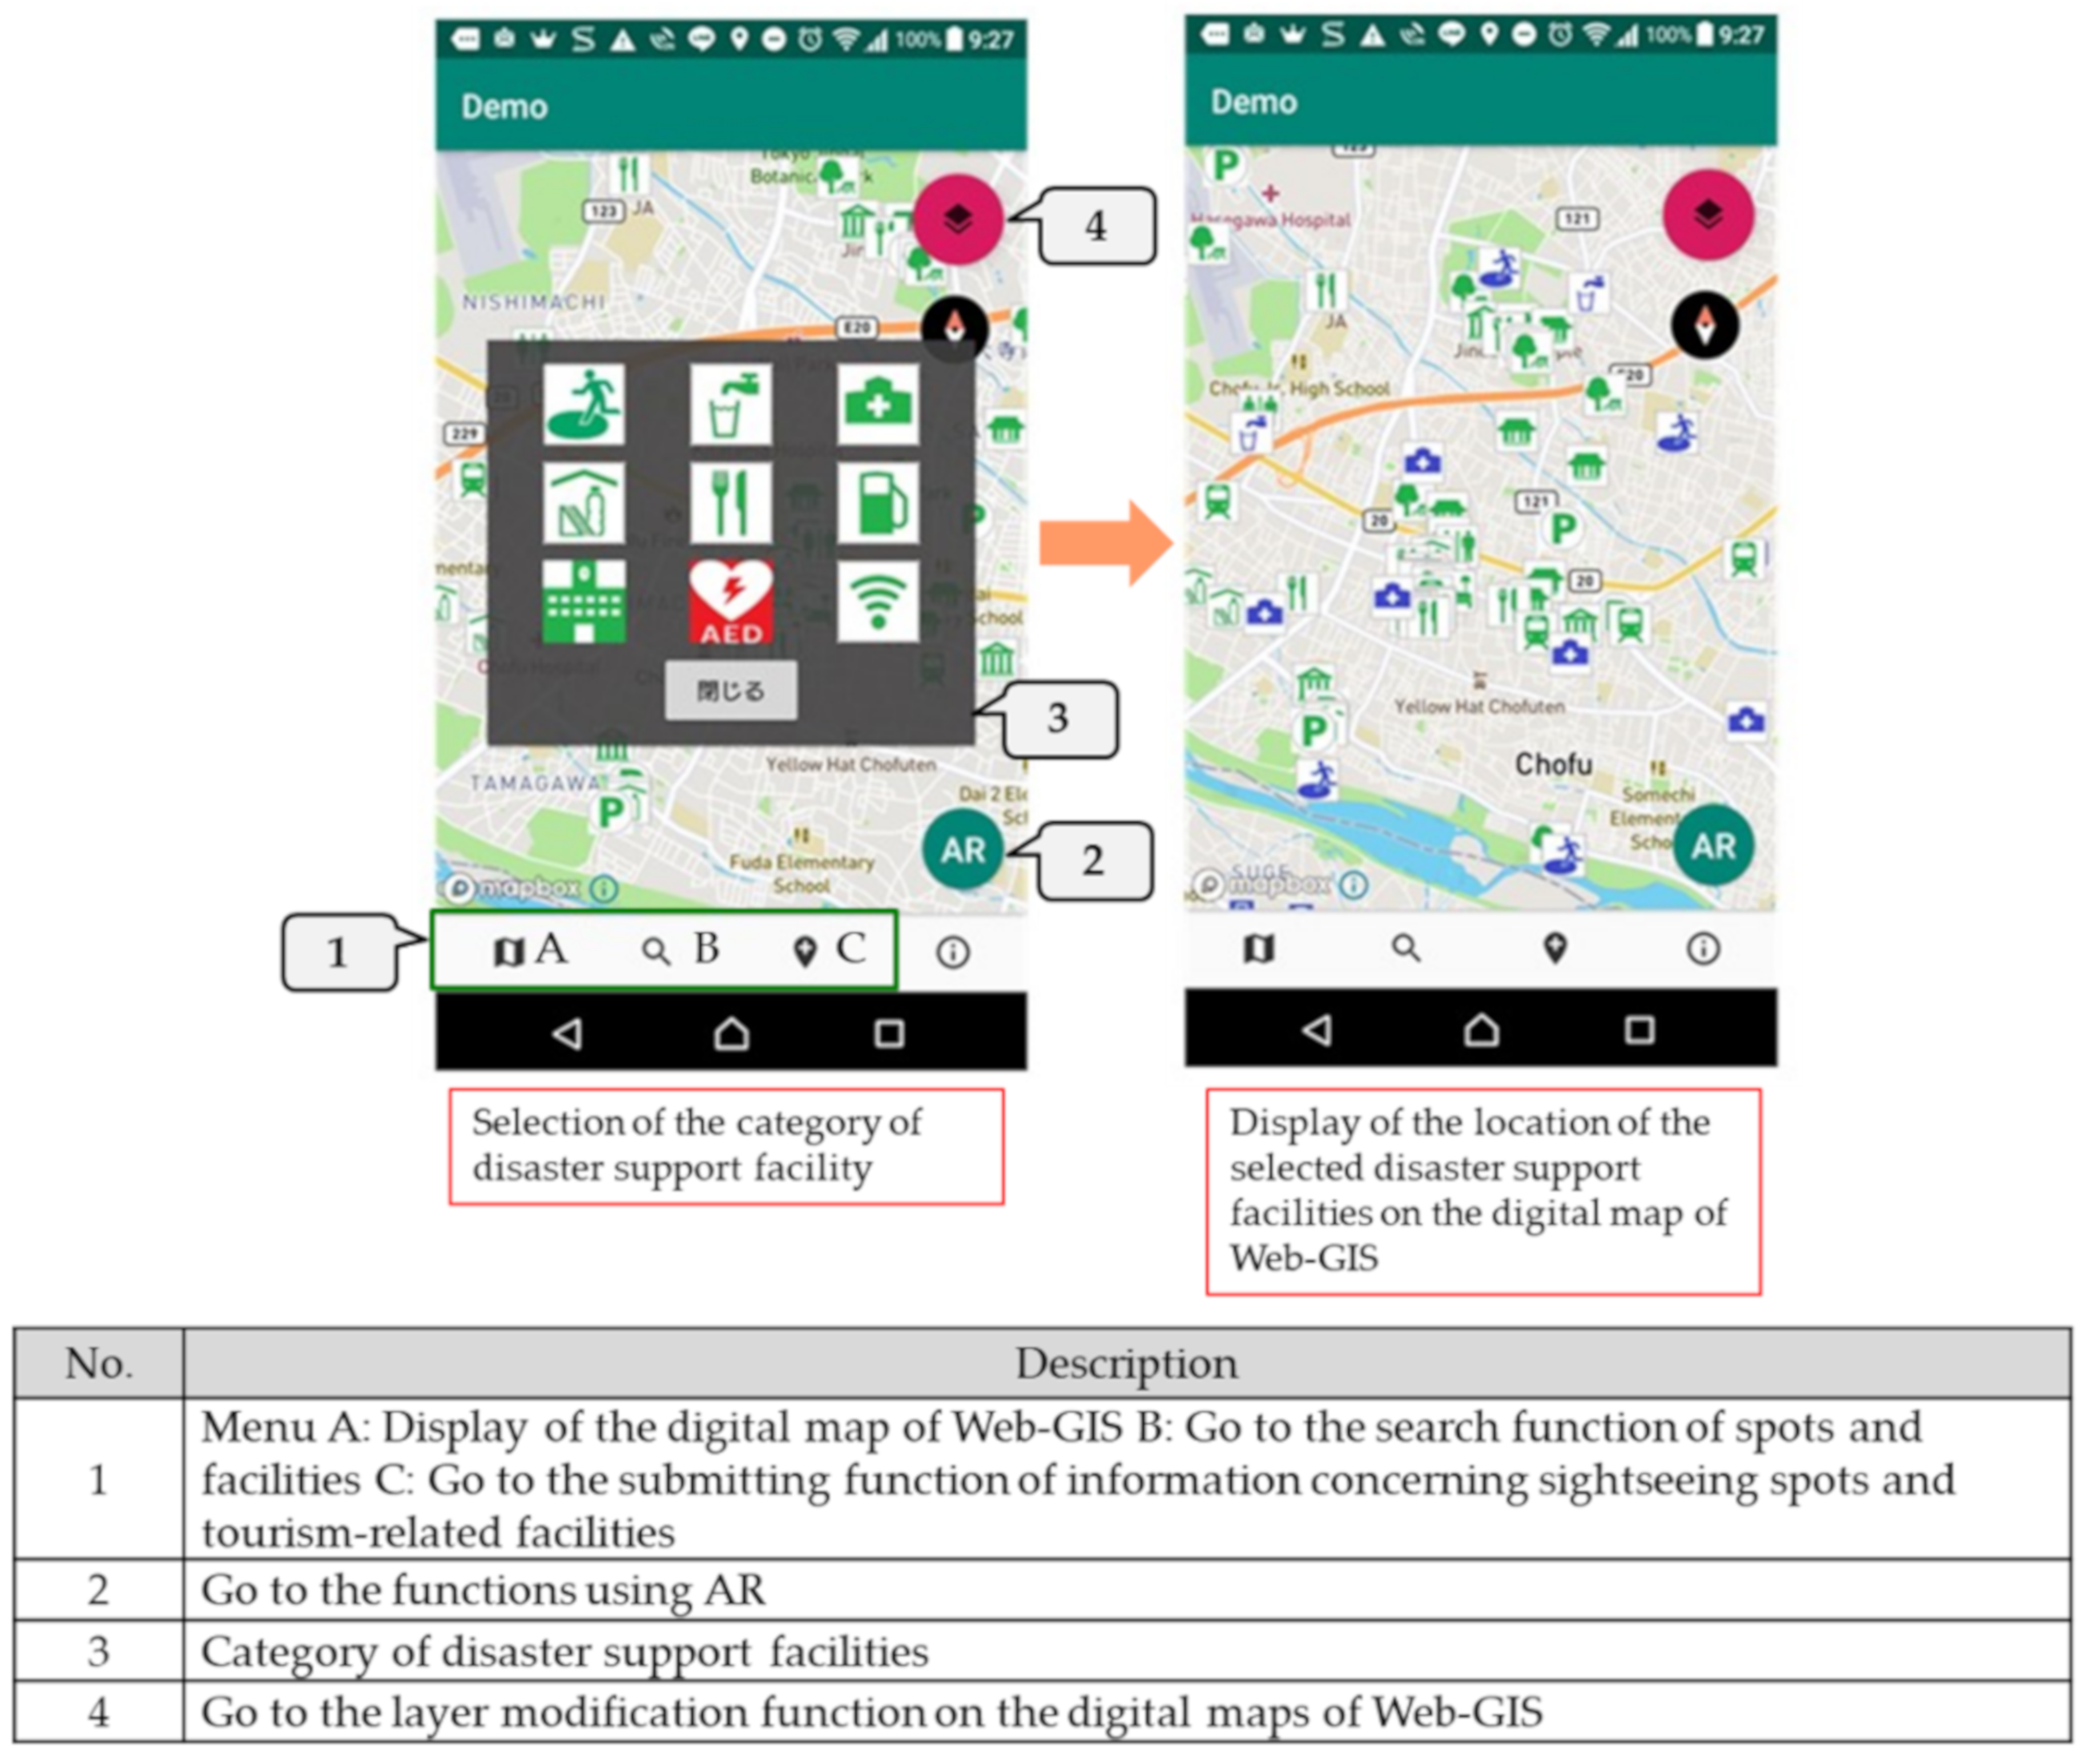
4.1.4. Layer Modification Function on the Digital Maps of Web-GIS

Figure 7 shows the screen for the layer modification function on the digital maps of Web-GIS. Using the function, users can modify the layers and display disaster support facilities on the digital map. The function enables users to confirm the locations of disaster support facilities on the digital map.

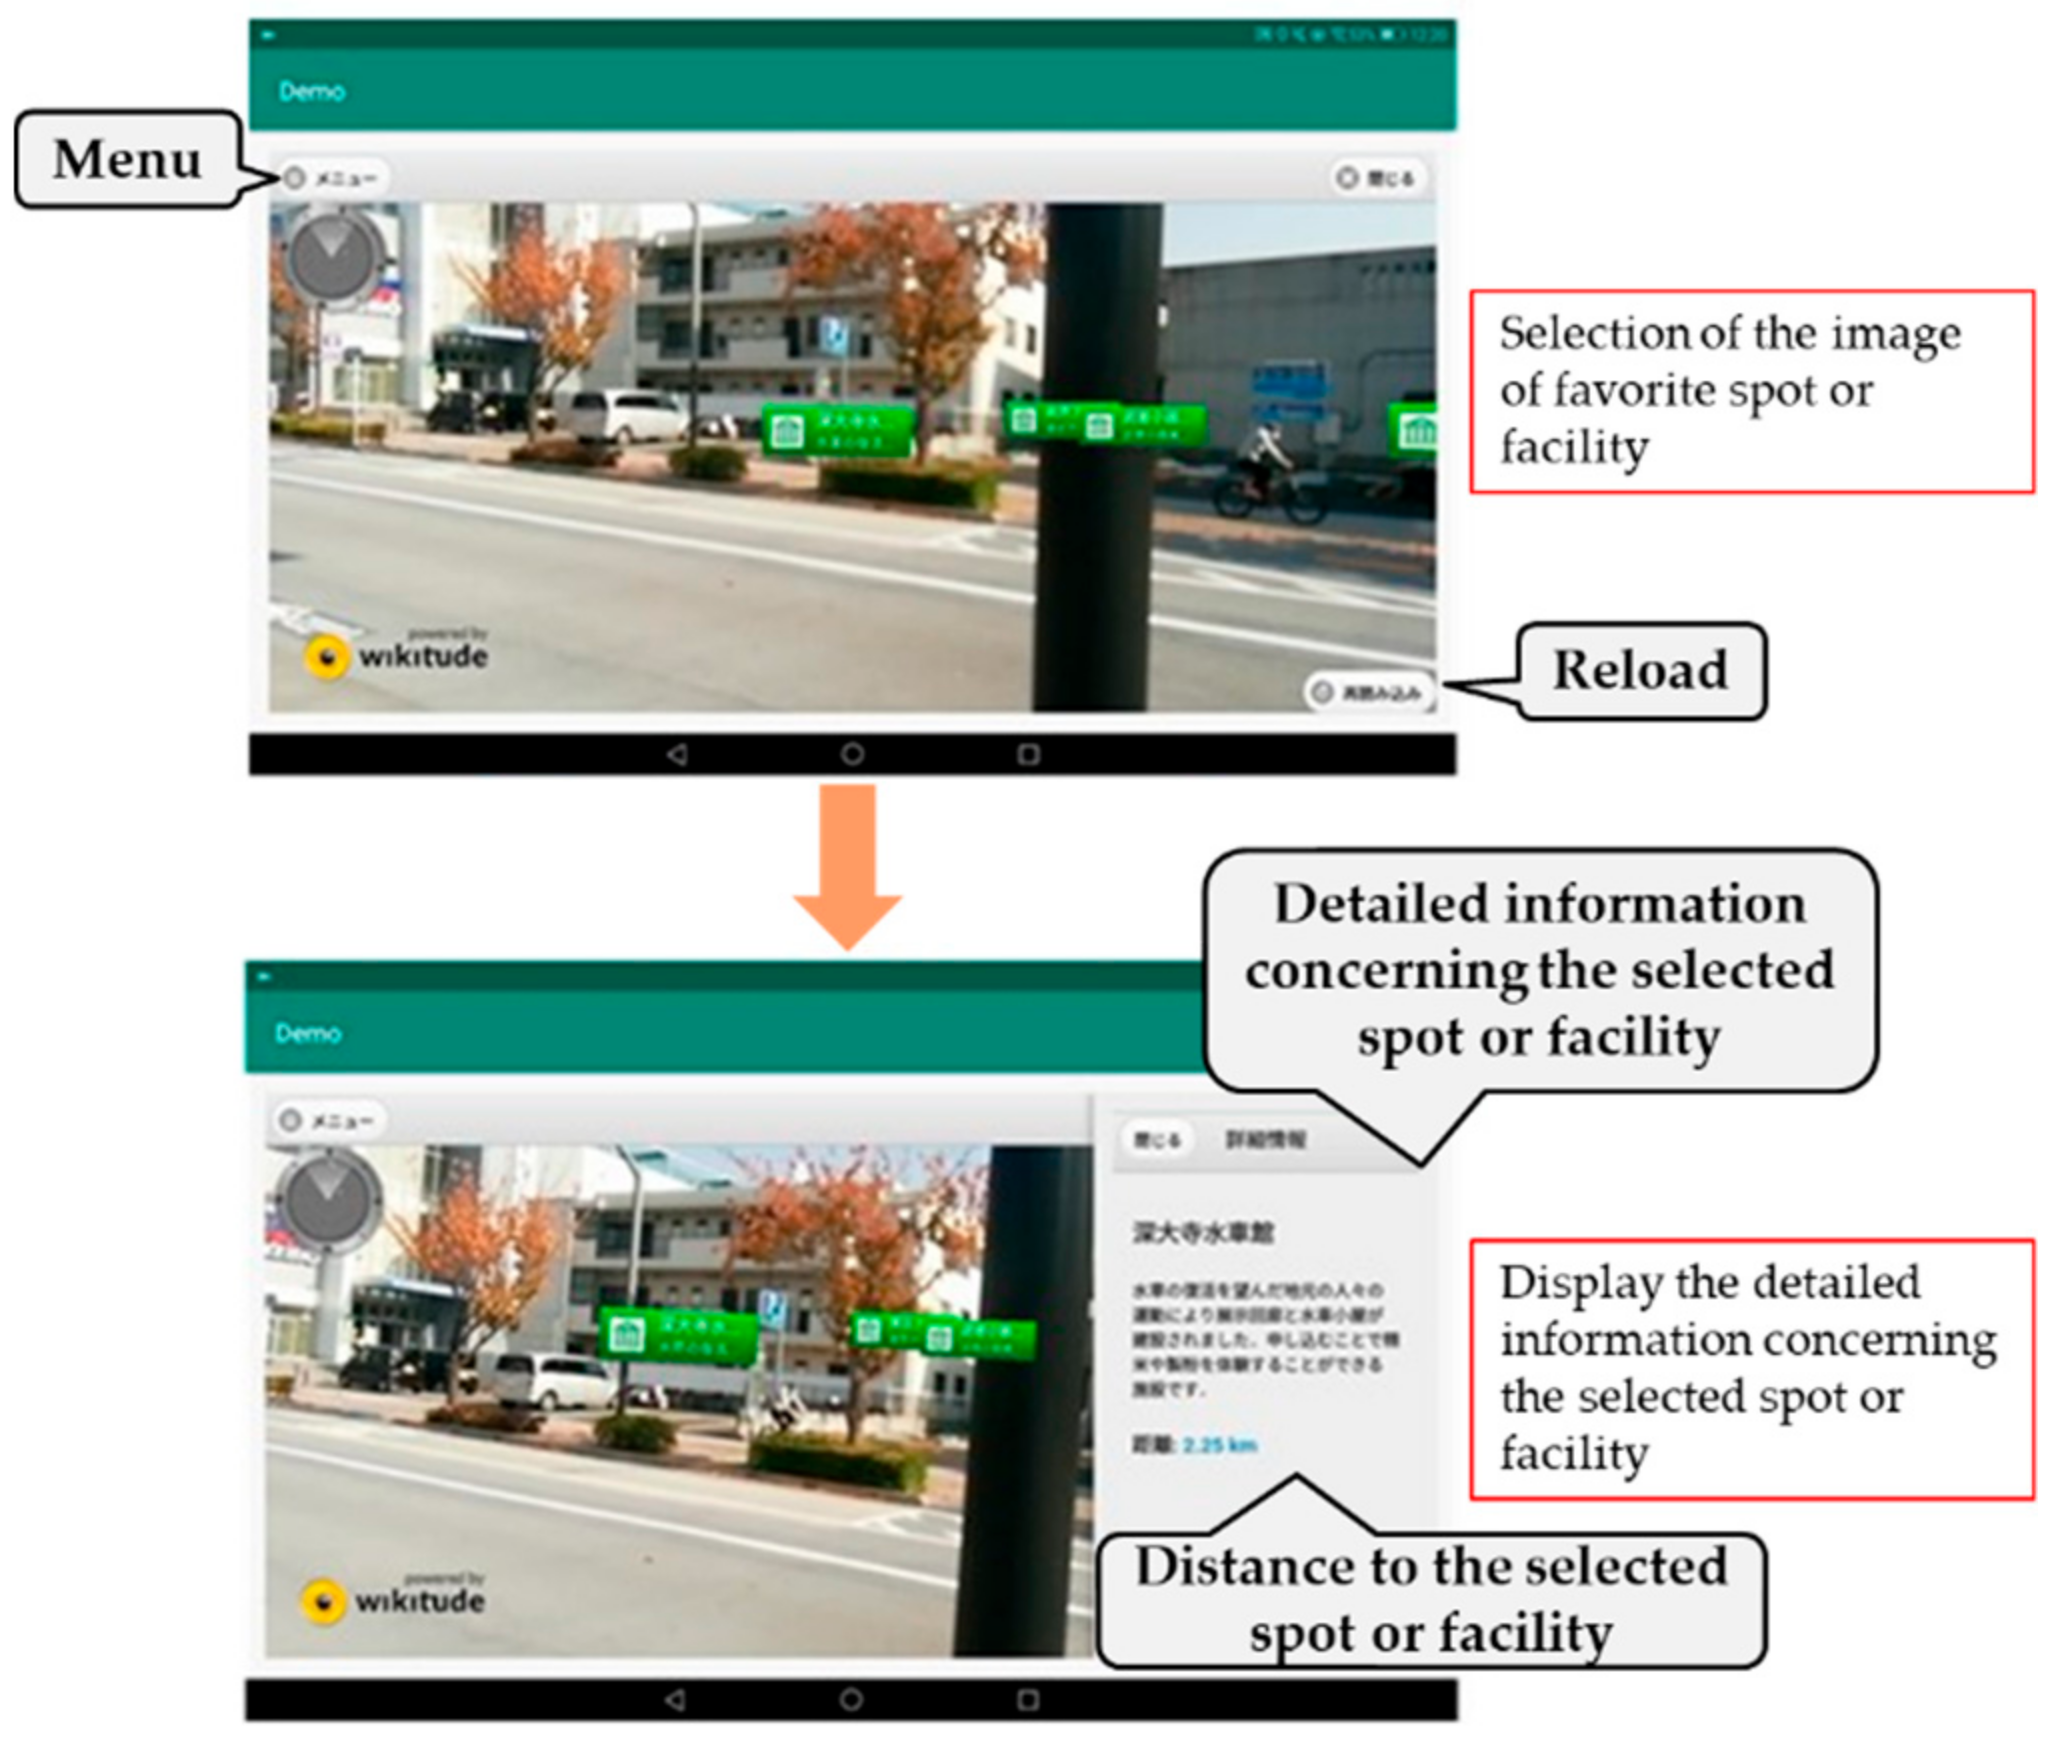
4.1.5. Display Function of Sightseeing Spots and Tourism-Related Facilities Using AR

Figure 8 shows the screen for the display function of sightseeing spots and tourism-related facilities using AR. The function can be used to display the closest 10 pictogram images of sightseeing spots and tourism-related facilities in the order of their proximity to the users’ present locations. By selecting any image, the user can confirm its name and the distance to the location of that image on the screen.

4.2. Backend of the System

The backend of the system performs the following four processes.

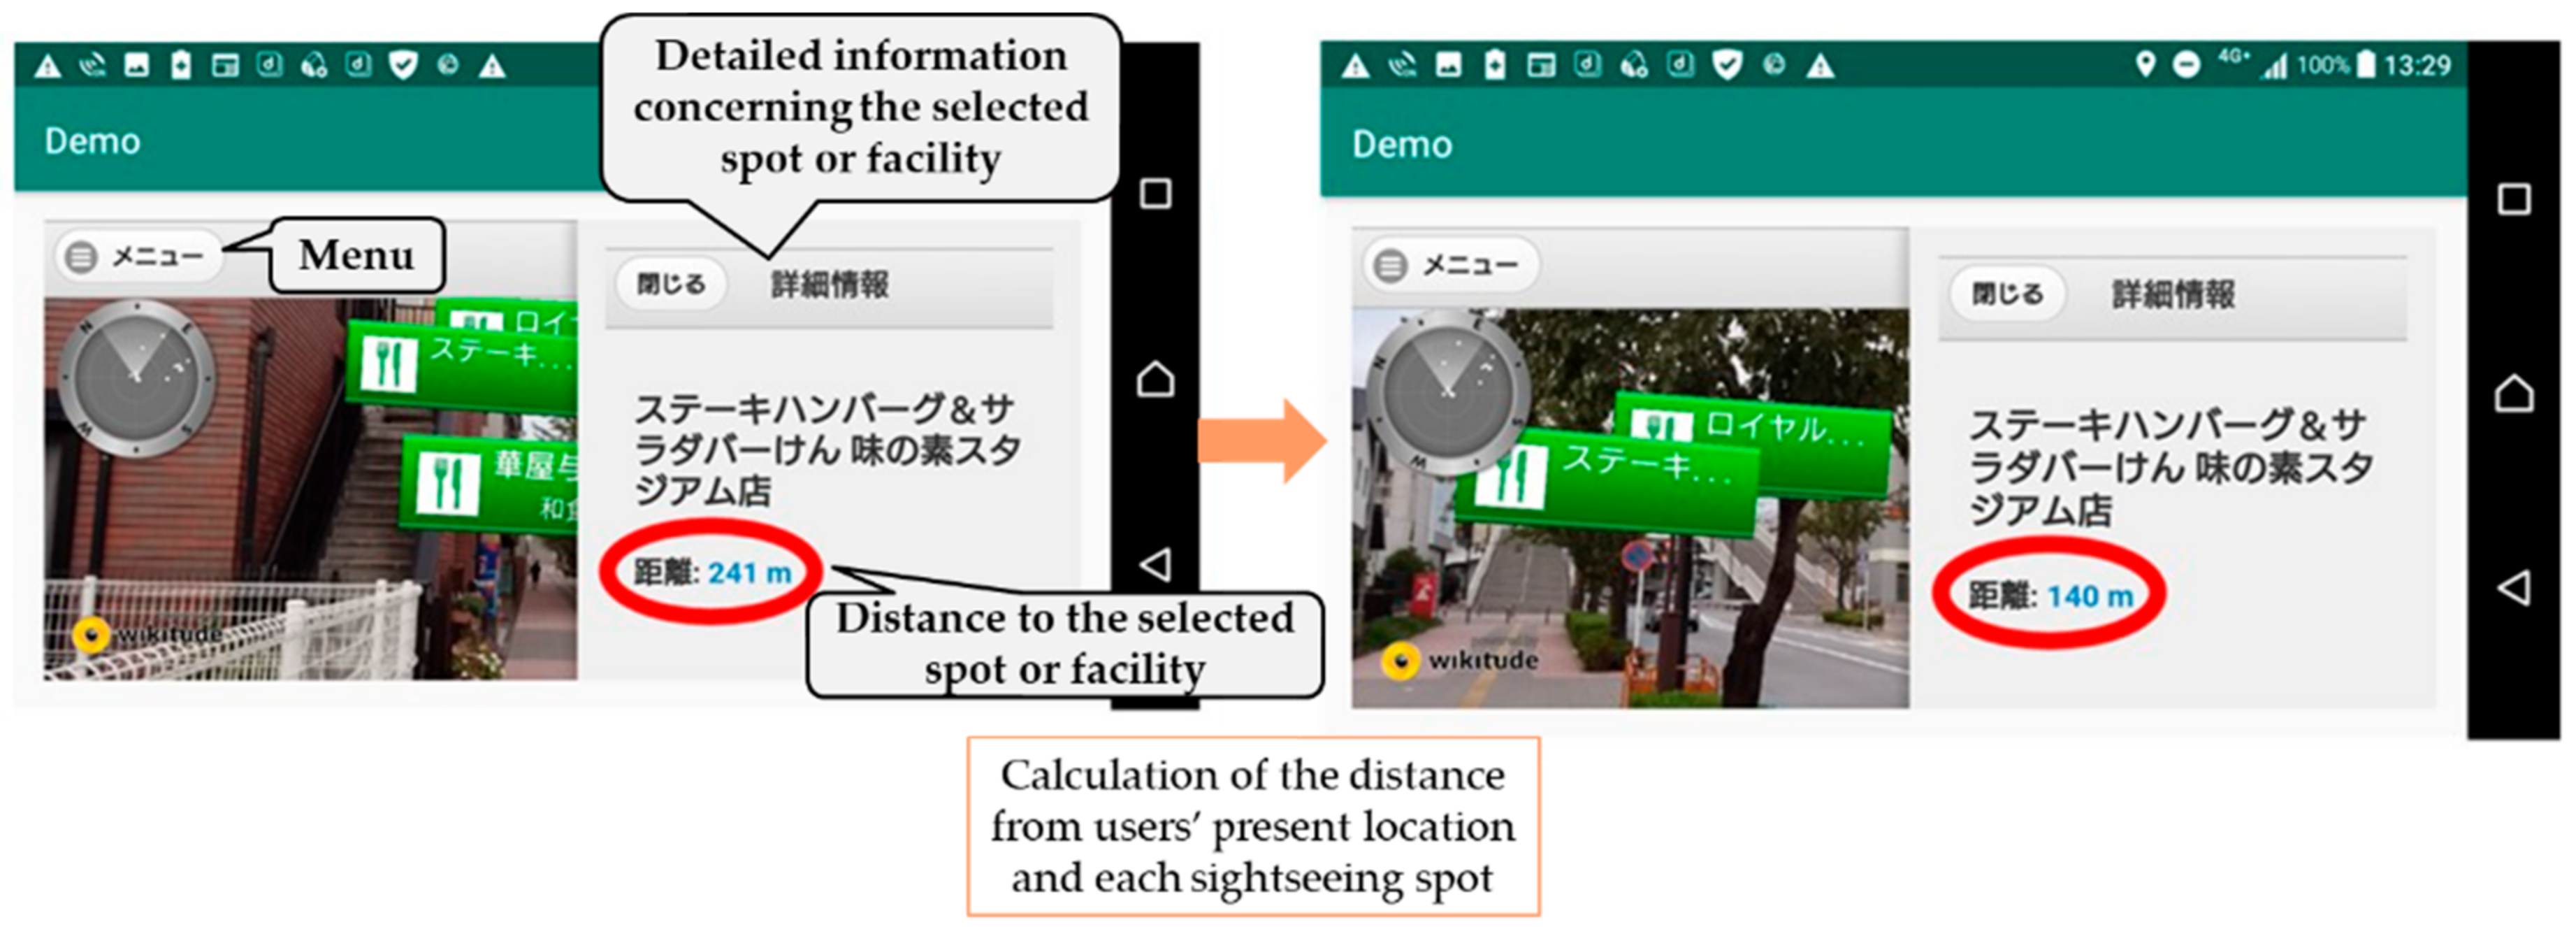
4.2.1. Update of the Distance Information and Location Information Using a GPS

In the system, the users’ present locations are determined using the GPSs installed into their mobile information terminals. When the users’ present locations are updated, the distances to all sightseeing spots and tourism-related facilities are displayed as images on the AR screens, which are are also updated. As the updated distance information is reflected on a real-time basis, a user can know the distance to each sightseeing spot by simply tapping on the image displayed on the AR screen. Figure 9 shows the real-time updates of distance information. Users can grasp the distances to their destinations, as the distance information that is updated is reflected in the system in real-time.

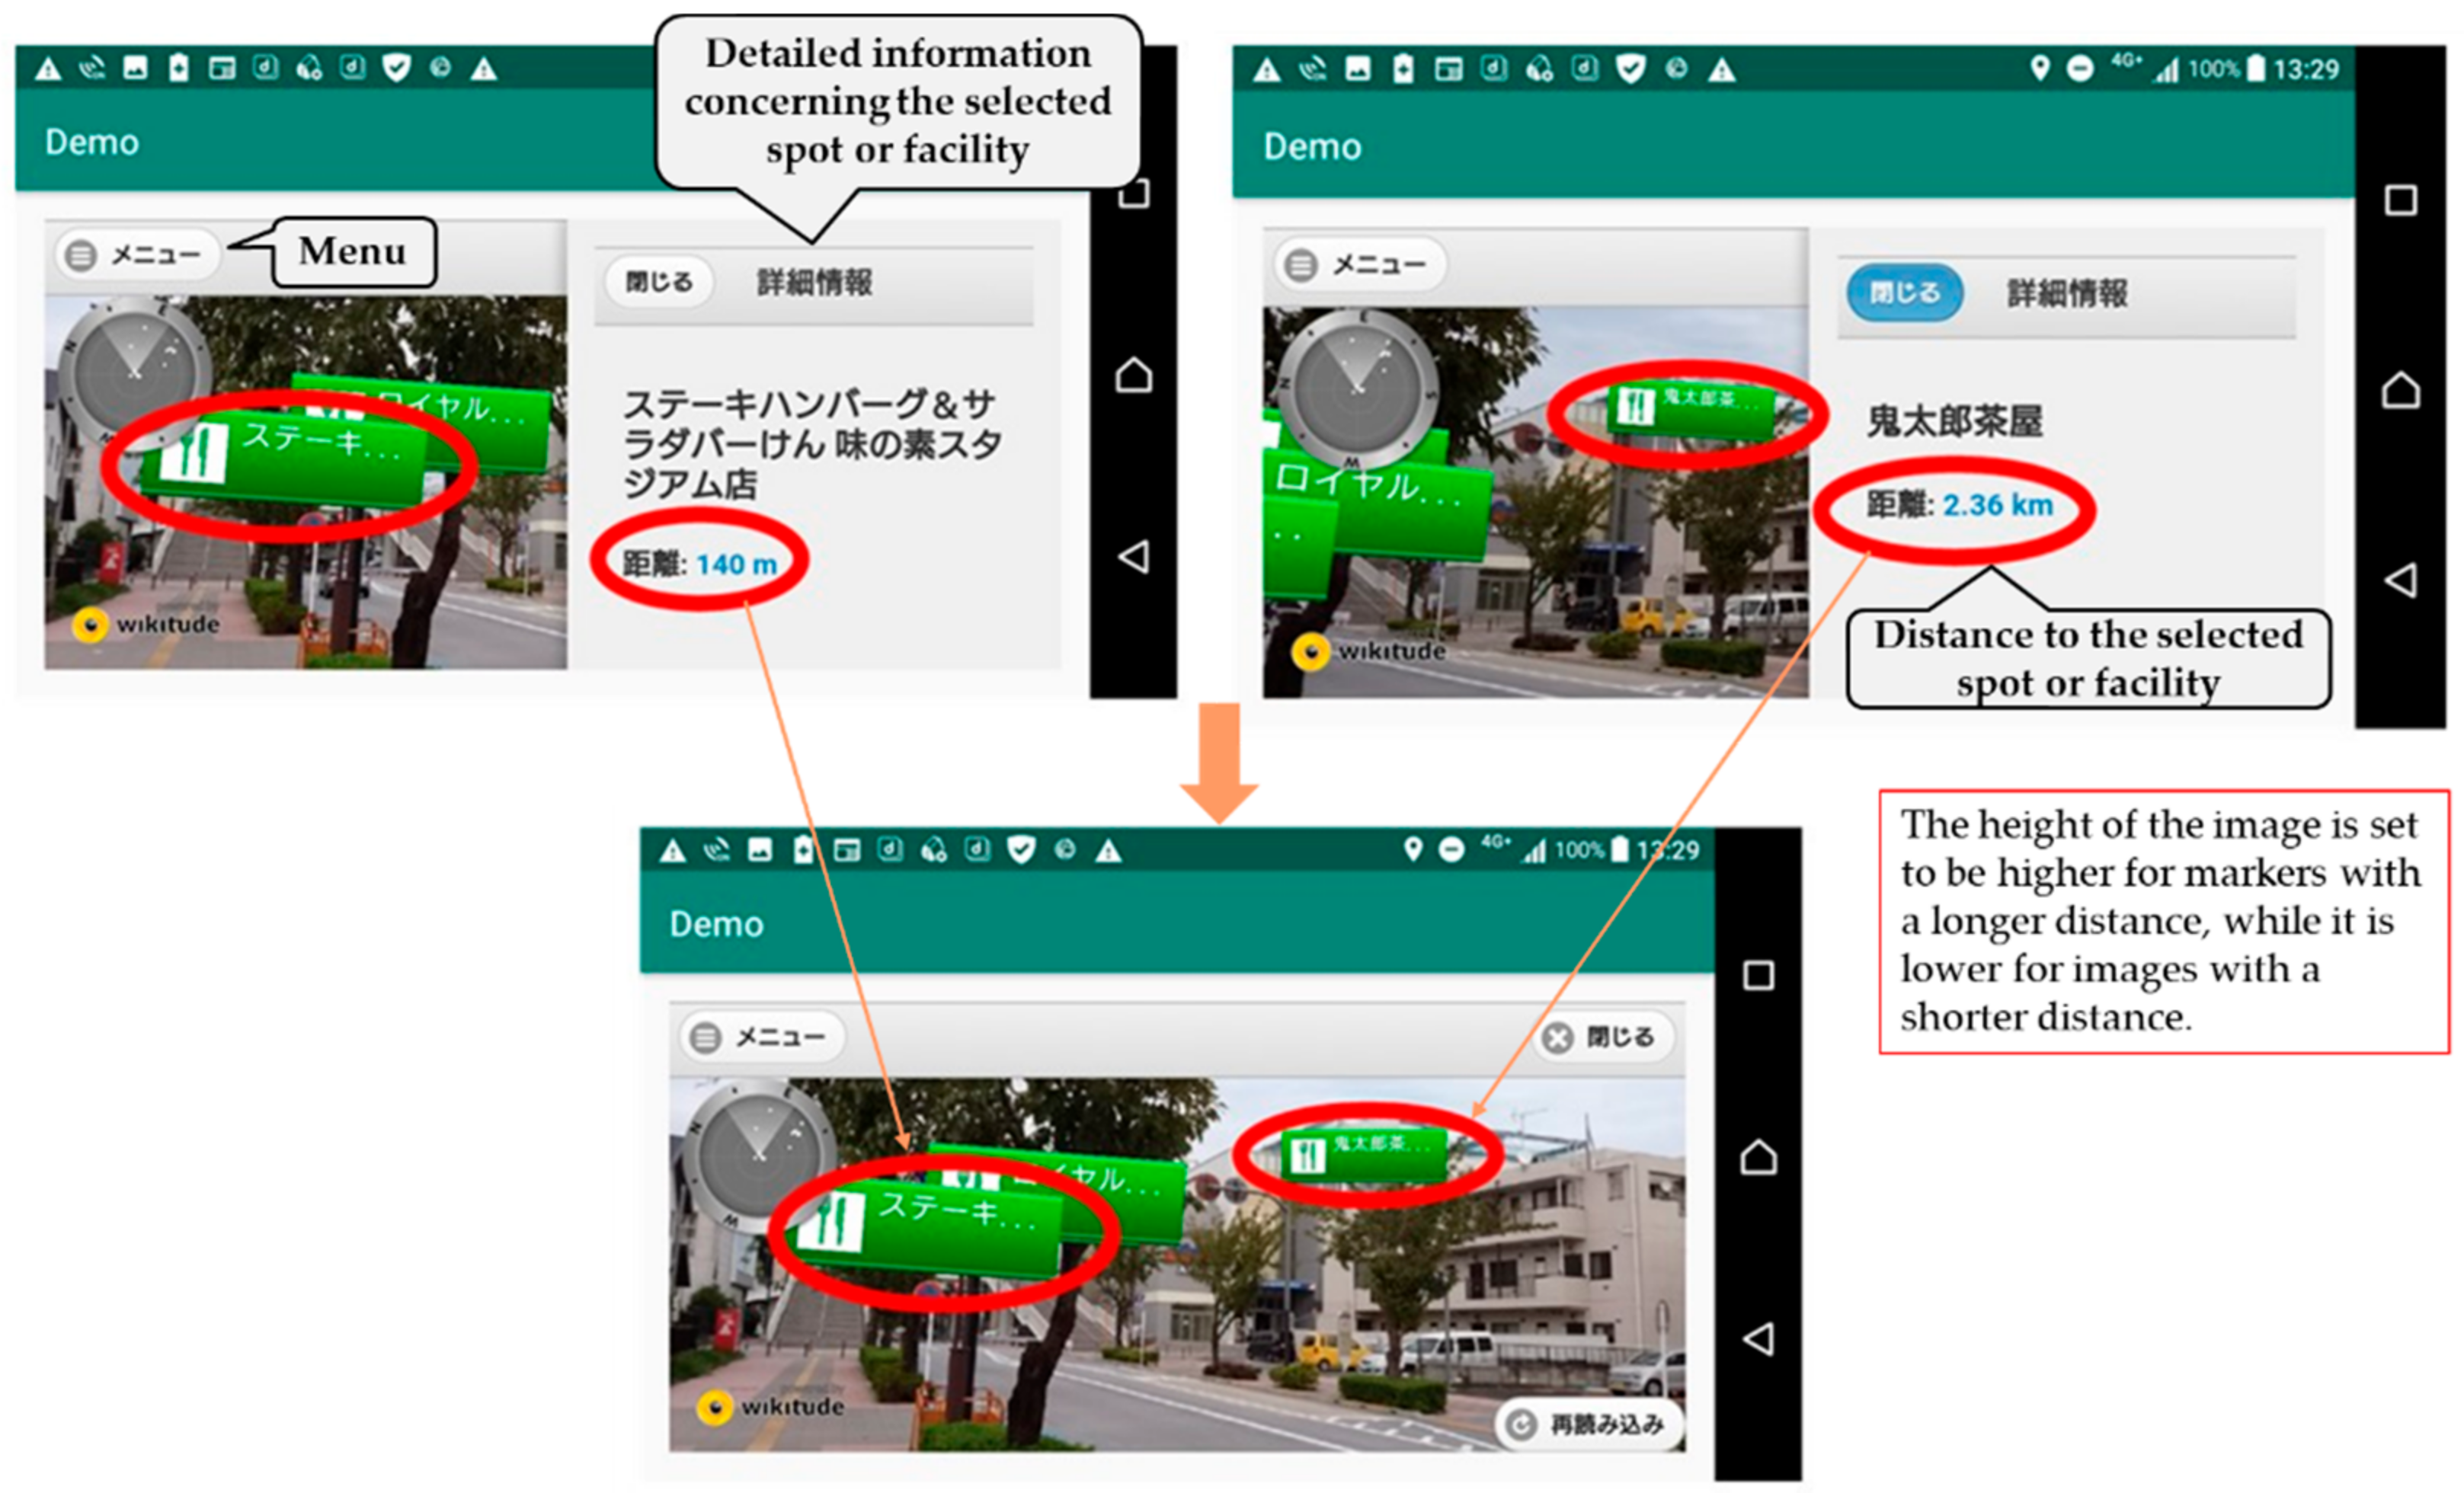
4.2.2. Height Modification of the Images of Sightseeing Spots and Tourism-Related Facilities Based on the Updated Distance Information

When the distance information is updated, images of sightseeing spots and tourism-related facilities that are further from the users’ present locations are positioned higher, while those closer are positioned lower on the screen by means of AR. This reduces the possibility of images overlapping and helps users intuitively grasp the sightseeing spots and tourism-related facilities that are close to their present locations. Additionally, the size of the images of sightseeing spots and tourism-related facilities are modified according to the distance from the users’ present locations. Figure 10 indicates that the height of the images of the sightseeing spots and tourism-related facilities are modified based on the updated distance information.

4.2.3. Data Management in PostgreSQL

The system adopts PostgreSQL for the data management of sightseeing spots and tourism-related facilities. All information concerning sightseeing spots and tourism-related facilities accumulated in the system are managed in the database. Administrators can easily register, edit, and delete the information in the database.

4.2.4. Data and Folder Management in Android Studio

The system adopts Android Studio for the data and folder management. In the system, files that manage information concerning disaster support facilities, as well as the Java and HTML files that make up the system, are all managed within Android Studio. When administrators update the application, data are updated within Android Studio, and an apk file is generated. The generated file is uploaded to the online storage, and once the users install this file into their mobile information terminals, the application is updated.

4.3. Interface

The system is divided into two interfaces: Web-GIS and AR. As shown in Figure 6 and Figure 7, users can utilize the five functions in the frontend by selecting a button on the screen while the digital map of Web-GIS is displayed. Additionally, as shown in Figure 8, pictogram images of sightseeing spots and tourism-related facilities, which are displayed on the digital map of Web-GIS, are also displayed on the AR screen. By selecting a pictogram, the name of the spot or facility as well as the distance to that location are displayed. As the functions using AR can be selected from the menu at the top of the AR screen, users who are not familiar with how to operate applications can also utilize the system. Additionally, as shown in Figure 8 and Figure 10, the reload button in the bottom-right corner of the AR screen can be used to load the images to be displayed and recalculate their distances.

5. Operation

5.1. Selection of the Target Operation Area

Chofu City in the Tokyo Metropolis was selected as the operation target area for the system. The reasons for this selection were as follows: (1) there are many famous sightseeing spots scattered throughout the city, and (2) there is a high risk of wind and flood damage, such as heavy rains and typhoons in addition to inland earthquakes in Tokyo. In particular, the Tama River flows within the city, and many buildings have been flooded during past heavy rain disasters. Much damage was caused near the Tama River in Chofu City due to Typhoon Hagibis in October 2019. Therefore, Chofu City is an area suitable for the operation of the system.

5.2. Operation

5.2.1. Operation Overview

The operation of the system was conducted over a period of 6 weeks (23 November 2020–3 January 2021) with people inside and outside of the operation target area as the subjects. Use of the system was promoted through the website and the Twitter and Facebook accounts of the author’s lab. Additionally, the Tourism Department of Chofu City and the tourism association cooperated by handing out pamphlets and operating manuals.

5.2.2. Operation Results

Table 1 shows the overview of the system users. There was a total of 60 people, made up of 29 males and 31 females. Regarding age groups, 43% were those in their 20s, making it the largest percentage for both males and females, followed by those in their 60s, covering 17%, those in their 50s made up 13% of the group, and those in their 40s were 12% of the group. This suggests that the system was used not only by youths but also by various age groups.

6. Evaluation

After the operation was complete, a questionnaire survey for users and the access log analysis were conducted in order to evaluate the system.

6.1. Evaluation Based on the Questionnaire Survey

6.1.1. Overview of the Questionnaire Survey

A questionnaire survey was conducted to (1) evaluate the compatibility with the method to obtain information, (2) evaluate the originality of the system, and (3) evaluate the usefulness of the overall system, according to the purpose of the present study. The questionnaire survey was conducted on the website 1 week after the start of the operation. Table 1 also includes the overview of the questionnaire survey respondents. As shown in Table 1, the response rate was 100%, with all 60 users responding to the questionnaire survey. Additionally, regarding the answering tendency, there was no difference between different age groups.
Regarding the frequency of visits to Chofu City, 30% answered that they had “never visited”, 20% answered they “commute to Chofu City for work or school”, 18% answered they “live in Chofu City”, and 32% answered they “visit a few times a week”. Therefore, it can be said that over 60% of the users did not have a sense of locality, as they did not frequently visit Chofu City. Additionally, regarding the disaster support facilities within Chofu City, 78% answered that they “don’t know at all” or “don’t know much”, and 22% answered they “know a little” or “know very well”. Therefore, it was evident that many users did not have sufficient knowledge concerning disaster support facilities within Chofu City.

6.1.2. Evaluation Concerning the Compatibility with the Method to Obtain Information

Regarding the use of applications using AR, 20% of the users used them regularly, while 80% did not regularly use them. However, 89% of the users obtained sightseeing information, and 85% obtained disaster information using the Internet. From these, while many users were not familiar with applications using AR, there was a need for the system, as it effectively provided information concerning sightseeing spots, tourism-related facilities, and disaster support facilities through the Internet.

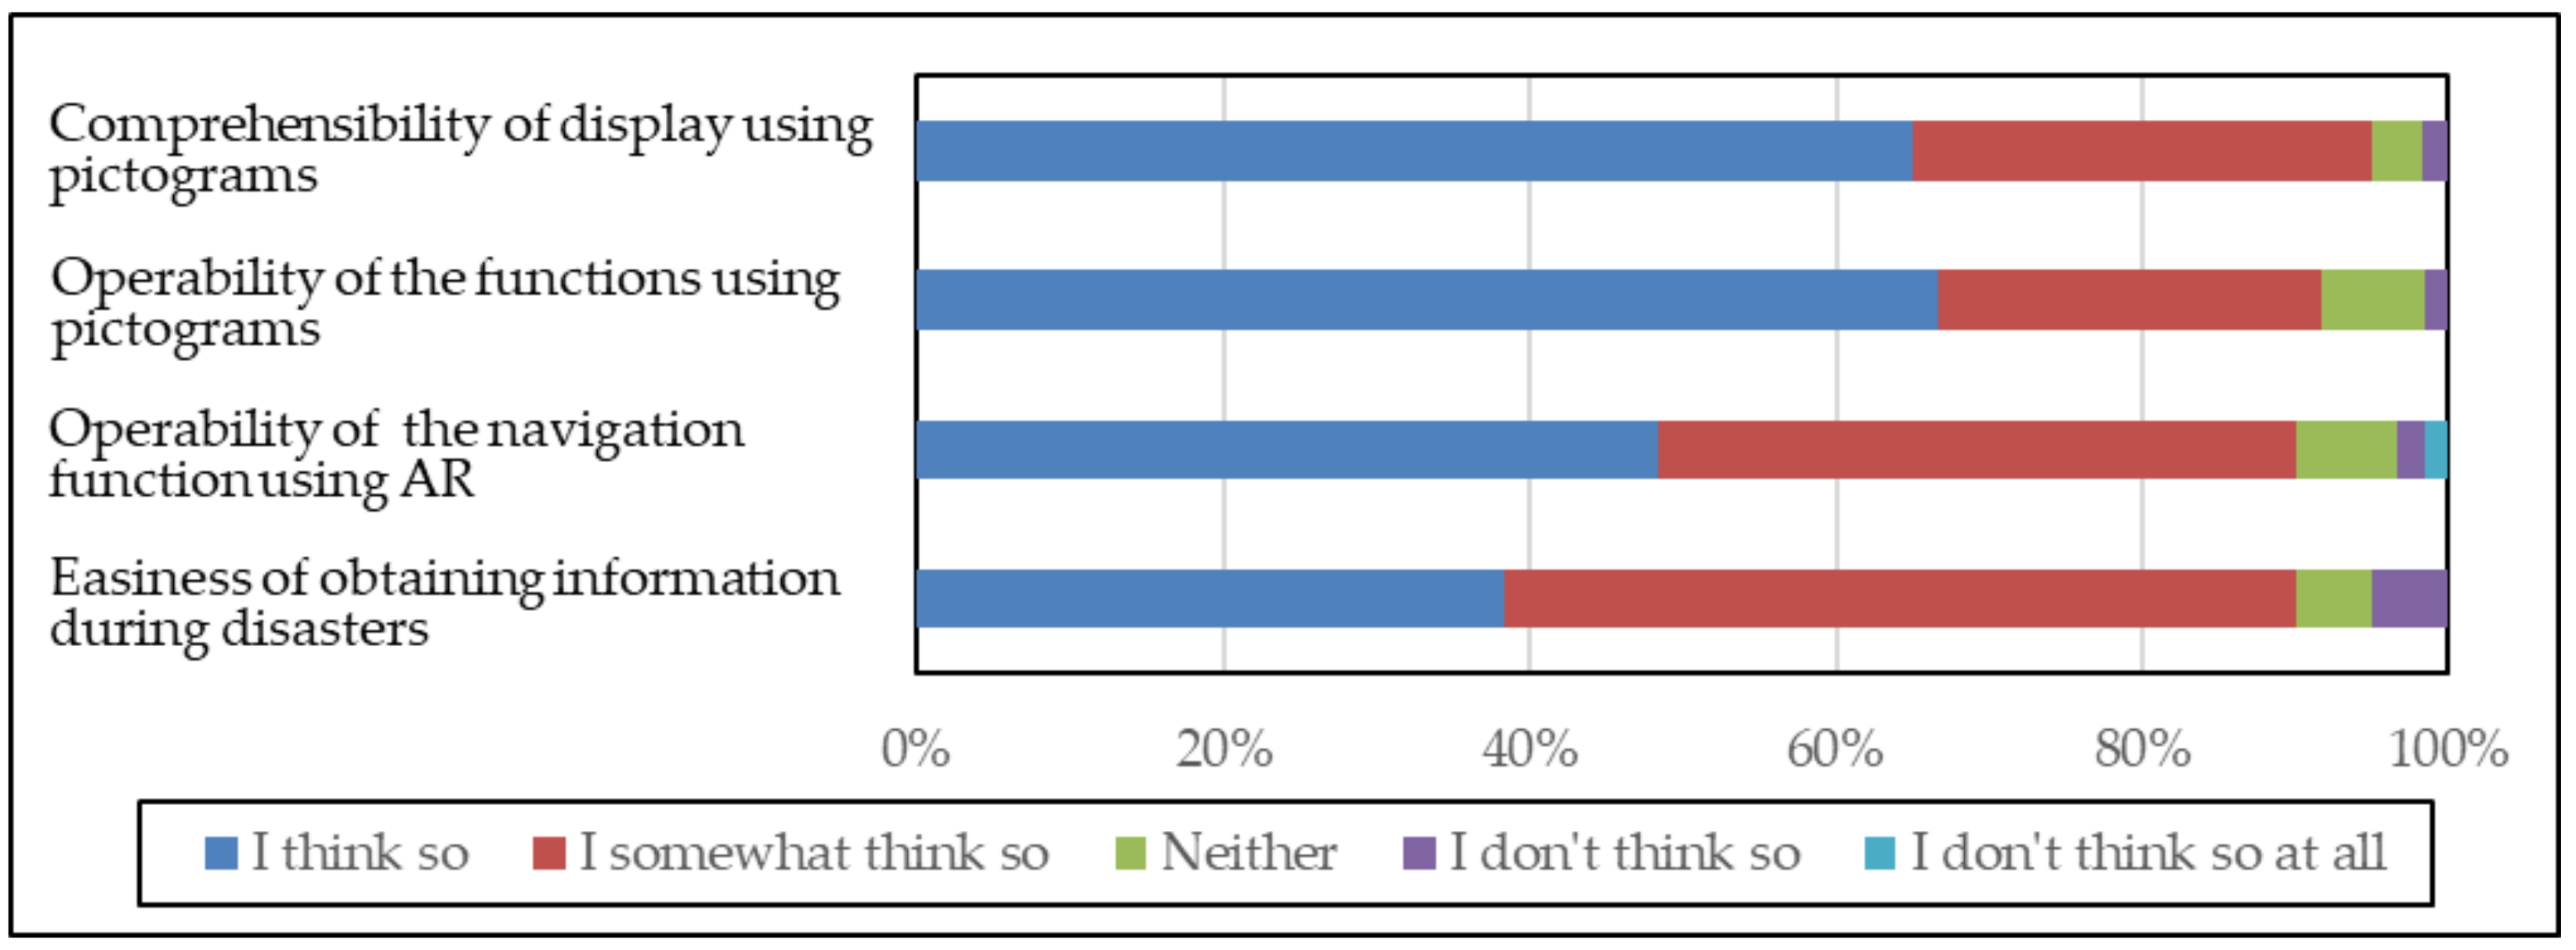
6.1.3. Evaluation Concerning the Originality of the System

Figure 11 shows the evaluation results of the originality of the system. Regarding the comprehensibility of the display using pictograms, 95% answered “I think so” or “I somewhat think so”. Additionally, regarding the operability of functions using pictograms, 92% answered “I think so” or “I somewhat think so”. Therefore, it was evident that the system made it easy for users to understand information concerning sightseeing spots, tourism-related facilities, and disaster support facilities using pictograms. Additionally, it was also evident that the system made the information easy to intuitively understand when they used each function with the use of pictograms.
Regarding the operability of the navigation function using AR, 90% answered “I think so” or “I somewhat think so”. As mentioned in Section 6.1.1, though many users were not familiar with applications using AR, the operability of the function was highly rated. The system shows the locations and routes to sightseeing spots and tourism-related facilities using AR. Therefore, by means of AR, the system can effectively navigate users from their present locations to their destinations.
Regarding the easiness of obtaining information during disasters, 90% answered “I think so” or “I somewhat think so”. Therefore, it can be said that the system was developed in a way that enabled users to efficiently obtain information concerning disaster support facilities. Additionally, as mentioned in Section 6.1.1, though 78% of the users did not know much about disaster support facilities within Chofu City, these users could obtain sufficient information concerning disaster support facilities by using the system.

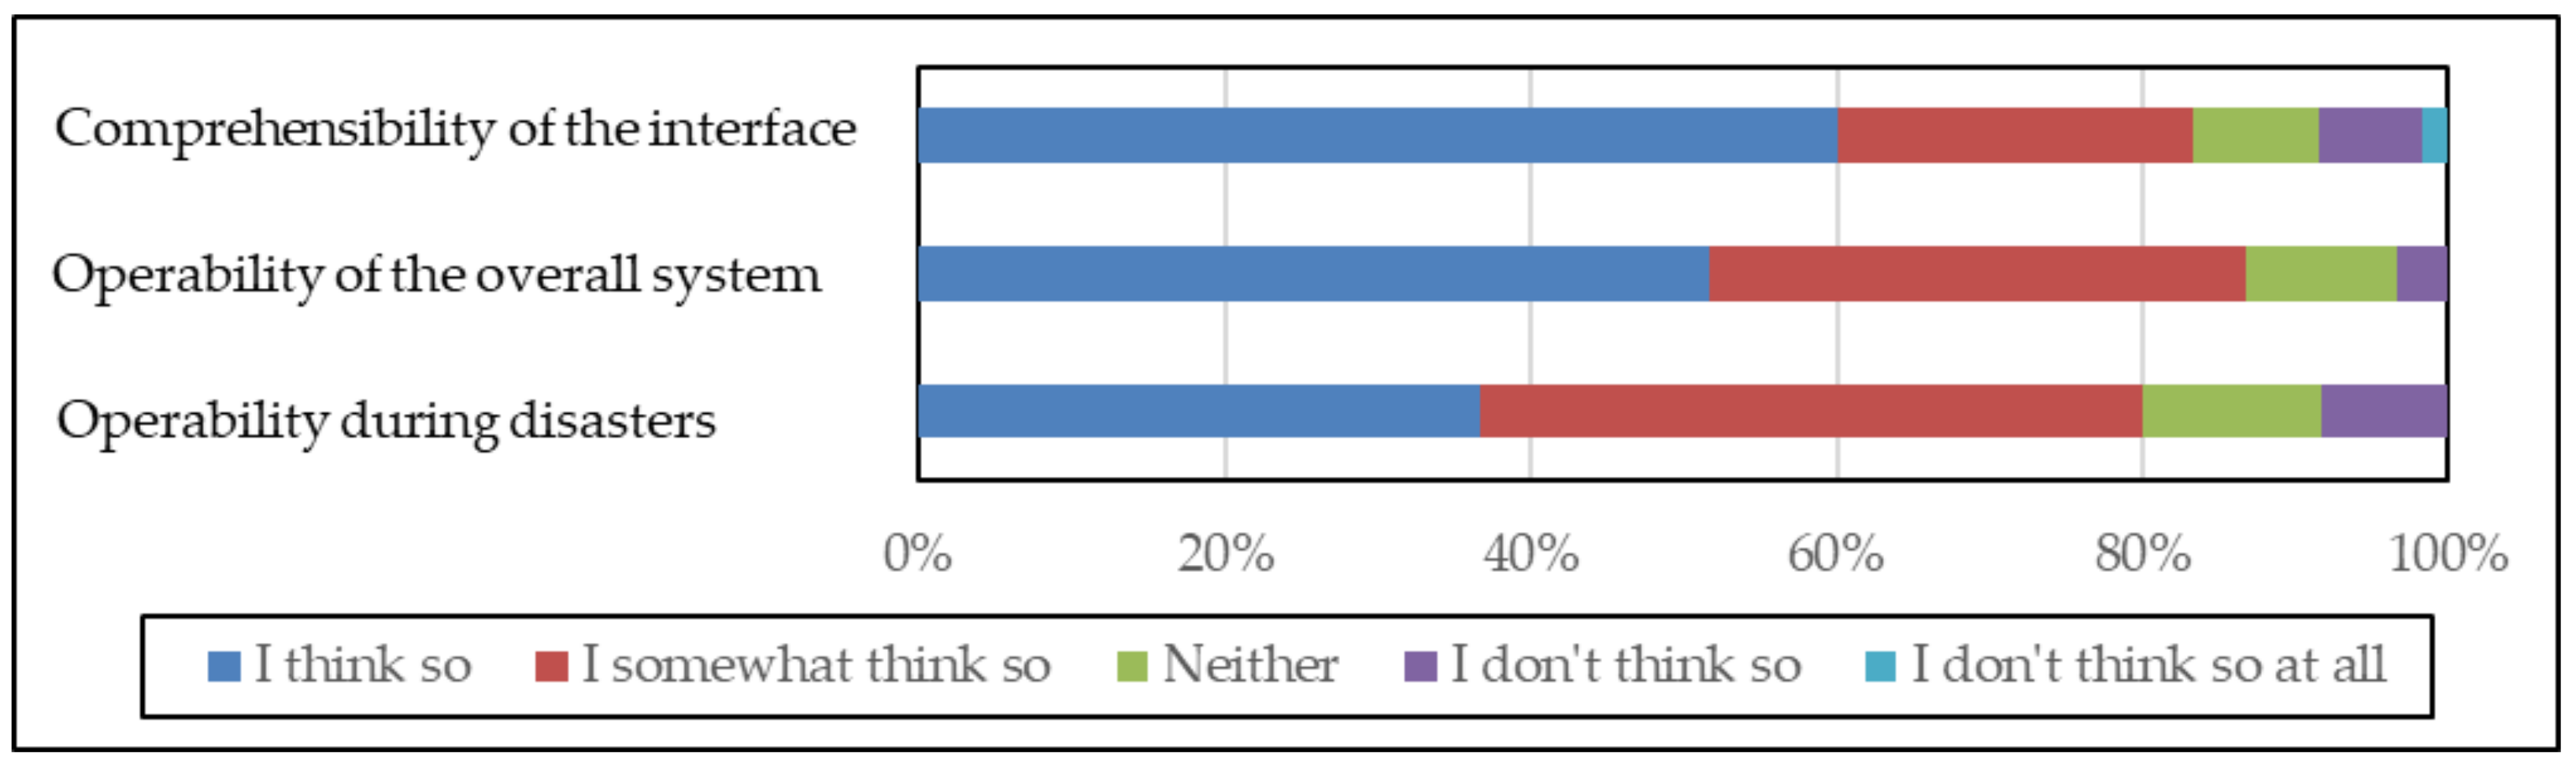
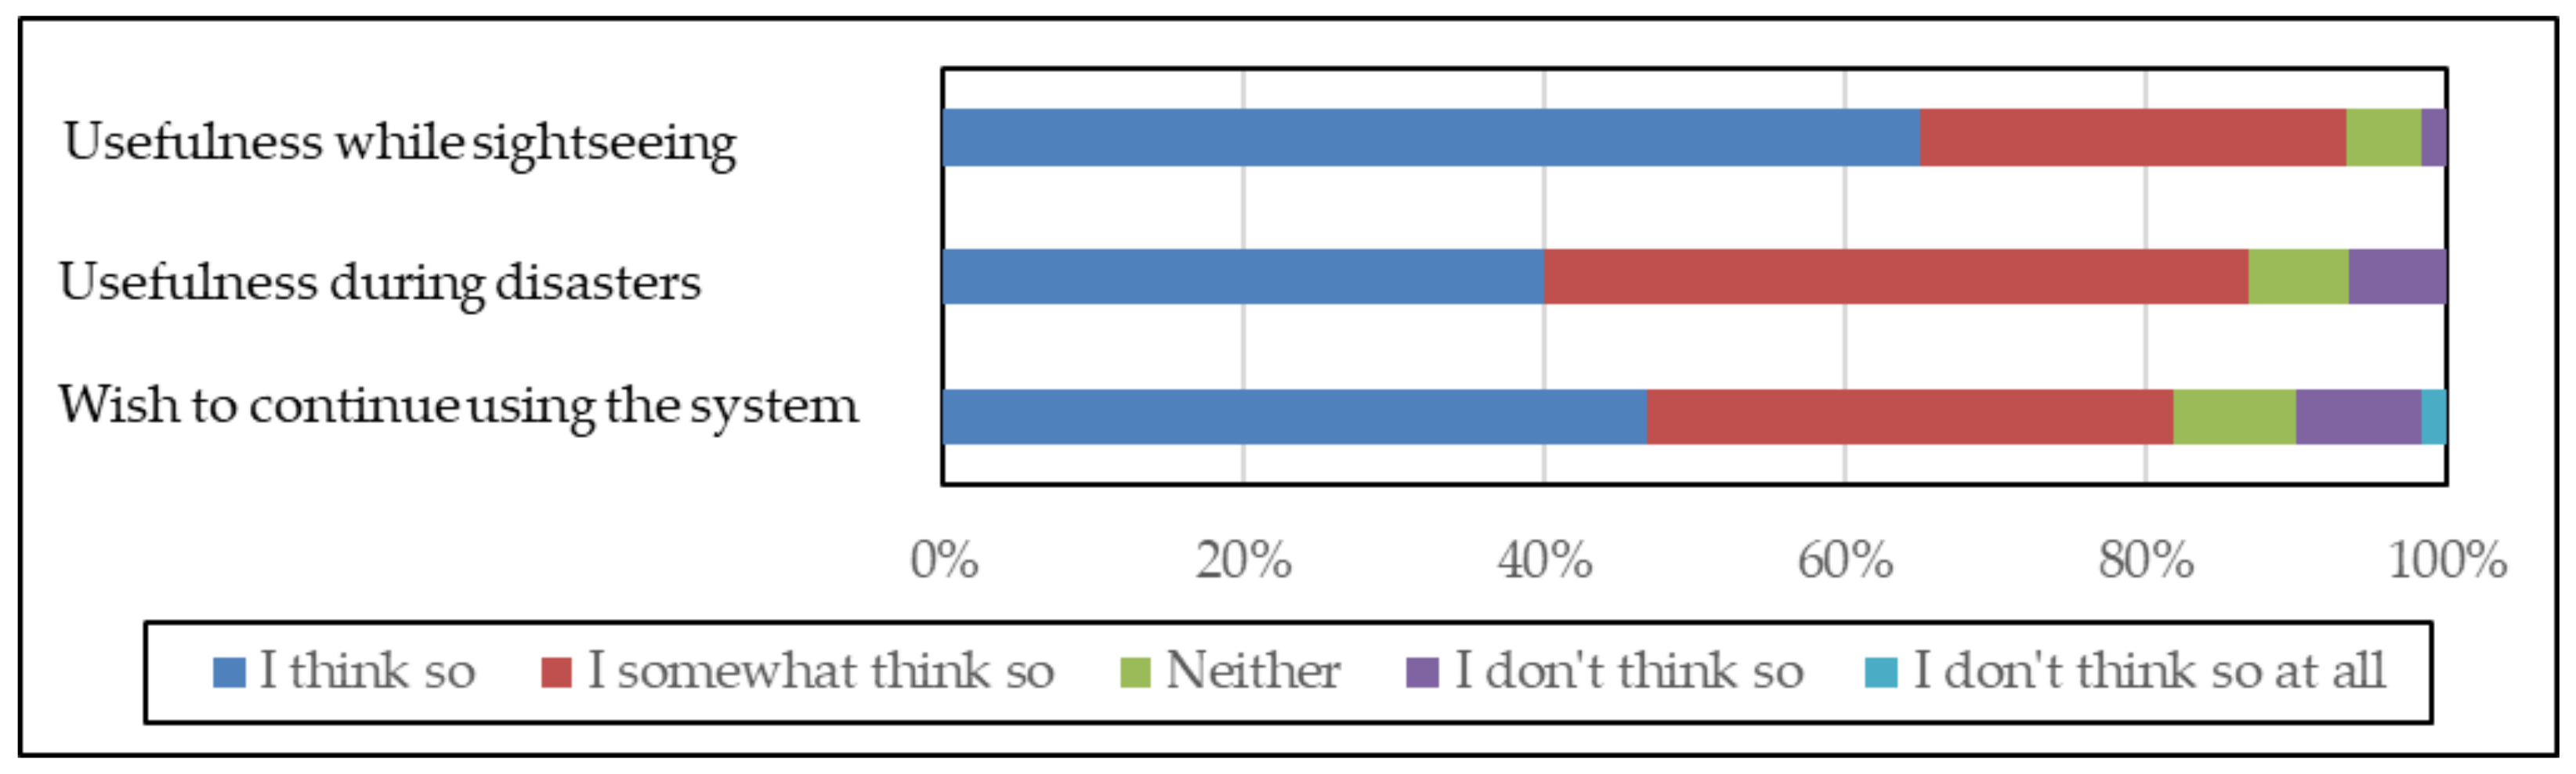
6.1.4. Evaluation Concerning the Usefulness of the Overall System

(1)
Evaluation concerning utilization.
Figure 12 shows the evaluation results of the utilization of the overall system. Regarding the comprehensibility of the interface, while 83% answered “I think so” or “I somewhat think so”, 9% answered “Neither”, and 8% answered “I don’t think so” or “I don’t think so at all”. The reason for this low rating may be due to the overlapping of the pictograms or images displayed on the AR screens.
Regarding the operability of the overall system, though 87% answered “I think so” or “I somewhat think so”, 10% answered “Neither” and 3% answered “I don’t think so at all”. The reason for the low rating may be, as mentioned in Section 6.1.2, because the users were not familiar with applications using AR, thereby making it difficult for them to understand the operation method of the functions using AR. However, such an issue may be solved by having users use the system for a longer period.
Regarding the operability during disasters, users were asked to answer the questionnaire survey by assuming Typhoon Hagibis of October 2019 was the disaster. Though 80% answered “I think so” or “I somewhat think so”, 12% answered “Neither”, and 8% answered “I don’t think so”. The reason for this low rating can be assumed to be that the users felt that there would be difficulty operating the system while evacuating outside during a typhoon.
(2)
Evaluation concerning usefulness.
Figure 13 shows the evaluation results of the usefulness of the overall system. Regarding usefulness while sightseeing, 93% answered “I think so” or “I somewhat think so”. Therefore, it can be said that the present study was successful in developing a system that provided information concerning sightseeing spots and tourism-related facilities using AR and pictograms.
Regarding usefulness during disasters, the users were asked to answer by assuming Typhoon Hagibis of October 2019 for the disaster. Though 87% answered “I think so” or “I somewhat think so”, 7% answered “Neither”, and 6% answered “I don’t think so”. This indicates that the rating of the usefulness of the system during disasters was slightly lower than its usefulness when sightseeing. This may be due to users feeling anxious about whether the system would work well during disasters other than typhoons, as well as the fact that the users who were not affected by Typhoon Hagibis found it difficult to imagine the situation.
Regarding the wish to continue using the system in the future, 82% answered “I think so” or “I somewhat think so”, 8% answered “Neither”, and 10% answered “I don’t think so” or “I don’t think so at all”. The reason for this low rating was considered to be over 60% of the users lacking a sense of locality as they had not frequently visited Chofu City, as was introduced in Section 6.1.1.

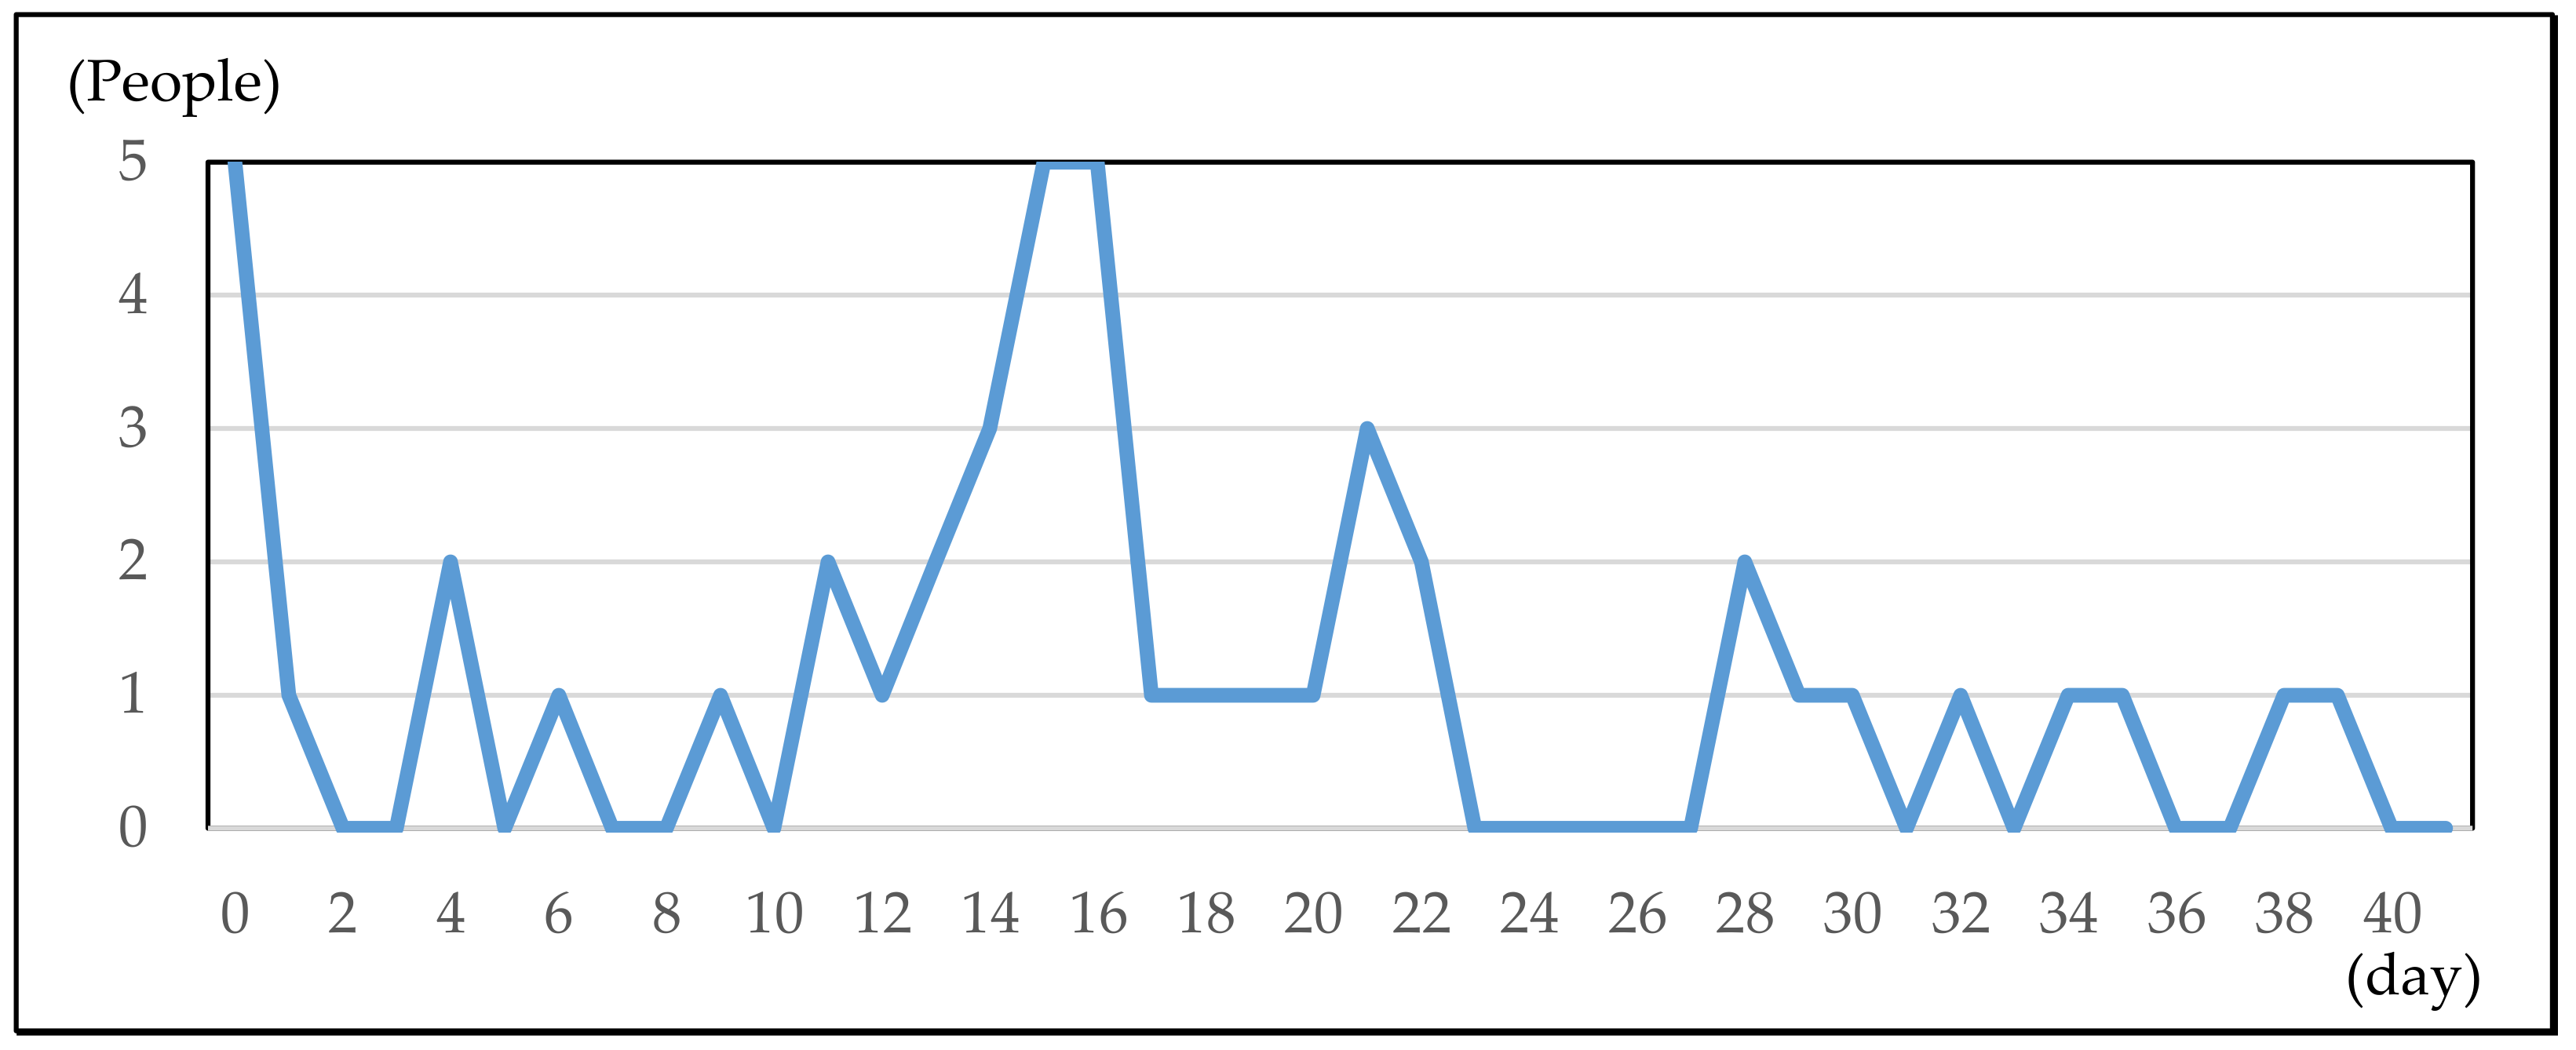
6.2. Evaluation Based on the Access Log Analysis

An analysis of the access log of users was conducted to reveal the trend of system utilization by users. In order to conduct the analysis, Google Analytics for Firebase, which is one of the Firebase functions of mobile backend services, was used in the present study. Firebase is a service provided by Google which enables access log analysis by incorporating Firebase into the application.
Figure 14 shows the daily transition of the number of active users during operation of the system. Specifically, Figure 14 clarifies the number of active users who utilized the system for a day during the operation period. From Figure 12, it is made evident that the system was continuously utilized by users, despite the fact that the number of users decreased during the year end and new year holiday season. The total screen views, which means the total views of the screens of the system, was 292 (approximately 4.9 views per user), and the daily average engagement, which means the time to utilize the system for a day, was 4 min 42 s. The reason for this was that the system had been operated from late November to early January, as mentioned in Section 5.2.1, and users seldom utilized the system for the above holiday season. Additionally, the users who were not used to the system did not evaluate it highly. Therefore, by continuously operating the system, it can be expected that users will further utilize each function of the system.

6.3. Identification of Improvement Plans

The following is a summary of the improvement measures pertaining to the system, identified by the results of the questionnaire survey and access log analysis.
(1)
Tasks related to the interface.
The system enables navigation for users to their destinations by displaying pictograms and images on the digital maps of Web-GIS and the AR screens. However, the results of the questionnaire survey indicated that the users found it difficult to see these pictograms and images on the digital maps and AR screens. Therefore, a setting to allow users to emphasize and display the necessary images is indispensable.
(2)
Tasks related to the data within the system.
In the system, information concerning disaster support facilities is organized in a csv file which can also be viewed offline. However, as there is no function to add information for disaster support facilities, new information has to be added to the database by administrators.

7. Conclusions

In areas that tourists are not familiar with, they may lose track of the routes or direction of their destinations even after referencing a map. Additionally, there is a risk of confusion during disasters, as tourists are not aware of the locations of disaster support facilities such as evacuation sites and shelters in tourist areas. Therefore, a method that supports tourists’ activities by providing information concerning disaster support facilities during normal times in addition to sightseeing spots and tourism-related facilities is necessary. Against such a backdrop, the present study consisted of designing and developing the system (Section 3 and Section 4), followed by its operation (Section 5), evaluation, and identification of improvement plans (Section 6), which can be summarized in the following three points. Additionally, the present study targeted an urban tourist area in Japan where various kinds of information and communication technology (ICT) are available.
(1)
In the present study, a navigation system integrating AR and Web-GIS while using pictograms was developed. The system adopts AR and Web-GIS to effectively provide users with not only information concerning sightseeing spots and tourism-related facilities, but also information concerning disaster support facilities. By adopting AR and Web-GIS, users can obtain information concerning sightseeing spots and tourism-related facilities as well as disaster support facilities at any time. With this, even while sightseeing, users can easily obtain disaster information in addition to sightseeing information.
(2)
The operation target area was set to Chofu City in the Tokyo Metropolis as an urban tourist area, and the system was operated and evaluated. The system was operated over a period of 6 weeks (from late November to early January) with people inside and outside Chofu City as the subjects. A questionnaire survey was conducted for 60 users, and the response rate was 100%. The system was used not only by youths but by various age groups, and there was no difference between such age groups regarding the answer tendency.
(3)
Based on the results of the questionnaire survey, the system was evaluated highly for its originality in terms of displays and functions using pictograms, navigation using AR, and obtaining information during disasters. Thus, though the rating for operability during disasters was somewhat low, the present study indicated that the system could also be used as a method to obtain information concerning disaster support facilities. Additionally, based on the results of the access log, the system developed in the present study was continuously utilized by users during the operation period. Therefore, by continuously operating the system, it can be expected that users will further utilize each function.
As for future research subjects, the improvement of the system based on the results in Section 6.3, as well as the enhancement of the significance of using the system by gaining more data from other urban tourist areas inside and outside Japan, can be raised.

Author Contributions

R.S. design, develop and operate the sightseeing spot recommendation system that takes into account the visiting frequency of users in the present study. He also initially drafted the paper. K.Y. carried out background work and evaluates the system. Both authors have read and agreed to the published version of the manuscript.

Funding

This research received no external funding.

Institutional Review Board Statement

The study was conducted according to the guidelines of the Declaration of Helsinki and approved by the Institutional Review Board.

Informed Consent Statement

Informed consent was obtained from all subjects involved in the study.

Acknowledgments

In the operation of the sightseeing navigation system from normal times to disaster outbreak times and the web questionnaire survey of the present study, enormous cooperation was received from the participants, mainly in the Tokyo metropolitan area. We wish to take this opportunity to gratefully acknowledge them.

Conflicts of Interest

The authors declare no conflict of interest.

References

  1. Wise, N.; Heidari, H. Developing Smart Tourism Destinations with the Internet of Things. In Big Data and Innovation in Tourism, Travel, and Hospitality: Managerial Approaches, Techniques, and Applications; Springer: Berlin, Germany, 2019; pp. 21–29. [Google Scholar]
  2. Ojaghab, S.; Malek, M.R.; Saeedib, S.; Liangb, S. A Location-Based Orientation-Aware Recommender System Using IoT Smart Devices and Social Networks. Future Gener. Comput. Syst. 2020, 108, 21–29. [Google Scholar]
  3. Akdu, U. Smart Tourism: Issues, Challenges and Opportunities. In The Emerald Handbook of ICT in Tourism and Hospitality; Emerald: Somerville, MA, USA, 2020; pp. 291–308. [Google Scholar]
  4. Kounoike, K. What Is “AR = Augmented Reality”? How Is It Different from VR? A Little Future Shape to be Realized. Available online: https://kakakumag.com/pc-smartphone/?id=9609 (accessed on 8 January 2019).
  5. Chatzopoulos, D.; Bermejo, C.; Huang, Z.; Hui, P. Mobile Augmented Reality Survey: From Where We Are to Where We Go. IEEE Access 2017, 5, 6917–6950. [Google Scholar] [CrossRef]
  6. GrapeCity. Available online: https://wikitude.grapecity.com/topics/interviews-harbor-solutions (accessed on 8 January 2019).
  7. Han, D.; Jung, T.; Gibson, A. Dublin AR: Implementing Augmented Reality (AR) in Tourism. In Information and Com-munication Technologies in Tourism 2014; Springer: Berlin, Germany, 2014; pp. 451–465. [Google Scholar]
  8. Zhou, J.; Yamamoto, K. Development of the System to Support Tourists’ Excursion Behavior using Augmented Reality. Int. J. Adv. Comput. Sci. Appl. 2016, 7, 197–209. [Google Scholar] [CrossRef] [Green Version]
  9. Fujita, S.; Yamamoto, K. Development of Dynamic Real-Time Navigation System. Int. J. Adv. Comput. Sci. Appl. 2016, 7, 116–130. [Google Scholar] [CrossRef] [Green Version]
  10. Kečkeš, A.L.; Tomičić, I. Augmented Reality in Tourism—Research and Applications Overview. Interdiscip. Descr. Complex Syst. 2017, 15, 157–167. [Google Scholar] [CrossRef]
  11. Kurihara, K.; Sato, H. Marker-Based Indoor Navigation for Sharing Location Information. In Proceedings of the 2014 Multimedia, Distributed, Cooperative, and Mobile Symposium, Shibata, Niigata, Japan, 9–11 July 2014; pp. 1099–1103. [Google Scholar]
  12. Amirian, P. Landmark-Based Pedestrian Navigation Using Augmented Reality and Machine Learning. In Progress in Cartography; Springer: Berlin, Germany, 2016; pp. 451–465. [Google Scholar]
  13. Morozumi, S.; Yamazaki, S.; Chigusa, Y.; Hattori, T. Development of Navigation System for Restaurants Using AR. In Proceedings of the 78th National Convention of Information Processing Society of Japan, Yokohama, Kanagawa, Japan, 10–12 March 2016; pp. 361–362. [Google Scholar]
  14. Chung, J.; Pagnini, F.; Langer, E. Mindful navigation for pedestrians: Improving engagement with augmented reality. Technol. Soc. 2016, 45, 29–33. [Google Scholar] [CrossRef]
  15. Sasaki, R.; Yamamoto, K. A Sightseeing Support System Using Augmented Reality and Pictograms within Urban Tourist Areas in Japan. ISPRS Int. J. Geo Inf. 2019, 8, 381. [Google Scholar] [CrossRef] [Green Version]
  16. Hammady, R.; Ma, M.; Temple, N. Augmented Reality and Gamification in Heritage Museums. In Serious Games; Springer: Berlin, Germany, 2016; pp. 181–187. [Google Scholar]
  17. Wang, C.-S. An AR mobile navigation system integrating indoor positioning and content recommendation services. World Wide Web 2018, 22, 1241–1262. [Google Scholar] [CrossRef]
  18. Lovreglio, R.; Kinateder, M. Augmented reality for pedestrian evacuation research: Promises and limitations. Saf. Sci. 2020, 128, 104750. [Google Scholar] [CrossRef]
  19. Gu, Y.; Chidsin, W.; Goncharenko, I. AR-based Navigation Using Hybrid Map. In Proceedings of the 2021 IEEE 3rd Global Conference on Life Sciences and Technologies (LifeTech), Nara, Japan, 9–11 March 2021; pp. 266–267. [Google Scholar]
  20. Fukada, H.; Finaki, T.; Kodama, M.; Miyashita, M.; Miyashita, A. Proposal of Tourist Information System Using Image Pro-cessing-Based Augmented Reality. IPSJ SIG Tech. Rep. 2011, 2011, 1–8. [Google Scholar]
  21. Komoda, S.; Takasu, Y.; Mizuno, S. Smartphone Application for Walking around the Locations of Movie of Local Cinema “Takahama Story”. IPSJ SIG Tech. Rep. 2013, 1, 803–804. [Google Scholar]
  22. Vecchio, P.; Mele, F.; De Paolis, L.T.; Epicoco, I.; Mancini, M.; Aloisio, G. Cloud Computing and Augmented Reality for Cultural Heritage. In Augmented and Virtual Reality; Springer: Berlin, Germany, 2015; pp. 51–60. [Google Scholar]
  23. Skorokhodov, D.; Seliverstov, Y.; SeliverstovIlya, S.; Eugenia, B.; Nikolay, V.; Natalia, P.; Victoria, S.; Anastasia, C. Using Augmented Reality Technology to Improve the Quality of Transport Services. In Convergent Cognitive Information Technologies; Springer: Berlin, Germany, 2018; pp. 339–348. [Google Scholar]
  24. Miyajima, H.; Yata, N.; Manabe, Y. AR sightseeing system with proximity detection and markerless AR. Int. Workshop Adv. Image Technol. (IWAIT) 2018, 1–3. [Google Scholar] [CrossRef]
  25. Zhou, X.; Sun, Z.; Xue, C.; Lin, Y.; Zhang, J. Mobile AR Tourist Attraction Guide System Design Based on Image Recognition and User Behavior; Springer Science and Business Media LLC: Berlin, Germany, 2019; pp. 858–863. [Google Scholar]
  26. Makino, R.; Yamamoto, K. Spatiotemporal Information System Using Mixed Reality for Area-Based Learning and Sightsee-ing. In Lecture Notes in Geoinformation and Cartography: Computational Urban Planning and Management for Smart Cities; Springer: Berlin, Germany, 2019; pp. 283–302. [Google Scholar]
  27. Ikizawa-Naitou, K.; Yamamoto, Y. A Support System of Sightseeing Tour Planning Using Public Transportation in Japanese Rural Areas. J. Civil Eng. Archit. 2020, 14, 316–332. [Google Scholar]
  28. Kusano, K.; Izumi, T.; Nobutani, Y. Proposal of Disaster Information Sharing System Using Pictogram. In Proceedings of the 75th National Convention of Information Processing Society of Japan, Sendai, Miyagi, Japan, 6–8 March 2013; pp. 802–804. [Google Scholar]
  29. Kusano, K.; Izumi, T.; Nobutani, Y. Nonlinguistic Disaster Information Sharing System Using Visual Marks. In Transactions on Engineering Technologies; Springer: Berlin, Germany, 2015; pp. 273–288. [Google Scholar]
  30. Csiszár, C.; Nagy, E. Model of an integrated air passenger information system and its adaptation to Budapest Airport. J. Air Transp. Manag. 2017, 64, 33–41. [Google Scholar] [CrossRef]
  31. Yamamoto, K. Navigation System for Foreign Tourists in Japan. J. Environ. Sci. Eng. B 2017, 6, 521–541. [Google Scholar] [CrossRef] [Green Version]
  32. Abe, S.; Yoshitsugu, N.; Miki, D.; Yamamoto, K. An Information Retrieval System with Language-Barrier-Free Interfaces. J. Inf. Syst. Soc. Jpn. 2019, 2, 57–64. [Google Scholar]
  33. Hayashi, Y.; Oyokawa, D.; Kiyoki, Y.; Mita, T. An Information Providing Method to Express Train Service Situation by Com-bining Multiple Sign-Logo Images. In Information Modelling and Knowledge Bases XXX; IOS Press: Amsterdam, The Netherlands, 2019; pp. 384–392. [Google Scholar]
  34. Reinolsmann, N.; Alhajyaseen, W.; Brijs, T.; Pirdavani, A.; Ross, V.; Hussain, Q.; Brijs, K. Dynamic Travel Information Strat-egies in Advance Traveler Information Systems and Their Effect on Route Choices along Highways. Procedia Comput. Sci. 2020, 170, 289–296. [Google Scholar] [CrossRef]
  35. Suzaki, S. Trial of Disaster Information Provision to Tourists Using AR. IPSJ SIG Tech. Rep. 2015, 2, 1–6. [Google Scholar]
  36. Iwahara, H.; Shiraki, W.; Ishii, M. Study on Providing Tools Combining Tourist Information and Disaster Prevention Infor-mation for Inbound in Local Cities. J. Jpn. Soc. Civ. Eng. 2018, 74, 2. [Google Scholar]
  37. Iino, F.; Abe, A.; Ichikawa, H.; Tomizawa, H. Trial Product of Pedestrian Movement Support System Considering the Use at the Times of Disasters. In Proceedings of the 81th National Convention of Information Processing Society, Fukuoka, Japan, 14–16 March 2019; pp. 631–632. [Google Scholar]
  38. Hamamura, A.; Fukushima, T.; Yoshino, T.; Edane, N. Application of Support System at the Times of Disasters That Are Available Daily to Real Environment. IPSJ SIG Tech. Rep. 2015, 18, 1–8. [Google Scholar]
  39. Kajiwara, M.; Ohshima, C.; Nakayama, K. Development of AR Platform to share Disaster Information. In Proceedings of the 81th National Convention of Information Processing Society, Fukuoka, Japan, 14–16 March 2019; pp. 763–764. [Google Scholar]
  40. Suzuki, T. Disaster Information Provision for International Tourists Using an Interpreter Application. In Sustainable Tourism IX; WITPRESS Ltd.: Southampton, UK, 2020; pp. 103–109. [Google Scholar]
  41. Psaroudakis, C.; Xanthopoulos, G.; Stavrakoudis, D.; Barnias, A.; Varela, V.; Gkotsis, I.; Karvouniari, A.; Agorgianitis, S.; Chasiotis, I.; Vlachogiannis, D.; et al. Development of an Early Warning and Incident Response System for the Protection of Visitors from Natural Hazards in Important Outdoor Sites in Greece. Sustainable 2021, 13, 5143. [Google Scholar] [CrossRef]
  42. Foundation for Promoting Personal Mobility and Ecological Transportation. Available online: http://www.ecomo.or.jp/english/index.html (accessed on 8 January 2019).
  43. Android Studio. Available online: https://developer.android.com/studio (accessed on 8 January 2019).
  44. Wikitude GmbH, Wikitude Software Development Kit (SDK). Available online: https://www.wikitude.com/products/wikitude-sdk/ (accessed on 8 January 2019).
  45. Mapbox Japan. Available online: https://www.mapbox.jp/ (accessed on 8 January 2019).
Figure 1. System design.
Applsci 11 04609 g001
Figure 2. Sequence of steps for location-based AR.
Applsci 11 04609 g002
Figure 3. Sequence of steps for Web-GIS.
Applsci 11 04609 g003
Figure 4. Screen for the search function of spots and facilities.
Applsci 11 04609 g004
Figure 5. Screen for the navigation function using AR.
Applsci 11 04609 g005
Figure 6. Screen for the submission function of information concerning sightseeing spots and tourism-related facilities.
Applsci 11 04609 g006
Figure 7. Screen for the layer modification function of the digital maps of Web-GIS.
Applsci 11 04609 g007
Figure 8. Screen of the display function of sightseeing spots and tourism-related facilities using AR.
Applsci 11 04609 g008
Figure 9. Real-time updates of distance information.
Applsci 11 04609 g009
Figure 10. Height modification of images displayed based on the updated distance information.
Applsci 11 04609 g010
Figure 11. Evaluation results of the originality of the system.
Applsci 11 04609 g011
Figure 12. Evaluation results concerning the utilization of the overall system.
Applsci 11 04609 g012
Figure 13. Evaluation results of the usefulness of the overall system.
Applsci 11 04609 g013
Figure 14. Daily transition of the number of active users during operation of the system.
Applsci 11 04609 g014
Table 1. Breakdown of system users and questionnaire survey respondents.
Age Groups of Users10–1920–2930–3940–4950–5960+Total
Number of users (people)5264781060
Publisher’s Note: MDPI stays neutral with regard to jurisdictional claims in published maps and institutional affiliations.

