1. Introduction
Mobile e-commerce has developed rapidly in recent years, and the number of mobile transactions in China reached 101 billion accounting for 347 trillion yuan in 2019, increasing by 67.57% and 25.13%, respectively [
1]. The marketing costs also increase synchronously in mobile ecommerce. Taking Taobao 11.11 and UnionPay 6.2 promotions as representatives, large enterprises spend billions of dollars each year in mobile marketing. Additionally, financial fraud has become more and more common in the context of mobile payments. Large numbers of mobile robots emerge with manipulated smartphones and even professional devices [
2,
3]. Robots simulate operational behaviors of normal customers to grab the marketing resources with high-speed scripts, which greatly affect the market fairness and seriously weaken the actual effect of commercial promotion. Some of the professional devices used by the underground industry are shown in
Figure 1.
Traditional machine learning models face some problems in fraud detection of mobile payment. On one hand, the machine learning models are facing a shortage of qualified training data as fraud transaction samples are inadequate. On the other hand, although massive human knowledge is accumulated in daily enterprise system operation, most machine learning models do not allow for the direct incorporation of prior knowledge. It becomes a difficult problem in the contexts of technology and engineering for mobile payment applications to distinguish robotic automation from normal user operations.
In this paper, we propose an extension to boosting algorithms that combine human knowledge with training data in fraud detection of mobile payment transactions. We collect raw data of payment transactions from mobile terminals with a widely deployed APP under user authorization, extract different features from the raw data, label 31,500 payment transactions in 14 days as datasets, and then train and test the extended model with the datasets. Based on our test, the extended model shows better performance than standard boosting model, and the experiment acquires an accuracy rate of 98.7% and a recall rate of 94.8% in prediction.
We performed further analysis on the differences in dominant features between fraudulent transactions and normal transactions. We discovered some common behavior patterns of robotic automation, including less spatial motion detected by device sensors, higher IP group-clustering ratio, higher device jailbroken rate, more irregular device names and fewer IP address changes. The quantitative analysis result is helpful for APP developers and service providers to understand and prevent fraud transactions from robotic automation.
The rest of the paper is organized as follows: We enumerate related works in
Section 2, elaborate on data collection and feature extraction in
Section 3, explain machine learning models in
Section 4, and then describe the training process and the experimental results of our proposed model in
Section 5. We further investigate behavior patterns of robots in
Section 6, and finally discuss several open issues in
Section 7 and conclude in
Section 8.
2. Related Works
In recent years, robot detection has arouse increasing interests in social networks [
4,
5,
6] through account information [
7], social network relationships [
8], text contents [
9,
10], time series analysis [
11,
12], location analysis [
13], language sentiment [
14,
15] and other domains. Most of the methods focus on network relationships and post analysis, therefore, they are not applicable to fraud detection in real-time transaction scenarios of mobile payments.
To address the issue of robot detection in mobile payments, researchers and engineers have adopted a variety of methods, such as verification code [
16], biometric identification [
17,
18,
19], and so forth. These methods can be evaluated from the following two dimensions: effectiveness and experience, that is, whether/how robotic automation is accurately identified and prevented, and whether/how normal user experience is impacted.
Figure 2 shows a comparative analysis of the current robot detection methods.
2.1. Verification Code Technology
To resist the action of robots, such as web crawlers [
20,
21], verification code technology [
16] is widely used on important web pages such as Internet login and payment pages. A typical verification method is the use of a randomly generated numerical and alphanumeric picture that allows the user to enter numbers and letters according to the picture information [
22]. More complex verification methods include some simple logic or mathematical operations [
23], as well as other operation steps that require human–computer interaction [
24,
25]. The verification code can effectively prevent simple robotic operation. However, with the application of new technologies, such as machine learning and image recognition [
26], most verification codes can be cracked easily. Furthermore, some underground industries even hire people to input verification codes manually to skip the safety verification.
2.2. Short Message Verification Technology
Short message service (SMS) is a common service provided by most mobile service providers. SMS verification codes [
27,
28,
29] is a user interaction verification technology commonly used in mobile APPs. The server sends a short message with a verification code to the mobile terminal, and the user inputs the verification code on the mobile APP. Typical SMS verification codes are 4–6 digits. However, mobile robots can read short messages, obtain the verification code, and simulate normal user input on jailbroken terminals. Therefore, the technology is not effective in identifying and blocking robotic automation.
2.3. Biometric Identification Technology
Biometric identification technology is currently a focus of both research and engineering, and biometrics are widely used in user authentication on smartphones. Typical biometrics features include fingerprint [
17,
30,
31], voice [
18], and face [
19,
32]. Some auxiliary methods are used to prevent picture attacks or record playback attacks, such as liveness detection [
33,
34,
35], 3D recognition [
36], micro expression recognition [
37] and movement detection such as shaking head or blinking [
38,
39]. Biometric recognition technology can be used to prevent robot operation effectively, but it requires user cooperation, which impacts the experience of normal users.
2.4. Expert Rule Judgment
Based on expert rule judgment, user behavior is automatically evaluated to identify abnormal robot behaviors. Judgment decisions are usually made through decision trees [
40,
41]. Typical judgment indicator includes user operation time interval, cumulative operation times per day, and so forth [
42], and the expert rule database can be updated dynamically according to actual needs. However, as the robot can simulate normal user behaviors perfectly, it can invalidate expert judgment rules.
In conclusion, currently some methods are partially effective but have poor experience, while others have better experience but are less effective. In this article, both the effectiveness and the user experience are considered in the detection model.
3. Data and Features
In this paper, we use raw data collected from mobile terminals through a widely deployed APP, and then extract the features from the raw data. Some typical data and features are shown in
Table 1.
3.1. Collect Data on Mobile Terminals
In this paper, we use business transaction data from a payment APP that is widely deployed on more than 150 billion mobile phones. To provide business service and ensure privacy protection, a user agreement is signed between APP users and the service provider. The raw data is collected on mobile terminals under user authorization, transmitted to the server in encrypted format, and processed by authorized professionals in a secure environment.
3.1.1. Static Data
Such data are fixed attribute values of mobile terminals, which will never change during the APP lifecycle. Therefore, they are collected during APP startup. Typical static data include the following: device ID, operating system version, device model, terminal name, screen resolution, device jailbroken status, and so forth.
3.1.2. Slowly Changing Data
Such data may change during the APP lifecycle but with a long changing period. Generally, the data are collected in a certain period and sent to a server upon any change. Typical slowly changing data include IP address, device power, mobile phone number, login mailbox, and so forth.
3.1.3. Dynamic Data
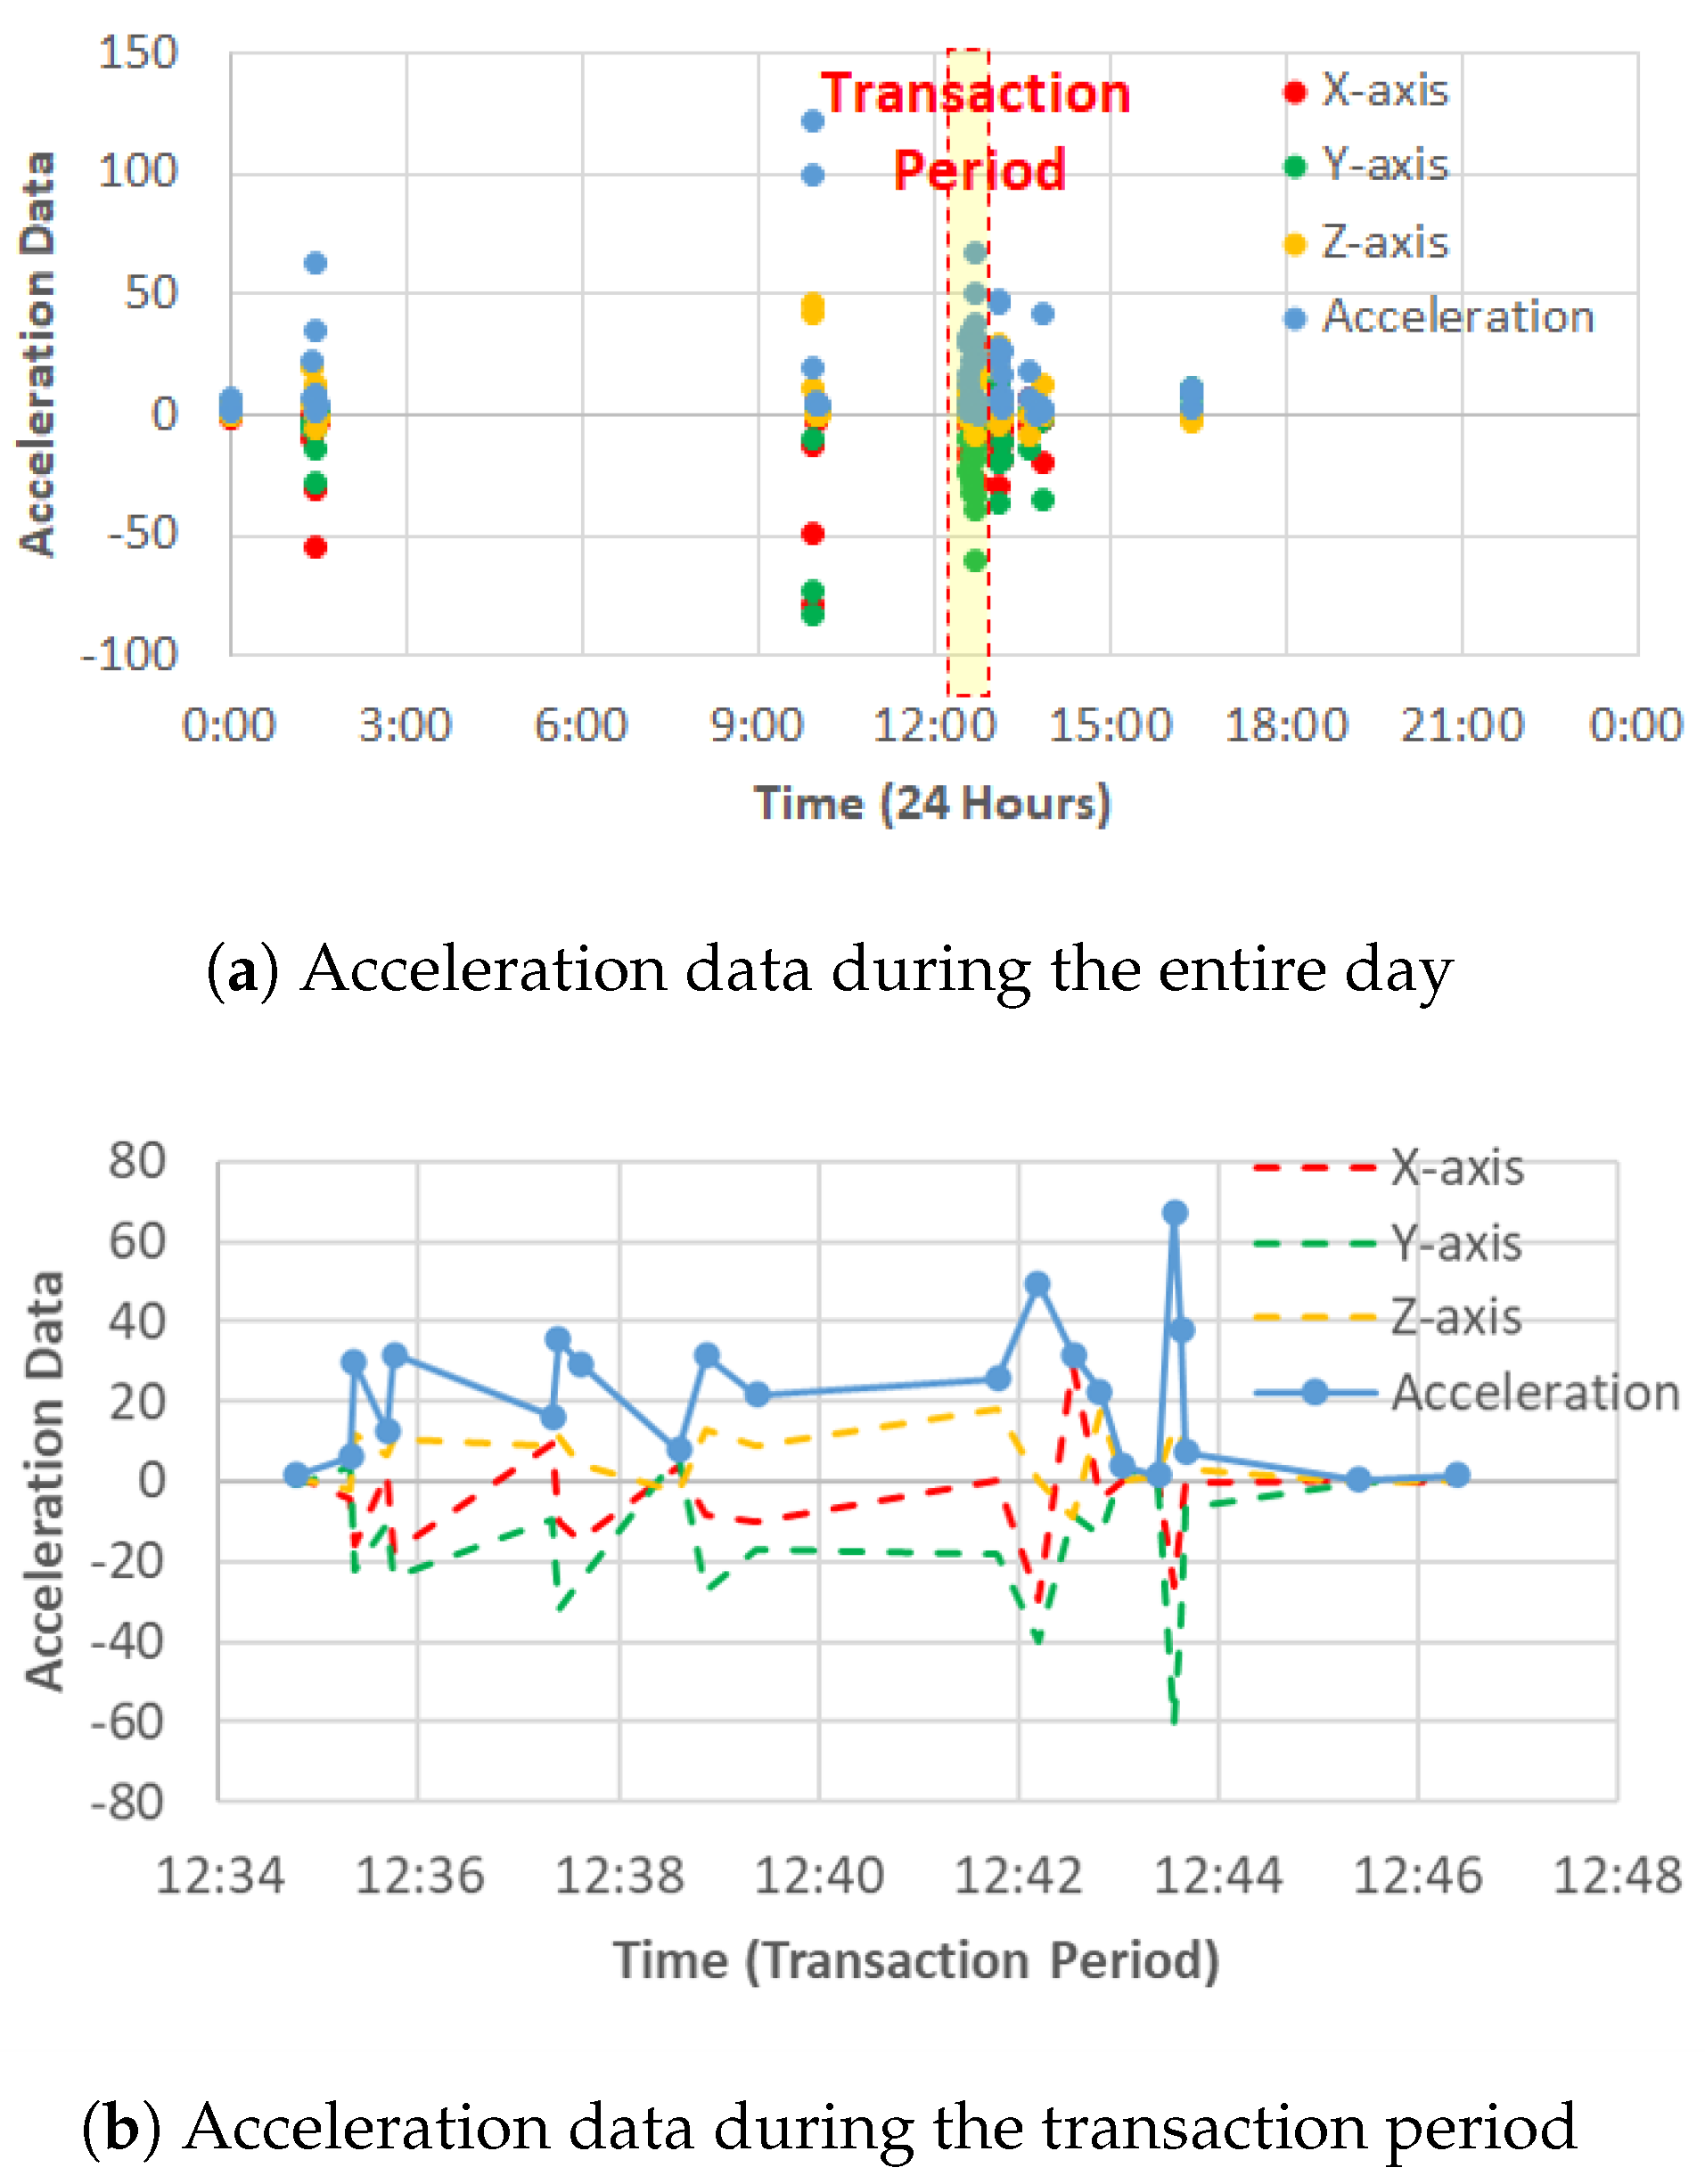
Such data are generated dynamically by mobile terminal sensors and change frequently during APP lifecycle, and therefore should be frequently collected and sent to the server. Typical dynamic data includes Global Positioning System (GPS) data, elevation angle, acceleration, angular acceleration, and so forth.
Figure 3 shows a demo of acceleration data, in which
Figure 3a shows data evolution during the entire day, and
Figure 3b shows data change during transaction period.
The above three types of data may differ according to device model and user authorization. For example, if GPS data collection is not authorized on some mobile terminals, the data will be blank.
3.2. Extract Normal Features from Raw Data
According to the distribution and change frequency of raw data, the features are extracted as follows:
3.2.1. Static Discrete Features
Raw data such as the operating system version, device model, screen resolution, and jailbroken/root state are discrete features, and a numerical value is assigned to each feature F according to a certain rule. For example, the feature value of device model can be calculated as in
3.2.2. Changing Discrete Features
For the discrete raw data that may change during APP lifecycle, we count the changing times of data throughout the entire day as the feature value such as IP address change count and login mailbox change count.
3.2.3. Continuous Features
For continuous raw data such as battery power, acceleration, angular acceleration, elevation angle, and so forth, we calculate the max/min/mean/standard deviation(SD)/peak count and bottom count during the entire day, and then normalize the results to range (−1,1) according to needs, as in
Most normal users show daily periodic characteristics in the raw data, so we calculate and normalize the data during a 24-h period as feature values. Specifically, for dynamic continuous raw data, we calculate and normalize the data during 5-min transaction periods as feature values, as shown in
Table 2.
3.3. Extract Risk Features by Incorporating Prior Knowledge
Massive human knowledge has been accumulated during daily system operation. This knowledge includes expert rules and blacklists. Traditional methods of risk identification are usually based on expert rules, and hundreds of expert rules are established in financial payments based on different transaction fields, such as transaction amount, trading address, device name, IP address, and so forth. A typical rule is that the risk of a transaction is high for small merchants if the transaction amount is higher than
$100. Therefore, we can extract new risk features by incorporating prior knowledge of the expert rules. For example, concerning the transaction amount for small merchants, we add a new feature ‘Transaction Amount’, and calculate the risk value, as in
On the other hand, blacklists are widely implemented in many engineering projects to identify and prevent risks effectively. Typical blacklists include lists of mobile phone numbers, login mailboxes, IP addresses [
43], device IDs, and so forth. We can extract new risk features by incorporating prior knowledge of blacklists. For example, concerning IP address blacklists, we add a new feature ‘IP Address Risk,’ and set the value to 1 if its IP address is in the blacklist; otherwise, it is set to 0. Blacklists can not only be accumulated from historical fraud transaction information, but lists can also be transferred from different domains; therefore, the training data shortage will be addressed. Based on prior knowledge, new risk features can be defined and calculated as shown in Algorithm 1.
| Algorithm 1 Calculating Risk Value of Feature |
Input: Raw data of the feature, ;
Prior knowledge of expert rule, ;
Prior knowledge of blacklist,
Output: Risk value of the feature, - 1:
Initialize with 0 - 2:
for each do - 3:
if is applicable to then - 4:
if then - 5:
= - 6:
end if - 7:
end if - 8:
end for - 9:
for each do - 10:
if then - 11:
if then - 12:
= - 13:
break - 14:
end if - 15:
end if - 16:
end for - 17:
return
|
For example, the risk value of the mobile phone number 199-123-45678 can be calculated according to the expert rule and blacklist. If the phone number is in a risk number segment [199-123-XXXX] with risk value 0.5, then the risk value of the phone number is set to 0.5. If the phone number is already in the blacklist, then the risk value is set to 1. The classification results of the machine learning model, after manual or automatic verification, can be fed back to the prior knowledge database as a new expert rule item or new blacklist item, thus forming a continuous improvement mechanism.
4. Machine Learning Model
Based on the labeled dataset, the classical boosting machine learning model is trained to classify the financial transactions. Furthermore, the prior knowledge of expert rules and blacklists is incorporated into the model as a means of compensating for a shortage of training data and improving the prediction result. Meanwhile, a feedback mechanism is introduced to update the expert rule and blacklist database.
4.1. Boosting Machine Learning Model
First, according to actual business needs, we try to build a classification model with high interpretability and strong robustness. On the other hand, by analyzing the transaction data, it is easy to establish simple base models, and the base models can be integrated by the boosting method to form a high-accuracy integration model. Therefore, the boosting machine learning model is a preferred choice.
Figure 4 shows the flow chart of the boosting model. Data features are extracted from the raw data of payment transactions and are then fed into the boosting model for training and testing. In this paper, the representative boosting algorithms, such as Adaptive Boost (AdaBoost) [
44,
45], Gradient Boosting Decision Tree (GBDT) [
46,
47] and Extreme Gradient Boosting (XGBoost) [
48,
49], are selected and compared, and Square Difference Loss is selected as the loss function for all models, as in
4.2. Extension to the Boosting Model by Incorporating Prior Knowledge
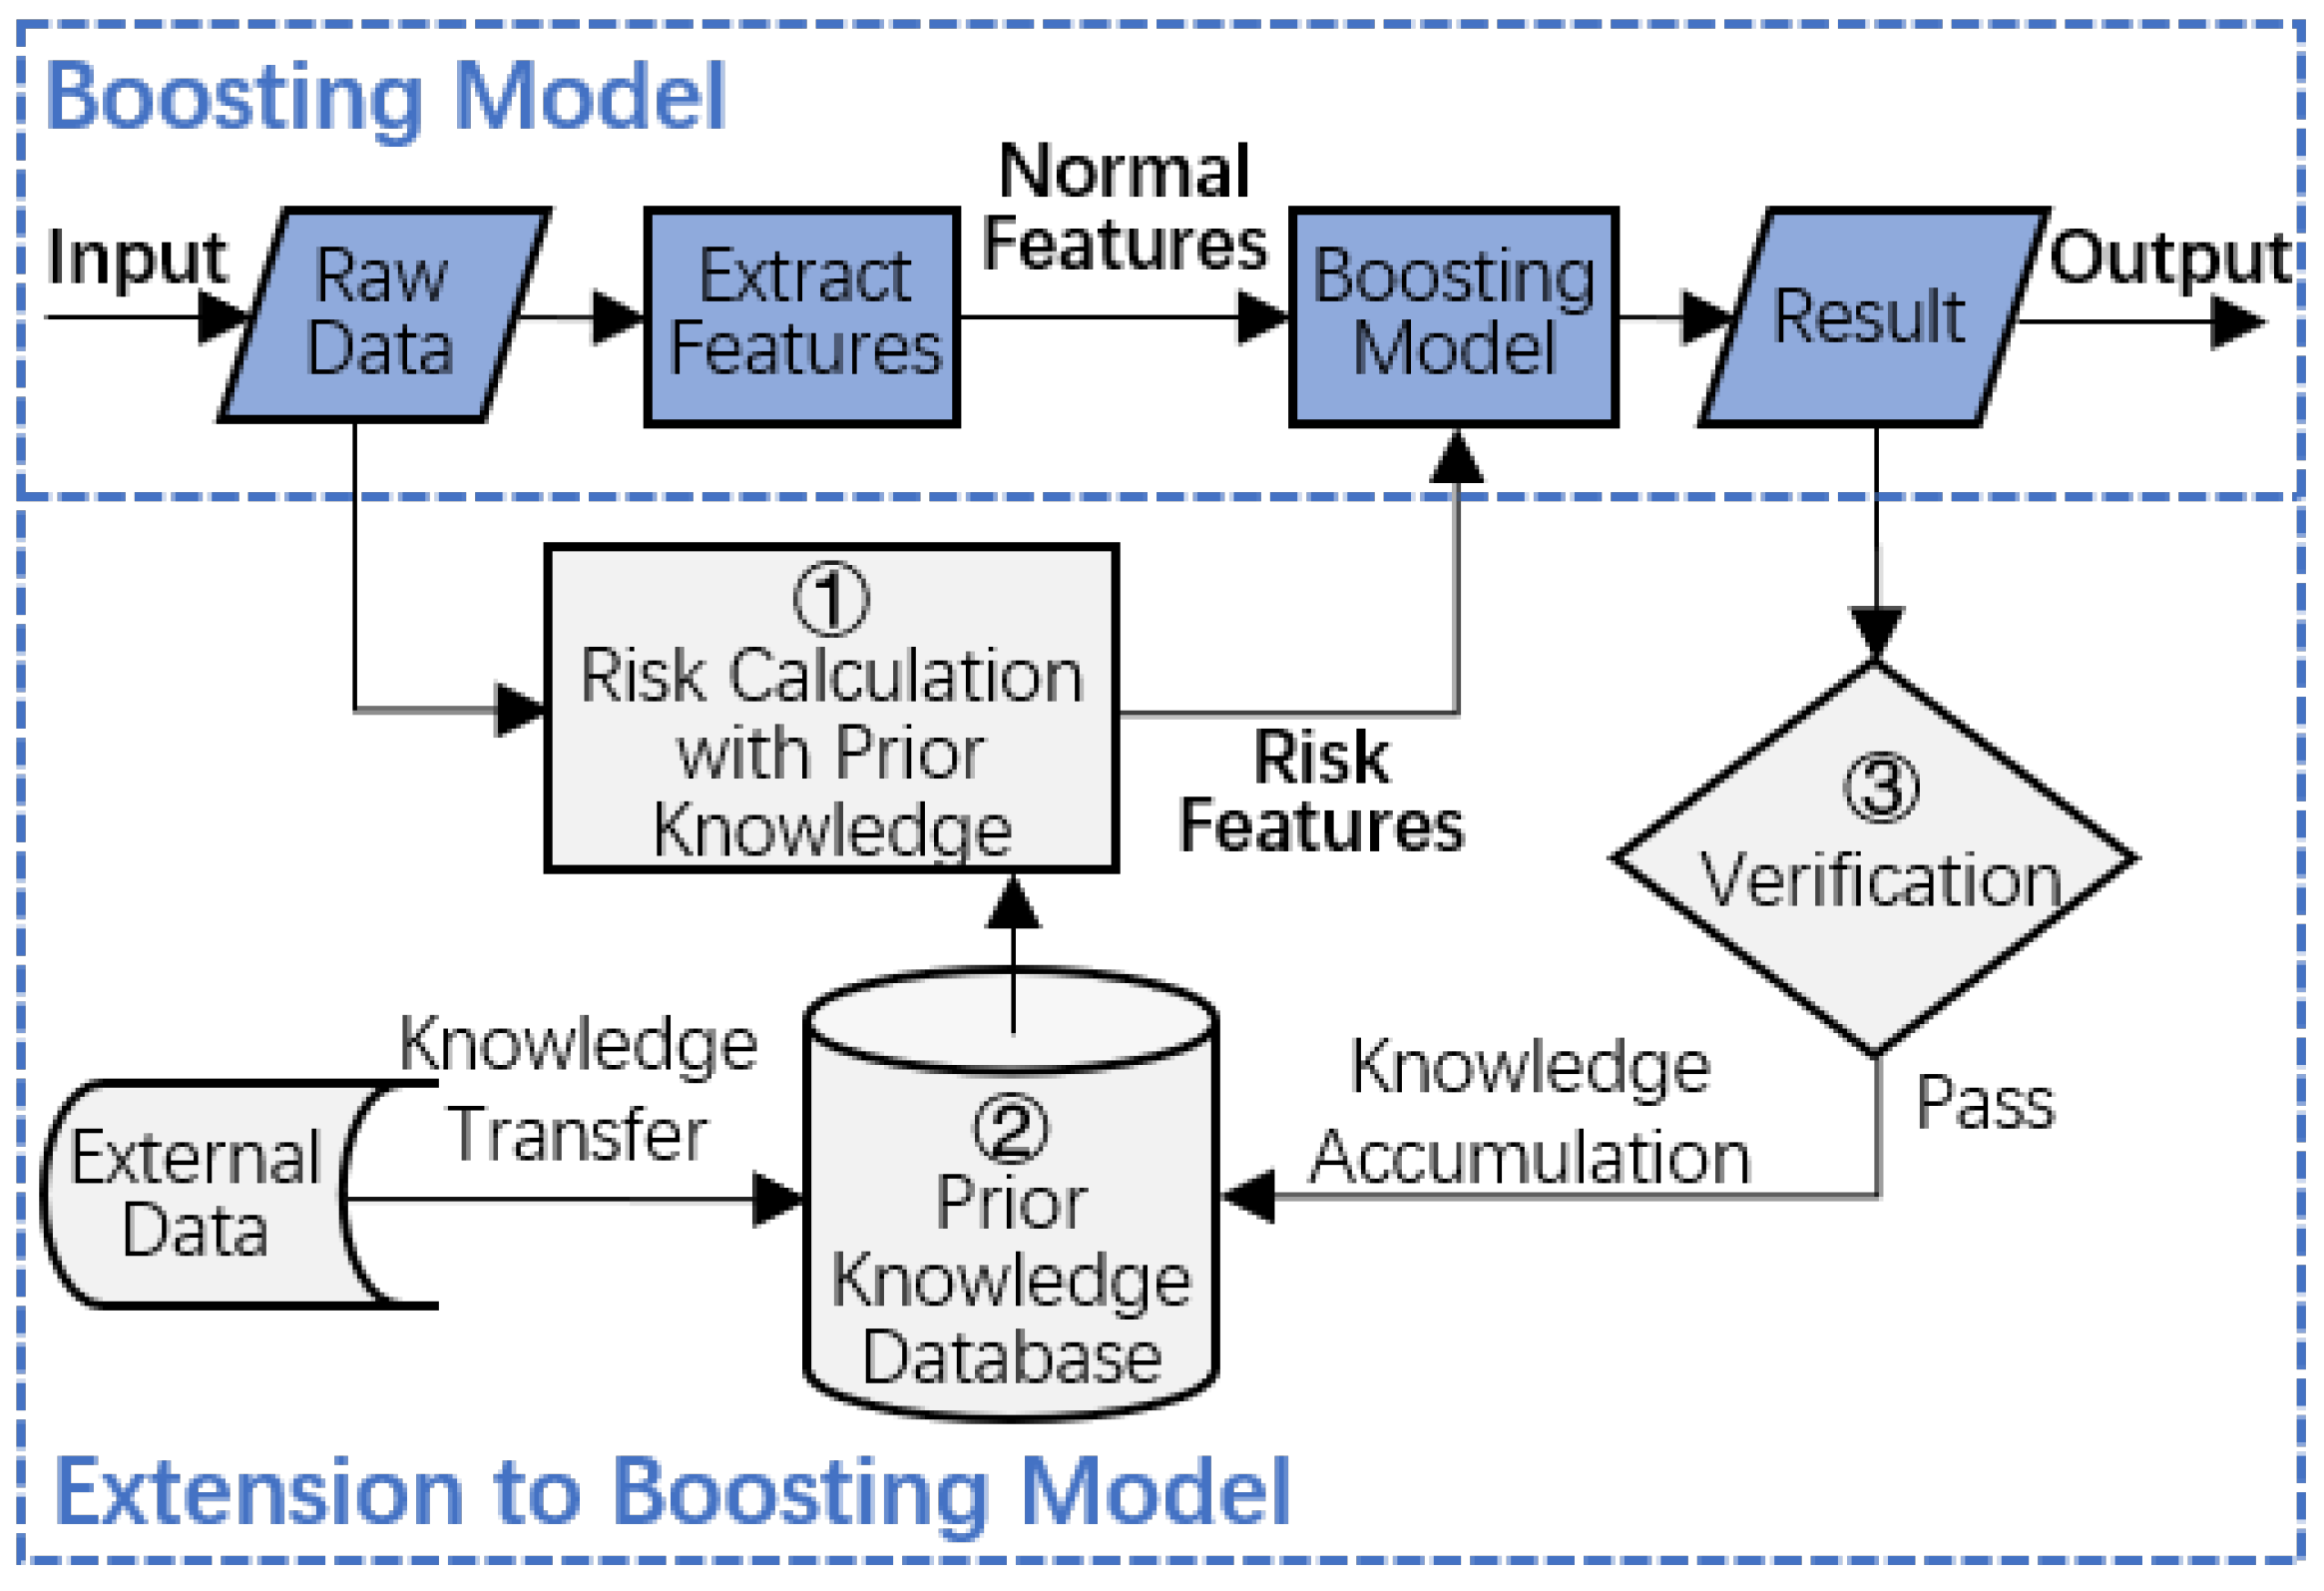
In its standard form, the boosting model does not allow for the direct incorporation of prior knowledge. In this article, an extension to boosting algorithms is presented, which permits the incorporation of prior human knowledge as a means of compensating for training data shortage and improving the prediction result. For example, the typical GBDT model is an iterative decision tree algorithm, which consists of multiple decision trees, and no prior knowledge can be incorporated into this model as input or feedbacks.
Figure 5 shows the flow chart of the extended boosting model. The following are 3 major modifications to the boosting model:
First, during daily system operations, business experts analyze payment transactions and establish a database of prior human knowledge, including expert rules [
50] and blacklists. The knowledge can be accumulated from historical fraud transactions or transferred from different domains [
51].
Second, prior human knowledge is applied to extract risk features, as shown in
Section 3.3. Risk features together with normal features are input into the boosting model to perform training and testing.
Third, the classification results are verified manually or automatically and are then fed back to prior knowledge database as new expert rule items and blacklist items, thus forming a continuous knowledge accumulation mechanism.
In conclusion, prior human knowledge is incorporated into the boosting model, and we expect the extended model will be smarter in classification and more accurate in prediction. As typical boosting algorithms such as AdaBoost, GBDT and XGBoost are specified, the extended boosting model is entitled extended AdaBoost, extended GBDT or extended XGBoost.
5. Model Training and Testing
5.1. Label the Dataset
The user operations on a mobile terminal will eventually generate a transaction to the server. We collected a dataset of payment transactions for 14 days, including operation data from the terminal side and transaction data from the server side. Business experts analyzed the data and labeled 1500 transactions by robotic automation as positive tag samples and 30,000 transactions by normal users as negative tag samples.
The labeled samples are divided into 3 datasets, each with 500 positive samples and 10,000 negative samples. The first dataset is for training, the second is for testing, and the third is used by business expert to build prior knowledge database of expert rules and blacklists.
5.2. Train and Test Boosting Model
We trained and tested typical boosting models AdaBoost, GBDT and XGBoost, respectively, with the training dataset and the testing dataset. The experimental results are shown in
Table 3 and
Figure 6.
The test result shows that the prediction accuracy rates are all over 90%. In comparison, XGBoost and GBDT achieve a recall rate of 80%+, exceeding AdaBoost. GBDT shows the best performance with prediction accuracy 98.25% and recall rate 88.8%.
5.3. Train and Test Extended Boosting Model
The first step is to populate the prior knowledge database. In this paper, we extracted new prior knowledge from the labeled dataset rather than used an existing database of massive prior knowledge, so the experimental results can be reproduced with lower cost. Business experts analyzed the dataset of 500 positive samples and 10,000 negative samples, established expert rule items and blacklist items and then imported the results into the prior knowledge database.
After the prior knowledge was imported, we trained and tested the extended boosting model with the same datasets used in
Section 5.2 and compared the prediction results. The experiment results are shown in
Table 4.
The experimental results show that the prediction results are improved after the introduction of prior knowledge, especially the recall rate. The accuracy rate increases to 98.71%, and the recall rate increases to 94.8%, which indicates that the extended boosting model proposed in this paper has a better performance. Specifically, extended GBDT shows the best prediction accuracy and highest recall rate among all boosting models and extended boosting models.
The hyperparameters used in the boosting models are as follows: learning rate is 0.1, the number of boosting stages is 400, the fraction of samples for fitting the individual base learners is 0.7, the random seed given to each Tree estimator at each boosting iteration is 160.
6. Behavior Patterns of Robotic Automation
Due to the large quantity of fraudulent transactions conducted by robots, it is critically important for APP developers and service providers to understand the behavior patterns of robotic automation, which will be helpful for them to prevent fraudulent transactions.
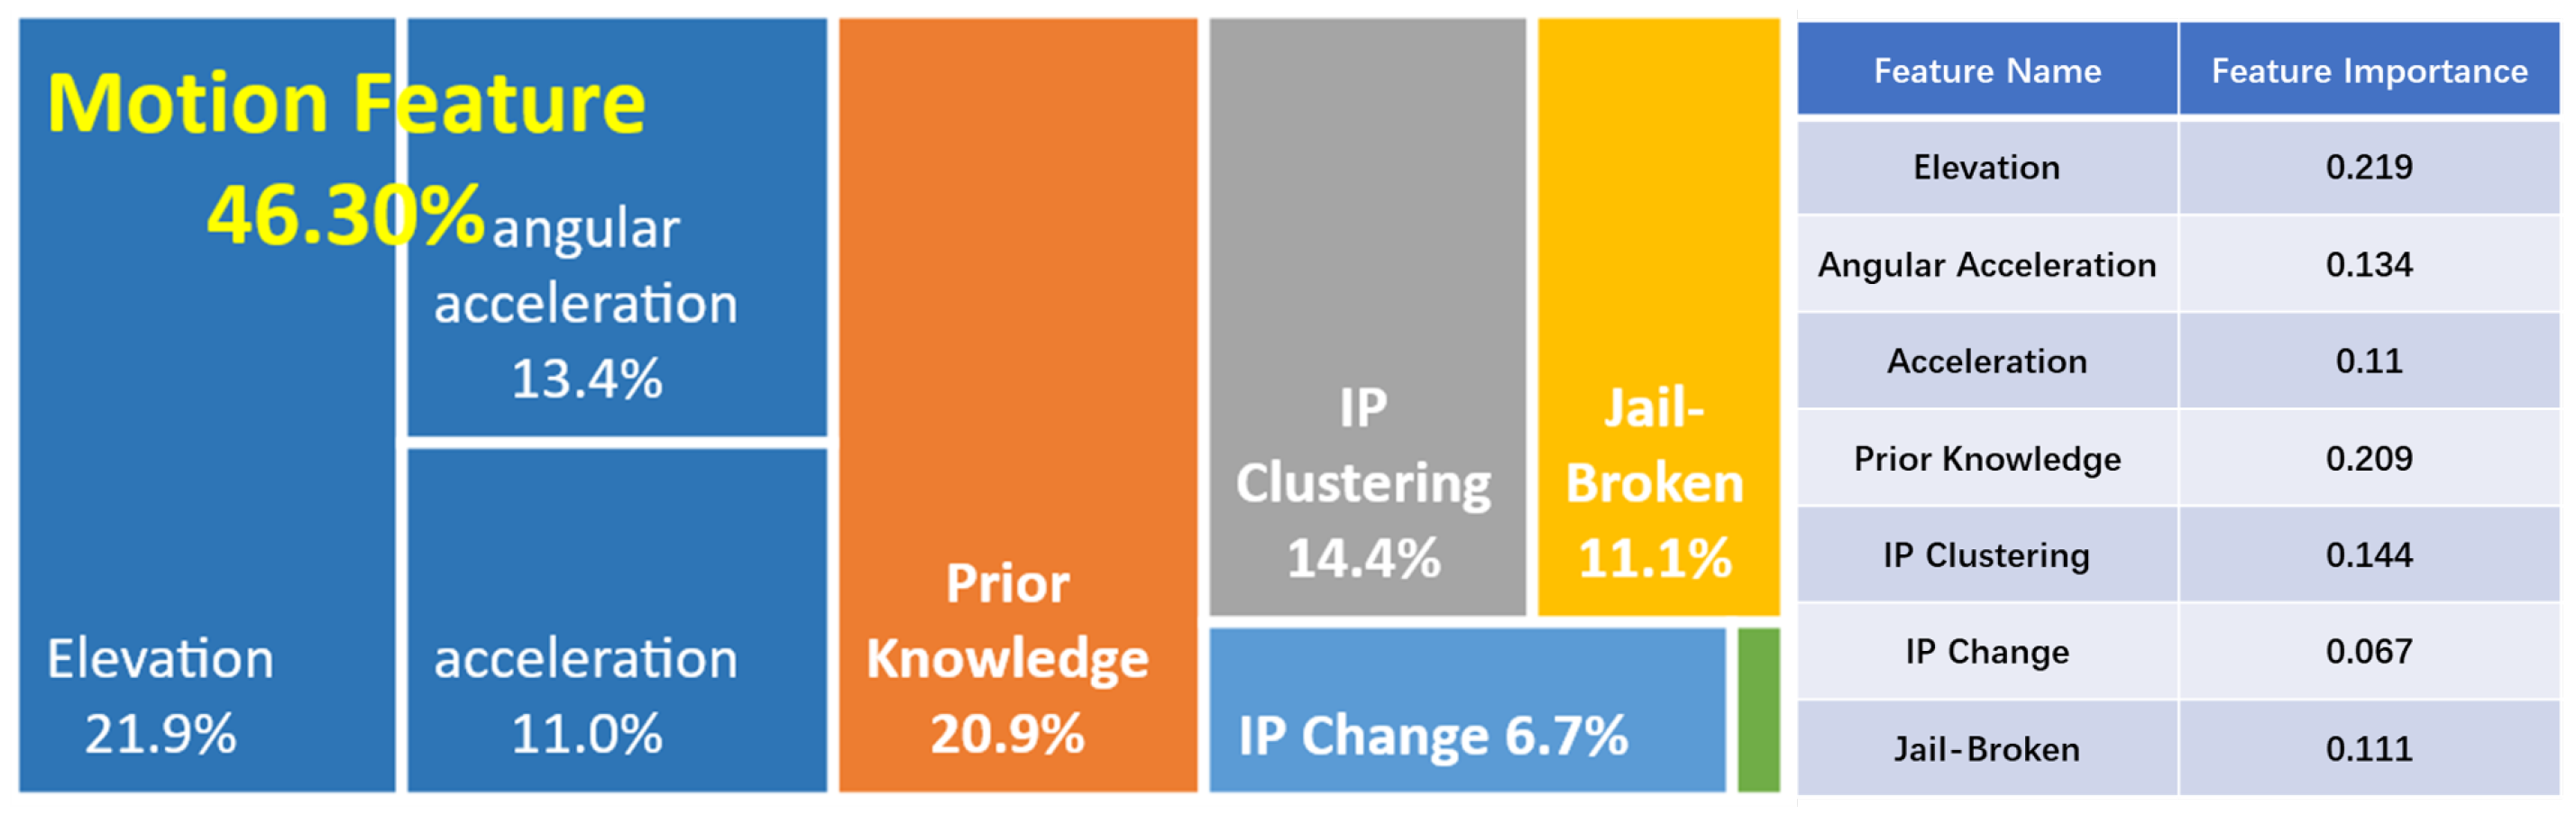
Therefore, we performed further analysis on the importance of all features in distinguishing robotic automation. The top 5 features in importance ranking of extended GBDT model are shown in
Figure 7. The device motion features (including acceleration, angular acceleration, elevation angle, etc.) show the highest importance value of 46.3%, and other features include prior knowledge (20.9%), device IP clustering, device jailbroken rate and IP change count. These results indicate that device motion features and prior knowledge features are the most important factors in distinguishing robotic automation.
6.1. Device Movement Pattern
The devices manipulated by robots show obvious differences in movement features (acceleration, angular acceleration, elevation angle) compared with devices operated by normal users. Robot devices show less or even no change in movement feature data, while normal devices show much more change. Therefore, different motion patterns are observed [
52].
We further analyze feature data of device movement from the following two aspects: the short 5-min period during each transaction and the long 24-h period of entire day.
As shown in
Figure 8, from aspect of the short 5-min period during each transaction, more than 56% of robot devices are in static state (acceleration, angular acceleration and elevation fluctuations are near 0), and approximately 30% devices are in slight-motion state (acceleration, angular acceleration is less than 1, and the elevation angle is less than
), only 14% devices are in obvious motion state (acceleration, angular acceleration angle is greater than 1, and elevation angle is greater than
). In comparison, for devices operated by normal users, only 1% are in static state, 8% are in slight-motion state, and 91%+ are in obvious motion state. Compared with robot devices, normal devices show much more fluctuation in motion as follows: 14.5 times in acceleration, 70.7 times in angular acceleration and 13.7 times in elevation angle.
As shown in
Figure 9, from the aspect of the long 24-h period of an entire day, normal devices also show much more motion fluctuation compared with robot devices as follows: 8.6 times in acceleration, 18.4 times in angular acceleration and 5.4 times in elevation angle.
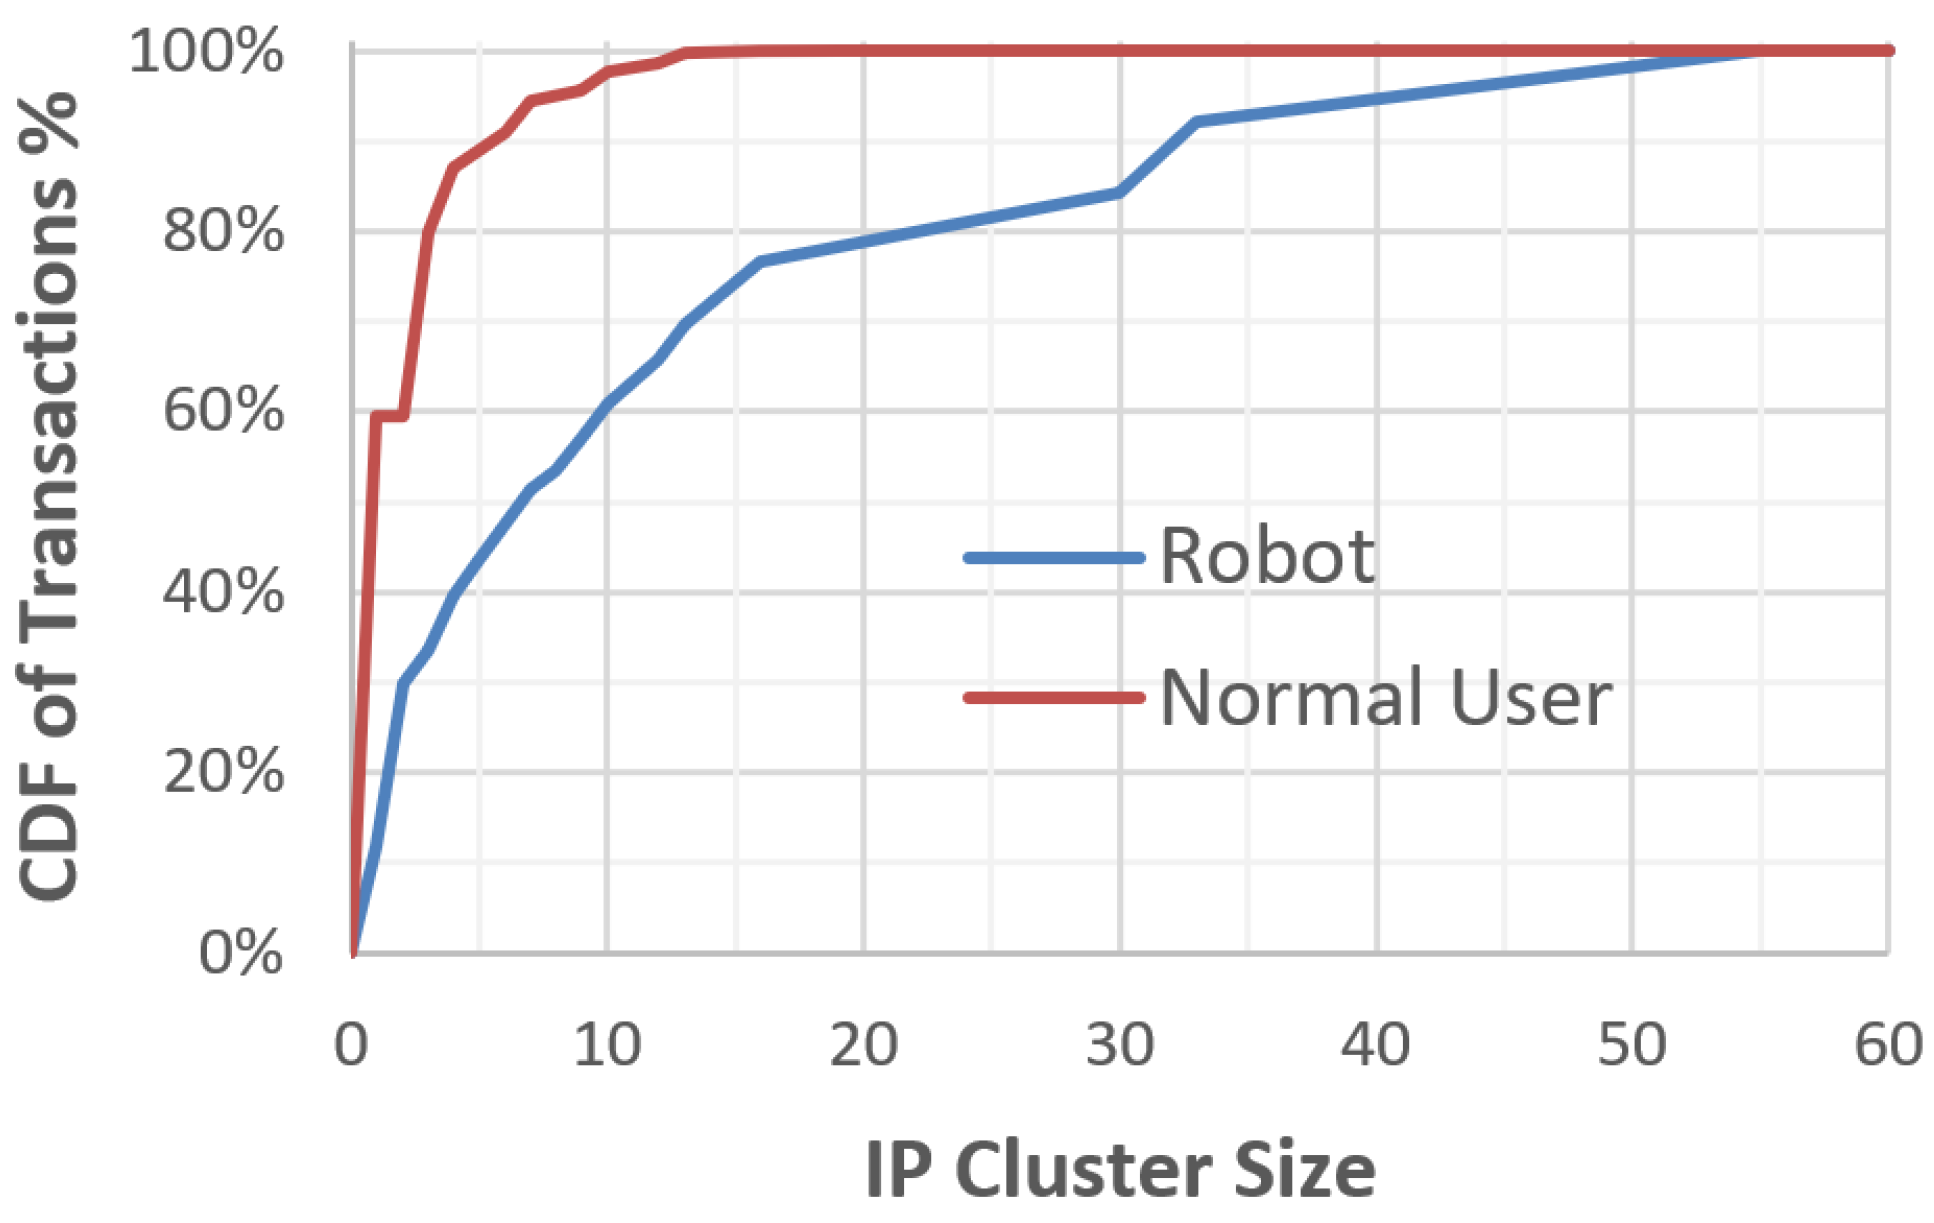
6.2. IP Address Group-Clustering Pattern
Robotic transactions show strong group-clustering features in IP address, and a large number of robot devices share the same IP address. The average IP cluster size of robotic transactions is 13.86. The biggest cluster size is 55. More than 60% of robotic transactions exhibit group-clustering feature (5+ devices share one IP address). In comparison, the average IP cluster size of normal user transactions is only 2.58 and only 13% normal user transactions exhibit group-clustering features, as shown in
Figure 10.
6.3. Device Jailbroken Rate
The device jailbroken rate of robot transactions is 92.47%, which is significantly higher than that of normal user transactions 4.64%, as shown in
Figure 11.
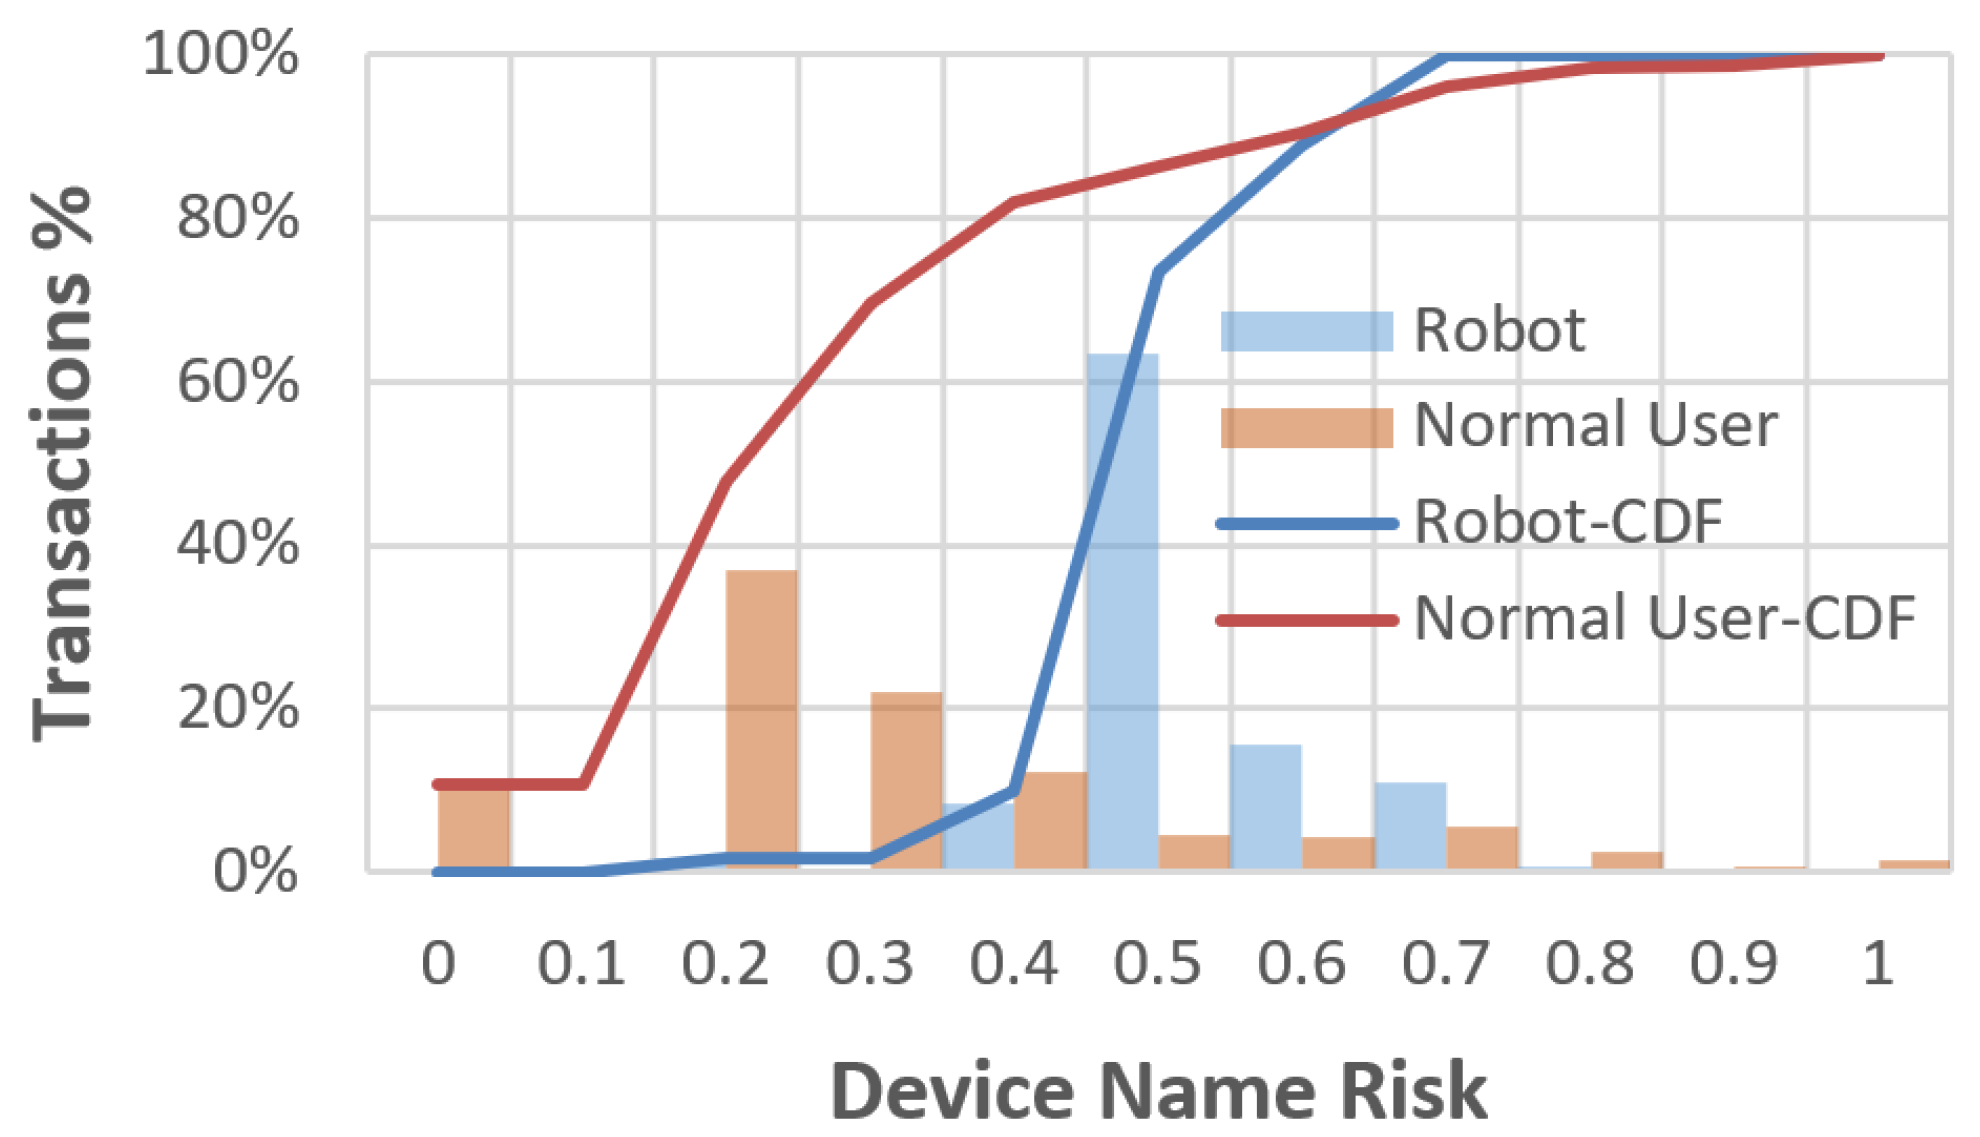
6.4. Device Naming Pattern
The device names of 85% of robotic transactions are in irregular or random pattern, such as ‘sadfkls’, while most device names of normal user transactions are in personalized pattern such as “xxx’s iphone”. Based on calculation result, the average device name risk of robotic transactions is 0.47, while that of normal user transactions is only 0.28. Only 9.8% of robotic transactions are low risk in device name (name risk value is less than 0.4), while 81.9% normal user transactions are low risk in device name. See
Figure 12 for more details.
6.5. IP Address Change Pattern
Normal devices change IP address more frequently than robot devices. Average IP changes in 24 h of robot devices is 2.1 while that of normal devices is 2.77. For robot devices, 34% do not change IP in 24 h, 71%+ change less than 1 time, and only 29% change twice or more times. For normal devices, 37% don’t change in 24 h, 38% change less than 1 time, and 62% changes two times or more.
Figure 13 shows more details.
7. Discussion and Future Work
The fraud detection method proposed in this paper is based on the extended boosting machine learning of data features in a transaction period and an entire day. According to the analysis in the above article, the model will be more accurate and robust if data features over a longer time period (i.e., one week or one month) can be extracted and used.
In this paper, various features are considered separately in the boosting model. In fact, complex correlations may exist among different features. For example, during normal user operation, motion sensor information such as elevation, acceleration and angular acceleration have close relations with each other in certain pattern. The model will be more accurate and robust if the correlation patterns of different features are introduced into it.
Each normal user will have his/her personalized operation pattern, and a pattern recognition model may be established to help improve the user identification. The identity recognition based on user operation pattern is a further extension of robot-human recognition and has a wider application prospect.
The comparison of the proposed method with related works mentioned in
Section 1 are shown in
Table 5.
8. Conclusions
Based on transaction data collected from mobile terminals through a widely deployed mobile APP, this article proposes an extended boosting model to recognize robot operation and normal user operation on mobile devices. The extended boosting model is established by introducing prior knowledge into the boosting model and effectively solved the recognition problem of the group-clustering and continuity patterns of robot operation. According to the test results, the accuracy rate reaches 98.7%, and the recall rate reaches 94.8%.
The feature importance is further analyzed based on the model prediction results, and the results indicate that the features of device movement, prior knowledge, IP cluster size, device jailbroken rate and IP change count contribute most during model classification. The pattern differences between robotic automation and normal user operation from the aspects of device movement pattern, IP clustering pattern, device jailbroken rate, device naming pattern, IP change pattern are analyzed in detail to help improve the interpretability of the model.
Author Contributions
Conceptualization, Q.S. and H.C.; methodology, Q.S. and T.T.; investigation, Q.S. and Y.C.; formal analysis, H.C. and J.W.; resources, J.W. and T.T.; validation, Q.S. and T.T.; visualization, Q.S. and Y.C.; writing—original draft preparation, Q.S.; writing—review and editing, T.T. All authors have read and agreed to the published version of the manuscript.
Funding
This work was supported in part by the Program of Shanghai Academic/Technology Research Leader under Grant 19XD1433700.
Institutional Review Board Statement
Not applicable.
Informed Consent Statement
Not applicable.
Data Availability Statement
The data is collected on mobile terminals under user authorization, and processed by authorized professionals in a secure environment. Therefore the data may not be publicly disclosed.
Acknowledgments
The National Engineering Laboratory for Electronic Commerce and Electronic Payment provided the experimental environment for the model validation in this article, and we are thankful for suggestions from manager Zheng Jianbin for model improvements.
Conflicts of Interest
The authors declare no conflict of interest.
Abbreviations
The following abbreviations are used in this manuscript:
| GBDT | Gradient Boosting Decision Tree |
| XGBoost | Extreme Gradient Boosting |
| CDF | Cumulative Distribution Function |
References
- The People’s Bank of China. Payment System Report (2019). Techreport, People’s Bank of China, 2020. Available online: http://www.pbc.gov.cn/zhifujiesuansi/128525/128545/128643/3787878/index.html (accessed on 1 March 2020).
- Xu, H.; Liu, D.; Wang, H.; Stavrou, A. E-commerce reputation manipulation: The emergence of reputation-escalation-as-a-service. In Proceedings of the 24th International Conference on World Wide Web, Florence, Italy, 18–22 May 2015; pp. 1296–1306. [Google Scholar]
- Chen, L.; Li, W.; Chen, H.; Geng, S. Detection of fake reviews: Analysis of sellers’ manipulation behavior. Sustainability 2019, 11, 4802. [Google Scholar] [CrossRef] [Green Version]
- Wu, B.; Liu, L.; Dai, Z.; Wang, X.; Zheng, K. Detecting Malicious Social Robots with Generative Adversarial Networks. KSII Trans. Internet Inf. Syst. 2019, 13, 5594–5615. [Google Scholar]
- Varol, O.; Ferrara, E.; Davis, C.A.; Menczer, F.; Flammini, A. Online human-bot interactions: Detection, estimation, and characterization. In Proceedings of the Eleventh International AAAI Conference on Web and Social Media, Montreal, QC, Canada, 15–18 May 2017. [Google Scholar]
- Subudhi, S.; Panigrahi, S. Quarter-sphere support vector machine for fraud detection in mobile telecommunication networks. Procedia Comput. Sci. 2015, 48, 353–359. [Google Scholar] [CrossRef] [Green Version]
- Ferrara, E.; Varol, O.; Davis, C.; Menczer, F.; Flammini, A. The rise of social bots. Commun. ACM 2016, 59, 96–104. [Google Scholar] [CrossRef] [Green Version]
- Ratkiewicz, J.; Conover, M.D.; Meiss, M.; Gonçalves, B.; Flammini, A.; Menczer, F.M. Detecting and tracking political abuse in social media. In Proceedings of the Fifth International AAAI Conference on Weblogs and Social Media, Barcelona, Spain, 17–21 July 2011. [Google Scholar]
- Lee, K.; Caverlee, J.; Cheng, Z.; Sui, D.Z. Campaign extraction from social media. ACM Trans. Intell. Syst. Technol. 2014, 5, 1–28. [Google Scholar] [CrossRef]
- Das, A.; Gollapudi, S.; Kıcıman, E.; Varol, O. Information dissemination in heterogeneous-intent networks. In Proceedings of the 8th ACM Conference on Web Science, Hannover, Germany, 22–25 May 2016; pp. 259–268. [Google Scholar]
- Dong, W.; Liao, S.; Zhang, Z. Leveraging financial social media data for corporate fraud detection. J. Manag. Inf. Syst. 2018, 35, 461–487. [Google Scholar] [CrossRef]
- Chavoshi, N.; Hamooni, H.; Mueen, A. Identifying correlated bots in twitter. In International Conference on Social Informatics; Springer: Berlin, Germany, 2016; pp. 14–21. [Google Scholar]
- Guo, D.; Chen, C. Detecting non-personal and spam users on geo-tagged Twitter network. Trans. GIS 2014, 18, 370–384. [Google Scholar] [CrossRef]
- Hsu, P.Y.; Lei, H.T.; Huang, S.H.; Liao, T.H.; Lo, Y.C.; Lo, C.C. Effects of sentiment on recommendations in social network. Electron. Mark. 2019, 29, 253–262. [Google Scholar] [CrossRef]
- Ferrara, E.; Yang, Z. Quantifying the effect of sentiment on information diffusion in social media. PeerJ Comput. Sci. 2015, 1, e26. [Google Scholar] [CrossRef] [Green Version]
- Jeng, A.B.; Tseng, C.C.; Tseng, D.F.; Wang, J.C. A study of CAPTCHA and its application to user authentication. In International Conference on Computational Collective Intelligence; Springer: Berlin, Germany, 2010; pp. 433–440. [Google Scholar]
- Xu, Y.; Lu, G.; Lu, Y.; Zhang, D. High resolution fingerprint recognition using pore and edge descriptors. Pattern Recognit. Lett. 2019, 125, 773–779. [Google Scholar] [CrossRef]
- Peng, G.; Zhou, G.; Nguyen, D.T.; Qi, X.; Yang, Q.; Wang, S. Continuous authentication with touch behavioral biometrics and voice on wearable glasses. IEEE Trans. Hum. Mach. Syst. 2016, 47, 404–416. [Google Scholar] [CrossRef]
- Cavazos, J.G.; Phillips, P.J.; Castillo, C.D.; O’Toole, A.J. Accuracy comparison across face recognition algorithms: Where are we on measuring race bias? arXiv 2019, arXiv:1912.07398. [Google Scholar] [CrossRef]
- Zhu, W.; Gao, H.; He, Z.; Qin, J.; Han, B. A Hybrid Approach for Recognizing Web Crawlers. In International Conference on Wireless Algorithms, Systems, and Applications; Springer: Berlin, Germany, 2019; pp. 507–519. [Google Scholar]
- Jiang, Y.; Tang, W.; Guo, L. Offensive and defensive strategy of web crawler. In Proceedings of the 10th World Congress on Intelligent Control and Automation, Beijing, China, 6–8 July 2012; pp. 355–358. [Google Scholar]
- Bursztein, E.; Martin, M.; Mitchell, J. Text-based CAPTCHA strengths and weaknesses. In Proceedings of the 18th ACM conference on Computer and Communications Security, Chicago, IL, USA, 2011, 17–21 October; pp. 125–138.
- Hernandez-Castro, C.J.; Ribagorda, A. Pitfalls in CAPTCHA design and implementation: The Math CAPTCHA, a case study. Comput. Secur. 2010, 29, 141–157. [Google Scholar] [CrossRef]
- Desai, A.; Patadia, P. Drag and drop: A better approach to CAPTCHA. In Proceedings of the 2009 Annual IEEE India Conference, Ahmedabad, India, 18–20 December 2009; pp. 1–4. [Google Scholar]
- Lee, Y.K.; Lee, D.G.; Han, J.W.; Kim, T.H. Home network device authentication: Device authentication framework and device certificate profile. Comput. J. 2009, 52, 871–877. [Google Scholar] [CrossRef]
- Xu, D.; Wang, B.; Du, X.; Zhu, X.; Yu, X.; Liu, J.; Guan, Z. Verification Code Recognition Based on Active and Deep Learning. In Proceedings of the 2019 International Conference on Computing, Networking and Communications (ICNC), Honolulu, HI, USA, 18–21 February 2019; pp. 453–456. [Google Scholar]
- Li, S.; Li, X. Mobile Security Payment Solution Based on Encrypted SMS Verification Code. In Proceedings of the 7th International Conference on Education, Management, Information and Mechanical Engineering (EMIM 2017), Shenyang, China, 28–30 April 2017. [Google Scholar]
- Bujang, S.D.A.; Selamat, A. Verification of Mobile SMS Application with Model Checking Agent. In Proceedings of the 2009 International Conference on Information and Multimedia Technology, Jeju, Korea, 16–18 December 2009; pp. 361–365. [Google Scholar]
- Mulliner, C.; Borgaonkar, R.; Stewin, P.; Seifert, J.P. SMS-based one-time passwords: Attacks and defense. In International Conference on Detection of Intrusions and Malware, and Vulnerability Assessment; Springer: Berlin, Germany, 2013; pp. 150–159. [Google Scholar]
- Clancy, T.C.; Kiyavash, N.; Lin, D.J. Secure smartcardbased fingerprint authentication. In Proceedings of the 2003 ACM SIGMM Workshop on Biometrics Methods and Applications; Association for Computing Machinery: New York, NY, USA, 2003; pp. 45–52. [Google Scholar]
- Jo, Y.H.; Jeon, S.Y.; Im, J.H.; Lee, M.K. Security analysis and improvement of fingerprint authentication for smartphones. Mob. Inf. Syst. 2016, 2016, 8973828. [Google Scholar] [CrossRef]
- Wen, D.; Han, H.; Jain, A.K. Face spoof detection with image distortion analysis. IEEE Trans. Inf. Forensics Secur. 2015, 10, 746–761. [Google Scholar] [CrossRef]
- Boulkenafet, Z.; Komulainen, J.; Hadid, A. Face spoofing detection using colour texture analysis. IEEE Trans. Inf. Forensics Secur. 2016, 11, 1818–1830. [Google Scholar] [CrossRef]
- Tirunagari, S.; Poh, N.; Windridge, D.; Iorliam, A.; Suki, N.; Ho, A.T. Detection of face spoofing using visual dynamics. IEEE Trans. Inf. Forensics Secur. 2015, 10, 762–777. [Google Scholar] [CrossRef] [Green Version]
- Atoum, Y.; Liu, Y.; Jourabloo, A.; Liu, X. Face anti-spoofing using patch and depth-based CNNs. In Proceedings of the 2017 IEEE International Joint Conference on Biometrics (IJCB), Denver, CO, USA, 1–4 October 2017; pp. 319–328. [Google Scholar]
- Liu, S.; Yuen, P.C.; Zhang, S.; Zhao, G. 3D mask face anti-spoofing with remote photoplethysmography. In European Conference on Computer Vision; Springer: Berlin, Germany, 2016; pp. 85–100. [Google Scholar]
- Zong, Y.; Zheng, W.; Cui, Z.; Zhao, G.; Hu, B. Toward bridging microexpressions from different domains. IEEE Trans. Cybern. 2019, 50, 5047–5060. [Google Scholar] [CrossRef]
- Suzaki, K.; Shimizu, K.; Oguchi, K. Feasible Personal Identification by Eye Blinking Using Wearable Device. In Proceedings of the 2019 IEEE 15th International Colloquium on Signal Processing & Its Applications (CSPA), Penang, Malaysia, 8–9 March 2019; pp. 266–269. [Google Scholar]
- Anjos, A.; Chakka, M.M.; Marcel, S. Motion-based counter-measures to photo attacks in face recognition. IET Biom. 2013, 3, 147–158. [Google Scholar] [CrossRef] [Green Version]
- Taneja, M.; Garg, K.; Purwar, A.; Sharma, S. Prediction of click frauds in mobile advertising. In Proceedings of the 2015 Eighth International Conference on Contemporary Computing (IC3), Noida, India, 20–22 August 2015; pp. 162–166. [Google Scholar]
- Chouhan, P.; Richhariya, V. A survey: Analysis of current approaches in anomaly detection. Int. J. Comput. Appl. 2015, 111, 32–36. [Google Scholar]
- Karim, A.; Salleh, R.; Khan, M.K. SMARTbot: A behavioral analysis framework augmented with machine learning to identify mobile botnet applications. PLoS ONE 2016, 11, e0150077. [Google Scholar] [CrossRef] [PubMed]
- Coskun, B. (Un) wisdom of Crowds: Accurately Spotting Malicious IP Clusters Using Not-So-Accurate IP Blacklists. IEEE Trans. Inf. Forensics Secur. 2017, 12, 1406–1417. [Google Scholar] [CrossRef]
- Wang, F.; Li, Z.; He, F.; Wang, R.; Yu, W.; Nie, F. Feature learning viewpoint of adaboost and a new algorithm. IEEE Access 2019, 7, 149890–149899. [Google Scholar] [CrossRef]
- Hastie, T.; Rosset, S.; Zhu, J.; Zou, H. Multi-class adaboost. Stat. Interface 2009, 2, 349–360. [Google Scholar] [CrossRef] [Green Version]
- Si, S.; Zhang, H.; Keerthi, S.S.; Mahajan, D.; Dhillon, I.S.; Hsieh, C.J. Gradient boosted decision trees for high dimensional sparse output. In Proceedings of the 34th International Conference on Machine Learning-Volume 70. JMLR. org, Sydney, NSW, Australia, 6–11 August 2017; pp. 3182–3190. [Google Scholar]
- Ye, J.; Chow, J.H.; Chen, J.; Zheng, Z. Stochastic gradient boosted distributed decision trees. In Proceedings of the 18th ACM Conference on Information and Knowledge Management, Hong Kong, China, 2–6 November 2009; pp. 2061–2064. [Google Scholar]
- Chen, T.; Guestrin, C. Xgboost: A scalable tree boosting system. In Proceedings of the 22nd Acm Sigkdd International Conference on Knowledge Discovery and Data Mining, San Francisco, CA, USA, 13–17 August 2016; pp. 785–794. [Google Scholar]
- Chen, T.; He, T.; Benesty, M.; Khotilovich, V.; Tang, Y. Xgboost: Extreme Gradient Boosting; Chen, T., Ed.; R Package Version 0.4-2; Github: San Francisco, CA, USA, 2015; pp. 1–4. [Google Scholar]
- Smith, S.; Kandel, A. Verification and Validation of Rule-Based Expert Systems; CRC Press: Boca Raton, FL, USA, 2018. [Google Scholar]
- Zhang, J.; Shakya, S.S. Knowledge transfer for feature generation in document classification. In Proceedings of the 2009 International Conference on Machine Learning and Applications, Miami, FL, USA, 13–15 December 2009; pp. 255–260. [Google Scholar]
- Susi, M.; Renaudin, V.; Lachapelle, G. Motion mode recognition and step detection algorithms for mobile phone users. Sensors 2013, 13, 1539–1562. [Google Scholar] [CrossRef] [PubMed]
- Meng, Q. Rapid Door Number Recognition by a Humanoid Mobile Robot. J. Intell. Robot. Syst. 2005, 43, 33–54. [Google Scholar] [CrossRef]
| Publisher’s Note: MDPI stays neutral with regard to jurisdictional claims in published maps and institutional affiliations. |
© 2021 by the authors. Licensee MDPI, Basel, Switzerland. This article is an open access article distributed under the terms and conditions of the Creative Commons Attribution (CC BY) license (https://creativecommons.org/licenses/by/4.0/).


