A Novel Wearable Foot and Ankle Monitoring System for the Assessment of Gait Biomechanics


Abstract
:Featured Application
Abstract
1. Introduction
2. Materials and Methods
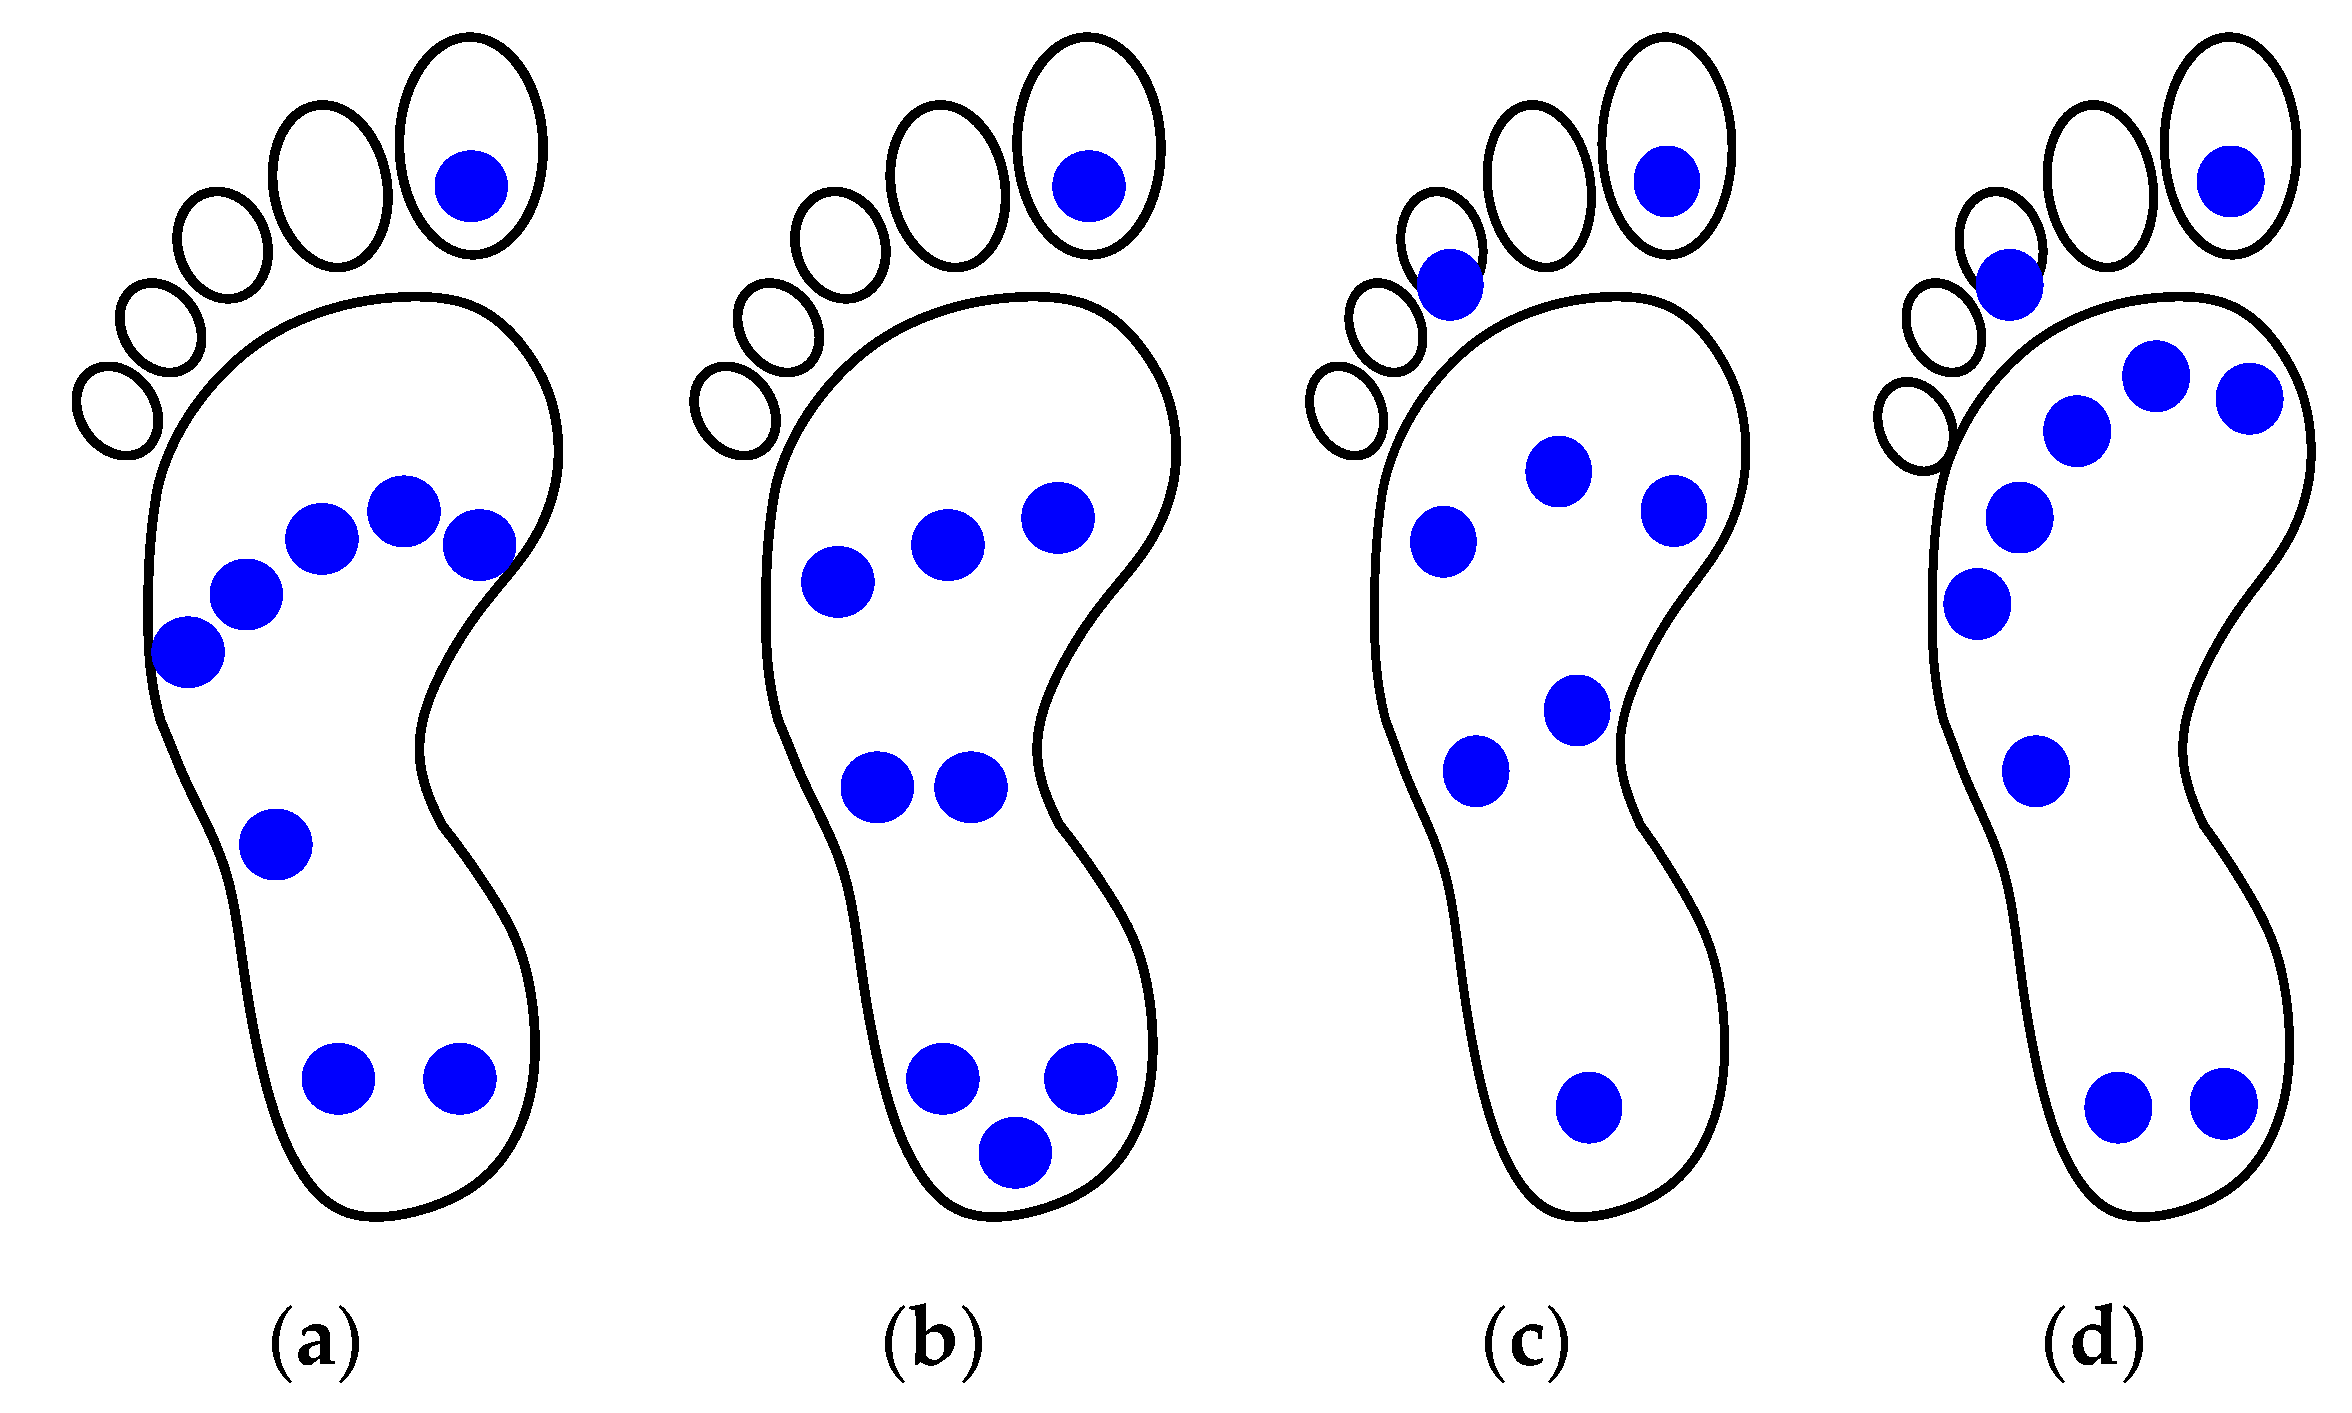
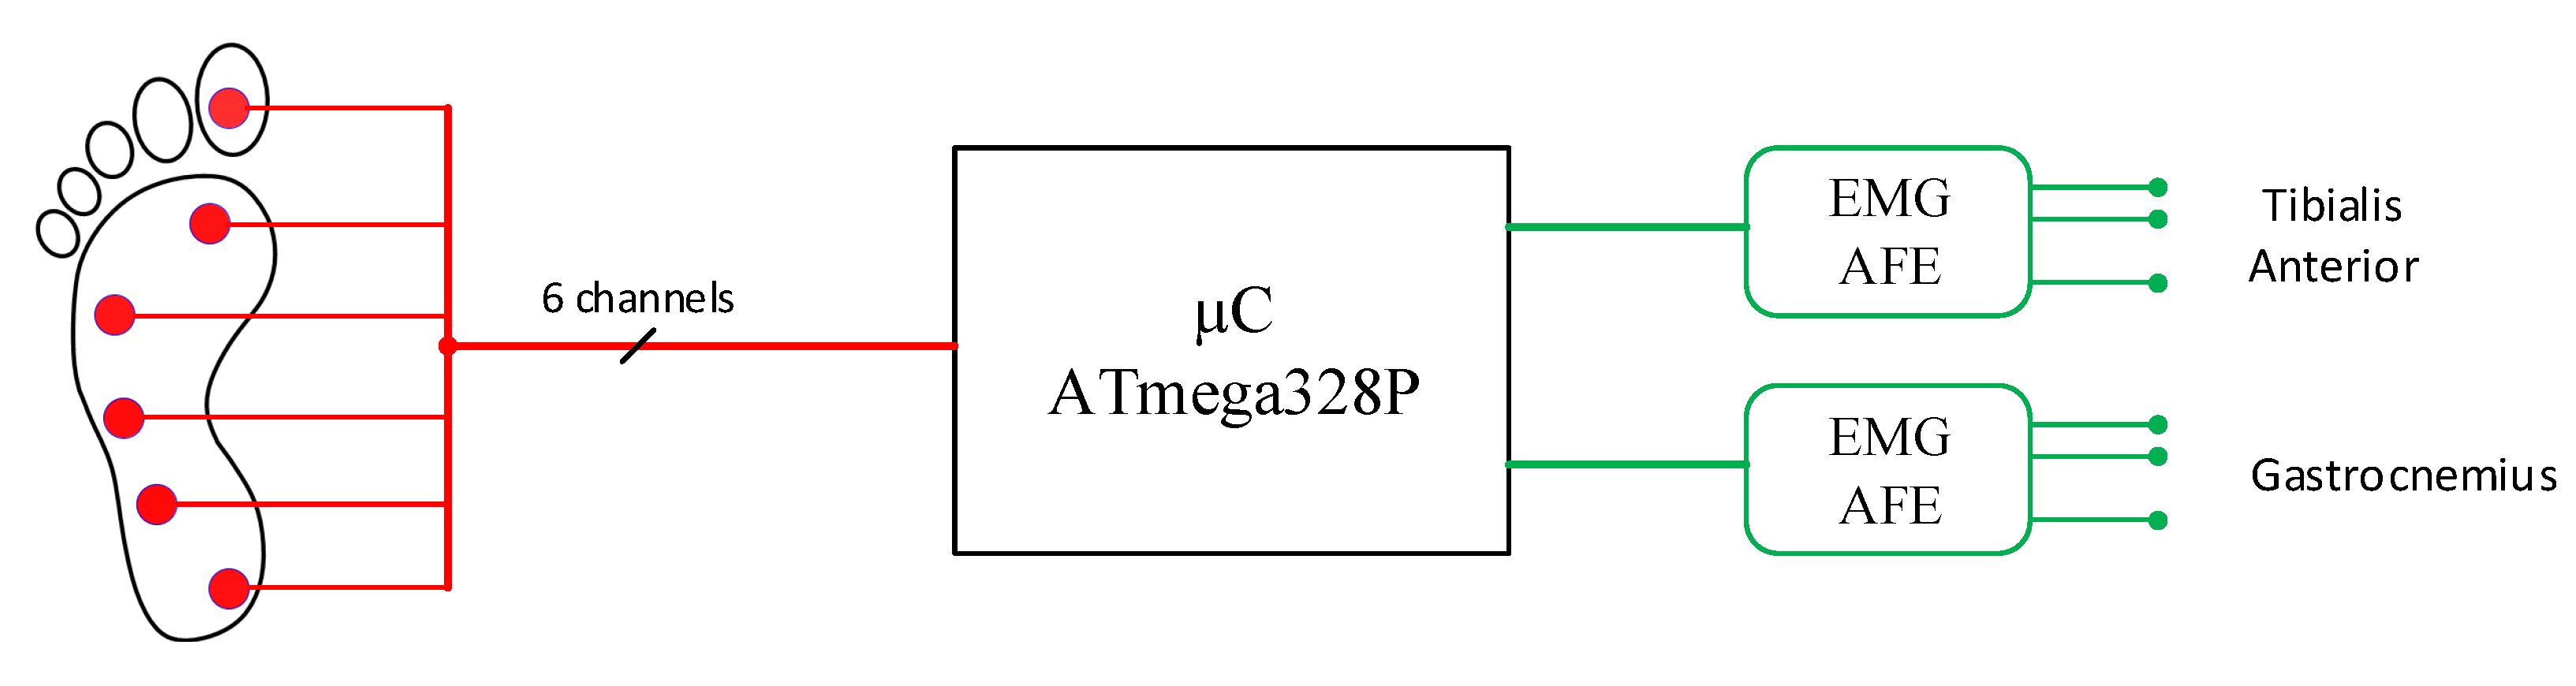
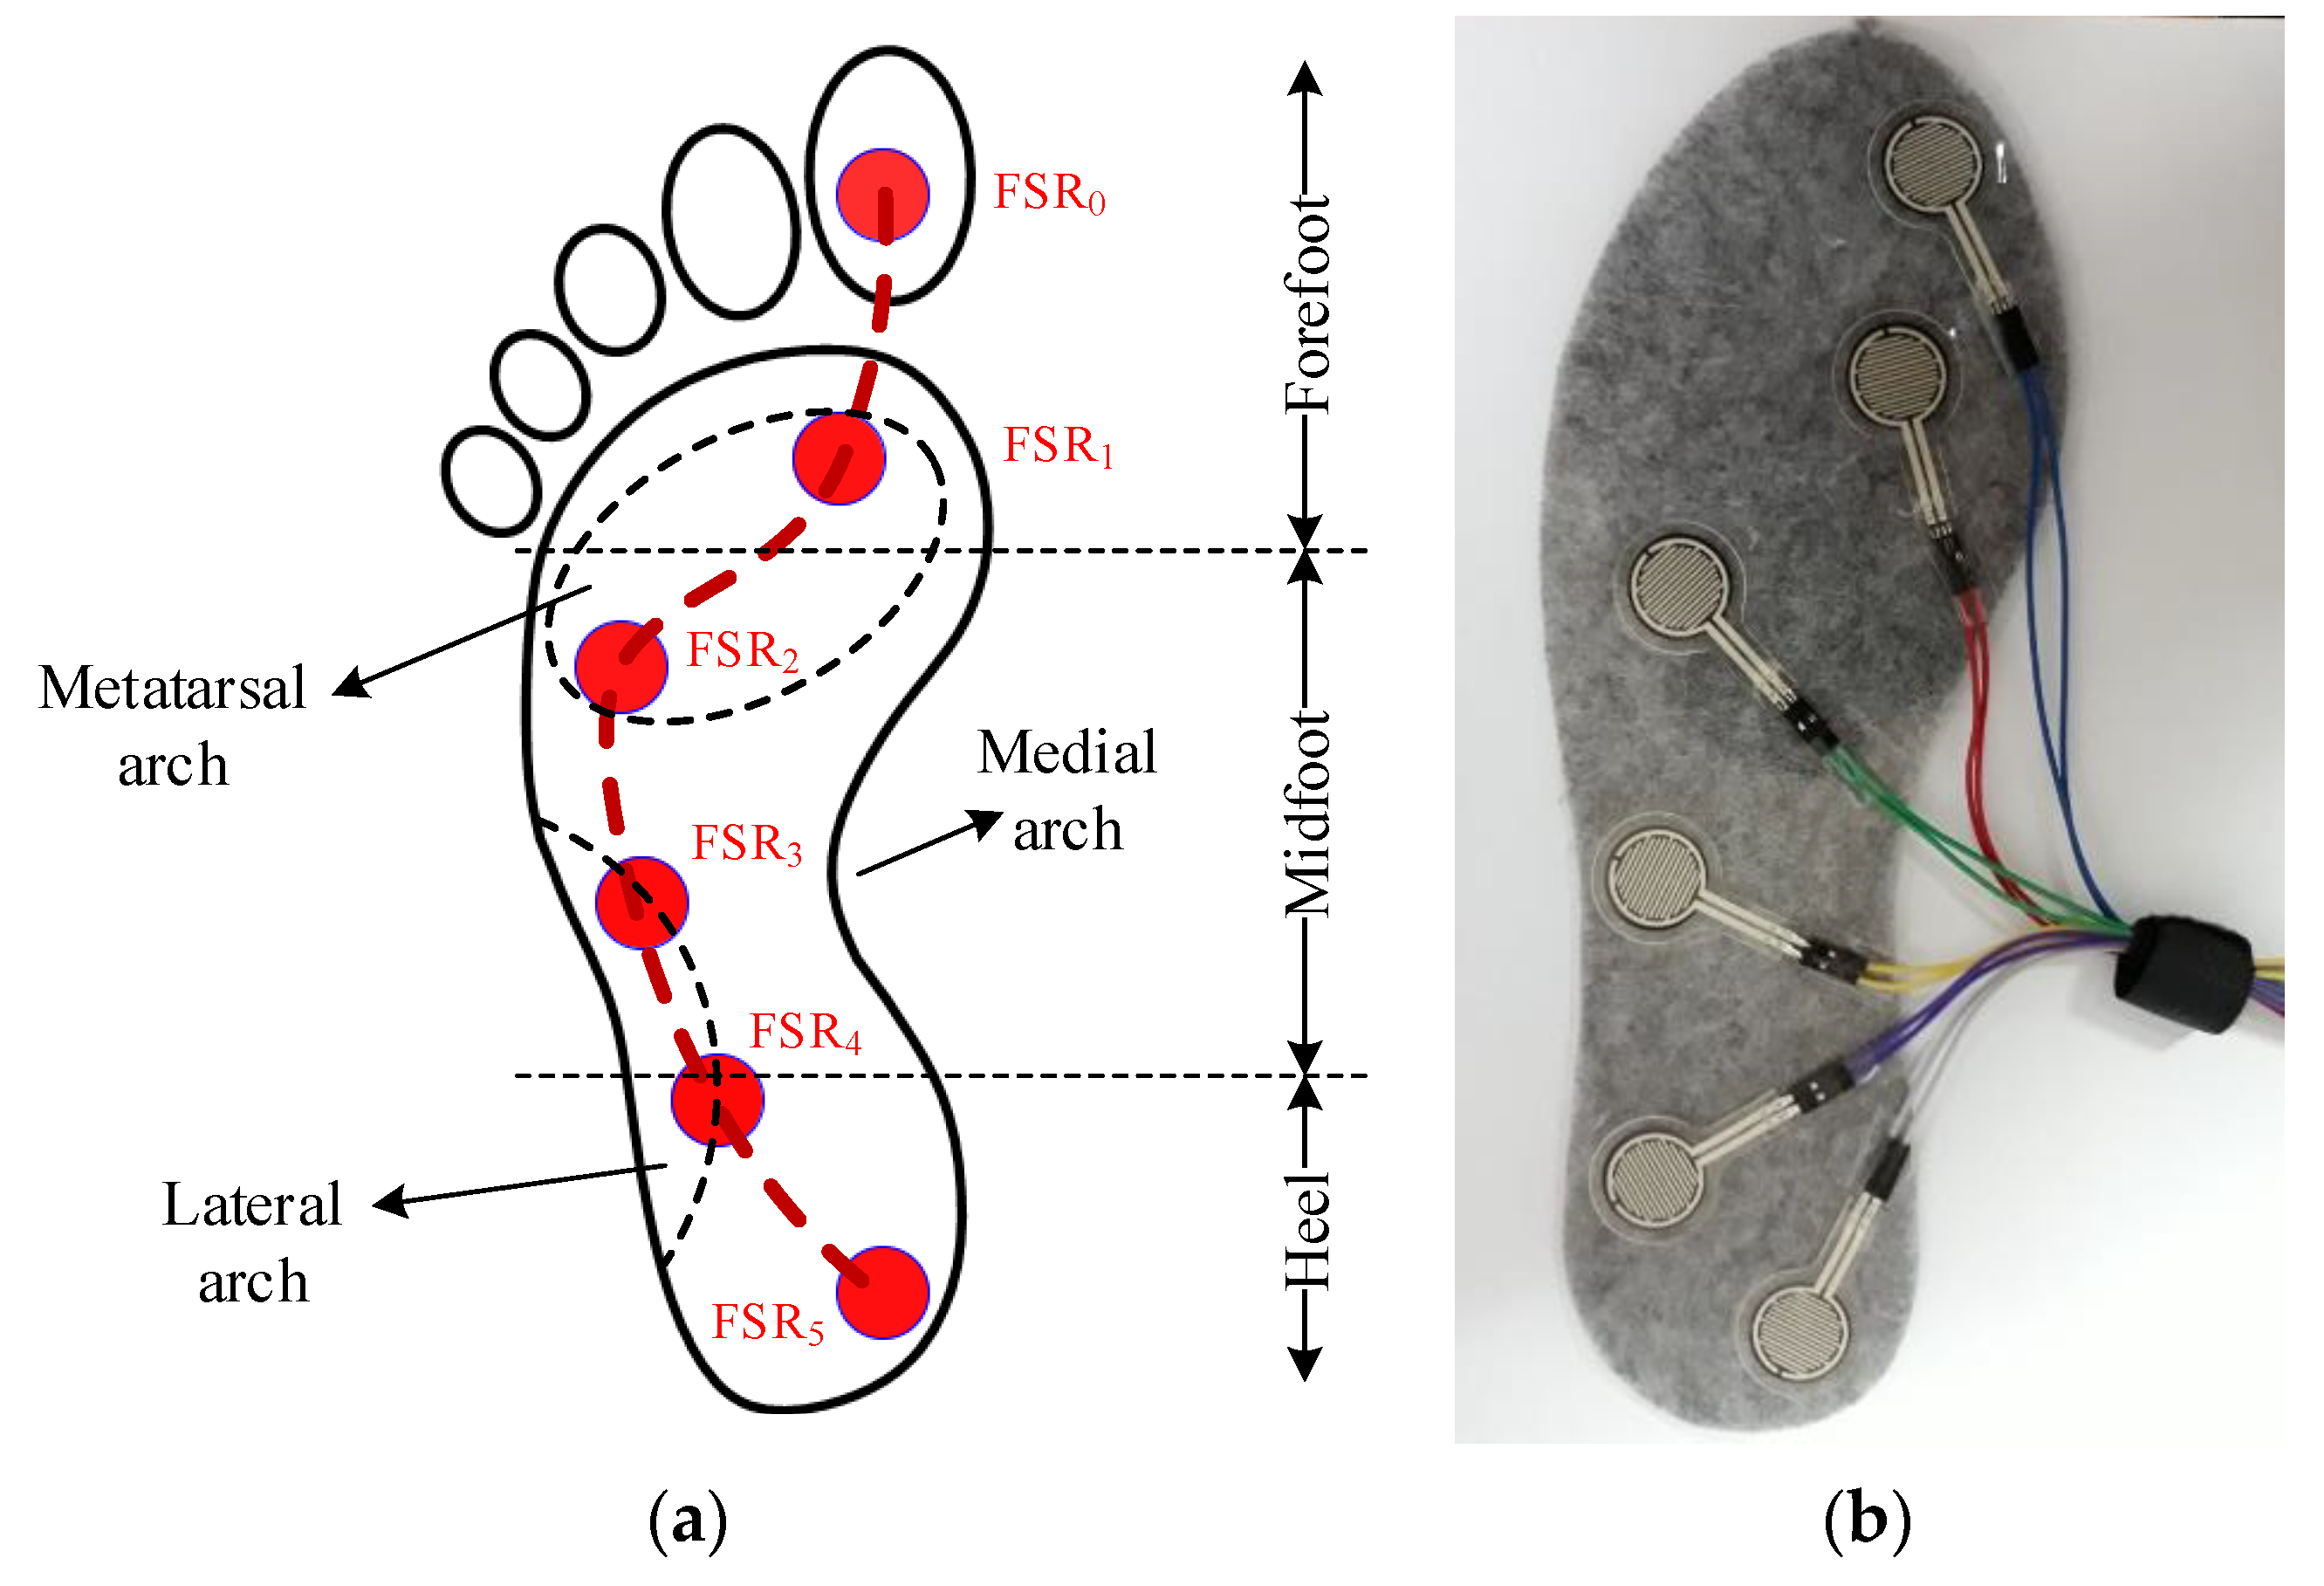
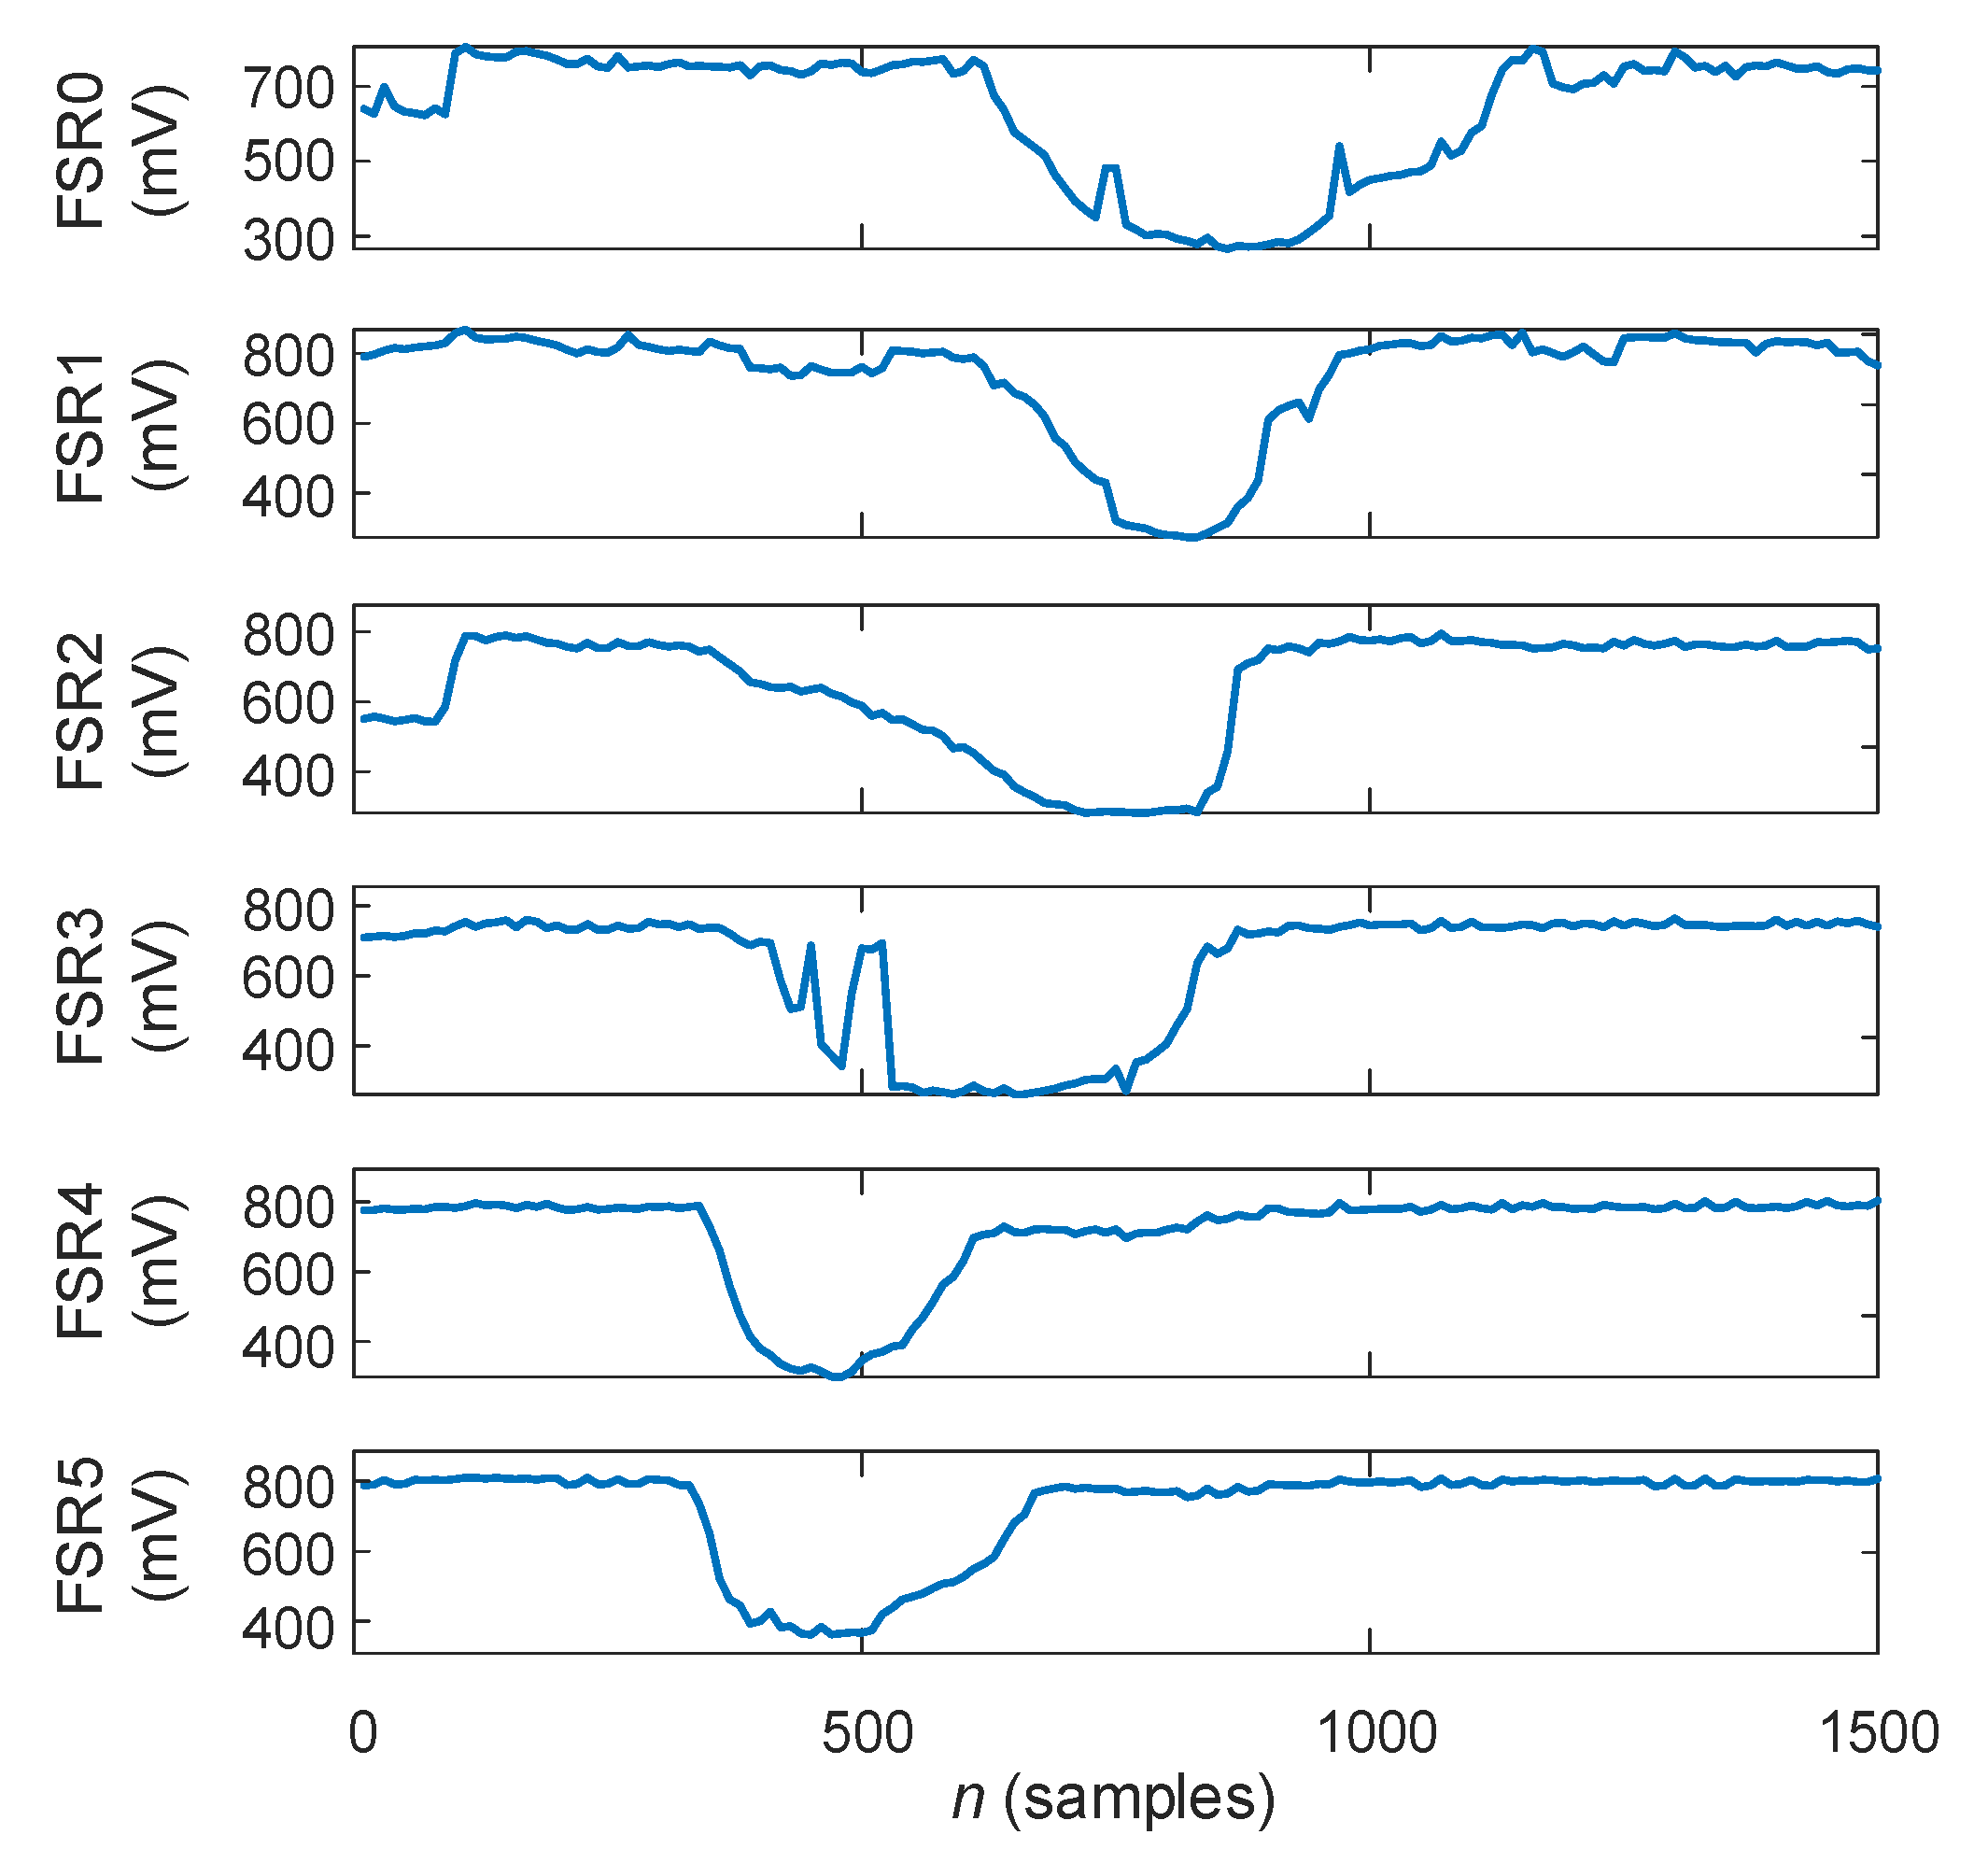
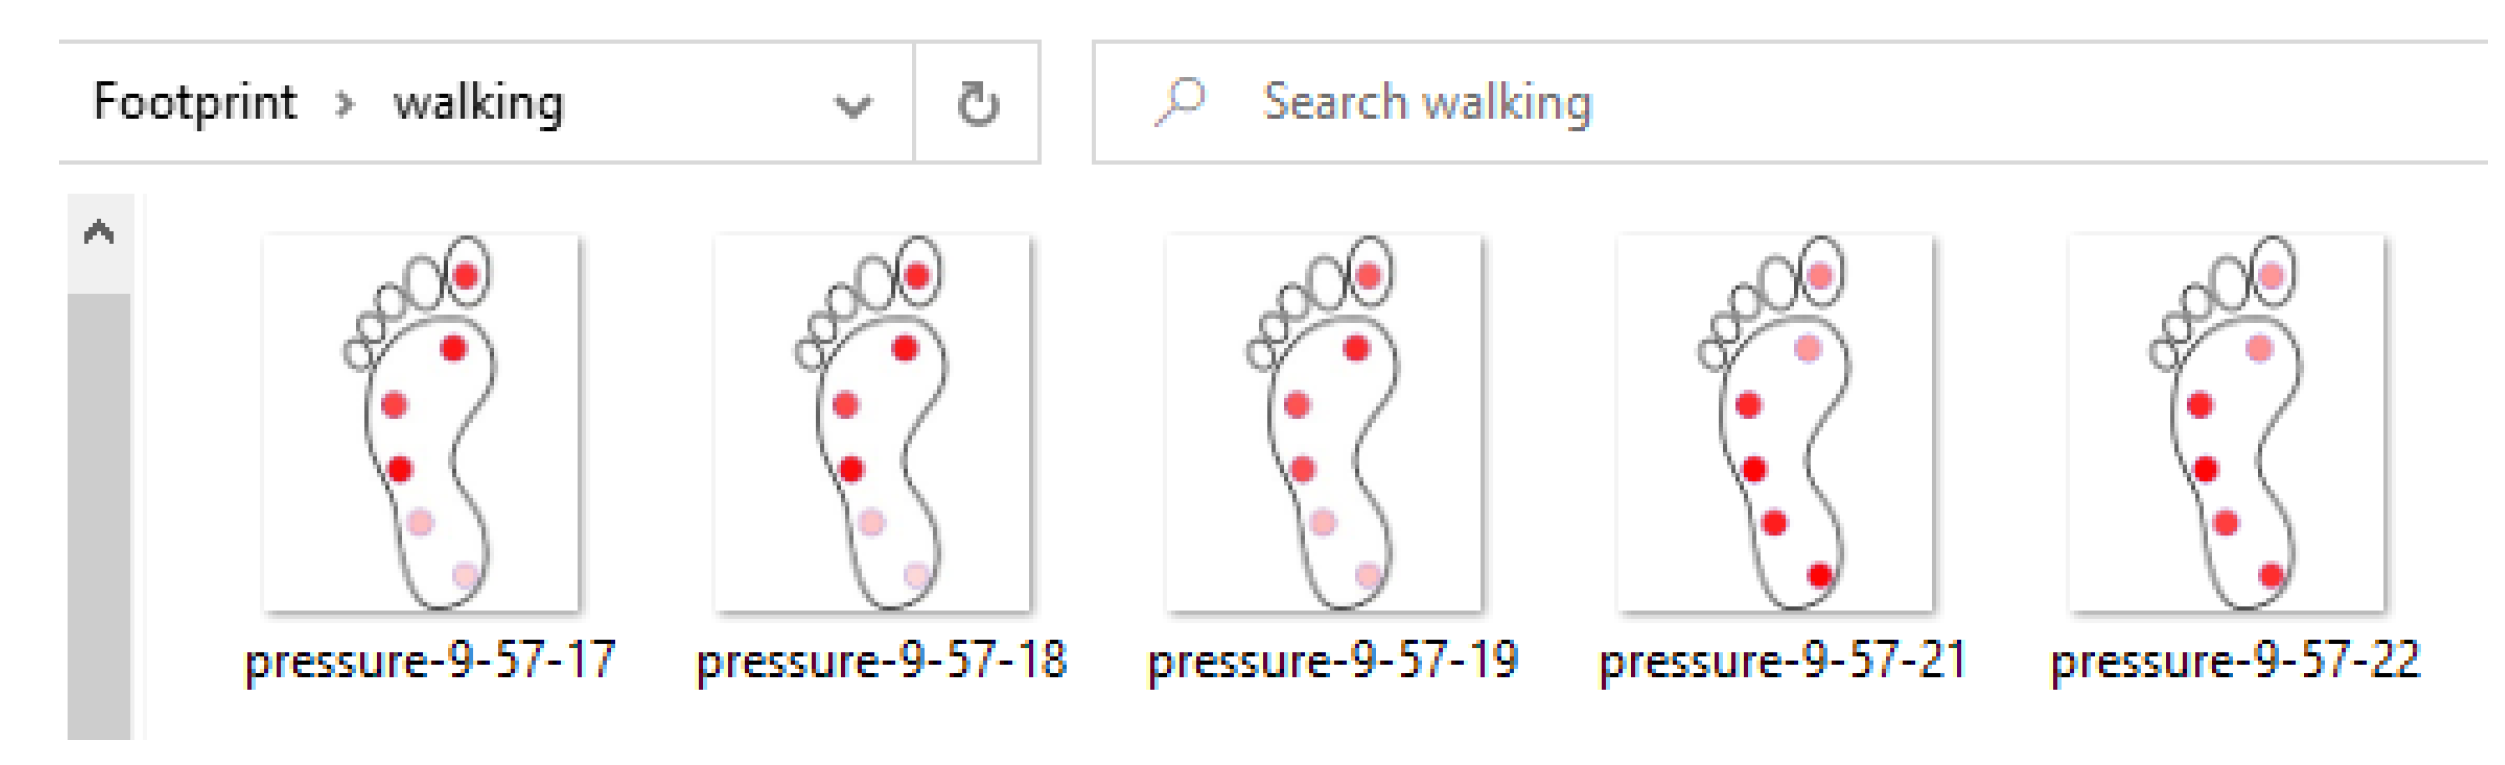
2.1. Plantar Pressures Ssessment
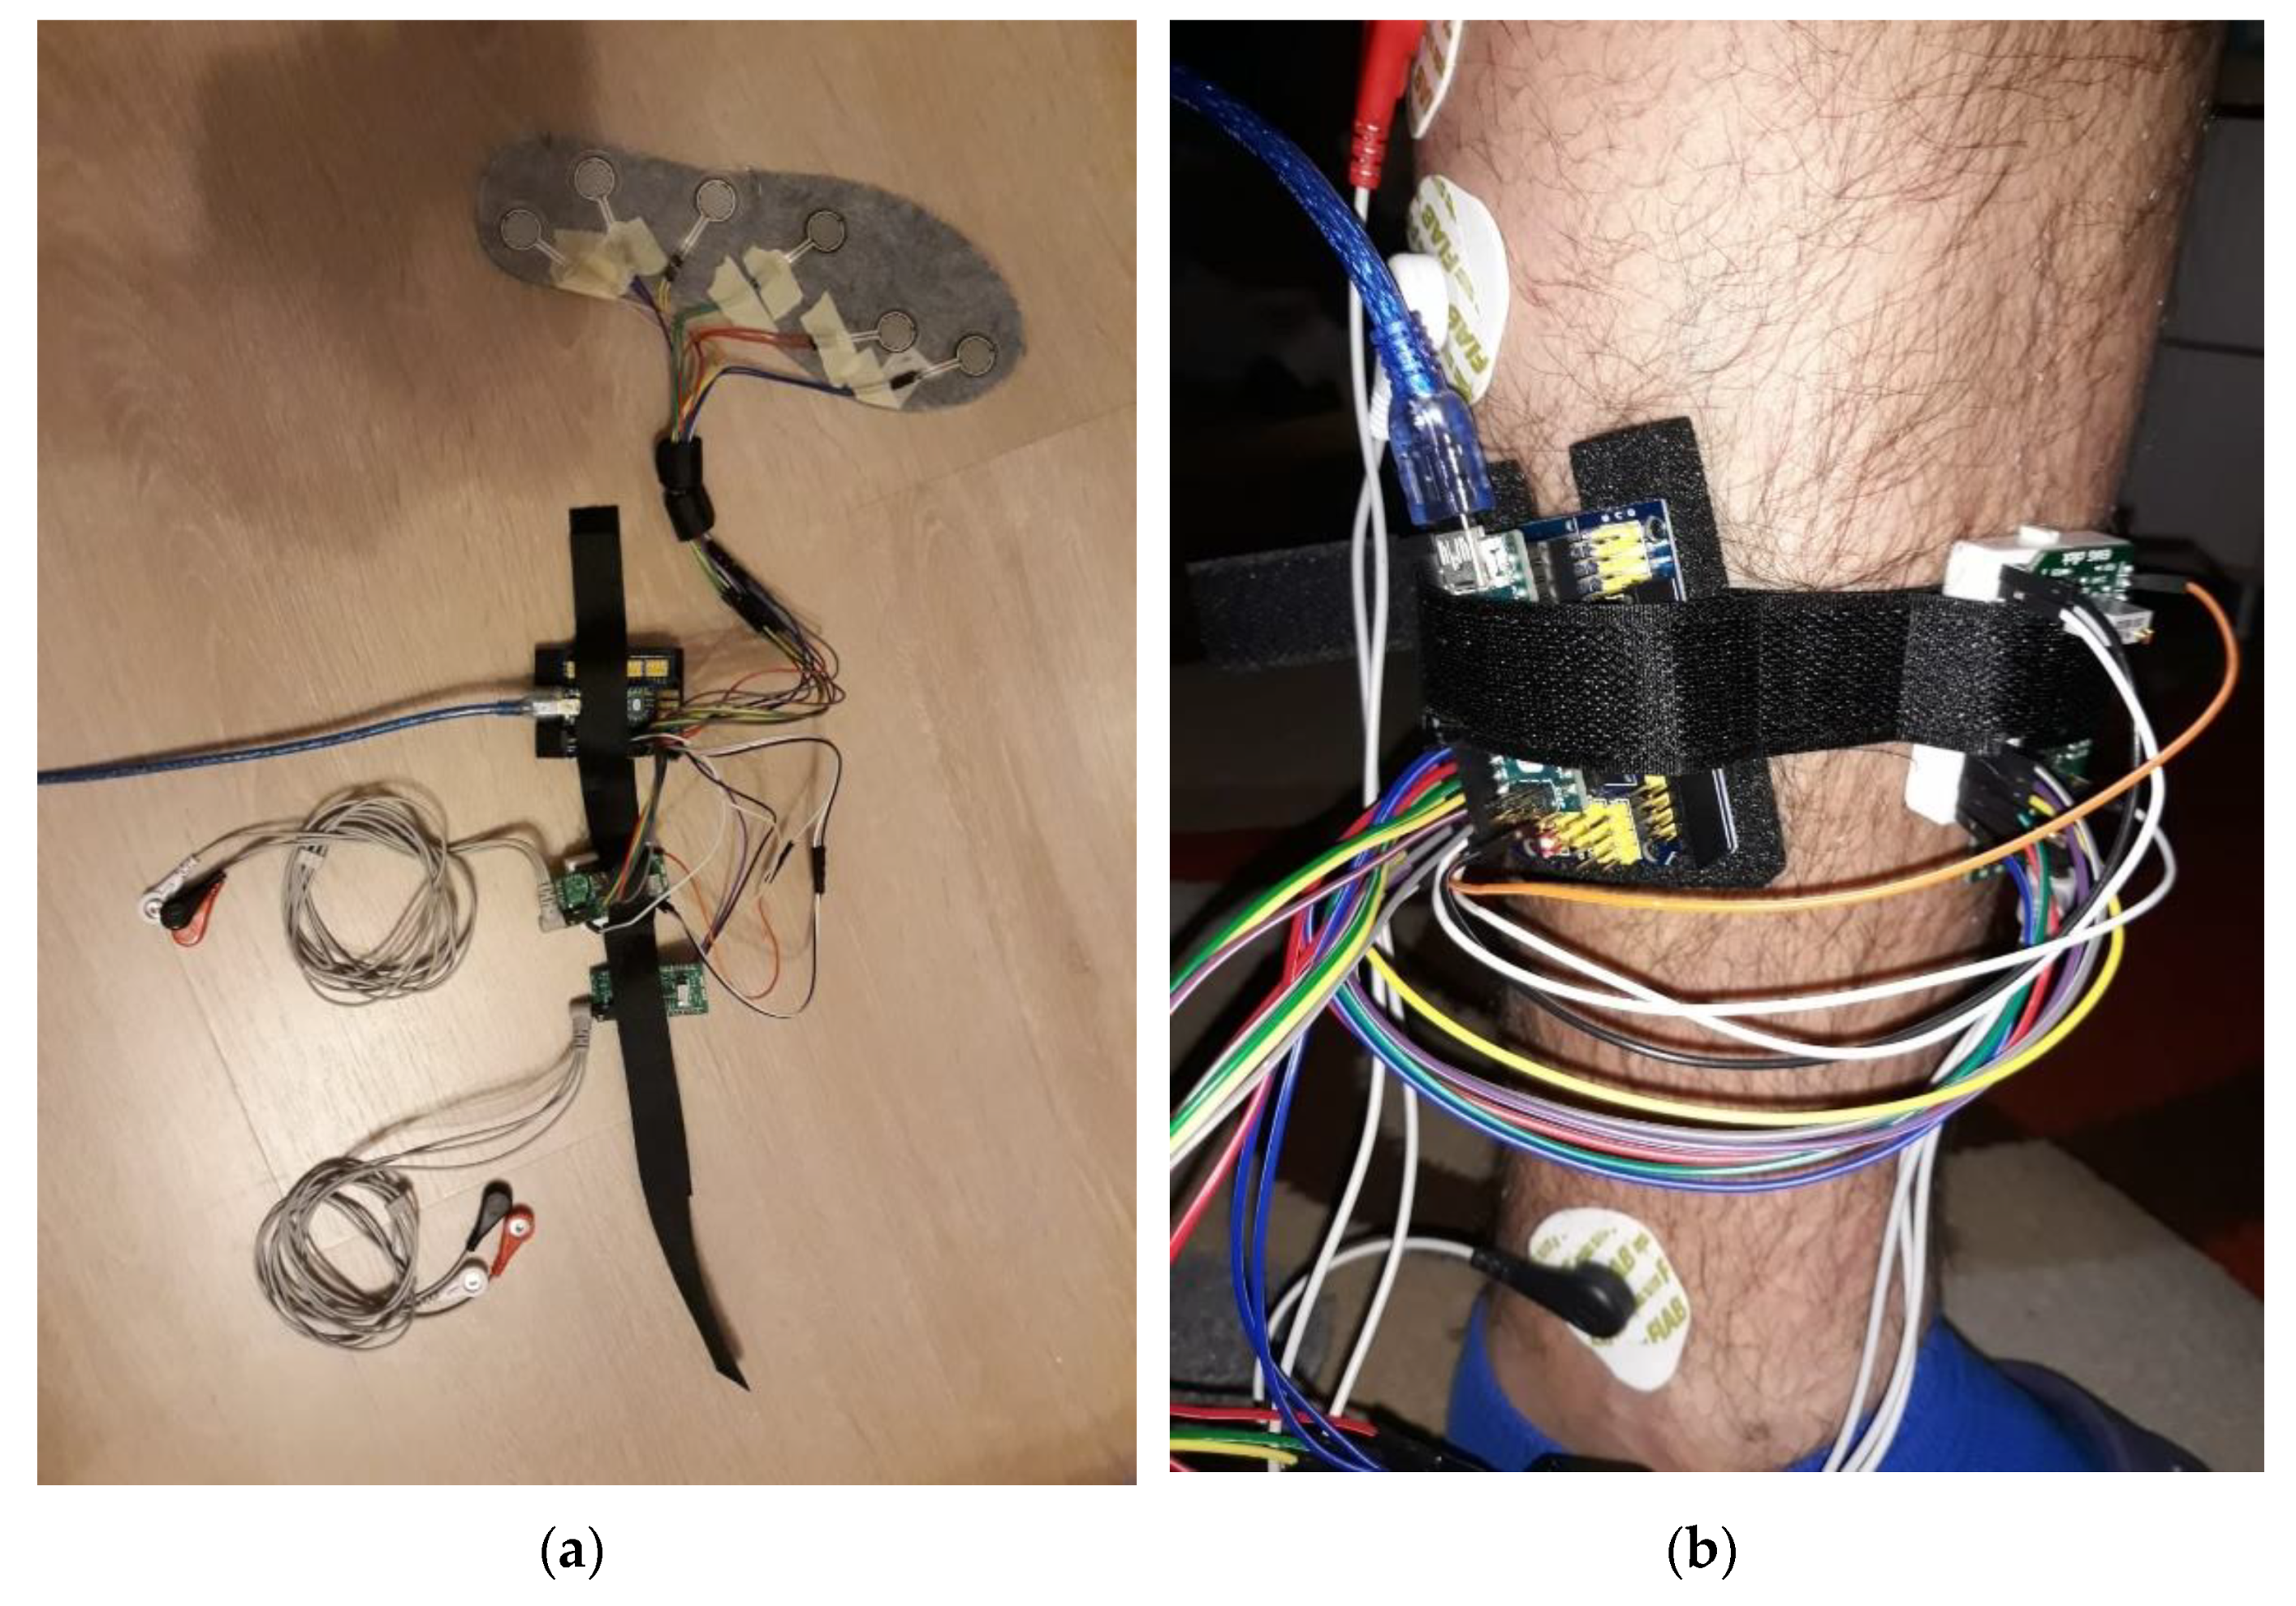
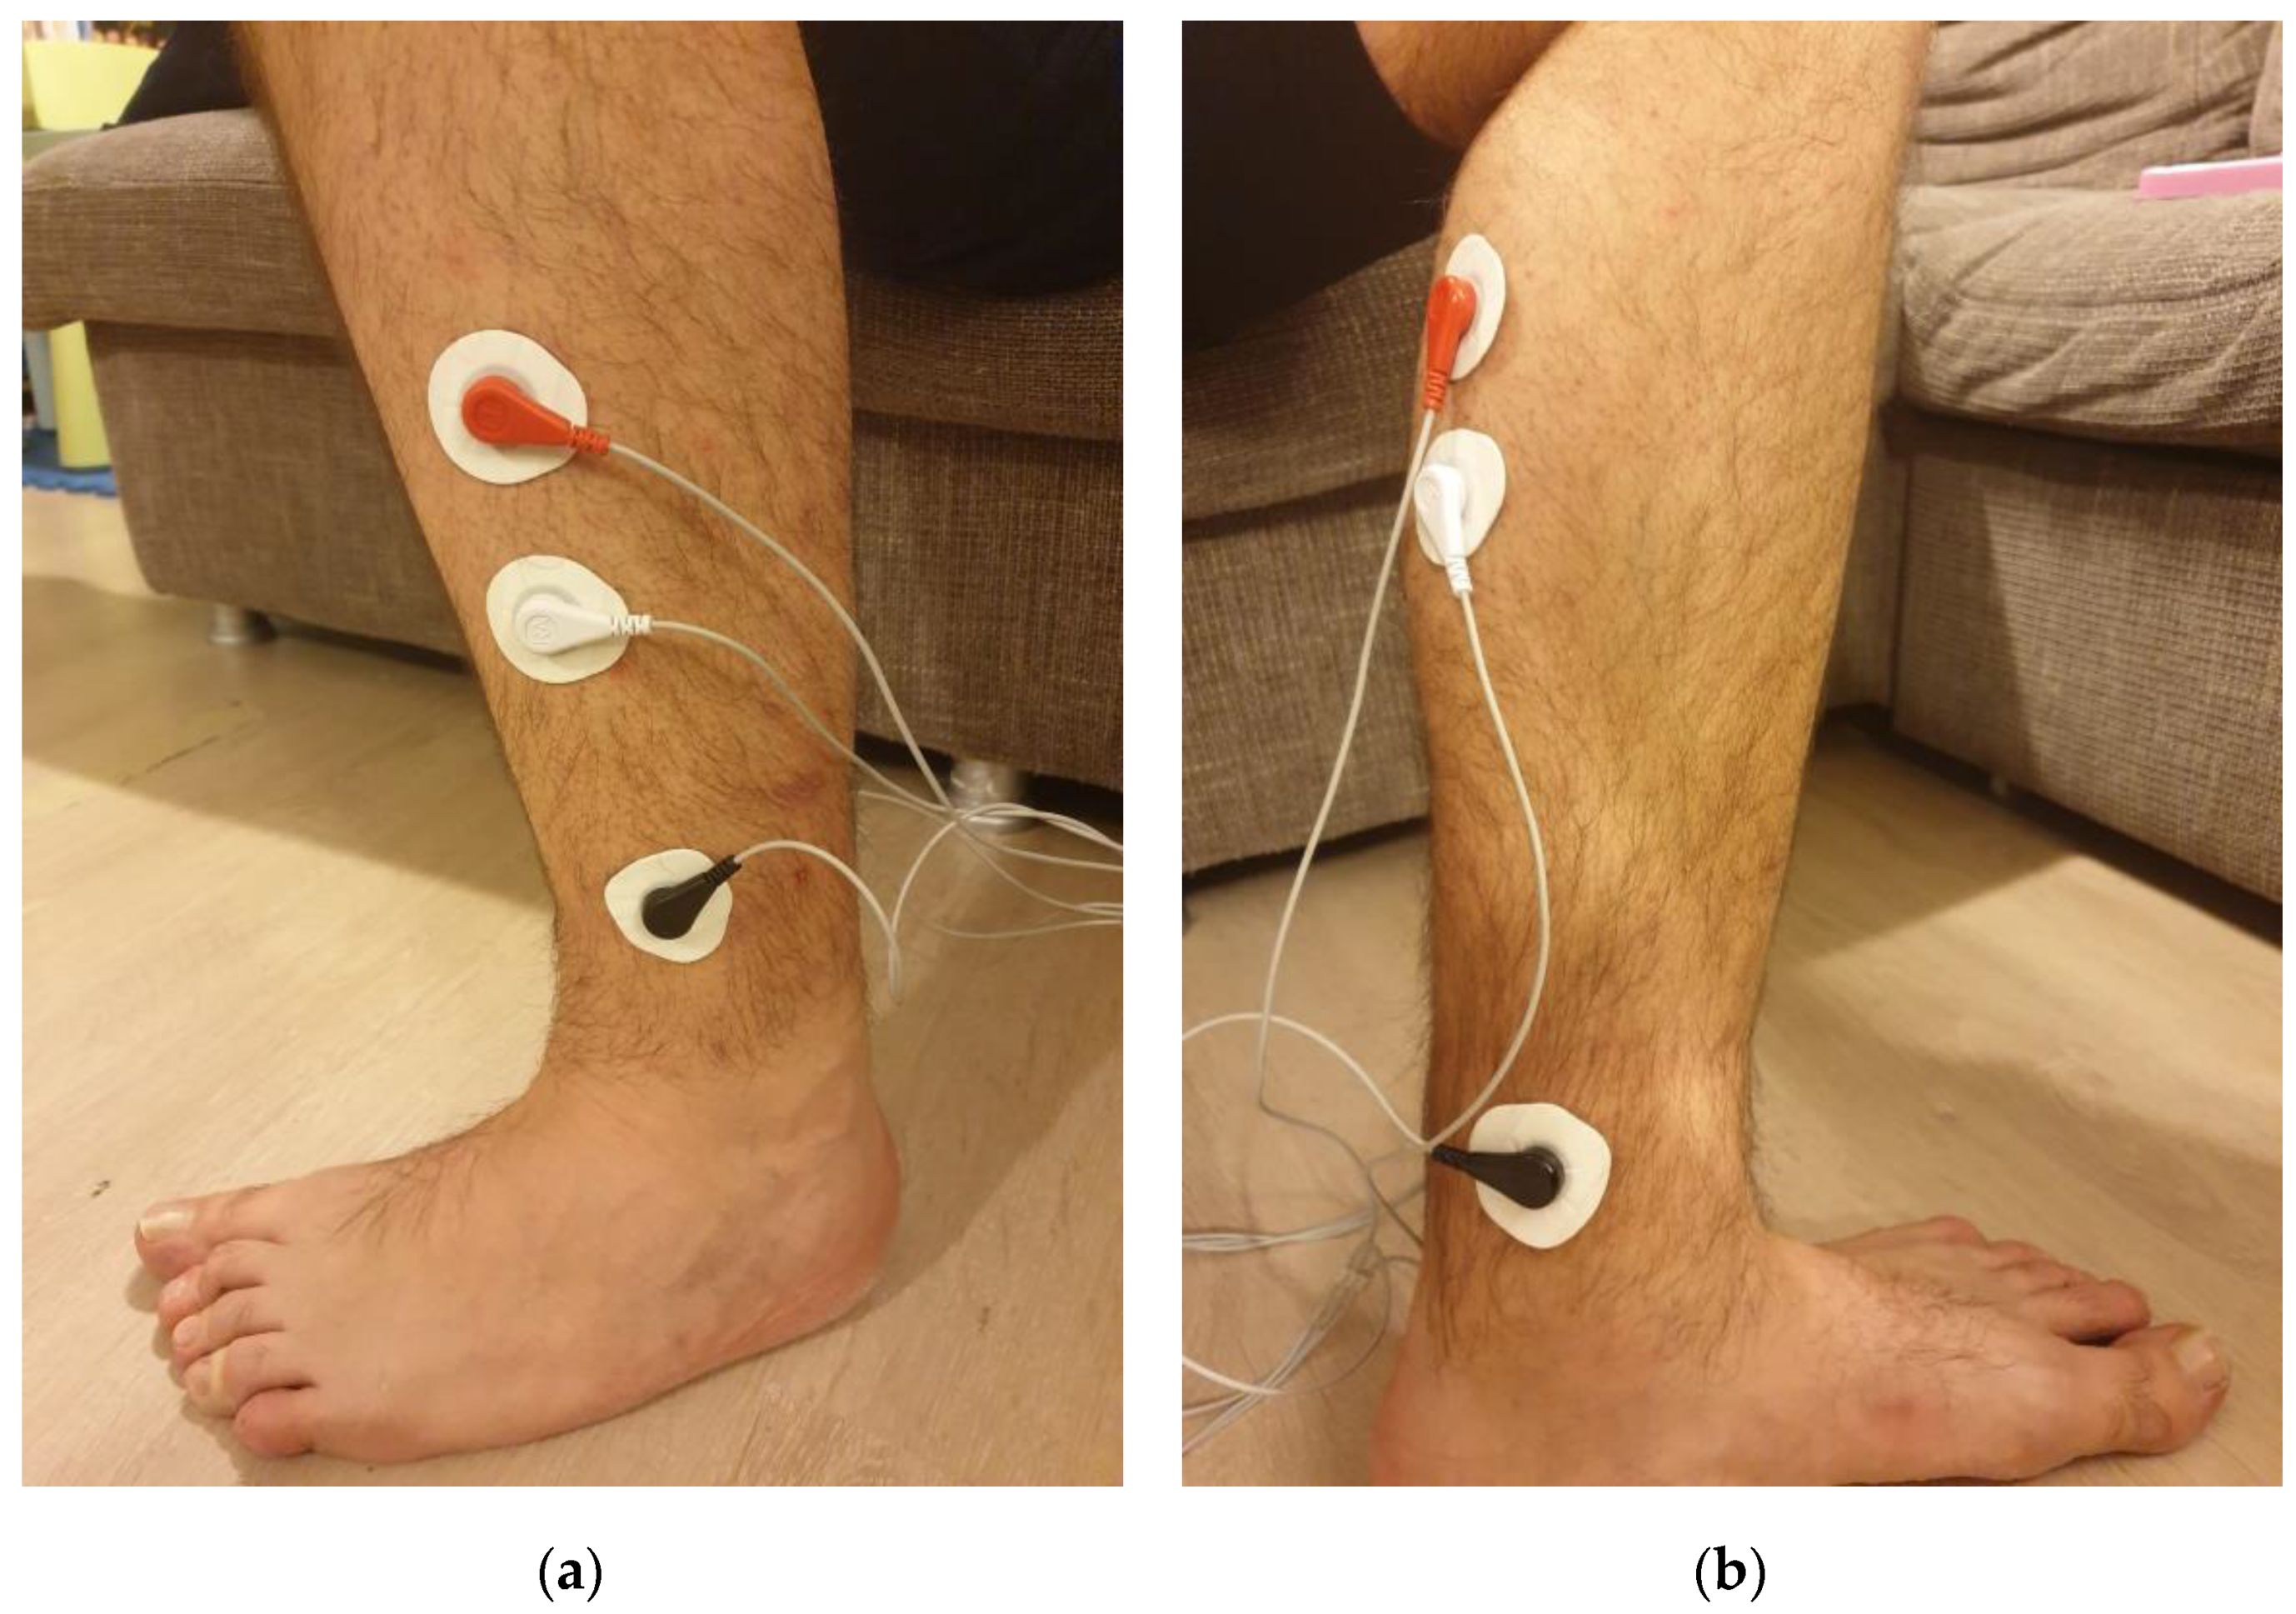
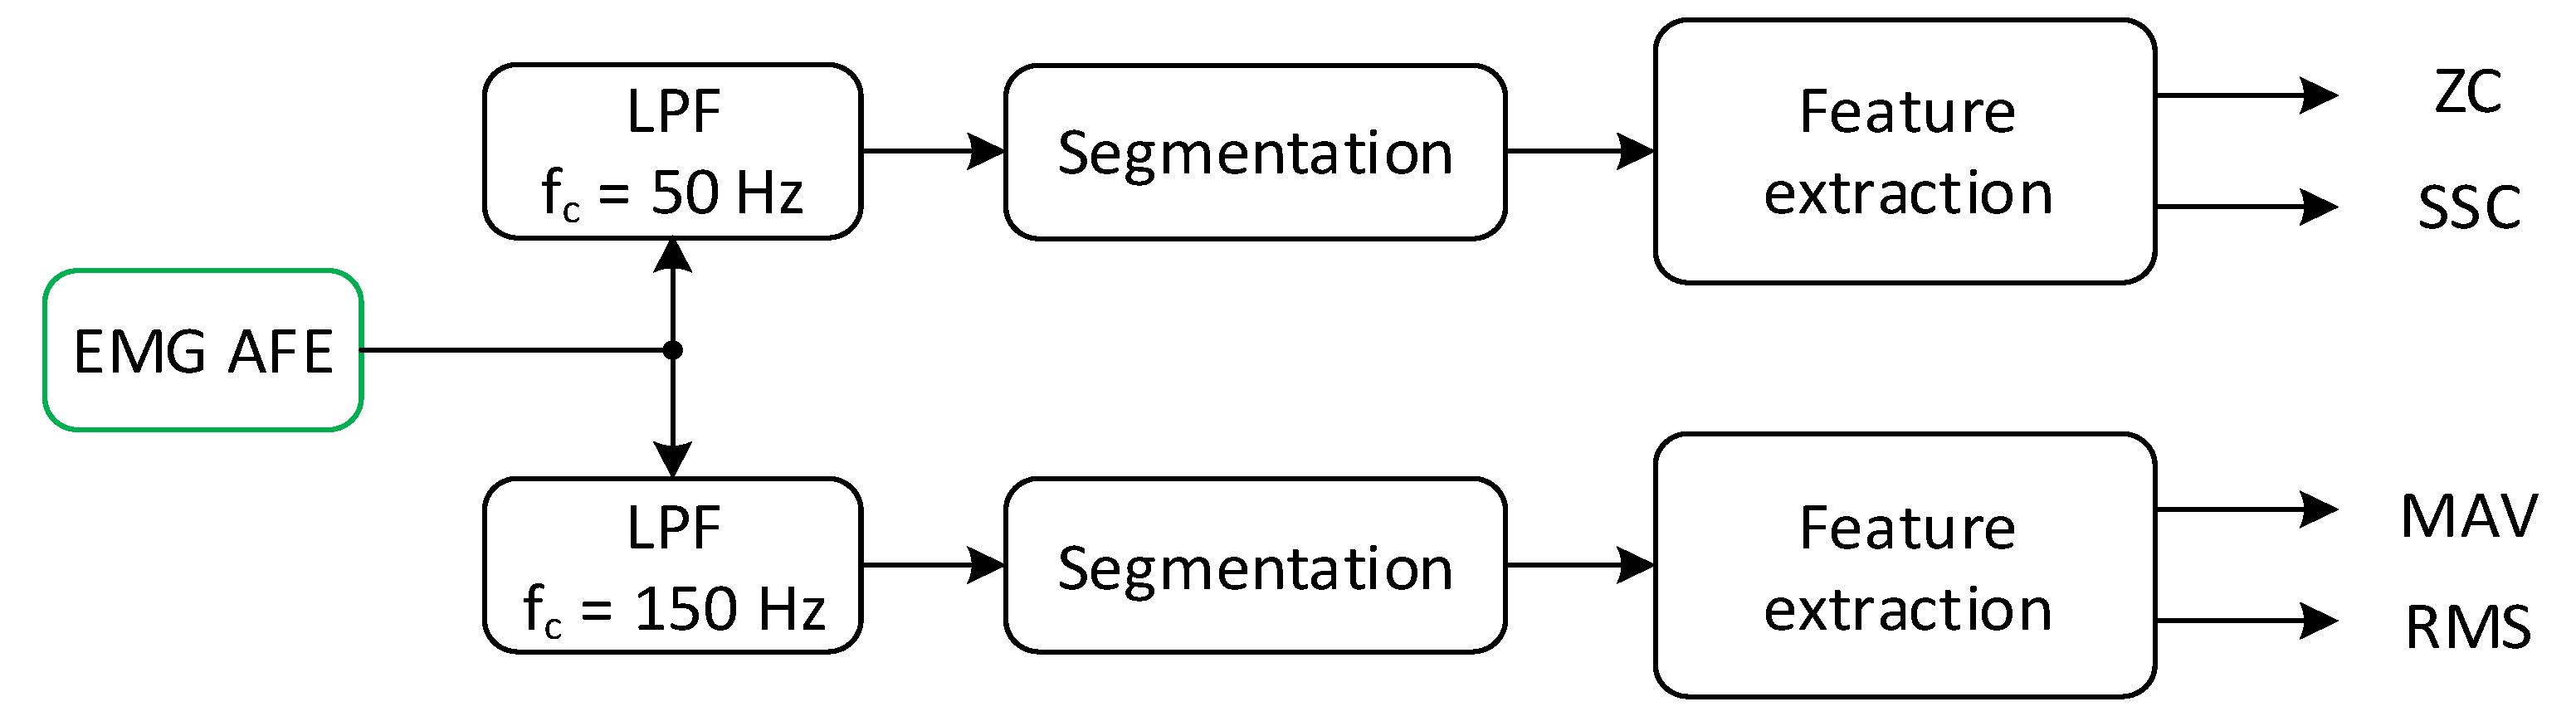
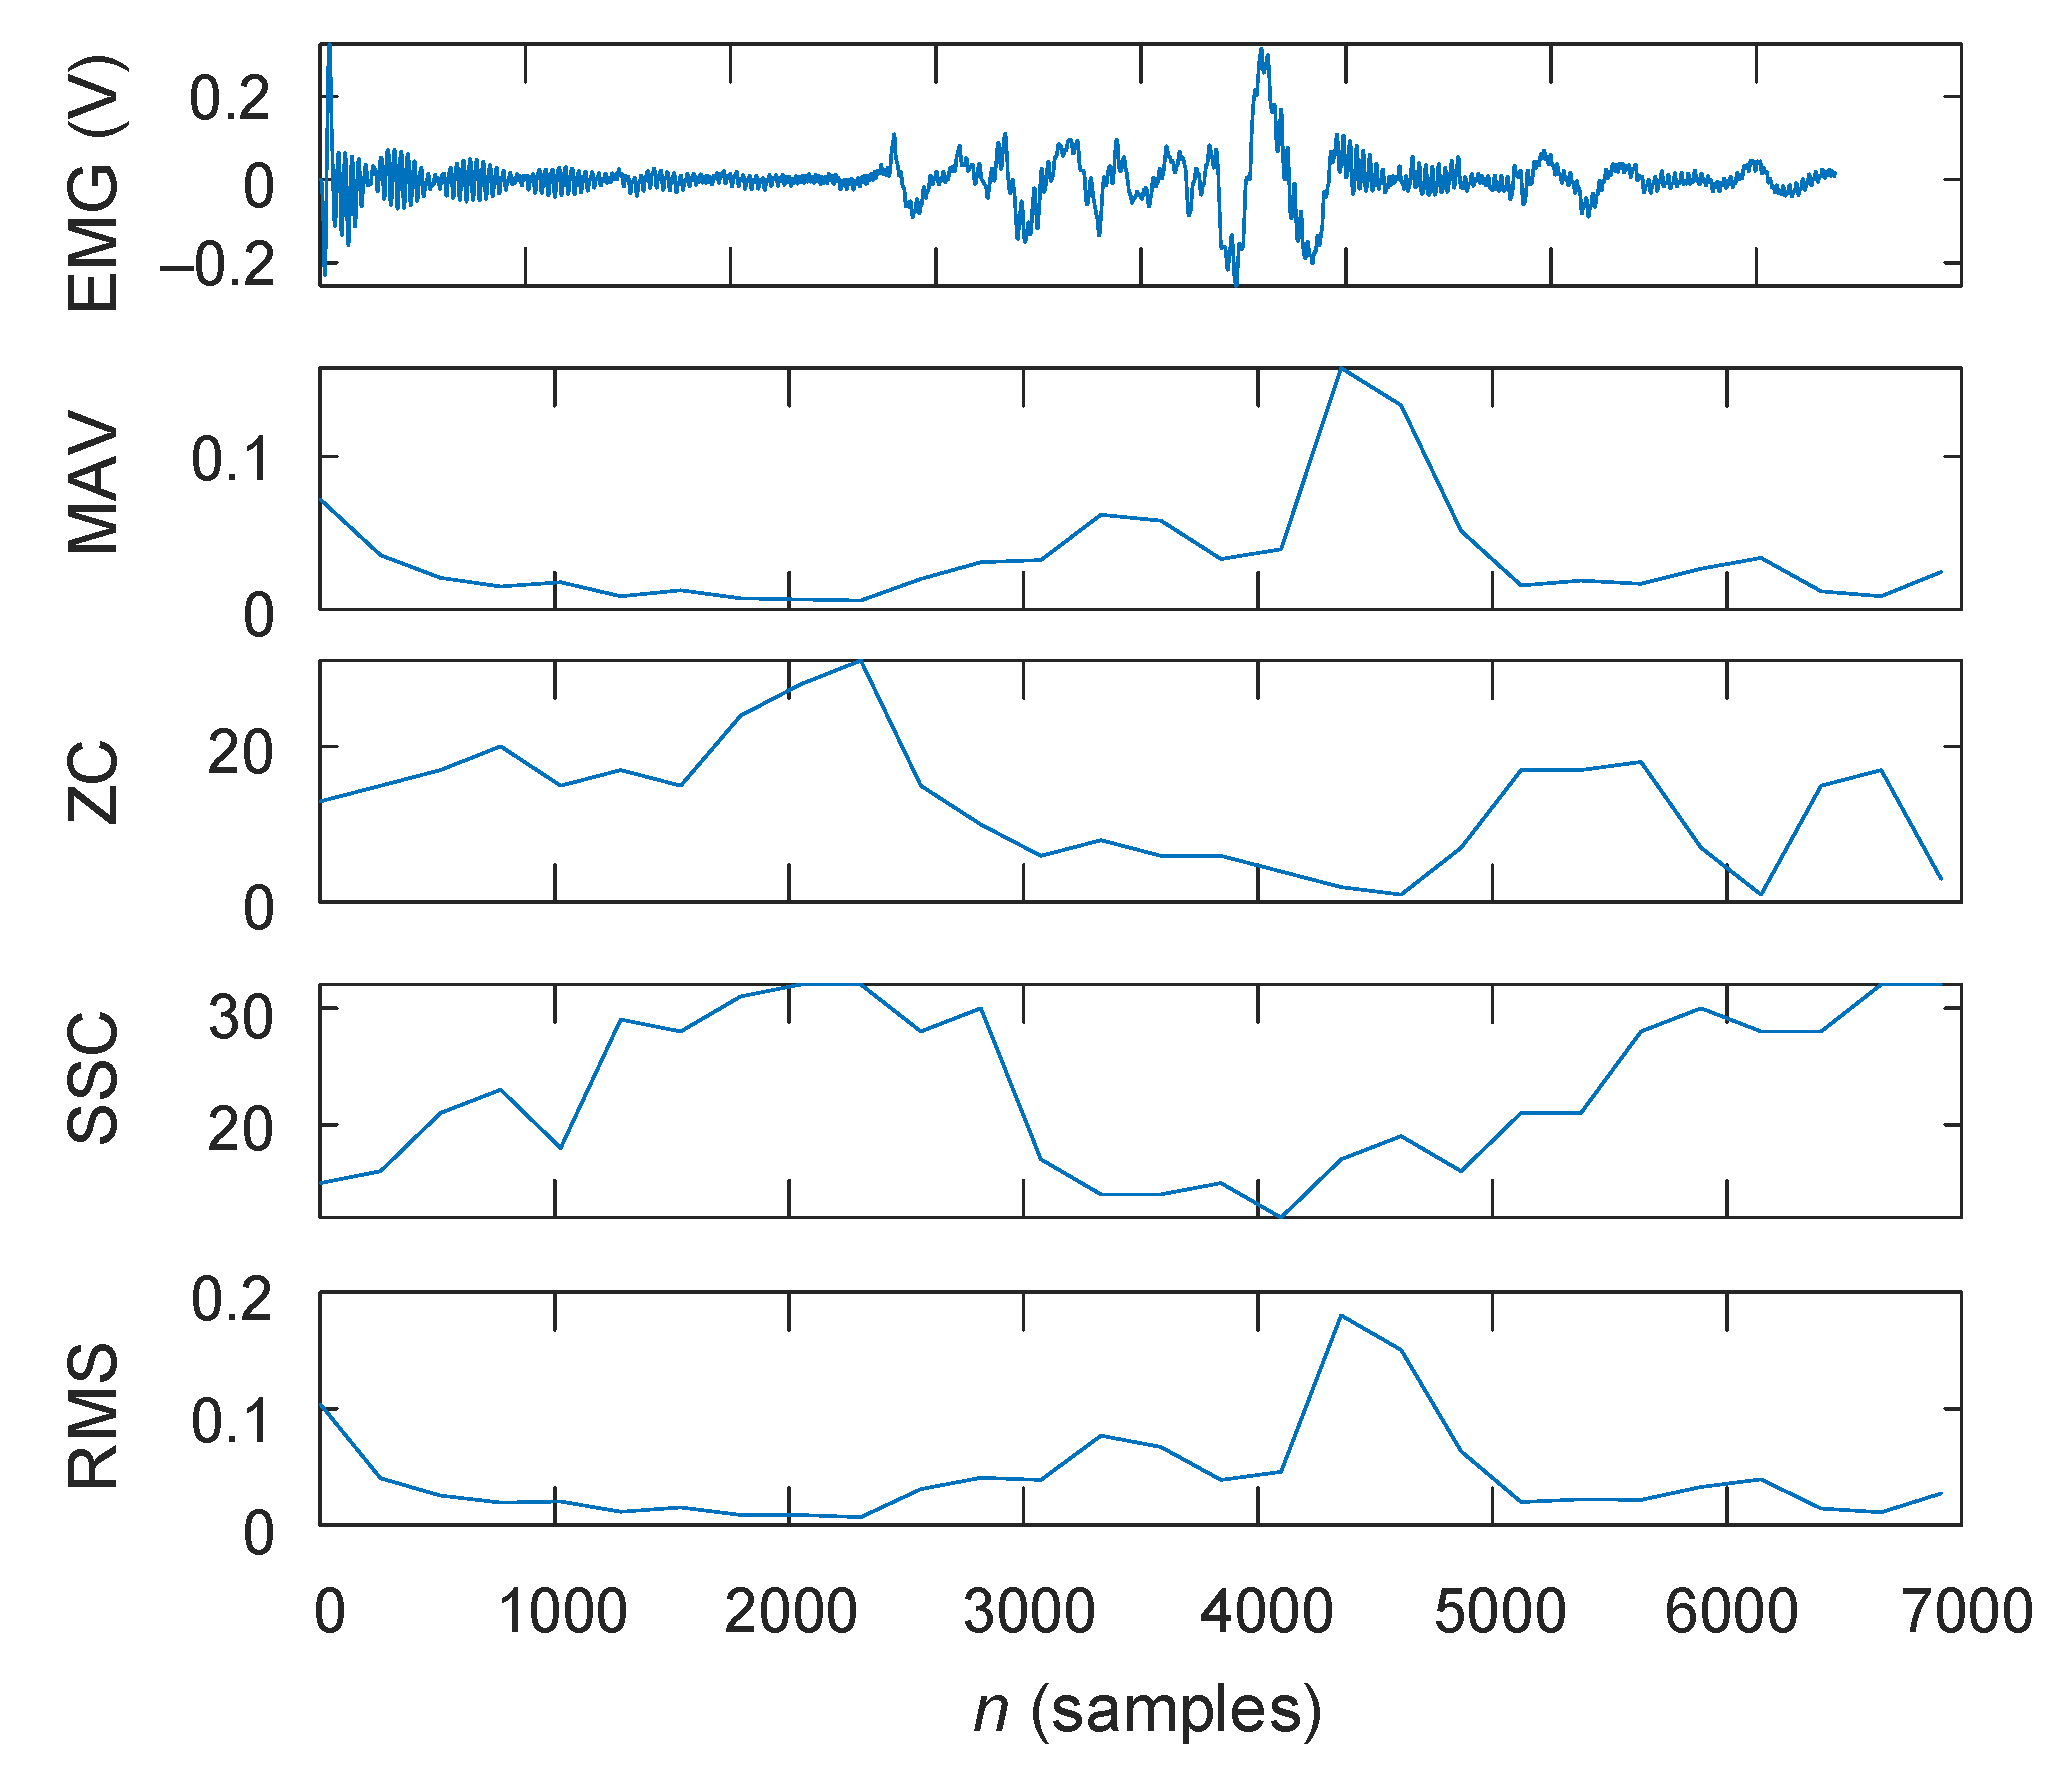
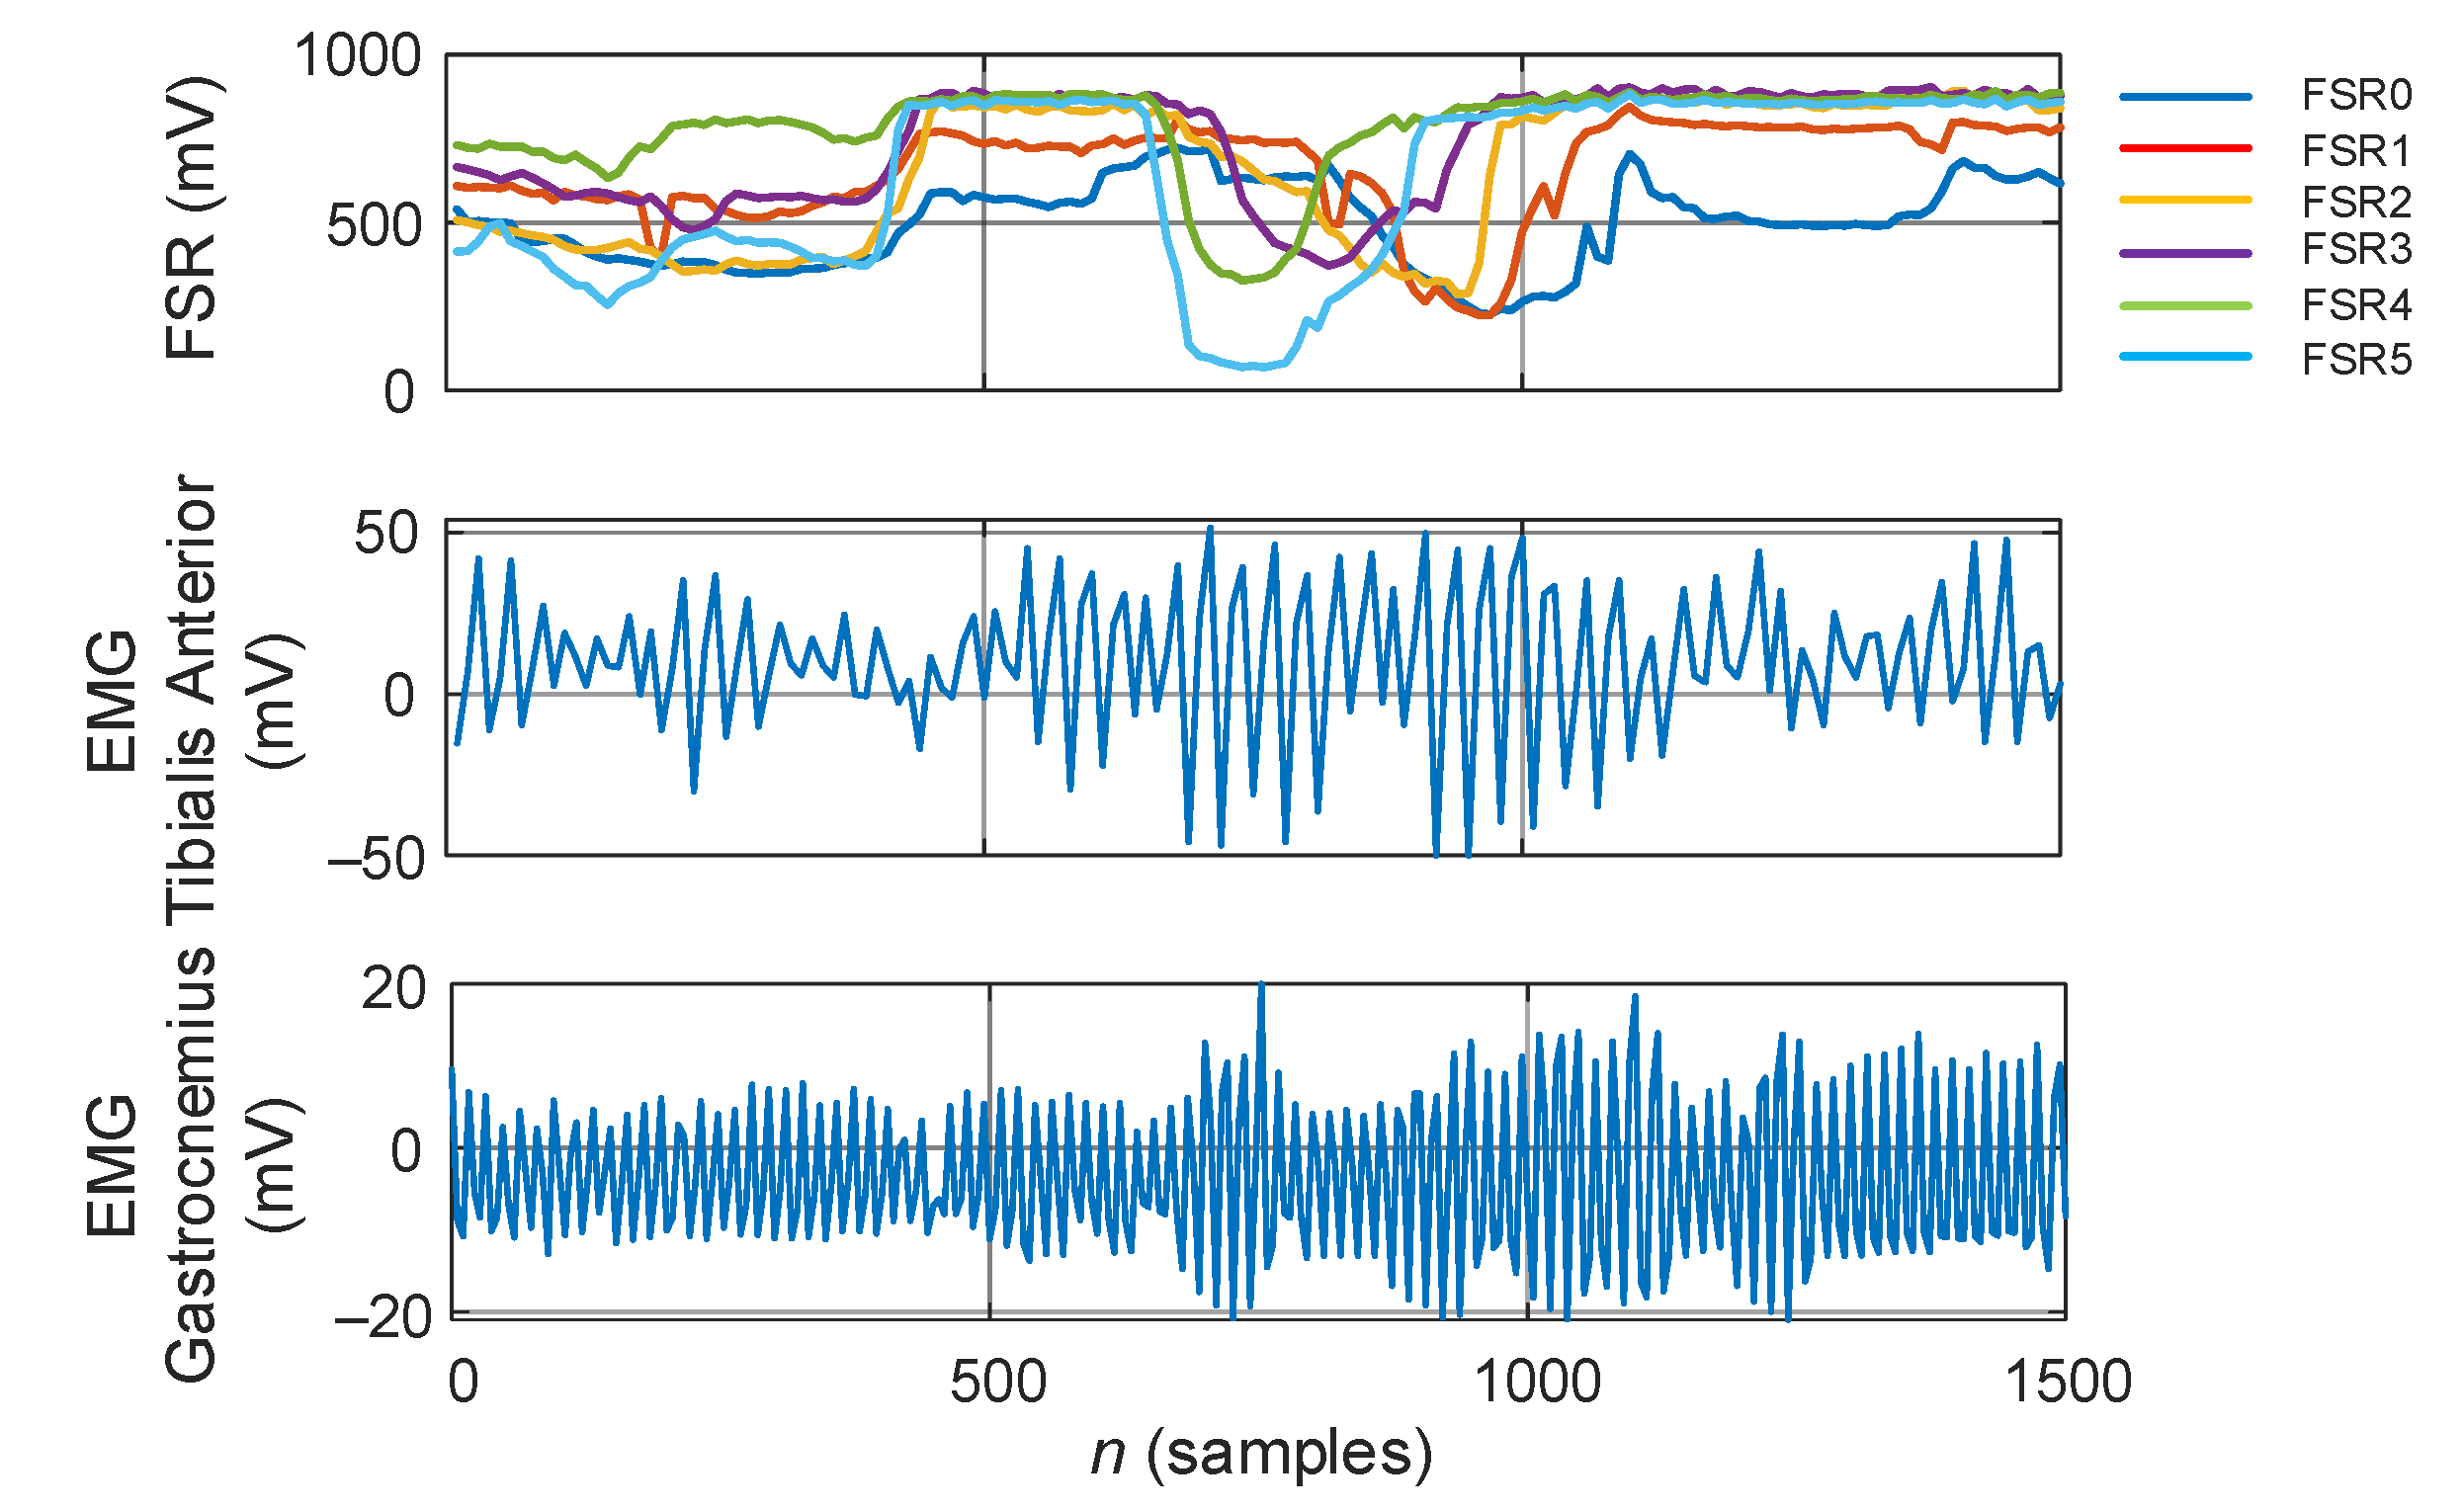
2.2. Lower-Limb EMG Assessment
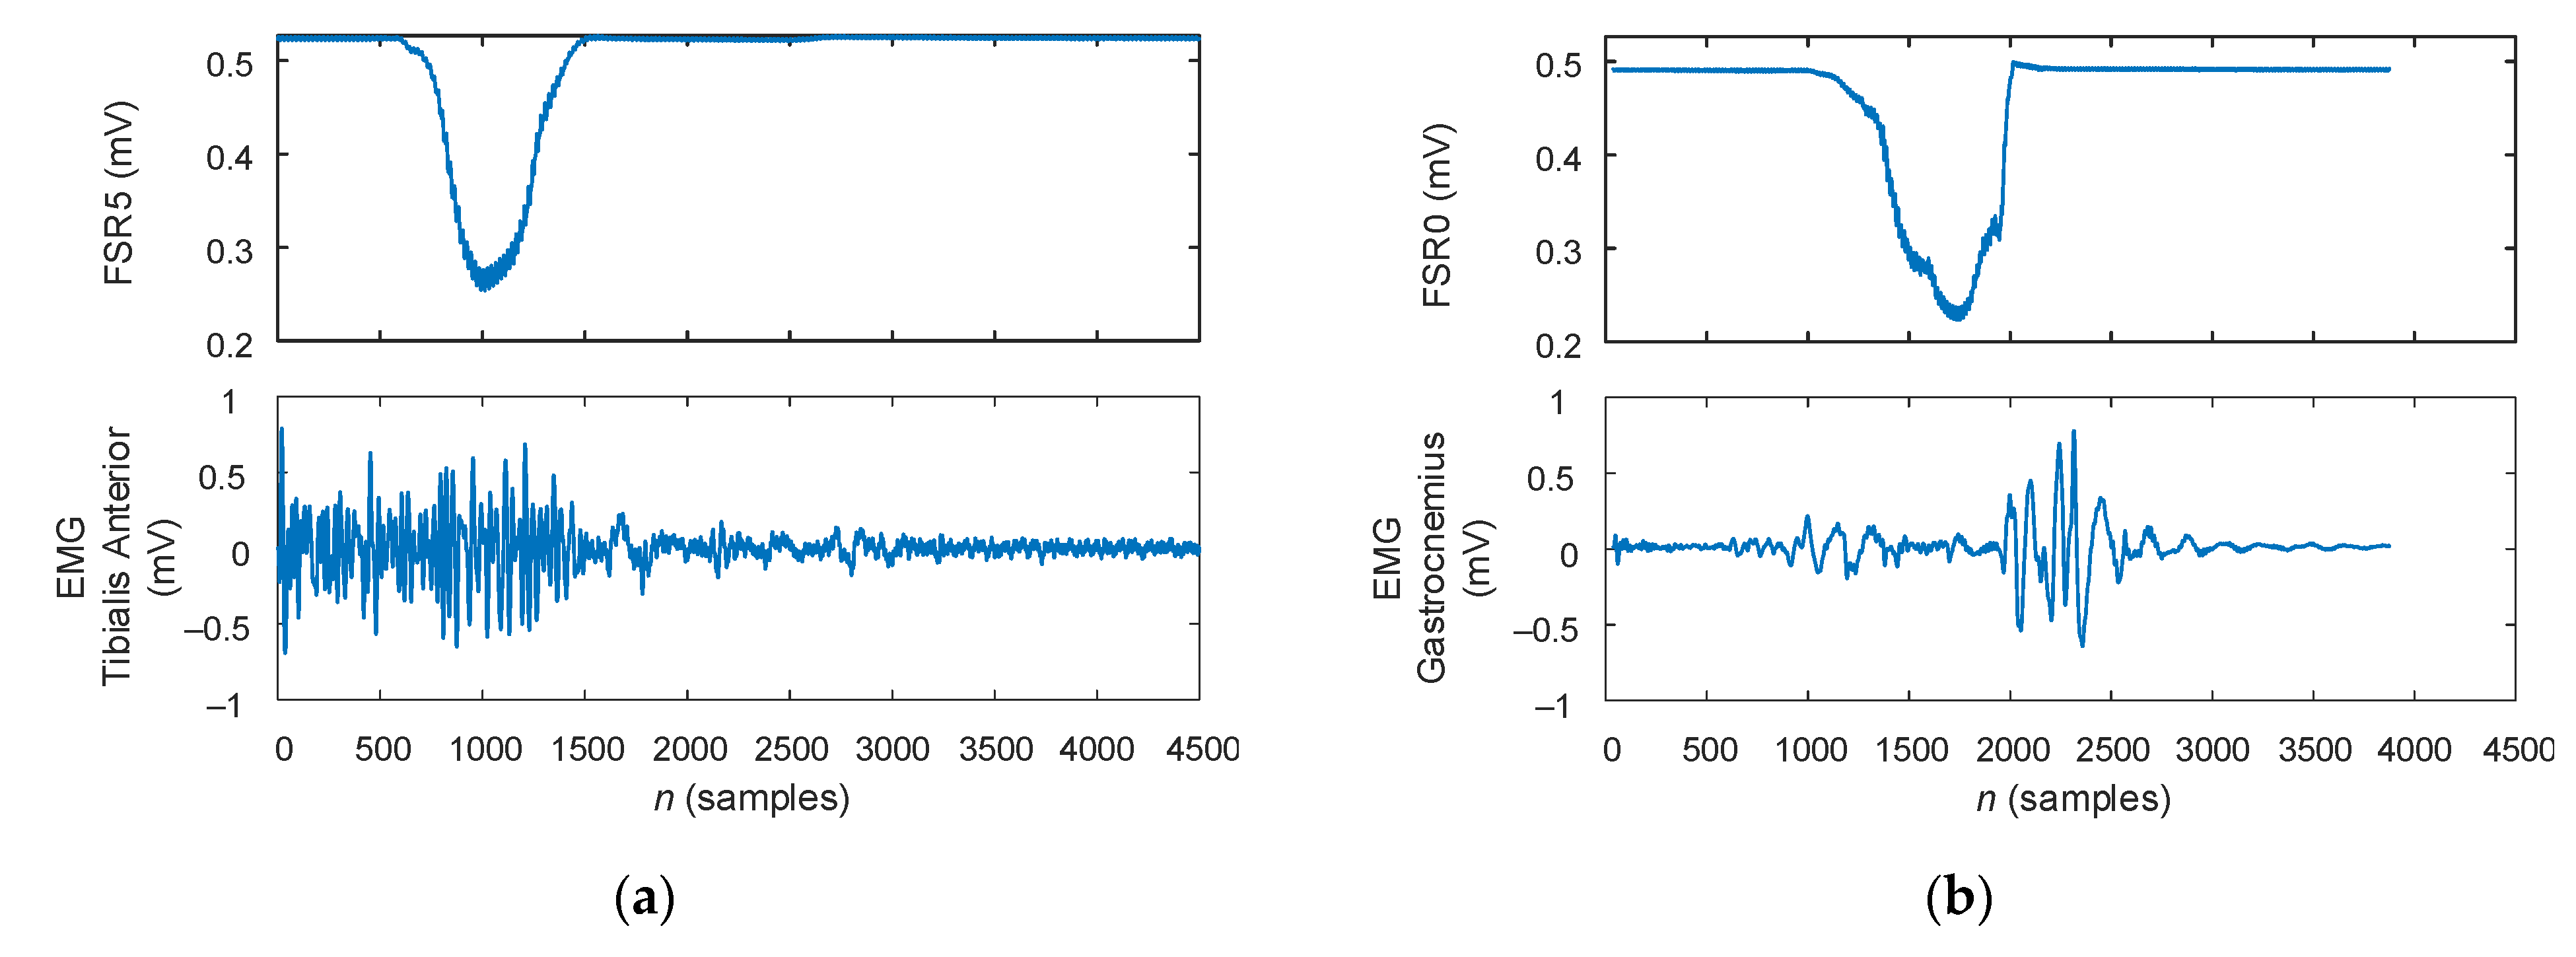
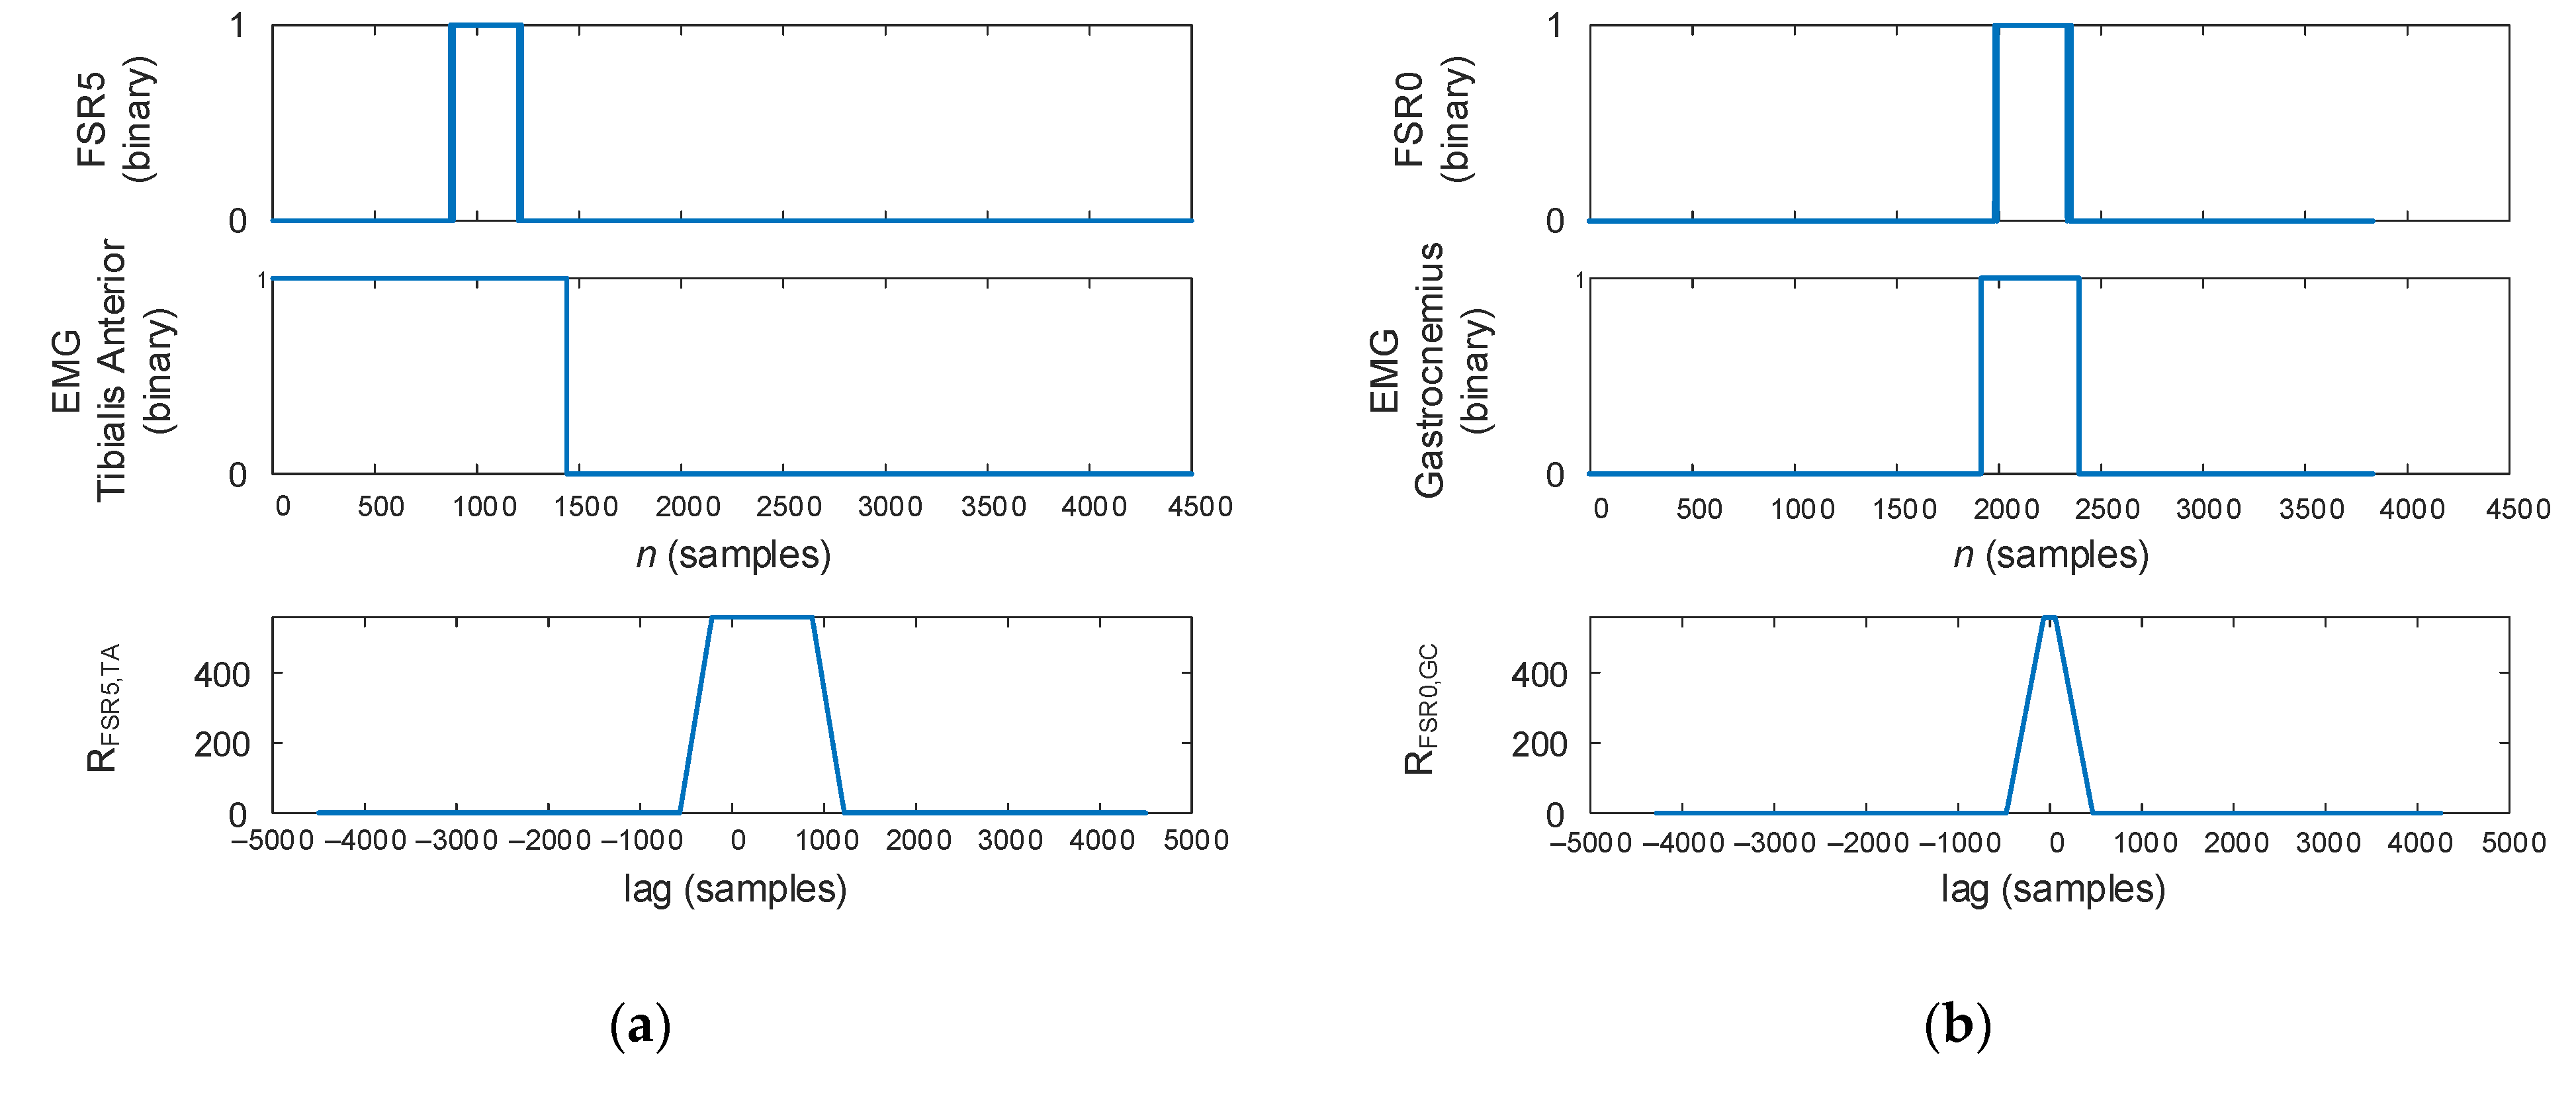
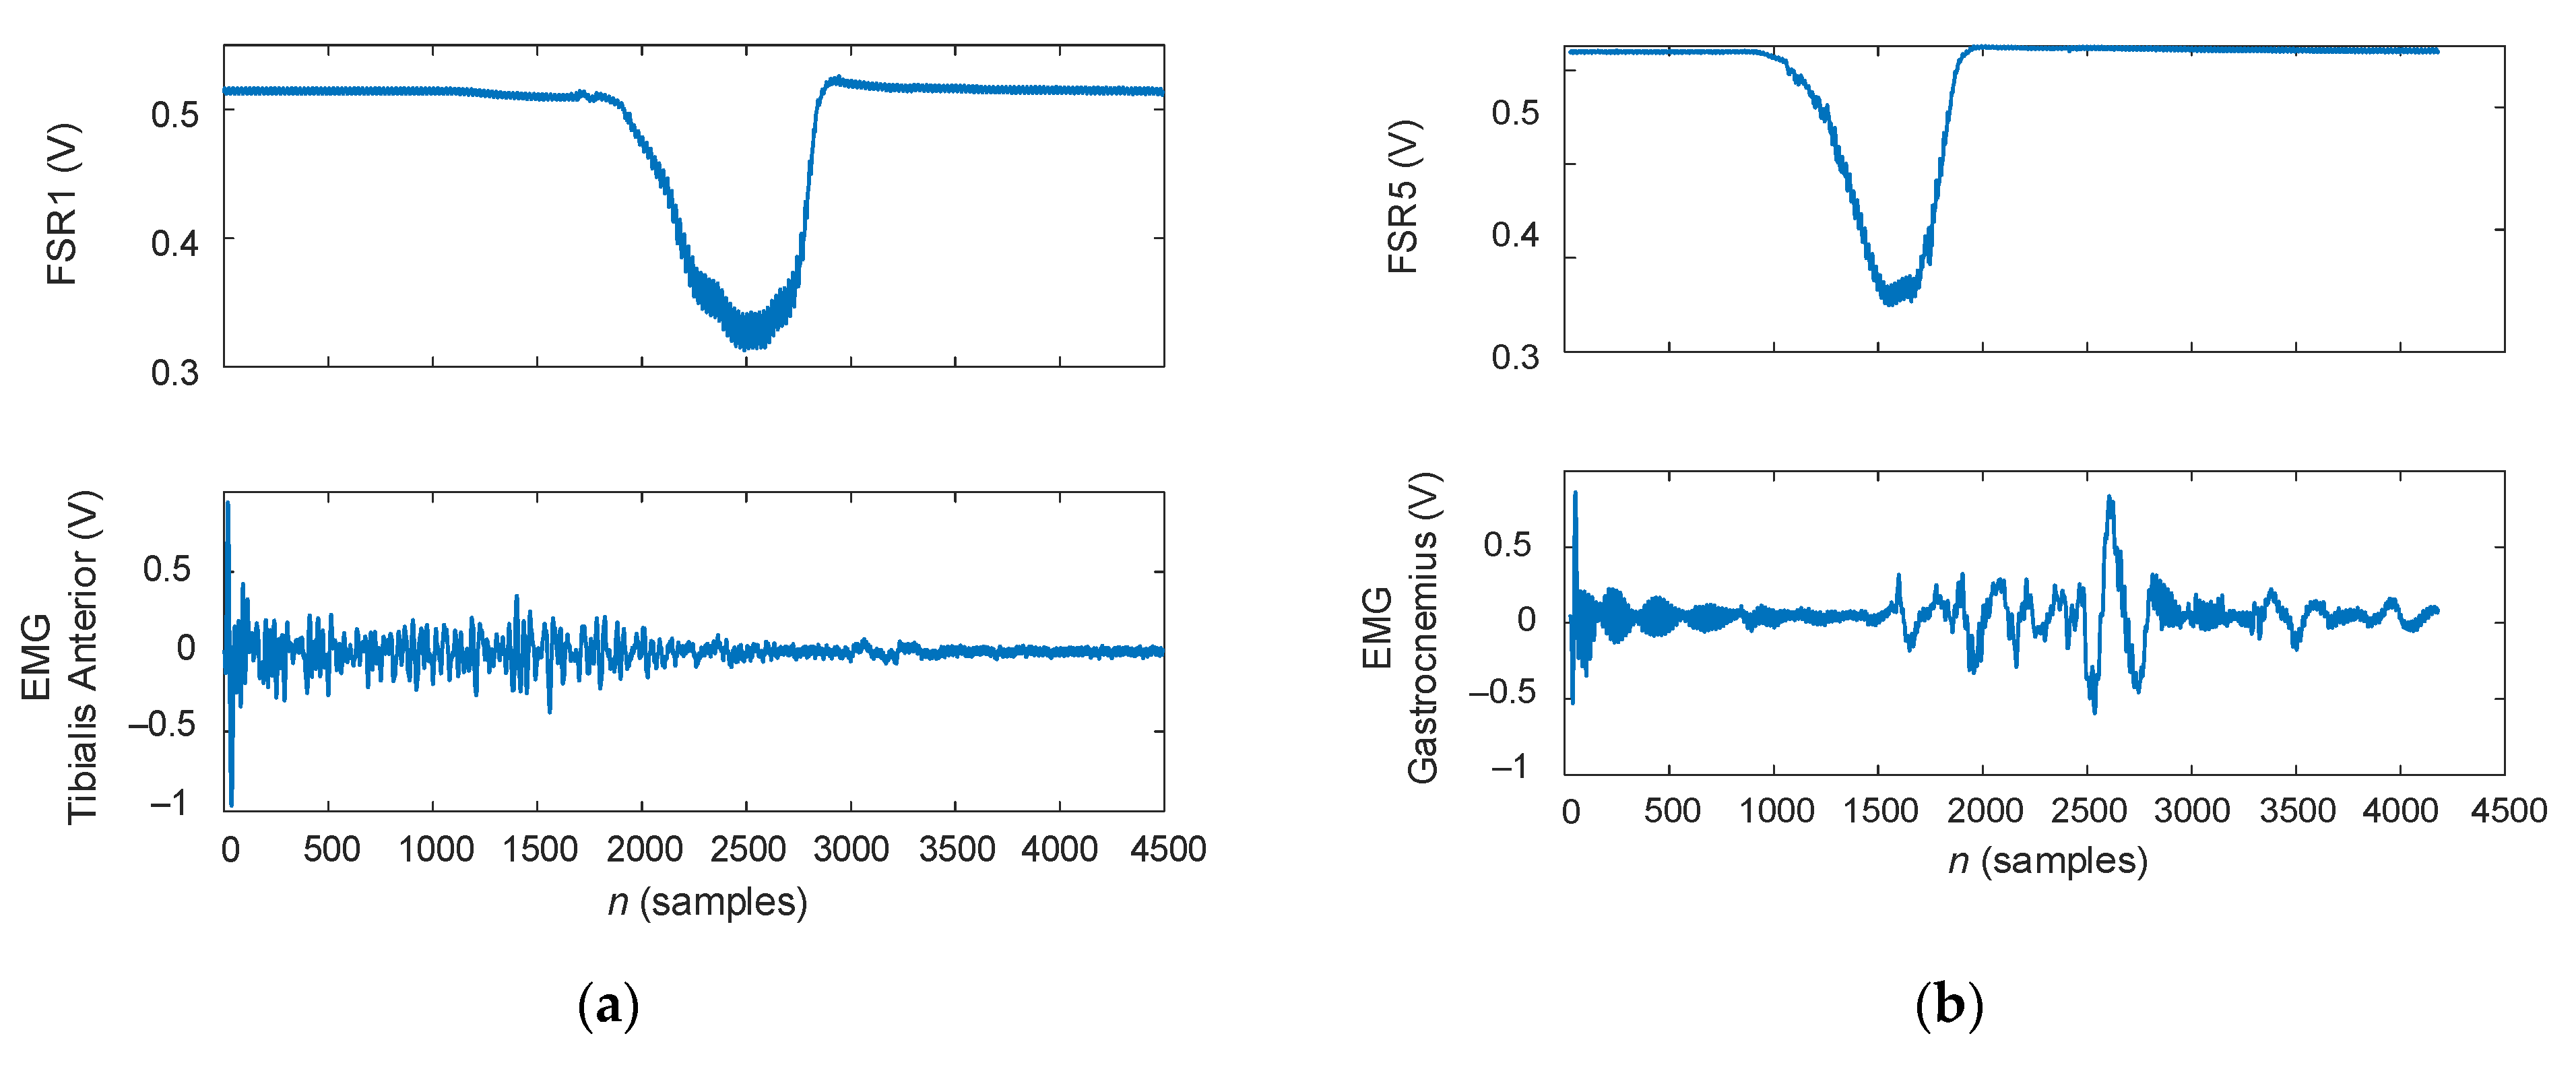
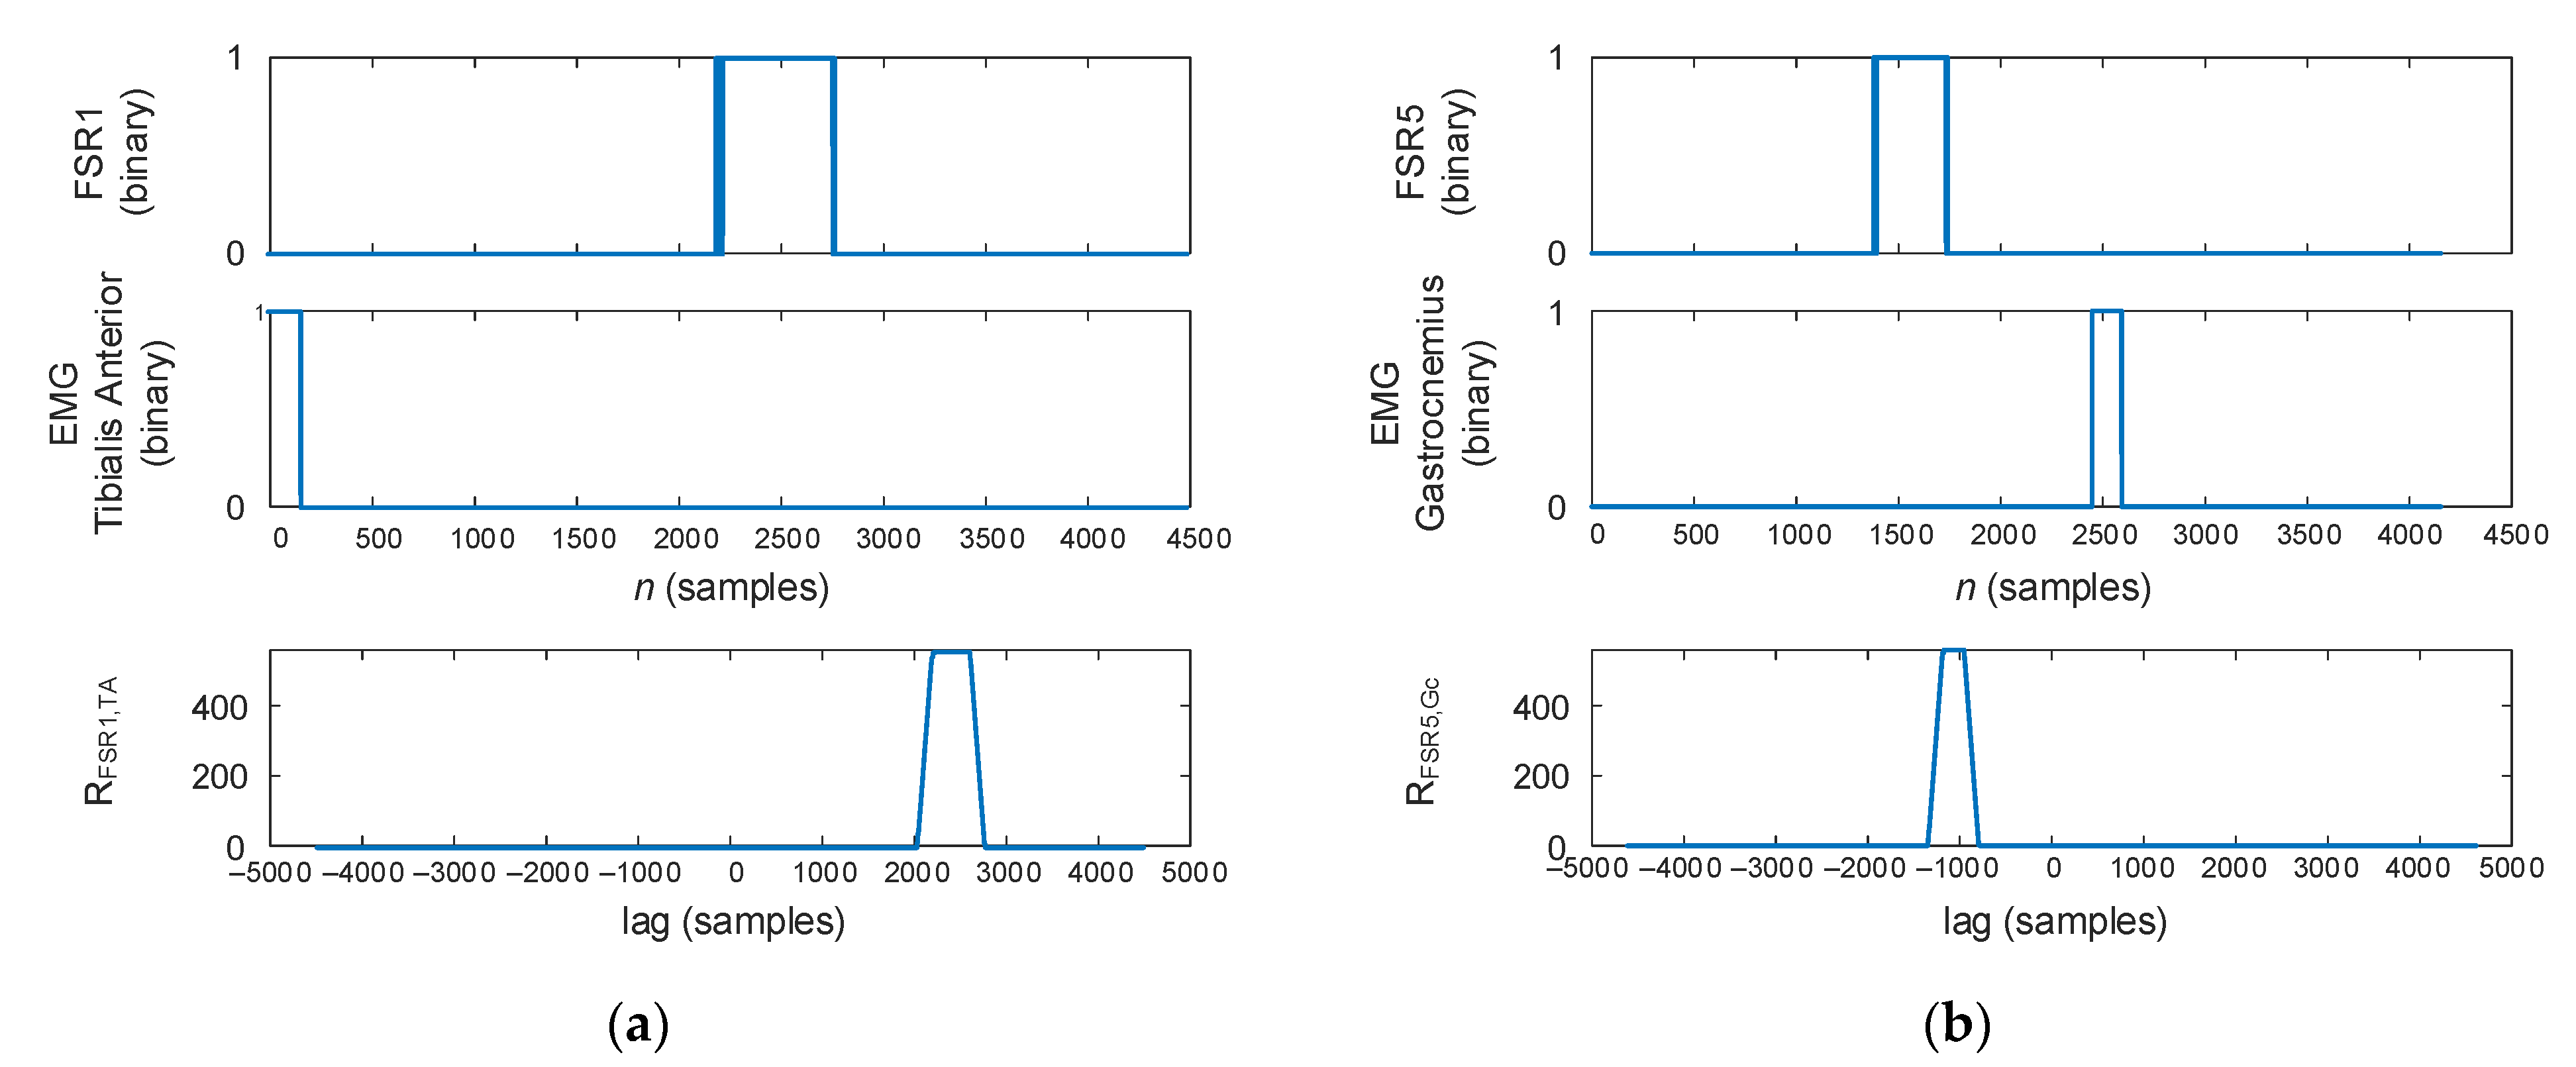
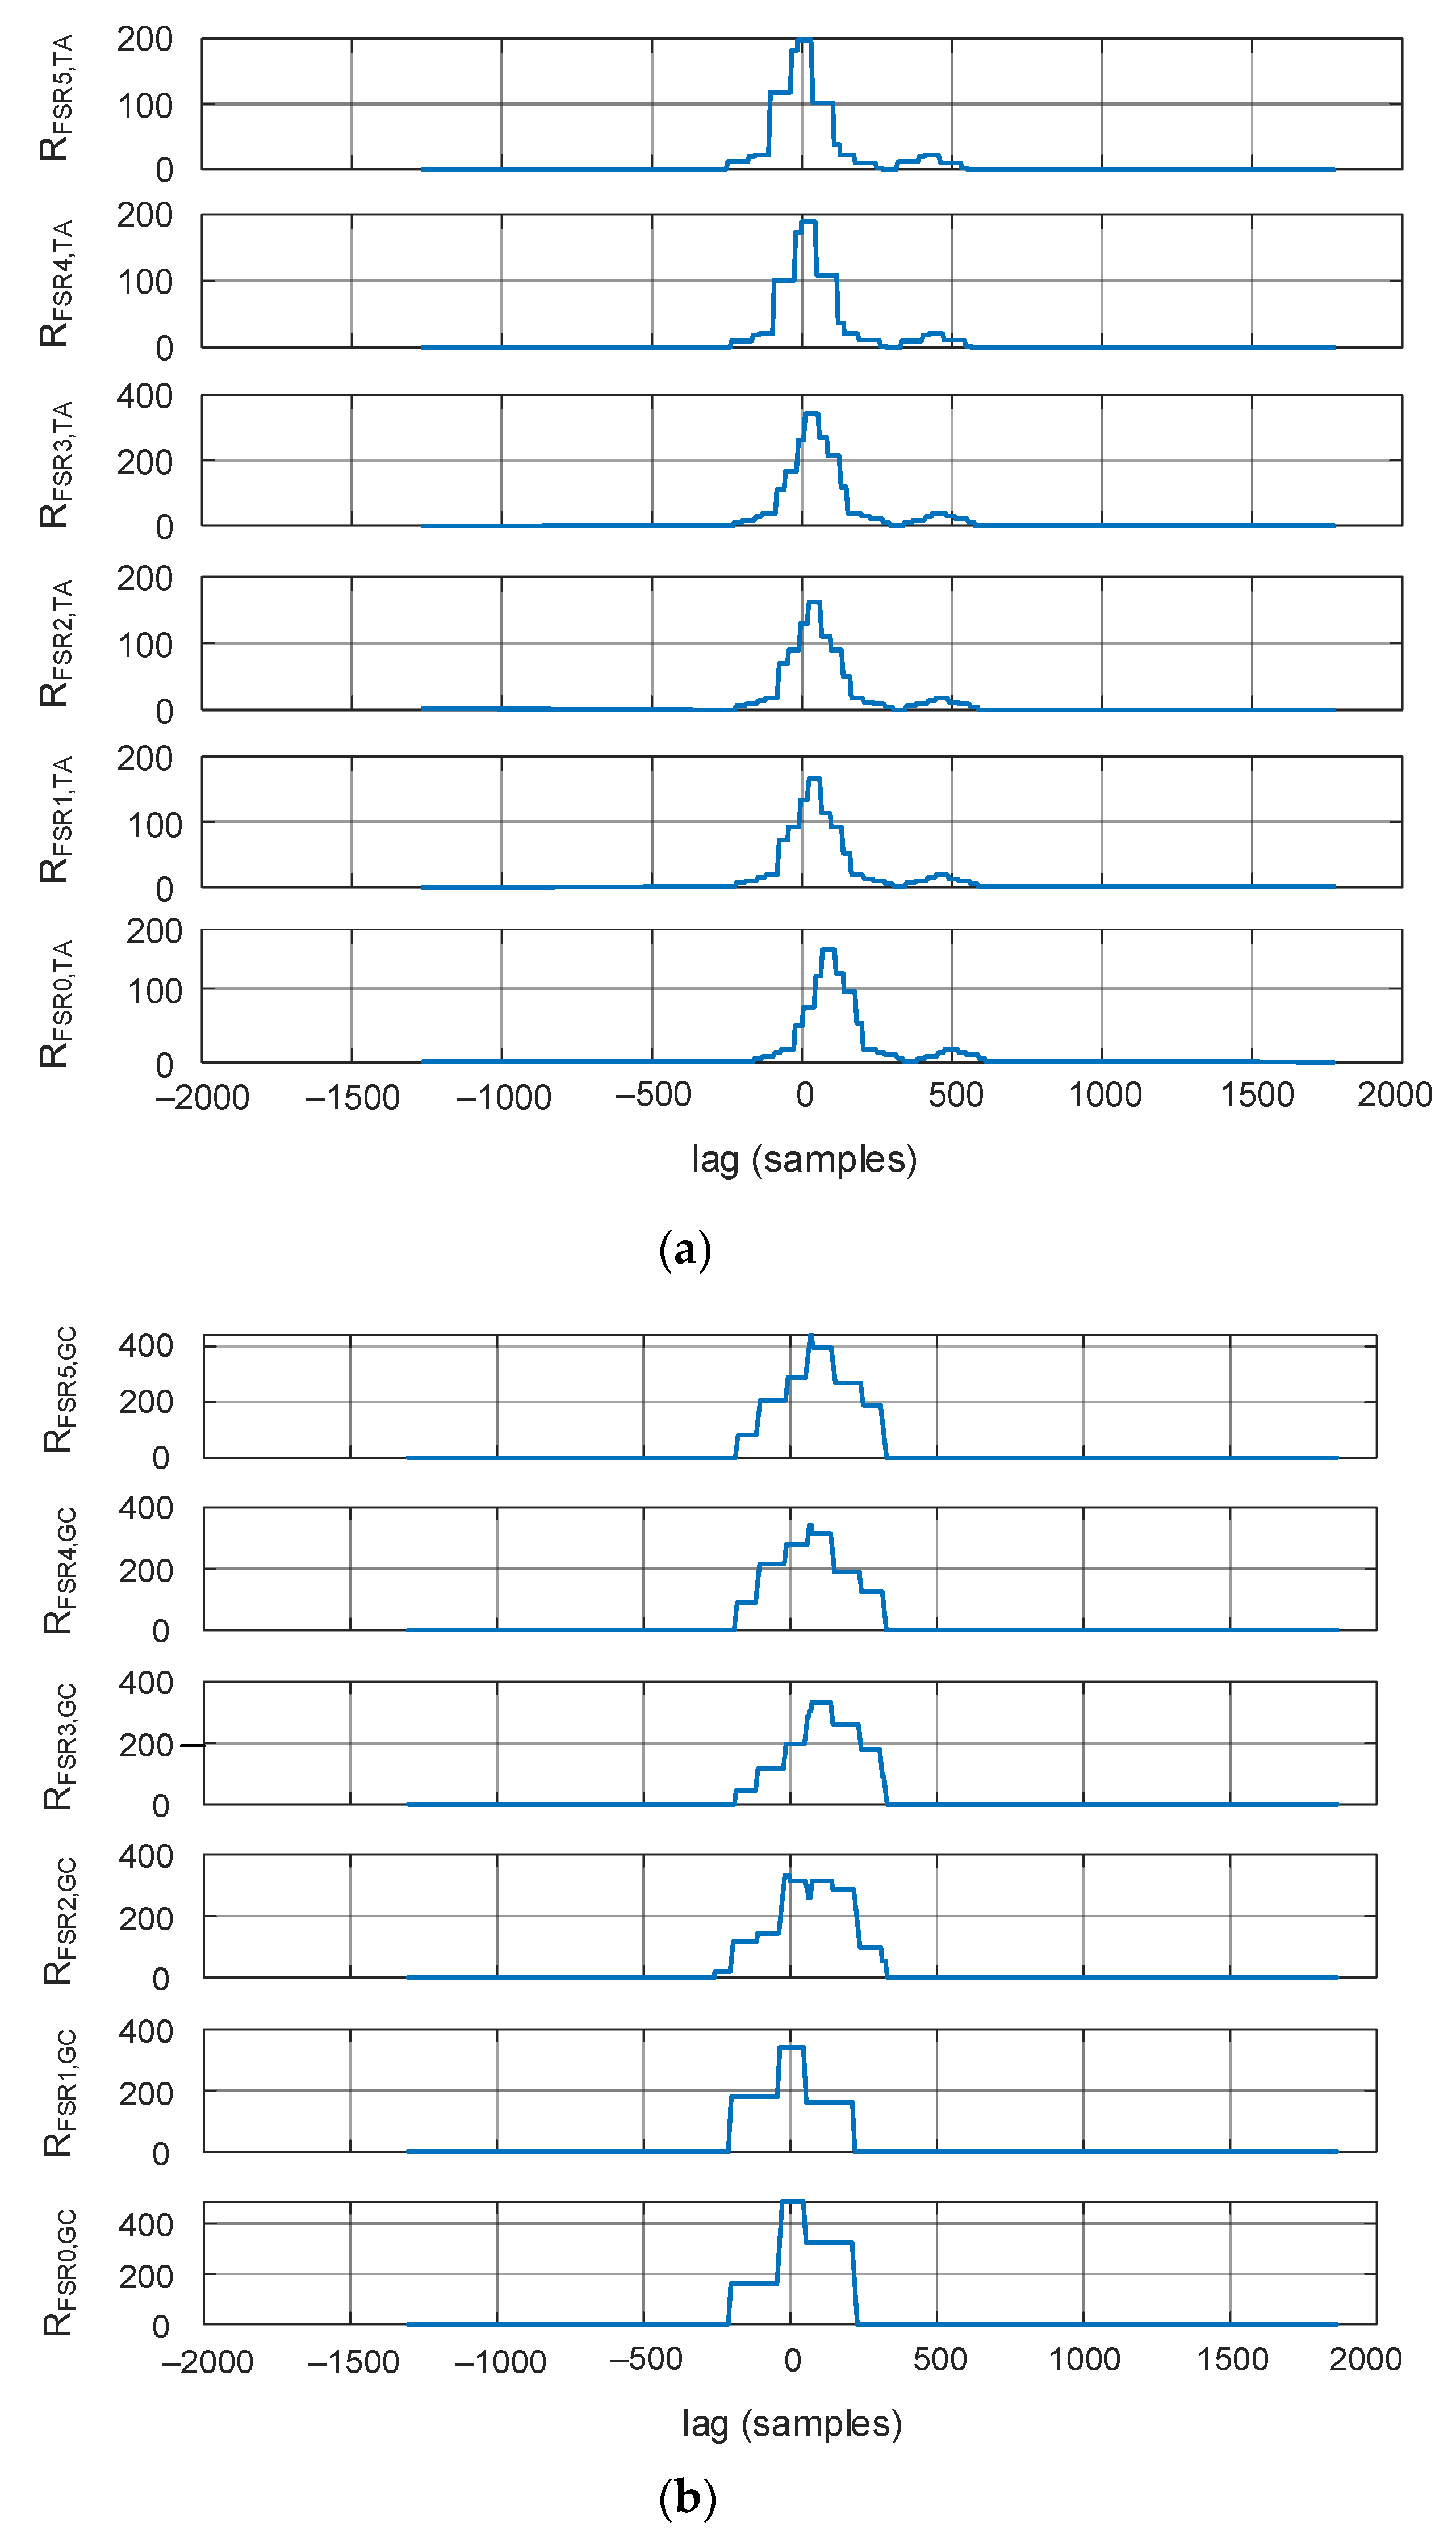
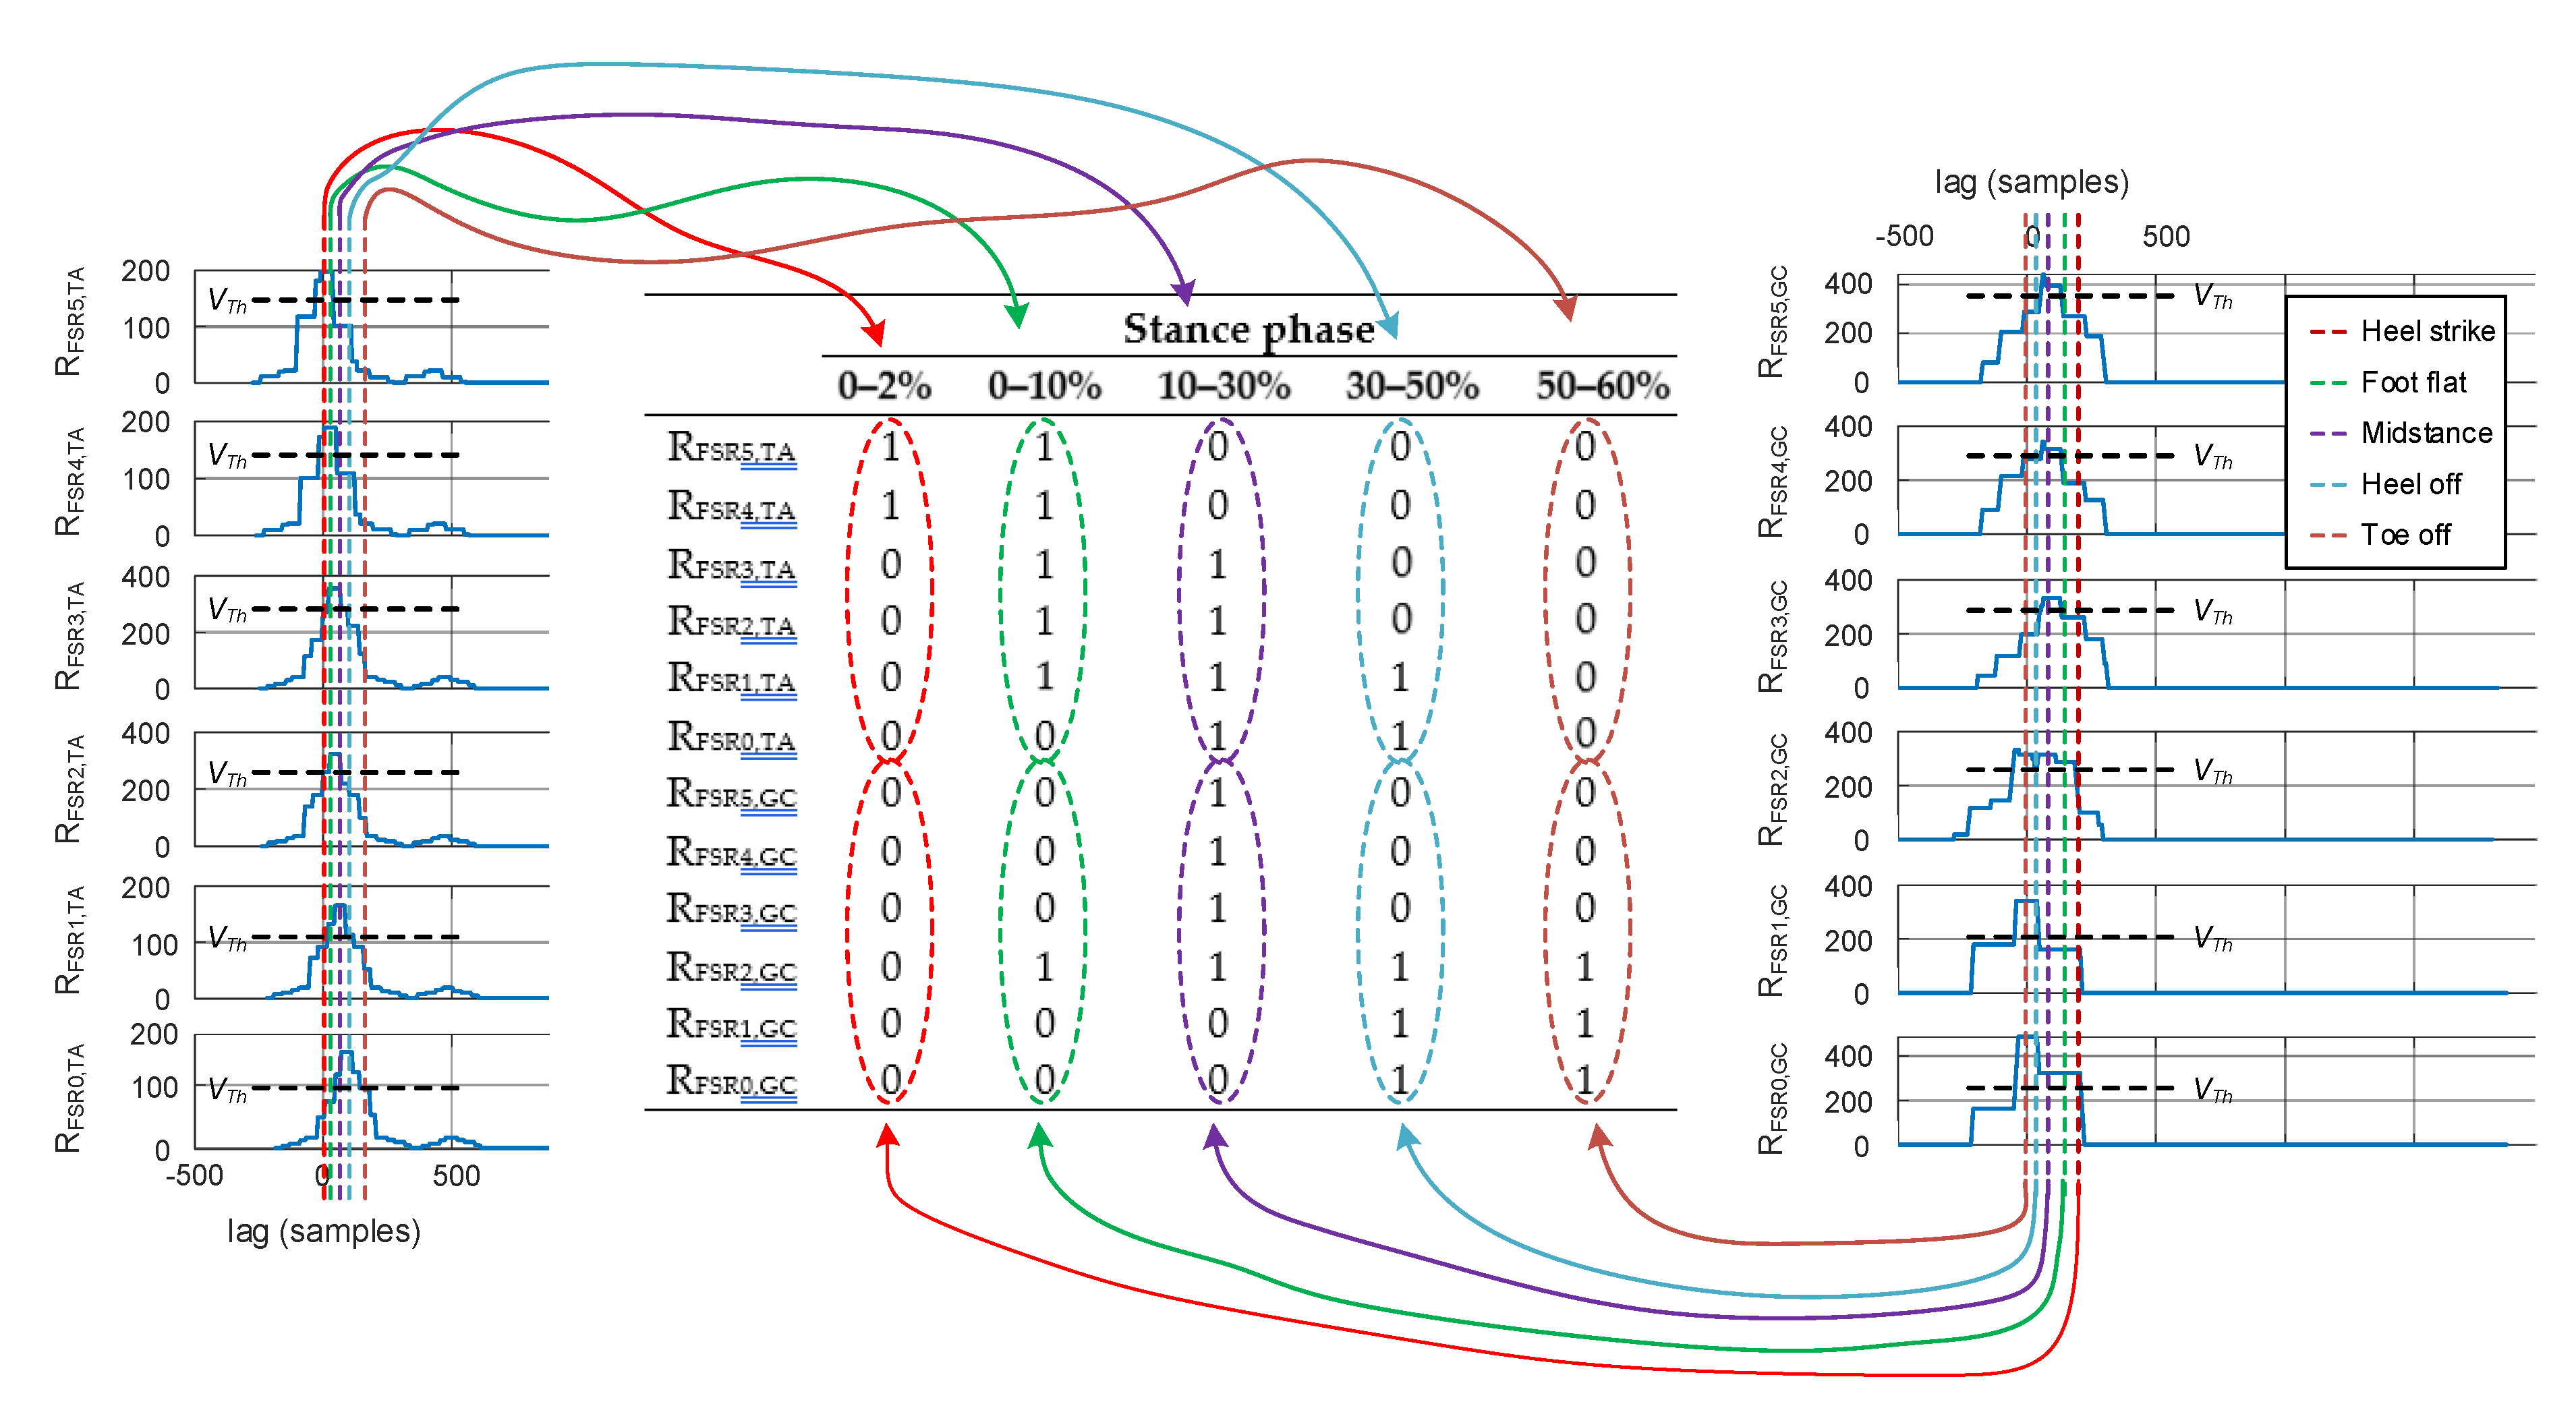
2.3. Correlation of the Plantar Pressure with Muscular Activity
3. Results
4. Discussion
Author Contributions
Funding
Institutional Review Board Statement
Informed Consent Statement
Data Availability Statement
Acknowledgments
Conflicts of Interest
References
- Faragό, P.; Cirlugea, M.; Hintea, S. A Novel Smart-Shoe Architecture for Podiatric Monitoring. In Proceedings of the 43rd International Conference on Telecommunications and Signal Processing (TSP), Milan, Italy, 7–9 July 2020; pp. 180–183. [Google Scholar] [CrossRef]
- Kendal, F.P.; Kendal McCreary, E.; Provance, P.G.; Rodgers, M.M.; Romani, W.A. Muscles: Testing and Testing and Function with Posture and Pain, 5th ed.; Lippincott Williams & Wilkins: Baltimore, MD, USA, 2005. [Google Scholar]
- Farago, M.; Pop, S. Kinetotherapy Evaluation Methods and Techniques (Original in Romanian: Metode și Tehnici de Evaluare în Kinetoterapie); Editura Universității din Oradea: Oradea, Romania, 2008. [Google Scholar]
- Ho, I.J.; Hou, Y.Y.; Yang, C.H.; Wu, W.L.; Chen, S.K.; Guo, L.Y. Comparison of Plantar Pressure Distribution between Different Speed and Incline During Treadmill Jogging. J. Sports Sci. Med. 2010, 9, 154–160. [Google Scholar] [PubMed]
- Wafai, L.; Zayegh, A.; Woulfe, J.; Aziz, S.M.; Begg, R. Identification of Foot Pathologies Based on Plantar Pressure Asymmetry. Sensors 2015, 15, 20392–20408. [Google Scholar] [CrossRef] [PubMed] [Green Version]
- Shu, L.; Hua, T.; Wang, Y.; Li, Q.; Feng, D.; Tao, X. In-shoe plantar pressure measurement and analysis system based on fabric pressure sensing array. IEEE Trans. Inf. Technol. Biomed. 2010, 14, 767–775. [Google Scholar] [CrossRef] [PubMed] [Green Version]
- Wei, Q.; Lu, W.; Fu, Z.; Lu, S. A new system for foot pressure measurement and gait analysis. Chin. J. Biomed. Eng. 2000, 19, 32–40. [Google Scholar]
- Maier, L. Portable Plantar Pressure Monitoring System Implemented with Arduino UNO (Original in Romanian: Sistem Portabil de Monitorizare a Presiunii Plantare Implementat cu Arduino UNO). Diploma Thesis, Technical University of Cluj-Napoca, Cluj-Napoca, Romania, 2019. [Google Scholar]
- Elvitigala, D.S.; Matthies, D.J.C.; David, L.; Weerasinghe, C.; Nanayakkara, S. GymSoles: Improving Squats and Dead-Lifts by Visualizing the User’s Center of Pressure. In Proceedings of the 2019 CHI Conference on Human Factors in Computing Systems (CHI’19), Glasgow, UK, 4–9 May 2019; Paper 174; pp. 1–12. [Google Scholar] [CrossRef]
- Karadsheh, M. Orthobullets—Gait Cycle. Available online: https://www.orthobullets.com/foot-and-ankle/7001/gait-cycle (accessed on 25 November 2020).
- Alamdari, A.; Krovi, V.N. Chapter Two—A Review of Computational Musculoskeletal Analysis of Human Lower Extremities. In Human Modeling for Bio-inspired Robotics: Mechanical Engineering in Assistive Technologies; Ueda, J., Kurita, Y., Eds.; Academic Press: San Diego, CA, USA, 2017; pp. 37–73. ISBN 978-0-12-803137-7. [Google Scholar] [CrossRef]
- Bonnefoy, A.; Armand, S. Normal Gait. In Orthopedic Management of Children with Cerebral Palsy: A Comprehensive Approach; Canavesse, F., Deslandes, J., Eds.; Nova Science Publishers: Hauppauge, NY, USA, 2015; pp. 199–213. ISBN 978-1-63483-318-9. [Google Scholar]
- Ivanov, K.; Mei, Z.; Lubich, L.; Guo, N.; Xile, D.; Zhao, Z.; Omnisore, O.M.; Ho, D.; Wang, L. Design of a Sensor Insole for Gait Analysis. In Intelligent Robotics and Applications. ICIRA 2019. Lecture Notes in Computer Science; Yu, H., Liu, J., Liu, L., Ju, Z., Liu, Y., Zhou, D., Eds.; Springer: Cham Switzerland, 2019; Volume 11743, pp. 433–444. ISBN 978-3-030-27537-2. [Google Scholar] [CrossRef]
- Cho, H. Design and Implementation of a Lightweight Smart Insole for Gait Analysis. In Proceedings of the 2017 IEEE Trustcom/BigDataSE/ICESS, Sydney, NSW, Australia, 1–4 August 2017; pp. 792–797. [Google Scholar] [CrossRef]
- Aqueveque, P.; Osorio, R.; Pastene, F.; Saavedra, F.; Pino, E. Capacitive Sensors Array for Plantar Pressure Measurement Insole fabricated with Flexible PCB. In Proceedings of the 40th Annual International Conference of the IEEE Engineering in Medicine and Biology Society (EMBC), Honolulu, HI, USA, 18–21 July 2018; pp. 4393–4396. [Google Scholar] [CrossRef]
- Kramer, M.; du Randt, R.; Venter, D. Dynamic plantar pressure profiles of South African university students. S. Afr. J. Sports Med. 2015, 27, 4–11. [Google Scholar] [CrossRef]
- Honeine, J.L.; Schiepati, M.; Gagey, O.; Do, M.C. The Functional Role of the Triceps Surae Muscle during Human Locomotion. PLoS ONE 2013, 8, 52943. [Google Scholar] [CrossRef] [Green Version]
- Qaqish, J.; McLean, S. Foot Type and Tibialis Anterior Muscle Activity during Stance Phase of Gait. Int. J. Physiother. Rehabil. 2010, 1, 19–29. [Google Scholar]
- Lenhart, R.L.; Francis, C.A.; Lenz, A.L.; Thelen, D.G. Empirical evaluation of gastrocnemius and soleus function during walking. J. Biomech. 2014, 47, 2969–2974. [Google Scholar] [CrossRef] [Green Version]
- Orendurff, M.S.; Aiona, M.D.; Dorociak, R.D.; Pierce, R.A. Length and force of the gastrocnemius and soleus during gait following tendo Achilles lengthenings in children with equinus. Gait Posture 2002, 15, 130–135. [Google Scholar] [CrossRef]
- Krewer, C.; Bergmann, J.; Gräfrath, P.C.; Jahn, K. Influence of foot position on static and dynamic standing balance in healthy young adults. Hear. Balance Commun. 2018, 16, 208–214. [Google Scholar] [CrossRef]
- Barati, A.H.; Bagheri, A.; Azimi, R.; Darchini, M.A.; Nik, H.N. Comparison balance and footprint parameters in normal and overweight children. Int. J. Prev. Med. 2013, 4, 92–97. [Google Scholar]
- AlAbdulwahab, S.S.; Kachanathu, S.J. Effects of body mass index on foot posture alignment and core stability in a healthy adult population. J. Exerc. Rehabil. 2016, 12, 182–187. [Google Scholar] [CrossRef] [PubMed] [Green Version]
- Aurichio, T.R.; Rebelatto, J.R.; de Castro, A.P. The relationship between the body mass index (BMI) and foot posture in elderly people. Arch. Gerontol. Geriatr. 2011, 52, 89–92. [Google Scholar] [CrossRef] [PubMed]
- Hawke, F.; Rome, K.; Evans, A.M. The relationship between foot posture, body mass, age and ankle, lower-limb and whole-body flexibility in healthy children aged 7 to 15 years. J. Foot Ankle Res. 2016, 9, 14. [Google Scholar] [CrossRef] [Green Version]
- Carvalho, C.E.; da Silva, R.A.; Gil, A.W.; Oliveira, M.R.; Nascimento, J.A.; Pires-Oliveira, D.A. Relationship between foot posture measurements and force platform parameters during two balance tasks in older and younger subjects. J. Phys. Ther. Sci. 2015, 27, 705–710. [Google Scholar] [CrossRef] [Green Version]
- Timotius, I.K.; Canneva, F.; Minakaki, G.; Pasluosta, C.; Moceri, S.; Casadei, N.; Riess, O.; Winkler, J.; Klucken, J.; von Hörsten, S.; et al. Dynamic footprint based locomotion sway assessment in α-synucleinopathic mice using Fast Fourier Transform and Low Pass Filter. J. Neurosci. Methods 2018, 296, 1–11. [Google Scholar] [CrossRef]
- Ellenbecker, T.S.; Aoki, R. Step by Step Guide to Understanding the Kinetic Chain Concept in the Overhead Athlete. Curr. Rev. Musculoskelet. Med. 2020, 13, 155–163. [Google Scholar] [CrossRef]
- Giacomozzi, C.; Caravaggi, P.; Stebbins, J.A.; Leardini, A. Integration of Foot Pressure and Foot Kinematics Measurements for Medical Applications. In Handbook of Human Motion; Müller, B., Wolf, S., Eds.; Springer: Cham, Switzerland, 2016; pp. 1–22. ISBN 978-3-319-30808-1. [Google Scholar] [CrossRef]
- Carson, M.C.; Harrington, M.E.; Thompson, N.; O’Connor, J.J.; Theologis, T.N. Kinematic analysis of a multi-segment foot model for research and clinical applications: A repeatability analysis. J. Biomech. 2001, 34, 1299–1307. [Google Scholar] [CrossRef]
- Balsdon, M.E.R.; Dombroski, C.E. Reliability of a multi-segment foot model in a neutral cushioning shoe during treadmill walking. J. Foot Ankle Res. 2018, 11, 60. [Google Scholar] [CrossRef]
- Schallig, W.; van den Noort, J.C.; McCahill, J.; Stebbins, J.; Leardini, A.; Maas, M.; Harlaar, J.; van der Krogt, M.M. Comparing the kinematic output of the Oxford and Rizzoli Foot Models during normal gait and voluntary pathological gait in healthy adults. Gait Posture 2020, 82, 126–132. [Google Scholar] [CrossRef]
- Leardini, A.; Benedetti, M.G.; Berti, L.; Bettinelli, D.; Nativo, R.; Giannini, S. Rear-foot, mid-foot and fore-foot motion during the stance phase of gait. Gait Posture 2007, 25, 453–462. [Google Scholar] [CrossRef] [PubMed]
- Simon, J.; Doederlein, L.; McIntosh, A.S.; Metaxiotis, D.; Bock, H.G.; Wolf, S.I. The Heidelberg foot measurement method: Development, description and assessment. Gait Posture 2006, 23, 411–424. [Google Scholar] [CrossRef] [PubMed]
- Nicholson, K.; Church, C.; Takata, C.; Niiler, T.; Chen, B.P.; Lennon, N.; Sees, J.P.; Henley, J.; Miller, F. Comparison of three-dimensional multi-segmental foot models used in clinical gait laboratories. Gait Posture 2018, 63, 236–241. [Google Scholar] [CrossRef] [PubMed]
- Stebbins, J.; Giacomozzi, C.; Theologis, T. Correlation between plantar pressure and Oxford Foot Model kinematics. J. Foot Ankle Res. 2008, 1, 1–2. [Google Scholar] [CrossRef] [Green Version]
- Giacomozzi, C.; Stebbins, J.A. Anatomical masking of pressure footprints based on the Oxford Foot Model: Validation and clinical relevance. Gait Posture 2017, 53, 131–138. [Google Scholar] [CrossRef]
- Wank, V.; Frick, U.; Schmidtbleicher, D. Kinematics and electromyography of lower limb muscles in overground and treadmill running. Int. J. Sports Med. 1998, 19, 455–461. [Google Scholar] [CrossRef]
- Prasad, N.K.; Coleman Wood, K.A.; Spinner, R.J.; Kaufman, K.R. Foot and Ankle Kinematics and Dynamic Electromyography: Quantitative Analysis of Recovery from Peroneal Neuropathy in a Professional Football Player. J. Surg. Orthop. Adv. 2016, 25, 180–186. [Google Scholar]
- MIKROE Time-saving Embedded Tools—EMG Click Datasheet. Available online: https://www.mikroe.com/emg-click (accessed on 25 November 2020).
- Narwaria, R.P.; Verma, S.; Singhal, P.K. Removal of Baseline Wander and Power Line Interference from ECG Signal—A Survey Approach. Int. J. Electron. Eng. 2011, 3, 107–111. [Google Scholar]
- Hung, C.-C.; Halonen, I.; Ismail, M.; Porra, V. Micropower CMOS Gm-C Filters for Speech Signal Processing. In Proceedings of the 1997 IEEE International Symposium on Circuits and Systems, Hong Kong, China, 9–12 June 1997; Volume 3, pp. 1972–1975. [Google Scholar]
- Mills, K.R. The basics of electromyography. J. Neurol. Neurosurg. Psychiatry 2005, 76, 32–35. [Google Scholar] [CrossRef] [Green Version]
- Faragό, P.; Groza, R.; Hintea, S. High Precision Activity Tracker Based on the Correlation of Accelerometer and EMG Data. In Proceedings of the 42nd International Conference on Telecommunications and Signal Processing (TSP), Budapest, Hungary, 1–3 July 2019; pp. 428–431. [Google Scholar] [CrossRef]
- Al-Angari, H.M.; Kanitz, G.; Tarantino, S.; Cipriani, C. Distance and mutual information methods for EMG feature and channel subset selection for classification of hand movements. Biomed. Signal Process. Control 2016, 27, 24–31. [Google Scholar] [CrossRef]
- Balbinot, A.; Favieiro, G. A Neuro-Fuzzy System for Characterization of Arm Movements. Sensors 2013, 13, 2613–2630. [Google Scholar] [CrossRef] [PubMed] [Green Version]
- Faragó, P.; Groza, R.; Ivanciu, L.; Hintea, S. A Correlation-based Biometric Identification Technique for ECG, PPG and EMG. In Proceedings of the 42nd International Conference on Telecommunications and Signal Processing (TSP), Budapest, Hungary, 1–3 July 2019; pp. 716–719. [Google Scholar] [CrossRef]
- Nazmi, N.; Abdul Rahman, M.A.; Yamamoto, S.; Ahmad, S.A.; Zamzuri, H.; Mazlan, S.A. A Review of Classification Techniques of EMG Signals during Isotonic and Isometric Contractions. Sensors 2016, 16, 1304. [Google Scholar] [CrossRef] [PubMed] [Green Version]
- Zhang, Y.; Li, P.; Zhu, X.; Su, S.W.; Guo, Q.; Xu, P.; Yao, D. Extracting time-frequency feature of single-channel vastus medialis EMG signals for knee exercise pattern recognition. PLoS ONE 2017, 12, 0180526. [Google Scholar] [CrossRef] [PubMed] [Green Version]
- Rabbi, M.F.; Ghazali, K.H.; Ahamed, N.U.; Sikandar, T. Time and frequency domain features of EMG signal during Islamic prayer (Salat). In Proceedings of the IEEE 13th International Colloquium on Signal Processing & its Applications (CSPA), Batu Ferringhi, Malaysia, 10–12 March 2017; pp. 139–143. [Google Scholar] [CrossRef]
- Munteanu, M.; Rusu, C.; Moga, D.; Moga, R.; Tont, G. EMG Signals Case Study: A Time and Frequency Domain Analysis. In IFMBE Proceedings book series, Proceedings of the International Conference on Advancements of Medicine and Health Care through Technology, Cluj-Napoca, Romania, 29 August–2 September 2011; Vlad, S., Ciupa, R.V., Eds.; Springer: Berlin/Heidelberg, Germany, 2011; Volume 36, pp. 202–205. [Google Scholar] [CrossRef]
- Marple, S.L., Jr. Digital Spectral Analysis, 2nd ed.; Dover Publications: Mineola, NY, USA, 2019; ISBN 978-048-6780-52-8. [Google Scholar]
- Park, S.; Choi, H.; Ryu, K.; Kim, S.; Kim, Y. Kinematics, kinetics and muscle activities of the lower extremity during the first four steps from gait initiation to the steady-state walking. J. Mech. Sci. Technol. 2009, 23, 204–211. [Google Scholar] [CrossRef]
- Di Giulio, I.; Maganaris, C.N.; Baltzopoulos, V.; Loram, I.D. The proprioceptive and agonist roles of gastrocnemius, soleus and tibialis anterior muscles in maintaining human upright posture. J. Physiol. 2009, 587, 2399–2416. [Google Scholar] [CrossRef] [PubMed]
- Farago, P.; Groza, R.; Hintea, S.; Soser, P. A Programmable Biopotential Aquisition Front-end with a Resistance-free Current-balancing Instrumentation Amplifier. Adv. Electr. Comput. Eng. 2018, 18, 85–92. [Google Scholar] [CrossRef]
- Yoon, S.W. Analysis of the muscular activities of the tibialis anterior and gastrocnemius muscles in functional reach. J. Phys. Ther. Sci. 2017, 29, 851–853. [Google Scholar] [CrossRef] [Green Version]


| Gait Phase | Heel Strike | Foot Flat | Midstance | Heel Off | Toe Off |
|---|---|---|---|---|---|
| Duration—% of Total | 0–2% | 0–10% | 10–30% | 30–50% | 50–60% |
| Iliopsoas | inactive | inactive | inactive | concentric | concentric |
| Gluteus Maximus | eccentric | inactive | inactive | inactive | inactive |
| Gluteus Medius | eccentric | eccentric | eccentric | eccentric | inactive |
| Hamstrings | eccentric | eccentric | inactive | inactive | inactive |
| Quadriceps | eccentric | eccentric | inactive | inactive | eccentric |
| Pretibial muscles | eccentric | eccentric | inactive | inactive | inactive |
| Calf muscles | inactive | inactive | eccentric | concentric | concentric |
| Gait Phase | Acceleration | Midswing | Deceleration |
|---|---|---|---|
| Duration—% of Total | 0–2% | 0–10% | 10–30% |
| Iliopsoas | concentric | concentric | inactive |
| Gluteus Maximus | inactive | inactive | inactive |
| Gluteus Medius | inactive | inactive | inactive |
| Hamstrings | eccentric | eccentric | eccentric |
| Quadriceps | eccentric | inactive | inactive |
| Pretibial muscles | concentric | concentric | concentric |
| Calf muscles | inactive | inactive | inactive |
| Results and Accuracy | As the speed increases (1.5 m/s ≥ 2.5 m/s) The peak pressure of heel region increases about 33%, in the medial arch about 16%, in the lateral arch lift about 25%, in the central forefoot about 19% and in the lateral forefoot about 18%. The maximum force of the heel increases about 46%, in the medial arch about 67%, in lateral arch lift about 48%, in the central forefoot about 23%, in the lateral forefoot about 27%, and in the medial forefoot lift about 17% As jogging slope increases (0% ≥ 15%) The peak pressure of heel decreases about 27%, of the medial forefoot about 15%, of the hallux about 26%, and in the toes about 19% | The intraclass correlation coefficient ICC > 0.86 for within-session walking trials, with all regions ICC > 0.8 between-session, with all regions, apart from the lesser toes (0.79–left, 0.78–right) and midfoot (0.75–left, 0.76–right) The symmetry index (SI) showed a median range between ~10–18% for the control group, while for the pathological group SI was between ~14–22% The symmetry angle (SA) showed a median range of ~3–6% for the control group, while for the pathological group SA was between ~4–7% | |
| Muscles | n.a. | n.a. | |
| No of Plantar Sensors | 85–99 | 960 | |
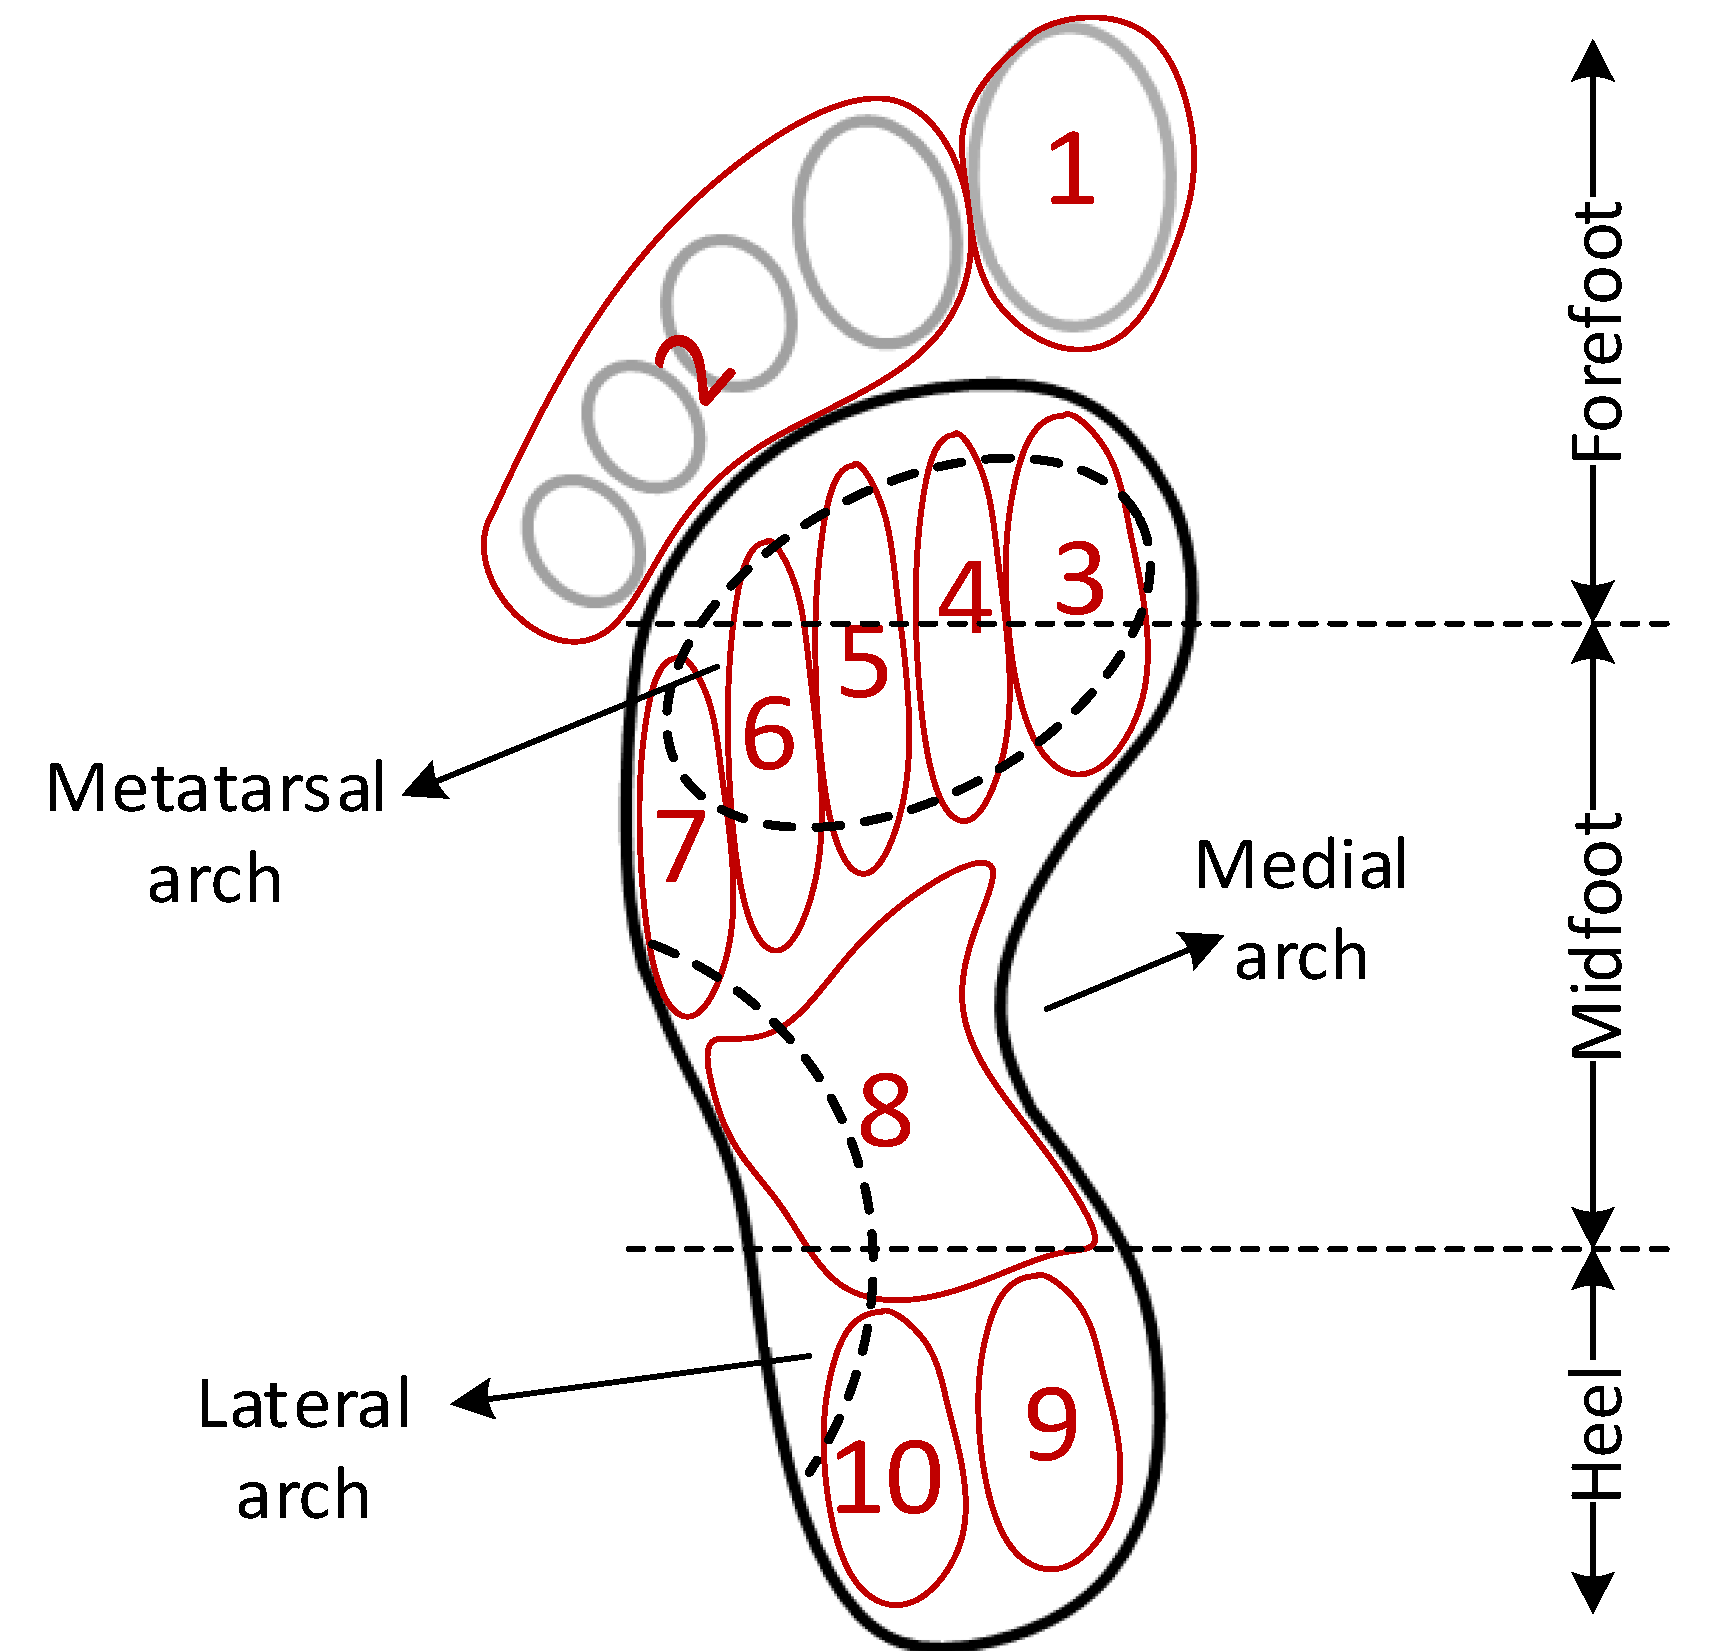
| Plantar Data Regions | 8: (1) heel, (2) medial arch, (3) lateral arch, (4) medial metatarsal, (5) central metatarsals, (6) lateral metatarsals, (7) great toe, and (8) little toes | 10: (1) interphalangeal joint (IPJ), (2) lesser toes, (3) metatarsophalangeal joint 1 (MPJ1), (4) MPJ2, (5) MPJ3; (6) MPJ4, (7) MPJ5, (8) midfoot, (9) medial heel, and (10) lateral heel | |
| Hardware Used for Data Collection | Pedar-X system pressure insoles placed inside shoes | F-scan in-shoe pressure measurement system (Tekscan, MA, USA) | |
| No. of Participants | 20 females | 51 (31 healthy and 20 with foot pathology) | |
| Reference | Ref. [4] compares the plantar pressure distribution of the foot between different incline and speed during treadmill jogging by using plantar insole measurement system | Ref. [5] identifies foot pathologies based on plantar pressure asymmetry | |
| Results and Accuracy | Visualizing CoP users were able to improve their body posture during squats and dead-lift exercises Squats for beginners F3,168 = 13.36, p < 0.0001 Squats for advanced users F3,168 = 1.152, p > 0.05 Dead-lifts 10 kg for beginners F3,180 = 10.66, p < 0.0001 Dead-lifts 10 kg for advanced users F3,157 = 4.101, p < 0.01 Dead-lifts 20 kg for beginners F3,127 = 12.47, p < 0.0001 Dead-lifts 20 kg for advanced users F3,144 = 1.44, p > 0.05 | Features extracted: maximum, minimum, mean, range, zero-crossing rate, root-mean-square values, variance, standard variance, skewness, and kurtosis Classifier: Random forest Classification accuracy: 98.75% (80% data training, 20% data testing, 5-fold cross validation) | Higher pressure values under the forefoot were determined for black participants when compared with white (t = 0.000, p < 0.05, d = 0.78) and coloured (t = 0.026, p < 0.05, d = 0.35) participants Lower pressure values under the midfoot region were obtained for white participants compared with black (t = 0.003, p < 0.05, d = 0.94) and coloured (t = 0.02, p < 0.05, d = 0.58) participants |
| Muscles | Trapezius, spinal erectors, gluteus maximus, adductor magnus, hamstrings, quadriceps femoris | n.a. | n.a. |
| No of Plantar Sensors | 16 force-sensitive pressure points, based on resistive technology + 15 markers (leg, waist, shoulder) | 9 force sensors + gyroscope + accelerometer | 10 |
| Plantar Data Regions | Plantar surface: anterior (12), posterior(4) (sensors for detecting CoP) | 9: (1) the big toe (T1), (2–6) the five metatarsal heads (M1–M5), (7) the midfoot (MF1), and (8–9)the heel (LH1, MH1) | 10: (1) the hallux (great toe), (2) lateral toes, (3–7) metatarsal 1–5, (8) midfoot, (9) medial heel, and (10) lateral heel |
| Hardware Used for Data Collection | GymSoles prototype, placed on both feet + an OptiTrack motion tracking system | n.a. | RS Footscan (RSscan, Belgium) system was used to measure the plantar pressure values of the foot |
| No. of Participants | 13 (9 males and 4 females) | 20 | 180 (gender: 90 male, and 90 female; race: 60 black, 60 white, and 60 coloured) |
| Reference | Ref. [9] describes a way to improve the body posture by visualizing the center of pressure (CoP) | Ref. [13] presents a multimodal sensor insole that allows capturing kinetic and kinematic information reflecting the foot dynamic characteristics, for person recognition | Ref. [16] presents generation of normative tables from plantar pressure data |
| Results and accuracy | The instants of foot off (FO) and foot contact (FC) with respect to the onset of the movement (t0) did not change with added load The onset of SOL activity with respect to FO was significantly anticipated in the loaded trials (F(1,9) = 5.183, p < 0.05); velocity per se had no significant effect (F(1,9) = 0.01, p = 0.92) No significant difference in the time of onset across the three muscle bursts (SOL, GM and GL) (F(2,6) = 0.96, p = 0.40) The propulsive force increased on average by about 36% for the spontaneous velocity (F(1,9) = 101.1, p < 0.001), and by about 29% for the fast velocity (F(1,9) = 8.1, p < 0.05) The grand mean value of the gap measured at FC was the same between no-load and load conditions, at both spontaneous (F(1,9) = 0.0002, p = 0.98) and fast velocity (F(1,9) = 1.74, p = 0.22) The grand mean value of the torque was significantly larger under the loaded condition, both for the spontaneous (F(1,9) = 9.92, p < 0.05) and for the fast velocity (F(1,9) = 163.98, p < 0.001) | There was no correlation between the total muscle activity during stance phase and navicular drop (r = 00.046, p = 0.816), age (r = 0.024, p = 0.902) and weight (r = 0.163, p = 0.408) | |
| Muscles | triceps surae muscle, gastrocnemius medialis, gastrocnemius lateralis | tibialis anterior | |
| No of Plantar Sensors | 5 | 2 | |
| Plantar Data Regions | 5: (1–2) right and left tibialis anterior (TA), (3) soleus (SOL), (4) gastrocnemius medialis (GM), and (5) gastrocnemius lateralis (GL) muscles | n.a. | |
| Hardware Used for Data Collection | A large force platform (0.90 m 61.80 m, AMTI, USA) was used to record ground reaction force and moments. Surface EMG activity was recorded using bipolar Ag-AgCl electrodes (8 mm diameter, 20 mm inter-electrode distance) | n.a. | |
| No. of Participants | 10 (1 female, and 9 males) | 28 (9 females, and 8 males; foot type: 10 normal, 10 pronated, and 8 supinated) | |
| Reference | Ref. [17] presents the effect of load on muscle activity for a same walking velocity as opposed to the effect of velocity itself | Ref. [18] presents tibialis anterior muscle electromyography (EMG) activity during stance phase of gait | |
| Results and accuracy | The induced gastrocnemius activity was >6 times larger than any other muscle when it was stimulated, and the induced soleus activity was >3 times larger | There was a significant difference in toe-out position between the different conditions (F(4, 92) = 12.833, p = 0.000, η2 = 0.358). Individual distances of self-selected foot position positively correlated with participants’ body height (r = 0.631, p = 0.001) Significant effect of different foot positions between several conditions for the static and dynamic trials were observed For the medio-lateral sway: static (F(2.805, 64.511) = 24.820, p = 0.000, η2 = 0.519), dynamic (F(2.998, 65.037) = 32.349, p = 0.000, η2 = 0.595) For the antero-posterior sway: static (F(5, 115) = 3.150, p = 0.011, η2 = 0.120), dynamic (F(2.713, 59.697) = 14.421, p = 0.003, η2 = 0.396) | |
| Muscles | gastrocnemius or soleus | n.a. | |
| No of Plantar Sensors | 44 reflective surface markers were used to track and record 3D whole-body kinematics: 25 on anatomical landmarks 14 on rigid plates strapped to the shanks and thighs Pre-amplified, single differential EMG electrodes (DE-2.1, DelSys Inc., Boston, MA, USA) were placed over the medial and lateral gastrocnemius, soleus, tibialis anterior, vastus medialis, and medial hamstrings | n.a. | |
| Plantar Data Regions | n.a. | n.a. | |
| Hardware Used for Data Collection | n.a. | Posturographic measurements were recorded by a piezoelectric force plate | |
| No. of Participants | 20 | 24 (14 females, and 10 males) | |
| Reference | Ref. [19] illustrates the effect of electrically stimulating the gastrocnemius or soleus at different stages of the gait cycle | Ref. [21] describes the effects of different foot positions on static and dynamic standing balance to develop recommendations for posturographic protocol | |
| Results and Accuracy | Footprint indices: anterior area (F = 6.29, p = 0.21), mid area (F = 4.17, p = 0.055), posterior area (F = 16.5, p = 0.01), total area (F = 9.97, p = 0.005), arch index (F = 0.015, p = 0.903) Balance indices: posterior-lateral (F = 3.97, p = 0.61), posterior-medial (F = 0.55, p = 0.467), anterior (F = 8.74, p = 0.008), total (F = 4.32, p = 0.051) | The intertester reliability of the FPI ranges from an ICC of 0.62 to 0.91, whereas the intratester reliability ranges from 0.81 to 0.91 Spearman Correlation coefficient (r) BMI and FPI is 0.504 with p = 0.01 r = −0.337 between BMI and CS, with p = 0.036 | Higher FPI was associated moderately with higher Beighton score (r = 0.44, p = 0.01) Greater lunge angle was associated moderately with higher Beighton score (r = 0.40, p = 0.02) and Lower Limb Assessment Scale score (LLAS) (r = 0.42, p = 0.02) Higher Beighton score was associated strongly with higher LLAS (r = 0.85, p < 0.01) ICC > 0.85 (mean 95 % CI 0.86–0.97) |
| Muscles | n.a. | n.a. | n.a. |
| No of Plantar Sensors | n.a. | n.a. | n.a. |
| Plantar Data Regions | Anterior, mid, and posterior areas of footprint | n.a. | n.a. |
| Hardware Used for Data Collection | static footprint, without toes | Foot biomechanics were analyzed using the FPI. CS was assessed using a plank test with a time-to-failure trial | n.a. |
| No. of Participants | 22 (11 normal, and 11 overweight) | 39 | 30 (20 girls, and 10 boys) |
| Reference | Ref. [22] compares balance and footprint parameters for normal and overweight children | Ref. [23] investigates the effect of the body mass index (BMI) on the foot posture index (FPI) and core stability (CS) in a healthy adult population. | Ref. [25] explores the relationships between foot posture, flexibility, body mass and age in children |
| Results and Accuracy | coefficient of multiple correlation (CMC) is 0.614 for tibia with respect to the floor inter-segment angle CMC = 0.974: hallux with respect to the forefoot plantar/dorsiflexion overall between-trial variability < ±1.0° (for 10 foot parameters), and < ±0.7° (for hindfoot with respect to the tibia and forefoot with respect to the hindfoot) tibia with respect to the floor inter-segment angle between-trial variability was between ±1° and ±2° | Intraclass correlation coefficients (ICC) ranged from 0.020 to 0.964 for between-day reliability ICC ranged from 0.268 to 0.985 for within-session The standard error measurement (SEM) range was between 0.04 to 3.5 and the root mean squared error (deviation) ranged from 0.73 to 16.2 degrees | 12 foot parameters are evaluated - stride-to-stride coefficient of multiple correlation (CMC) > 0.8 (for all 12); - day-to-day CMC > 0.8 (for 6 foot parameters: Tibio-talar-flexion, Medial arch inclination, Forefoot/ankle supination, Forefoot/ankle abduction, MT I–V angle, Hallux flexion) and <0.7 (for the other 6: Medial arch, Lateral arch, Subtalar inversion, Fore-/midfoot supination, Fore-/hindfoot abduction, Hallux abduction) |
| Muscles | n.a. | n.a. | n.a. |
| No of Plantar Sensors | 19 | 29 passive reflective markers 14 mm in diameter, attached directly on the skin | Seventeen 14 mm diameter retro-reflective markers were attached to the skin on each leg |
| Plantar Data Regions | 3 segment foot model (hindfoot, forefoot and hallux) + tibial segment | 4: shank, hindfoot, forefoot and hallux segments | n.a. |
| Hardware Used for Data Collection | n.a. | New Balance neutral cushioning shoe (model 840) with circular holes cut out with a diameter of 2.5–2.7 cm | n.a. |
| No. of Participants | 2 | 12 | 10 (4 males, and 6 females) |
| Reference | Ref. [30] presents the evaluation of foot kinematics during barefoot walking based on a multi-segment foot model (12 foot parameters are evaluated) | Ref. [31] investigates the between-day reliability and within-session variability of the Oxford Foot Model (OFM) while walking in a neutral cushioning shoe | Ref. [34] a protocol for measuring the kinematics of the foot and ankle (12 foot parameters are evaluated) |
| Results and Accuracy | No numerical values available, only graphs | ||
| Muscles | n.a. | ||
| No of Plantar Sensors | 21 six mm retroreflective markers | ||
| Plantar Data Regions | number of foot segments that comprise the foot for each model varies (all 5 models, however, contain equivalent hindfoot, forefoot, and hallux segments) | ||
| Hardware Used for Data Collection | n.a. | ||
| No. of Participants | 10 (6 males, and 4 females) | ||
| Reference | Ref. [35] compares the repeatability and kinematics of five different three-dimensional multi-segmented foot models | ||
| Title 1 | MAV | ZC | SSC | RMS |
|---|---|---|---|---|
| Walking | 0.1–0.2 | 5–10 | 10–20 | 0.1–0.3 |
| Running | 0.2–0.4 | 10–30 | 10–20 | 0.2–0.5 |
| Jumping | 0.5–1 | 10–20 | 15–25 | 0.3–0.6 |
| Rest | <0.1 | >15 | >25 | <0.2 |
| Stance Phase | |||||
| 0–2% | 0–10% | 10–30% | 30–50% | 50–60% | |
| RFSR5,TA | 1 | 1 | 0 | 0 | 0 |
| RFSR4,TA | 0 | 1 | 0 | 0 | 0 |
| RFSR3,TA | 0 | 1 | 0 | 0 | 0 |
| RFSR2,TA | 0 | 0 | 0 | 0 | 0 |
| RFSR1,TA | 0 | 0 | 0 | 0 | 0 |
| RFSR0,TA | 0 | 0 | 0 | 0 | 0 |
| RFSR5,GC | 0 | 0 | 0 | 0 | 0 |
| RFSR4,GC | 0 | 0 | 1 | 0 | 0 |
| RFSR3,GC | 0 | 0 | 1 | 0 | 0 |
| RFSR2,GC | 0 | 0 | 1 | 1 | 0 |
| RFSR1,GC | 0 | 0 | 1 | 1 | 1 |
| RFSR0,GC | 0 | 0 | 0 | 1 | 1 |
| Stance Phase | |||||
|---|---|---|---|---|---|
| 0–2% | 0–10% | 10–30% | 30–50% | 50–60% | |
| RFSR5,TA | 1 | 1 | 0 | 0 | 0 |
| RFSR4,TA | 1 | 1 | 0 | 0 | 0 |
| RFSR3,TA | 0 | 1 | 1 | 0 | 0 |
| RFSR2,TA | 0 | 1 | 1 | 0 | 0 |
| RFSR1,TA | 0 | 1 | 1 | 1 | 0 |
| RFSR0,TA | 0 | 0 | 1 | 1 | 0 |
| RFSR5,GC | 0 | 0 | 1 | 0 | 0 |
| RFSR4,GC | 0 | 0 | 1 | 0 | 0 |
| RFSR3,GC | 0 | 0 | 1 | 0 | 0 |
| RFSR2,GC | 0 | 1 | 1 | 1 | 1 |
| RFSR1,GC | 0 | 0 | 0 | 1 | 1 |
| RFSR0,GC | 0 | 0 | 0 | 1 | 1 |
| (a) | |||||
|---|---|---|---|---|---|
| Stance Phase | |||||
| 0–2% | 0–10% | 10–30% | 30–50% | 50–60% | |
| RFSR5,TA | 1 | 1 | 1 | 1 | 1 |
| RFSR4,TA | 0 | 0 | 1 | 1 | 0 |
| RFSR3,TA | 0 | 0 | 0 | 0 | 0 |
| RFSR2,TA | 0 | 0 | 0 | 0 | 0 |
| RFSR1,TA | 0 | 0 | 0 | 0 | 0 |
| RFSR0,TA | 0 | 0 | 0 | 0 | 0 |
| RFSR5,GC | 0 | 0 | 1 | 1 | 1 |
| RFSR4,GC | 0 | 0 | 1 | 1 | 0 |
| RFSR3,GC | 0 | 0 | 0 | 0 | 0 |
| RFSR2,GC | 0 | 0 | 0 | 0 | 0 |
| RFSR1,GC | 0 | 0 | 0 | 0 | 0 |
| RFSR0,GC | 0 | 0 | 0 | 0 | 0 |
| (b) | |||||
| Stance Phase | |||||
| 0–2% | 0–10% | 10–30% | 30–50% | 50–60% | |
| RFSR5,TA | 0 | 0 | 0 | 0 | 0 |
| RFSR4,TA | 0 | 0 | 0 | 0 | 0 |
| RFSR3,TA | 0 | 0 | 0 | 0 | 0 |
| RFSR2,TA | 0 | 0 | 0 | 1 | 0 |
| RFSR1,TA | 0 | 0 | 0 | 1 | 1 |
| RFSR0,TA | 0 | 0 | 0 | 1 | 1 |
| RFSR5,GC | 0 | 0 | 0 | 0 | 0 |
| RFSR4,GC | 0 | 0 | 0 | 0 | 0 |
| RFSR3,GC | 0 | 0 | 0 | 0 | 0 |
| RFSR2,GC | 0 | 1 | 1 | 0 | 0 |
| RFSR1,GC | 1 | 1 | 1 | 1 | 1 |
| RFSR0,GC | 1 | 1 | 1 | 1 | 1 |
Publisher’s Note: MDPI stays neutral with regard to jurisdictional claims in published maps and institutional affiliations. |
© 2020 by the authors. Licensee MDPI, Basel, Switzerland. This article is an open access article distributed under the terms and conditions of the Creative Commons Attribution (CC BY) license (http://creativecommons.org/licenses/by/4.0/).
Share and Cite
Faragó, P.; Grama, L.; Farago, M.-A.; Hintea, S. A Novel Wearable Foot and Ankle Monitoring System for the Assessment of Gait Biomechanics. Appl. Sci. 2021, 11, 268. https://doi.org/10.3390/app11010268
Faragó P, Grama L, Farago M-A, Hintea S. A Novel Wearable Foot and Ankle Monitoring System for the Assessment of Gait Biomechanics. Applied Sciences. 2021; 11(1):268. https://doi.org/10.3390/app11010268
Chicago/Turabian StyleFaragó, Paul, Lăcrimioara Grama, Monica-Adriana Farago, and Sorin Hintea. 2021. "A Novel Wearable Foot and Ankle Monitoring System for the Assessment of Gait Biomechanics" Applied Sciences 11, no. 1: 268. https://doi.org/10.3390/app11010268