Article

Efficiency Analysis of Manufacturing Line with Industrial Robots and Human Operators

1
Department of Engineering Materials and Biomaterials, Silesian University of Technology, 44-100 Gliwice, Poland
2
Department of Engineering Processes Automation and Integrated Manufacturing Systems, Silesian University of Technology, 44-100 Gliwice, Poland
*
Author to whom correspondence should be addressed.
Appl. Sci. 2020, 10(8), 2862; https://doi.org/10.3390/app10082862
Submission received: 25 March 2020 / Revised: 11 April 2020 / Accepted: 17 April 2020 / Published: 21 April 2020

Abstract

:
The problem of production flow and evaluation of productivity in the manufacturing line is analysed. Machines can be operated by humans or by robots. Since breakdowns and human factors affect the destabilization of the production processes, robots are preferred. The main problem is a proper methodology—how can we determine the real difference in work efficiency between human and robot at the design stage? Therefore, an analysis of the productivity and reliability of the machining line operated by human operators or industrial robots is presented. Some design variants and simulation models in FlexSim have been developed, taking into consideration the availability and reliability of the machines, operators and robots. Traditional productivity metrics, such as the throughput and utilization rate, are not very helpful for identifying the underlying problems and opportunities for productivity improvement in a manufacturing system, therefore we apply the OEE (overall equipment effectiveness) metric to present how the availability and reliability parameters influence the performance of the workstation, in the short and long terms. The implementation results of a real robotic line from industry are presented with the use of the overall factory efficiency (OFE) metric. The analysis may help factories achieve the level of world class manufacturing.

Graphical Abstract

1. Introduction

Nowadays one can observe an increasing use of automation and robotization, which replaces human labour. New applications of industrial robots are used especially for repetitive and high-precision jobs or monotonous tasks requiring physical effort. Modern industrial robots have human-like mobility and can perform various complex activities just like humans. The main advantage of the robot is that it does not get tired like a human.
Some researches show [1] that thanks to robotization, many companies obtained an increase of productivity by 30%, a reduction of the production cost by 50%, and an increase of utilization by more than 85%. However, the implementation of robotization requires high costs, therefore robotization will be profitable only in certain circumstances, including, a high production volume, repetitive and precision tasks with harmful working conditions for people. Such conditions occur, for example, in the automotive industry, where most robots are used [2].
At the early design stage of the manufacturing system, there is a problem of how to determine the real difference in work efficiency between a human and a robot. The aim of the study, which is a continuation of our previous works [3,4,5] is to develop a methodology, which allows to clearly define the productivity growth associated with the replacement of human labour by industrial robots.
Modern manufacturing systems are very complex and difficult to analyse, therefore many methods are used (including mathematical modelling, combinatorial optimization, Petri nets, and scenario analysis) for solving the above mentioned problem [6].
Computer simulation methods, especially discrete event simulation (DES), are the most universal and are widely used [7,8,9,10,11,12,13,14,15,16,17,18,19,20].
There are many DES software tools dedicated to production process simulations, for example ARENA, Enterprise Dynamics, FlexSim, Plant Simulation, SIMIO, Witness and others [21,22]. The main DES advantage is the ability to conduct many simulation experiments in a short time. Some experiments cannot be performed on real manufacturing systems because of existing production processes and the high cost of industrial machinery. The building of a simulation model helps in gaining knowledge that could lead to improvement of the real system [23]. The disadvantage of DES is connected with the randomness of some simulation parameters and, therefore, sometimes it can be hard to distinguish whether an observation is a result of system interrelationships or randomness [23].
The design of complex manufacturing systems requires the integration of various aspects, including manufacturing strategies, system architecture, capacity planning, management techniques, performance evaluation, scenario analysis and risk appraisal [24]. The beginning of the design process of a manufacturing system is conceptual modelling, which involves a problem definition and system limitations. It requires a description of a system representation, i.e., what is going to be modelled and how [12]. During this step, the use of graphical diagrams methods [25], e.g., object flow diagram (OFD) [26], is recommended.
The typical automatic manufacturing systems are suitable mainly for mass production. Therefore, the uncertainty of system components can play an important role, but during the early stages of conceptual design, the ability to predict reliability is very limited [27,28].
The transformation to a flexible and smart robotic system is considered as the next generation of manufacturing development in Industry 4.0 [29]. In some cases, the collaboration of human operators and robots can be possible [30,31,32]. Such a situation requires a very high safety level, but these cobot systems only comply with safety standards if they operate at a reduced speed [33]. Therefore, generally robots are closed in cages in order to ensure separation from humans and enable very high performance.
The main phases of the proposed methodology are presented in Figure 1. It includes: an analysis of the real problem, conceptual design and synthesis of a simulation model, simulation experiments to obtain a solution and implementation of the solution to solve the real problem.
In order to assess the effectiveness of the robot application, we compare production uptime of humans and robots and calculate work efficiency with the use of selected metrics (OEE—overall equipment effectiveness, OFE—overall factory efficiency), which show how well a manufacturing operation is utilized. Next, we use computer simulation in FlexSim for verification of these two models. Finally, the robotic line is implemented, and the comparison of obtained results is presented in the Section 7.

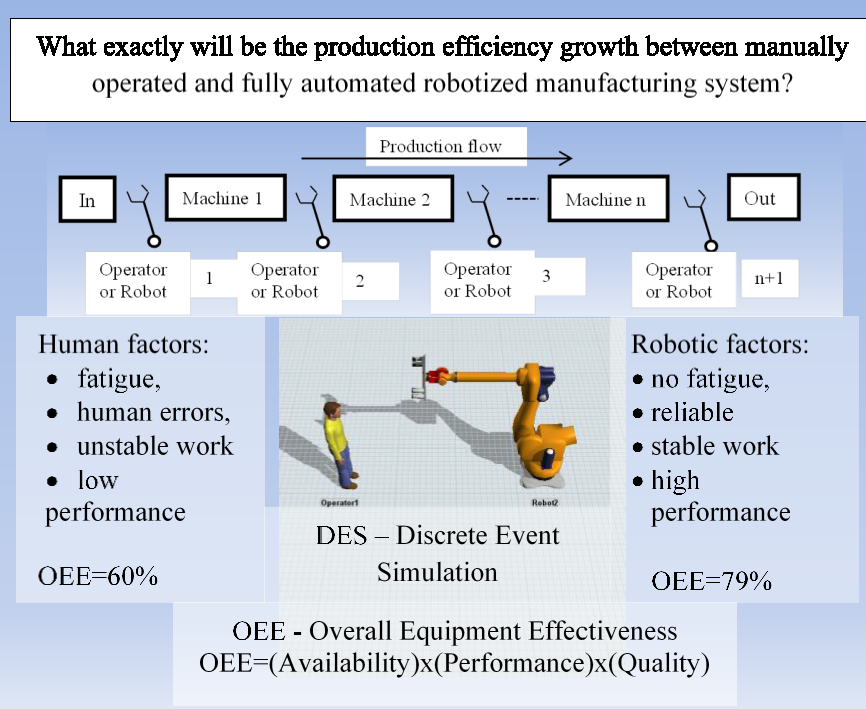
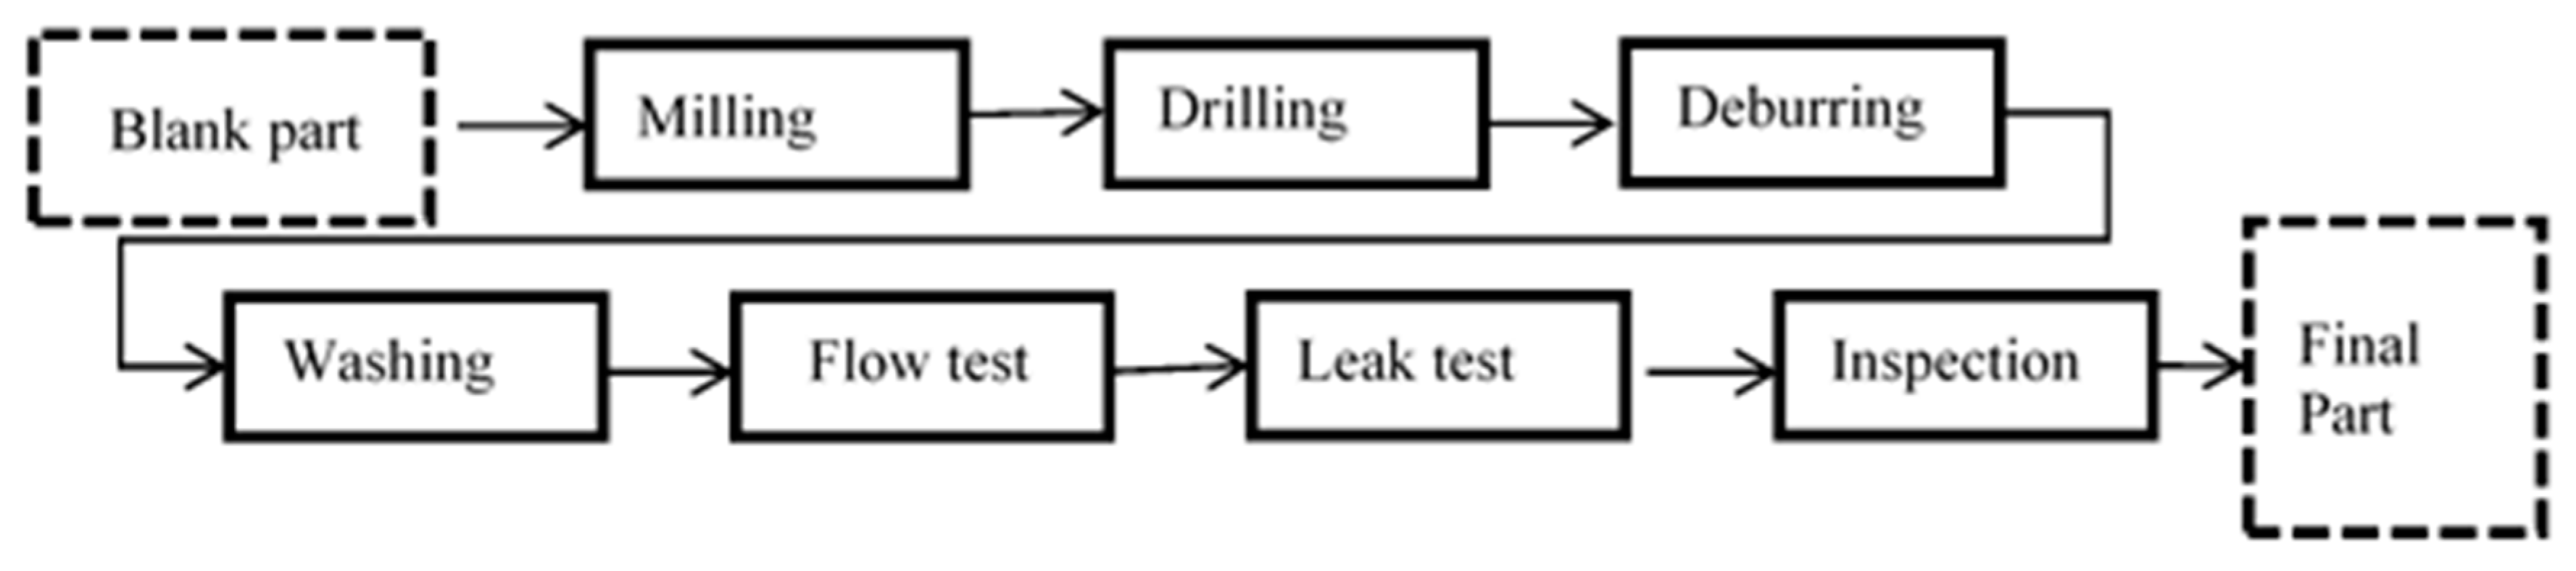
2. Problem Definition—Manufacturing Process of Engine Heads

We take into consideration an example from the automotive industry. The company will build a new manufacturing line for the production of engine heads for motor cars. These parts are made from castings made of aluminium alloy. The manufacturing process of these parts requires many machining operations including precise milling, drilling and deburring. Very high quality is required in order to meet the requirements of the recipient.
The simplified schema of the engine head manufacturing process from the automotive industry is presented in Figure 2.
Production systems can consist of a different number of specialized machines and human operators or robots needed for materials handling.
The schema of the main machining cell is presented in Figure 3. The cell consists of four semi-automatic CNC (Computer Numerical Control) milling machines and needs human operators or robots for material handling. The Air Blow Station is used to remove chips from the part. The operators are also required for product testing and final inspection.
One operator is required for tending four semi-automatic milling machines that are working in parallel in order to obtain greater production volume. Parts from a part family (engine heads) are large and heavy and, therefore, the usage of robots is preferred.
In the stage of conceptual design, some variants of the manufacturing line were taken into consideration, including the manual operation of machines or the robotic operating system. What happens when we replace human operators with industrial robots? What productivity growth is possible to achieve? These questions require consideration of many human and robot factors.

3. Human and Robot Factors Influencing the Production Process

There are many human performance models [34] used for a prediction of human behaviour in a different task, domain, or system. In industrial practice, the human factors are often neglected. For example, in computer software used for production processes simulation the human factor is not sufficiently modelled. Simple mechanistic models of human resources are used, and people are treated as quasi-technical elements of the production system. They should operate in the same way as a machine, but in practice, the human behaviour is unpredictable because of personal individuality and human errors. This can help to explain why simulation models do not correspond with the reality as it would be expected [35]. Therefore, other methods for human and robot modelling are under development including the discrete event simulation (DES) method [36], Petri nets [37], multi-flexible-links modelling [38] or artificial intelligence [34]. The variability of human operators can be modelled by varying the operation times (e.g., as the simulation time increases, these increase).
Robots can make work faster and more regular than human operators, but how fast a robot can work is related to the type of task. In some cases, human workers are very fast because of innate manual skills. On the other hand, the robot must be told exactly what to do.
There are several methods for planning robot movement, described in [39,40]. These methods are based on the well-known MTM (method time measurement) or on the traditional time study concept [41] and can be used for comparing the relative abilities of robots and humans. Dedicated computer software for robot movement planning can be used (ABB Robot Studio, FANUC Roboguide, KUKA SimPro, and others) as well as advanced software for human ergonomic modelling (Human Jack Simulator). The outcome of each technique is a set of time values that can be used to compare human and robot productivity [36].
An employee can work 8 h per day with a break for rest. On the other hand, robots can theoretically work 24 h per day without any breaks, but human supervision of the production process is required. Also, precise planning and scheduling of the robot work are necessary for better performance [18]. From time to time, applying changes of tools and reprogramming also require participation of an operator. Moreover, a robot requires periodic maintenance service and inspection before each automatic run.
Automated and robotized production lines usually work very well, but sometimes problems with failures can occur. A failure of any elements of the manufacturing line can cause some production disturbances or a production stoppage of the whole factory. Therefore, the reliability of the components plays a key role for the productivity and utilization of the manufacturing system [42]. In some cases, a fallible operator can be replaced, but a fallible robot requires repair.
The first type of robots (Unimate), has failure-free uptime equal to MTBF (mean time between failures) = 500 h [40]. The work [43] shows the results of a study on reliability of the next generation of robots in the industrial environment. The reliability of the first robot generation is represented by a typical bathtub curve with high infant mortality rate. The next generation of robots was characterized by exponential distribution with MTBF of about 8000 h. Nowadays, robot manufacturers declare an average of MTBF = 50,000 ÷ 60,000 h or 20 ÷ 100 million cycles of work [2]. However, robot equipment is often custom made and may, therefore, be more unreliable than the robot itself.
Some conclusions from a survey about industrial robots conducted in Canada are as follows [44]:
  • Over 50% of companies keep records of the robot reliability and safety data;
  • In robotic systems, major sources of failure are software failure, human error and circuit board troubles from the users’ point of view;
  • The most common range of the experienced MTBF is 500–1000 h;
  • Most of the companies need about 1–8 h for the repair of their robots.
Based on the literature analysis [30,31,32,33,34,35,36,37,38,39,40,41,42,43,44], the main human and robot factors influencing the production process that should be taken into account are presented in Table 1.
In reference [1], the approximate efficiency of robotic application versus manual application was compared. The efficiency of manual machine tending was about 40%–60% and, for robotic machine, tending was about 90% (without set-up). However, detailed values are dependent on the characteristics of the real workstation.
The most decisive factor for industry is the economic cost of production. Implementations of robotic workstations require very high investment cost. It can bring greater work efficiency and savings in labour costs, especially if one robot can replace several human workers.

4. Work Efficiency and Productivity Evaluation

There are some key performance indicators that can be used to evaluate the efficiency of production systems [45,46]:
  • Production throughput;
  • Manufacturing lead-time (MLT);
  • Work in progress (WIP);
  • Queue length;
  • Mean tardiness and the rate of tardy parts (relative to the number of parts produced on-time);
  • Quality of the products;
  • Utilization of equipment, which can be described with different metrics including:
    OEE—overall equipment effectiveness;
    OFE—overall factory effectiveness.
In order to compare the manufacturing systems before and after robotization, we take the OEE factors into consideration. The OEE metric depends on three factors: availability, performance and quality [45,47].
OEE = (Availability)x(Performance)x(Quality)
Availability is the ratio of the real time spent on the realization of a task (without failure time) to the scheduled time. Availability is reduced by disruptions at work and machine failures.
A v a i l a b i l i t y = a v a i l a b l e   w o r k   t i m e f a i l u r e   t i m e s c h e d u l e d   t i m e
Performance can be described as the ratio of the time to complete a task under ideal conditions compared to the realization in real conditions or the ratio of the products obtained in reality, to the number of products it is possible to obtain under ideal conditions. Performance is often reduced (loss of working speed) by the occurrence of any disturbances, e.g., inter-operational breaks have a great impact on materials flow [48].
P e r f o r m a n c e = i d e a l   c y c l e   t i m e r e a l   c y c l e   t i m e = r e a l   n u m b e r   o f   p r o d u c t s i d e a l   n u m b e r   o f   p r o d u c t s
Quality can be expressed by the ratio of the number of the good quality products and the total number of products (including products with insufficient quality).
Q u a l i t y = n u m b e r   o f   g o o d   q u a l i t y   p r o d u c t s t o t a l   n u m b e r   o f   p r o d u c t s
The obtained number of good quality products is a random variable, which can be described by a normal distribution with standard deviation. Quality levels are determined by ranges of the standard deviation as in the Six Sigma method. The quality level of manual production is typically lower than in automated production systems. The quality level can change, depending on the different shifts of manual labour (e.g., different employee qualifications, worst quality in the night shift).

Availability and Failures

The concept of machine availability is related to planned uptime and unplanned events e.g., the random machine failures. Any unplanned event can make the machine unavailable and cause a decrease in work efficiency.
The reliability of objects such as machines or robots is defined as the probability that they will work correctly for a given time under defined working conditions. In practice, for description of reliability, in most cases the parameter MTTF (mean time to failure) is used, which is the expected value of the exponentially distributed random variable with the failure rate λ [49].
M T T F = 0 t   f ( t ) d t = 0 t   λ   e λ x   d x = 1 λ
In In the case of repairable objects, the parameters MTBF (mean time between failures), and the MTTR (mean time to repair) can be used.
MTBF = MTTF + MTTR
Because machinery failures may cause severe disturbances in production processes, the availability of means of production plays an important role. The inherent availability can be calculated with Formula (7).
A v a i l a b i l i t y = M T B F M T B F + M T T R
In an industrial environment, machine failures are mostly random and difficult to predict; therefore, we have used a computer simulation for further research. The computer simulation of production processes is used very often, but the computer models are somewhat simplified and focus only on certain aspects. Therefore, we prefer to build more sophisticated models that include the OEE factors and human and robot parameters.
The literature review [46] indicates that OEE metrics is lacking in complex manufacturing systems on the factory level. In order to address this gap, an OFE metric can be used. It can measure factory-level performance and can also be used for performing factory-level diagnostics such as bottleneck detection and identifying hidden capacity Any factory layout can be modelled using a combination of the predefined subsystems (serial, parallel), which allow determination of the OFE.
Note that the OEE equation can be further simplified as [46]:
O E E = A c t u a l   t h r o u g h p u t   ( u n i t s )   f r o m   e q u i p m e n t   i n   t o t a l   t i m e T h e o r e t i c a l   t h r o u g h p u t   ( u n i t s )   f r o m   e q u i p m e n t   i n   t o t a l   t i m e
By extending this definition to the factory level, we have OFE [41]:
O F E = A c t u a l   t h r o u g h p u t   ( u n i t s )   f r o m   f a c t o r y   i n   t o t a l   t i m e T h e o r e t i c a l   t h r o u g h p u t   ( u n i t s )   f r o m   f a c t o r y   i n   t o t a l   t i m e
The OFE is a generalization of OEE for a multi-machine system and it is limited by the throughput of the bottleneck.

5. Example—Simulation Models

In order to analyse the presented problem, we have used the FlexSim software, which allows computer-modelling and simulation of discrete production processes with the use of human re-sources as well as robots.
In the stage of conceptual design of the manufacturing system, some scenarios were considered, and computer models of lines operated by human operators or robots have been developed (Supplementary Materials), taking into account the planned breaks at work, failure rates, handling and quality parameters.
In the first stage a simplified reference model, that only included machinery workstations (with necessary connections, input and output elements) was created (Figure 4). It represented the production flow in ideal conditions. To achieve greater production volume, two machining cells with a total of 8 milling machines were introduced.
In the next phase a transport system with conveyors was included into model. Different scenarios were considered, including manual handling and some levels of automation and use of different number of industrial robots. The main two variants were, a human operated line (Figure 5) with 6 operators and robotic line with 3 robots and 1 human operator on the inspection station (Figure 6).
Processing parameters were assumed based on MTM and time study of similar processes, including:
  • Milling process mean time = 450 s;
  • Milling machine setup per part = 30 s;
  • Drilling = 30 s;
  • Automatic deburring = 30 s;
  • Hand deburring = 40–50 s;
  • Washing = 180 s (capacity 10 parts);
  • Flow test = 60 s;
  • Leak test = 60 s;
  • Inspection = 50 s;
  • Load/unload time of human operator = 20–30 s;
  • Load/unload time of robot = 5 s;
  • Conveyor speed = 1 m/s;
  • Quality level: 99% for human operated line, 99.9 % for robot-operated line.

6. Simulation Experiments

In order to test the productivity and stability of the models of the manufacturing line, some simulation experiments were performed. The simulation scenario includes work in three shifts per day, 48 weeks per year (5760 h). Because of the change of production plans of some parts from the parts family and tools wear, a complete changeover of machine equipment is required once a week. Therefore, the simulation scenario includes one whole shift for machine changeover and preparing the line for production for 5 working days (simulation of 120 h with 8 h warm-up). After 5 days of work, the line is completely stopped for a weekend and in the next week a new warmup is required. Available work time is reduced by cleaning and calibration of the machines (15 min per shift) and a rest pause for the operators (15 min per shift) and is equal to 465 min per shift for the robotic line, and 450 min for the human-operated line.
The results from the first part of the experiments are presented in the Table 2.
The value of the production limit (PL) describes the production volume that can be obtained in a given time under ideal conditions. The average production Pavg is the production of good quality products obtained from simulation experiments. Since the model was built based on the OEE components and contains parameters of availability, performance and quality, then according to Equation (9), the production value from the simulation can be directly used to calculate the OFE metric.
O F E = A v e r a g e   p r o d u c t i o n   P r o d u c t i o n   l i m i t
Reliability and failures can have a significant effect on the productivity, therefore the second part of the simulation experiment was performed with the reliability of human operators and robots included. Reliability of machines was not considered because it will be the same in both examples. Assuming human unreliability on the basis of HEART (human error assessment and reduction technique) for “routine and highly practiced rapid tasks involving a relatively low level of skill”, the nominal value of a human error equals 0.01 [50]. Therefore, the human error rate in this case can be described by parameters: MTBFh = 8 h and MTTRh = 5 min. Robot reliability was assumed based on data from industry survey [4] including MTBFr = 1000 h and MTBFr = 8 h. It was assumed that sick and absent operators can be replaced, but fallible robots require repairing. The results from the second part of experiments are presented in Table 3. The scenario parameters include: 8 hours warmup per week, human MTBFh = 8 h and MTTRh = 5 min, robot MTBFr = 1000 h and MTTRr = 8 h, (with exponential distribution).
Results obtained show a much greater production value for the robotic line (about 30% more) compared to the human operated line. The summarized effect of failures is very small but significant. The comparison of the results is presented in Table 4. There is an average difference Δavg of about 0.2% for human operators (ΔOFEh with only short time failures) and about 0.8% for robots (ΔOFEr with long time failures).
Compared to the model of the manually operated line, the model of robotic line with failures shows some differences in the recurrence of replications (box and whisker plot Figure 7).
There are some outliers (the most extreme observations) represented by the minimum values of production that are related with a few random robot failures. On the other hand, the human errors occur very often and almost regularly, and therefore normal distribution can be observed in this case.

7. Industrial Implementation of Robotic Line—Case Study

The results of simulation experiments were taken into account during an economic analysis of the designed manufacturing line (unfortunately economic data are unavailable) and helped when taking a decision to build the robotic line.
  • Industrial implementation of robotic line had required the following steps:
  • Detailed design of manufacturing line and required equipment;
  • Purchase of machines and robots;
  • Installation of machines and robots;
  • Personnel training;
  • Machine and robot programming and testing;
  • Material delivery and product distribution contracting.
About 2 years after taking the decision, the real robotic line was implemented in Poland and started a production. The manufacturing line with 3 ABB robots for product handling is presented in Figure 8. There are also two human operators for final product inspection and one duty operator for monitoring of the production process.
The manufacturing line is now working very well, but there were some technical and organizational problems including:
  • Material delivery delays;
  • Equipment failures (mainly milling machines, the drilling machine and washing station);
  • Power supply disturbances;
  • Lower working speed;
  • Insufficient quality.
The three industrial robots from ABB are working very well by now, without failures. There were only small problems with robot grippers at the beginning of the production process.
The results obtained show some differences between OFE components in the model and in the real line, that are presented in the Table 5. The currently planned OFE factors contain some changes in the production process, including robot programs, time of loading and unloading the milling machines. In reality, OFE factors obtained are fluctuating due to random failures and disturbances and were lower than planned.
The main reasons for OFE fluctuation were some technical problems in the first months and the delay of delivery from supplier (Foundry) in the eighth and eleventh months and also the low quality of some casting series. Failures of machines take lower effect, because the main milling machines are working in parallel and in typical cases of failure, only one machine is stopped, and the other machines can work further.
The monthly results from the year 2018 are presented in the Table 6.
It turned out that the most critical machine is the washing station, because it can block the whole manufacturing line with a bottleneck effect. The quality varies over time and the insufficient quality products were in the range of 0.17 ÷ 0.59% (average = 0.38%). The average yearly quality index is equal to 0.9962, which is very near to the planned value. The production quality has the highest priority and is continuously improved, therefore every products are being tested.
The results obtained are worse than planned but still, there are some places for further improvement of availability and performance in order to achieve WCM (world class manufacturing) productivity. Availability depends on planned and unplanned breaks at work and delivery delays. Performance score depends on robot speed and machine tending time compared to process cycle time. Quality depends on stability of the manufacturing process parameters.
Industrial practice shows that improvement of manufacturing systems with the use of industrial robots is difficult because of some technical problems that may occur, (mainly including robot equipment like grippers) but the results of replacement of human operators with industrial robots can bring great production growth.
In the further research the problems of human–robot collaboration and smart robotics in the context of Industry 4.0 will be taken into account.

8. Conclusions

As was expected, the simulation experiments confirm the advantage of applying an automated manufacturing line, as compared to a manually operated one. This can be seen in particular in the case of work in three shifts for a long period of time. Because the models were build based on OEE components, therefore similar manufacturing systems can be directly compared. The productivity of a manufacturing line operated by a robot has improved by about 30%, compared to a manually operated line. Also, the reliability of human operators and robots plays a significant role. The computer simulation of the detailed model of production line with machines, operators and robots with reliability parameters allows for better representation and understanding of a real production process which is important for early design and enables front-end planning.
However, in other cases of tending machine tools, the difference between human operators and robots may not be clear to see. Therefore, the economic factors related to robot and labour costs also play an important role, because high investment costs are a major deterrent to robotization.
Results obtained with the proposed method can be used for designing a similar robotic workcell and economic analysis regarding labour costs and costs associated with the investments in robotization. The use of OEE factors allows for comparing results from other manufacturing systems. The reality is that most manufacturing companies have OEE scores closer to 60%, but there are many companies with OEE scores lower than 50%, and a small number of best-in-class companies that have OEE scores higher than 70% [51].
The proposed method can be also used for developing a digital twin of a manufacturing system for the purpose of Industry 4.0.

Supplementary Materials

The following are available online at https://www.mdpi.com/2076-3417/10/8/2862/s1.

Author Contributions

Conceptualization, A.K. and P.B.; methodology, A.K. and G.G.; modelling, A.K.; validation, G.G.; formal analysis, G.G.; investigation, A.K.; data acquisition, P.B.; writing—original draft preparation, A.K.; writing—review and editing, A.K.; All authors have read and agreed to the published version of the manuscript.

Funding

This research received no external funding.

Conflicts of Interest

The authors declare no conflict of interest.

References

  1. Glaser, A. Industrial Robots; Industrial Press: New York, NY, USA, 2009. [Google Scholar]
  2. Hägele, M.; Nilsson, K.; Pires, J.N. Industrial Robotics. In Springer Handbook of Robotics; Springer: Berlin/Heidelberg, Germany, 2008. [Google Scholar]
  3. Barosz, P.; Gołda, G.; Kampa, A. The Conceptual Design of Flexible Manufacturing System with the Use of Computer Simulation in Enterprise Dynamics. J. Res. Adm. Sci. 2018, 7, 1–6. Available online: http://www.jraspublications.org/index.php/JRAS/article/view/22 (accessed on 20 April 2019).
  4. Kampa, A.; Gołda, G.; Paprocka, I. Discrete event simulation method as a tool for improvement of manufacturing systems. Computers 2017, 6, 10. [Google Scholar] [CrossRef]
  5. Gołda, G.; Kampa, A.; Krenczyk, D. The methodology of modeling and simulation of human resources and industrial robots in FlexSim. In FlexSim in Academe: Teaching and Research; Pawlewski, P., Hoffa-Dabrowska, P., Golinska-Dawson, P., Werner-Lewandowska, K., Eds.; Springer: Berlin/Heidelberg, Germany, 2019; pp. 87–99. [Google Scholar] [CrossRef]
  6. Tulio, T. Design of Flexible Production Systems: Methodologies and Tools; Springer: Berlin/Heidelberg, Germany, 2008. [Google Scholar]
  7. Banks, J.; Carson, J.S.; Nelson, B.L.; Nicol, D. Discrete-Event System Simulation, 5th ed.; Prentice Hall: Upper Saddle River, NJ, USA; New York, NY, USA, 2010. [Google Scholar]
  8. Renna, P.; Mancusi, V. Controllable processing time policy in job shop manufacturing systems: Design and evaluation by simulation modelling. Int. J. Serv. Oper. Manag. 2017, 27, 366. [Google Scholar] [CrossRef]
  9. Renna, P.; Ambrico, M. Evaluation of cellular manufacturing configurations in dynamic conditions using simulation. International J. Adv. Manuf. Technol. 2011, 56, 1235–1251. [Google Scholar] [CrossRef]
  10. Ingemansson, A.; Bolmsjo, G.S. Improved efficiency with production disturbance reduction in manufacturing systems based on discrete-event simulation. J. Manuf. Technol. Manag. 2004, 15, 267–279. [Google Scholar] [CrossRef]
  11. Burduk, A. Stability Analysis of the Production System Using Simulation Models. In Process Simulation and Optimization in Sustainable Logistics and Manufacturing; Springer: Berlin/Heidelberg, Germany, 2014; pp. 69–83. [Google Scholar]
  12. Robinson, S. Conceptual modelling for simulation part I: Definition and requirements. J. Oper. Res. Soc. 2008, 59, 278–290. [Google Scholar] [CrossRef] [Green Version]
  13. Jia, Y.; Tian, H.; Chen, C.; Wang, L. Predicting the availability of production lines by combining simulation and surrogate model. Adv. Prod. Eng. Manag. 2017, 12, 285–295. [Google Scholar] [CrossRef] [Green Version]
  14. Yang, S.; Arndt, T.; Lanza, G. A Flexible Simulation Support for Production Planning and Control in Small and Medium Enterprises. Procedia CIRP 2016, 56, 389–394. [Google Scholar] [CrossRef] [Green Version]
  15. Kasemset, C.; Kachitvichyanukul, V. Simulation-Based Procedure for Bottleneck Identification. In AsiaSim 2007. Communications in Computer and Information Science; Park, J.W., Kim, T.G., Kim, Y.B., Eds.; Springer: Berlin/Heidelberg, Germany, 2007; Volume 5. [Google Scholar]
  16. Plaia, A.; Lombardo, A.; Lo Nigro, G. Robust Design of Automated Guided Vehicles System in an FMS. In Advanced Manufacturing Systems and Technology; Kuljanic, E., Ed.; Springer: Vienna, Austria, 1996; pp. 259–266. [Google Scholar]
  17. Azadivar, F.; Wang, J. Facility layout optimization using simulation and genetic algorithms. Int. J. Prod. Res. 2000, 38, 4369–4383. [Google Scholar] [CrossRef]
  18. Kampa, A. Planning and scheduling of work in robotic manufacturing systems with flexible production. J. Mach. Eng. 2012, 12, 34–44. [Google Scholar]
  19. Krenczyk, D.; Davidrajuh, R.; Skolud, B. Comparing Two Methodologies for Modeling and Simulation of Discrete-Event Based Automated Warehouses Systems. In Advances in Manufacturing II. Lecture Notes in Mechanical Engineering; Hamrol, A., Kujawińska, A., Barraza, M., Eds.; Springer: Berlin/Heidelberg, Germany, 2019. [Google Scholar] [CrossRef]
  20. Zamora-Antuñano, M.A.; Cruz-Salinas, J.; Rodríguez-Reséndiz, J.; González-Gutiérrez, C.A.; Méndez-Lozano, N.; Paredes-García, W.J.; Altamirano-Corro, J.A.; Gaytán-Díaz, J.A. Statistical Analysis and Data Envelopment Analysis to Improve the Efficiency of Manufacturing Process of Electrical Conductors. Appl. Sci. 2019, 9, 3965. [Google Scholar] [CrossRef] [Green Version]
  21. Beaverstock, M.; Greenwood, A.; Lavery, E.; Nordgren, W. Applied Simulation: Modeling and Analysis Using FlexSim; FlexSim Software Products Inc.: Orem, UT, USA, 2012. [Google Scholar]
  22. Gola, A.; Wiechetek, Ł. Modelling and simulation of production flow in job-shop production system with enterprise dynamics software. Appl. Comput. Sci. 2017, 13, 87–97. [Google Scholar]
  23. Sharma, P. Discrete-Event Simulation. Int. J. Sci. Technol. Res. 2015, 4, 136–140. [Google Scholar]
  24. Chryssolouris, G. Manufacturing Systems—Theory and Practice; Springer: New York, NY, USA, 2005. [Google Scholar]
  25. Kamble, P.G.; Hebbal, S.S. An Overview of Manufacturing Enterprise Modeling and Applications for CIM Environment. Contemp. Eng. Sci. 2010, 3, 201–214. [Google Scholar]
  26. Greenwood, A.; Pawlewski, P.; Bocewicz, G. A conceptual design tool to facilitate simulation model development: Object flow diagram. In Proceedings of the 2013 Winter Simulation Conference, Washington, DC, USA, 8–11 December 2013; pp. 1292–1303. [Google Scholar]
  27. Veisi, B.; Farughi, H.; Raissi, S. Two-Machine Robotic Cell Sequencing under Different Uncertainties. Int. J. Simul. Model. 2018, 17, 284–294. [Google Scholar] [CrossRef]
  28. Ormon, S.W.; Cassady, C.R.; Greenwood, A.G. Reliability prediction models to support conceptual design. Reliab. IEEE Trans. 2002, 51, 151–157. [Google Scholar] [CrossRef]
  29. Tran, N.-H.; Park, H.-S.; Nguyen, Q.-V.; Hoang, T.-D. Development of a Smart Cyber-Physical Manufacturing System in the Industry 4.0 Context. Appl. Sci. 2019, 9, 3325. [Google Scholar] [CrossRef] [Green Version]
  30. Matheson, E.; Minto, R.; Zampieri, E.G.G.; Faccio, M.; Rosati, G. Human-robot collaboration in manufacturing applications: A review. Robotics 2019, 8, 100. [Google Scholar] [CrossRef] [Green Version]
  31. Bogue, R. Robots that interact with humans: A review of safety technologies and standards. Ind. Robot 2017, 44, 395–400. [Google Scholar] [CrossRef]
  32. Hietanen, A.; Latokartano, J.; Pieters, R.; Lanz, M.; Kamarainen, J.-K. AR-based interaction for human-robot collaborative manufacturing. Robot. Comput. -Integr. Manuf. 2020, 63, 101891. [Google Scholar] [CrossRef]
  33. Long, P.; Chevallereauo, C.; Chablat, D.; Girin, A. An industrial security system for human-robot coexistence. Ind. Robot 2018, 45, 220–226. [Google Scholar] [CrossRef] [Green Version]
  34. Harriott, C.E.; Adams, J.A. Modeling Human Performance for Human–Robot Systems. Rev. Hum. Factors Ergon. 2013, 9, 94–130. Available online: http://rev.sagepub.com/content/9/1/94 (accessed on 20 November 2019). [CrossRef]
  35. Baines, T.; Mason, S.; Siebers, P.O.; Ladbrook, J. Humans: The missing link in manufacturing simulation? Simul. Model. Pract. Theory 2004, 12, 515–526. [Google Scholar] [CrossRef] [Green Version]
  36. Gołda, G.; Kampa, A.; Paprocka, I. Analysis of Human Operators and Industrial Robots Performance and Reliability. MPER 2018, 9, 24–33. [Google Scholar]
  37. Davidrajuh, R. Modeling Humanoid Robot as a Discrete Event System A Modular Approach based on Petri Nets. In Proceedings of the 2015 3rd International Conference on Artificial Intelligence, Modelling and Simulation (AIMS), Kota Kinabalu, Malaysia, 2–4 December 2015; pp. 277–282. [Google Scholar] [CrossRef]
  38. Huang, X.-Q.; Tang, X.-T.; Chen, L. Simulation for trajectory tracking of multi-flexible-link space robot with deadzone. Int. J. Simul. Model. 2018, 17, 677–689. [Google Scholar] [CrossRef]
  39. Genaidy, A.M.; Gupta, T. Robot and human performance evaluation. In Human—Robot Interaction; Rahimi, M., Karwowski, W., Eds.; Taylor & Francis: London, UK, 1992; pp. 4–15. [Google Scholar]
  40. Nof, S.Y. Handbook of Industrial Robotics; John Wiley & Sons: New York, NY, USA, 1999. [Google Scholar]
  41. Groover, M.P. Work Systems: The Methods, Measurement and Management of Work; Prentice Hall: Upper Saddle River, NJ, USA, 2007. [Google Scholar]
  42. Kampa, A. The review of reliability factors related to industrial robots. Robot. & Autom. Eng. J. (RAEJ) 2018, 3, 1–5. Available online: https://juniperpublishers.com/raej/RAEJ.MS.ID.555624.php (accessed on 20 February 2020).
  43. Sakai, H.; Amasaka, K. The robot reliability design and improvement method and the advanced Toyota production system. Ind. Robot 2007, 34, 310–316. [Google Scholar] [CrossRef]
  44. Dhillon, B.S.; Aleem, M.A. A report on robot reliability and safety in Canada: A survey of robot users. J. Qual. Maint. Eng. 2000, 6, 61–74. [Google Scholar] [CrossRef]
  45. Hansen, R.C. Overall Equipment Effectiveness; Industrial Press: New York, NY, USA, 2005. [Google Scholar]
  46. Muthiah, K.M.N.; Huang, S.H. A review of literature on manufacturing systems productivity measurement and improvement. Int. J. Ind. Syst. Eng. 2006, 1, 461–484. [Google Scholar] [CrossRef] [Green Version]
  47. Ghafoorpoor Yazdi, P.; Azizi, A.; Hashemipour, M. An Empirical Investigation of the Relationship between Overall Equipment Efficiency (OEE) and Manufacturing Sustainability in Industry 4.0 with Time Study Approach. Sustainability 2018, 10, 3031. [Google Scholar] [CrossRef] [Green Version]
  48. Gołda, G.; Kampa, A.; Foit, K. Study of inter-operational breaks impact on materials flow in flexible manufacturing system. IOP Conf. Ser. Mater. Sci. Eng. 2018, 1–6. [Google Scholar] [CrossRef]
  49. Smith, D.J. Reliability, Maintainability and Risk. Practical Methods for Engineers; Elsevier: Oxford, UK, 2005. [Google Scholar]
  50. Woods, D.D. Modeling and predicting human error. In Human Performance Models for Computer-Aided Engineering; Elkind, J., Card, S., Hochberg, J., Huey, B., Eds.; Academic Press: Cambridge, MA, USA, 1990; pp. 248–274. [Google Scholar]
  51. Sage Clarity. 2018 OEE Benchmark Study. Available online: https://sageclarity.com/articles-oee-benchmark-study/ (accessed on 26 May 2019).
Figure 1. The main phases of proposed methodology [5].
Applsci 10 02862 g001
Figure 2. Engine head production process.
Applsci 10 02862 g002
Figure 3. The schema of the main machining cell.
Applsci 10 02862 g003
Figure 4. Reference model of the manufacturing line (Supplementary Materials).
Applsci 10 02862 g004
Figure 5. Model of human operated line.
Applsci 10 02862 g005
Figure 6. Model of robotic line.
Applsci 10 02862 g006
Figure 7. The trend of average production value [pieces/hour] for (a) manually operated line with failures, (b) robotic line with failures (20 samples, confidence level 90%).
Applsci 10 02862 g007
Figure 8. Robotized manufacturing line (a) main machining cell, (b) testing station.
Applsci 10 02862 g008
Table 1. Human and robot factors in the production process.
Human FactorRobot Factor
Work parametersUnstable, slow work, fatigueStable, fast work
Adaptation for new taskFast adaptationSlow programming
Flexibility, working areaLarge flexibility, large operating rangeLower flexibility, limited range
Errors and failuresHigh human errors rateLow failures rate
Replacement and repairCan be replacedRequire repairing
Labour costHighLow
Investment cost for human/robot workstationLowHigh
Table 2. Results of simulation experiments—average production value Pavg for 20 simulation runs with a confidence level at 90% (8-hour warm-up per week).
Simulation Time [h]Prod. Limit PL [Pcs.]Human Operated LineRobotic Line
Average Production Pavg [Pcs.]Std. dev.OFEAverage Production
Pavg [Pcs.]
Std. dev.OFE
241536664.68.40.432682867.11.050.56451
4830721656.210.10.5391282165.11.290.70478
12076804624.114.90.6020966062.72.230.78941
48030,72018,51718.30.60276724,2433.70.78916
2880184,320110,73989.00.600798145,4376.80.78904
5760368,640222,1461150.60261290,85621.20.78899
Table 3. Results of simulation experiments with human and robot failures—average production value Pavg for 20 simulation runs with a confidence level at 90%.
Simulation Time [h]Production Limit PL [Pcs.]Human Operated LineRobotic Line
Average Production Pavg [Pcs.]Std. dev.OFEAverage Production Pavg [Pcs.]Std. dev.OFE
241536660.34.90.429883855340.556641
4830721647.810.40.5363932145560.698242
12076804605.314.60.59964859742110.777865
48030,72018,453360.60068424,0453110.782715
2880184,320110,537840.599702144,1167480.781879
5760368,640221,1561340.599924287,85210010.780849
Table 4. The comparison of difference Δ between OFE for different scenarios.
Simulation244812048028805760Δavg
ΔOFEh0.0027990.0027350.0024480.0020830.0010960.0026860.002308
ΔOFEr0.0078690.0065380.0115450.0064450.0071610.0081410.00795
Table 5. OFE components comparison—model assumption and real robotic line.
Model–Robotic Line (without Failures)Real Line (Planned–without Failures)Real Line
(12 Months Average–with Failures)
Availability0.90420.90420.8824
Performance0.87390.88560.8856
Quality0.99900.99900.9962
OFE0.78940.80000.7785
Table 6. Planned and practical OFE values of robotic line (I-XII 2018).
2018IIIIIIIVVVI
Planned OFE80%80%80%80%80%80%
Obtained OFE77.30%81.70%77.30%82.72%78.82%80.00%
2018VIIVIIIIXXXIXIIAvg.
Planned OFE80%80%80%80%80%80%80%
Obtained OFE76.05%73.29%78.00%77.01%75.68%76.35%77.85%

