1. Introduction
Chalcogenide glasses (ChGs) are known for their transmittance across the infrared (IR), which makes them desirable in the field of opto-electronics and photonics. However, due to weak chemical bonding between constituent metals and the chalcogens, ChGs typically suffer from inherently low mechanical and poor thermal properties [
1,
2,
3,
4]. There is a strong motivation to increase the mechanical strength and chemical robustness of ChGs, while still maintaining transparency in the IR. However, only a handful of studies have been made based solely on this motivation. [
5,
6,
7].
Glass ceramics (GCs) on the other hand are composed of crystalline phase(s) in an amorphous matrix and have been shown as multi-phase media that exhibit mechanical properties often better than the base glass alone. The crystalline phases can be introduced in the glass by direct doping of a nucleating agent (heterogeneous nucleation) or nucleated and grown through controlled thermal treatment via a homogeneous nucleation process. Oxide-based GCs have seen integration in a wide range of applications ranging from biomedical and dental applications to use in large mirrors for space applications [
8,
9]. GCs based on non-oxide media are less common but a review on these [
10] highlights many of these recent efforts.
The classical formation route for a GC typically starts with an amorphous parent glass matrix and the introduction of a secondary phase into the parent amorphous matrix. This processing route is common across materials for use in optical and non-optical applications and has been shown to not only improve the mechanical properties [
11] but also impact the refractive indices, and in some instances, the coefficient of thermal expansion, and electrical, magnetic and non-linear optical properties [
11,
12,
13]. In applications where the resulting GC must be transparent in the spectral region of use, the induced crystal phase(s) must have low optical loss (absorption and scatter loss). Such optical GCs can be used for passive or active optical components if the crystallite is cubic and are small with respect to the wavelength of use, possessing a narrow size distribution to minimize scattering.
The controlled crystallization of ChGs is an important prerequisite in the development of IR transparent GCs with improved mechanical properties. Since a comprehensive mathematical theory correlating all the factors responsible for controlled crystallization in non-oxide glasses does not yet exist, studies to date have largely been empirical and related to the effectiveness of the precipitated crystalline phase at retarding or eliminating crack initiation and/or subsequent crack propagation. Studied to a much greater extent in oxides, the role of composition and morphology of the parent chalcogenide glass medium has not previously been correlated to our knowledge with a resulting mechanical property change when subjected to a comparable thermal heat-treatment protocol.
Several experimental factors e.g., base glass morphology, nucleating agent (for heterogenous nucleation), and heat-treatment temperatures need to be considered when engineering a GC with enhanced mechanical properties, such that the resulting multi-phase medium retains its optical properties. During cooling from the crystallization temperature to room temperature, residual stresses can arise due to the change in thermal expansion between the crystalline and glassy phase [
14], degrading the optical properties or if large enough, adversely impacting the goal of strengthening. In the process of controlled crystallization, the individual residual stresses and the type of crystal lattice, as well as its size, can define the extent of strengthening observed in the GC [
15]. By maintaining a ‘neutral’ residual stress during the controlled crystallization, the change in the mechanical properties can be assumed to be attributable predominantly to the composition, microstructure, and volume fraction of the secondary phase [
15]. Here, one assumes that in the case of homogeneous nucleation, the precipitating phase results from crystallization of the parent matrix, thus forming a new crystallite with constituents now depleted (in full or part) from the parent glass. The presence of this secondary crystalline phase in the amorphous glass matrix can increase the load required for crack initiation and subsequent crack propagation. Therefore, by controlling the size and size distribution of the secondary phase to ~1/10
th the wavelength of light within the optical application domain, GCs can be used as an optical component with enhanced mechanical and in select cases, thermo-mechanical properties [
16,
17,
18].
For optical GCs, the attributes of the secondary phase(s) must meet more stringent criteria. Specifically, for optically transparent composites, the refractive index (RI) mismatch between the glass and crystal should be small, to minimize scatter loss. In an ideal case, a homogenous optical GC with subwavelength crystallites would promote transparency as well as enhanced mechanical strength. In special cases, selective crystallization of the high refractive index crystals in a lower index glass can result in a matrix with an effective refractive index greater than its precursor, and if this distribution can be spatially varied, a gradient in the index can be realized. Here, the formation of the secondary crystalline phase can be controlled and spatially varied via exposure to high intensity laser writing [
19,
20,
21]. Hence, in order to produce an optical GC that still transmits in the desirable spectral region, the induced crystals must be uniform in chemistry, narrow in distribution and sub-wavelength in size [
22].
The main limitation in realizing a greater number of candidate glass families suitable for controlled crystallization is poor glass-forming ability and the change in optical properties when a nucleating agent is introduced [
4]. The addition of nucleating agents has been shown to result in undesirable effects such as phase separation, spontaneous crystallization of the entire glass upon cooling, as well as reduced crystal growth control [
23]. Some groups have investigated the formation of GCs in ChGs to increase mechanical hardness and toughness [
17,
24,
25,
26,
27,
28,
29,
30,
31,
32], but a systematic correlation between starting glass morphology (homogeneous glass versus phase separated glass) and glass-crystal volume fractions in a GC, and the respective corresponding impact on the mechanical properties of ChG ceramics, has not to our knowledge been carried out.
The change in the mechanical properties due to controlled crystallization is most frequently measured in terms of the media’s fracture toughness, Young’s modulus and Vickers hardness. In the case of GCs, the propagation energy required for a crack (and its extension) to pass through or around the crystalline particle is higher than passing through the typically weaker parent glass matrix phase. The crystalline particles divert the propagating crack front, resulting in a slowing of the crack’s propagation, in turn leading to an increase in mechanical properties. While a great deal of work has been carried out in the field of measurement of mechanical properties in ChGs [
15,
17,
33,
34,
35,
36], few studies have carried out measurements related to parent glass morphology free of any nucleating agent such as examined in the effort here.
Previous efforts to examine mechanical property changes in ChGs doped with alkali halides has been extensive, highlighting numerous promising candidates for optical glass and GC applications [
26,
27,
28,
29,
30]. A well-studied example is for Ge–Ga–Se glasses doped with KX or CsX where (X is Cl or Br); here, the addition of metal halides facilitates homogenous crystallization, which results in improved hardness as well as reduced expansion coefficient [
31]. The addition of RbI in the Ge–Ga–Se glass composition also results in synthesis of a moldable GC without any loss of transmission window [
32]. Many other systems such as Ga–Ge–Sb–S [
37], Ge–Sb–S [
35,
38], and Ge–Ga–S [
39,
40], have also been explored, in which thermo-mechanical properties have been improved by the addition of an alkali halide. However, in the case of adding halides to the base glass composition, the improvement of such properties can come at the expense of chemical stability.
In this study, we have focused on the measurement of the glass and GC’s micro-indentation response as quantified by Vickers hardness, and a variation in the materials Young’s modulus following heat-treatment. A multicomponent ChG is the subject of the study, GeSe
2–As
2Se
3–PbSe (GAP–Se), which possesses good transparency in the IR region and exhibits the requisite narrow size distribution of the secondary crystallized phase(s) making it suitable as an optical nanocomposite [
23,
35,
41]. Such behavior enables the use of a controlled crystallization protocol to realize high RI nanocrystals for GRIN applications. This system has been widely explored in the field of non-selective as well as selective micro-crystallizations in both bulk and thin films. Compared to the sulfide based of GeS
2–As
2S
3–PbS system [
7,
42], the Se-based glass shows transmission further into the IR region, and exhibits better chemical stability. Further examination of glasses containing 10–40 mole% PbSe (maintaining a 1:3 ratio of GeSe
2 to As
2Se
3) [
6,
42] clearly showed liquid–liquid phase separation (PS) via transmission electron microscopy (TEM). The composition of these immiscible amorphous phases and their respective crystalline stability has been shown to impact where crystallization initiates and then extends. For example, in the 20 mole% PbSe [20 PbSe] glass, the secondary droplet phase was Pb-rich, round and uniform in composition with lower crystallization stability, surrounded by a Pb-deficient matrix. In the 30 mole% PbSe composition, the secondary phase remained Pb-rich, but their shape was elongated. Conversely, in the 40 mole% PbSe composition, the matrix became Pb-rich, and the secondary phase was Pb deficient [
42]. Thus, one would expect due to the variation in composition of the Pb-rich droplet or matrix phase, the extent and phase fractions of nanocrystallites formed would vary for a constant thermal crystallization protocol. Indeed, this is what has been previously observed, but the impact of such crystallization on post heat-treatment mechanical properties has not been previously reported. This study examines the impact of crystallization on post heat-treatment mechanical properties, by comparing the phase separated Pb-rich parent glass (PSPG) to a compositionally identical, albeit homogenous and droplet-free parent glass (DFPG).
While phase separation is intrinsically driven by thermodynamics, several methods (control of batch/melt size, quench rate, heating protocols), have been shown in some compositions to alleviate phase separation in this glass system. However, in our efforts to prepare the above GAP–Se composition, none of these changes have resulted in a non-phase separated material when prepared from a melt/quench process. Recently, in collaboration with our commercial partners Amorphous Materials, Inc., (AMI) and their outside materials engineering consultant, a novel glass preparation process provided us with our first droplet free 20 mole% PbSe composition in a high-volume quantity melt (>2 Kg). This DFPG was prepared by leveraging AMI’s proprietary chalcogenide glass manufacturing process with a computer-controlled furnace system, providing a pathway to evaporate the chemicals homogenously under high vacuum and condense instantaneously, as a target.
In this paper, our key objective has been to compare property variation attributable to this variation in morphology (phase separation of small, conventionally lab melt material versus homogeneous commercial melt morphology).
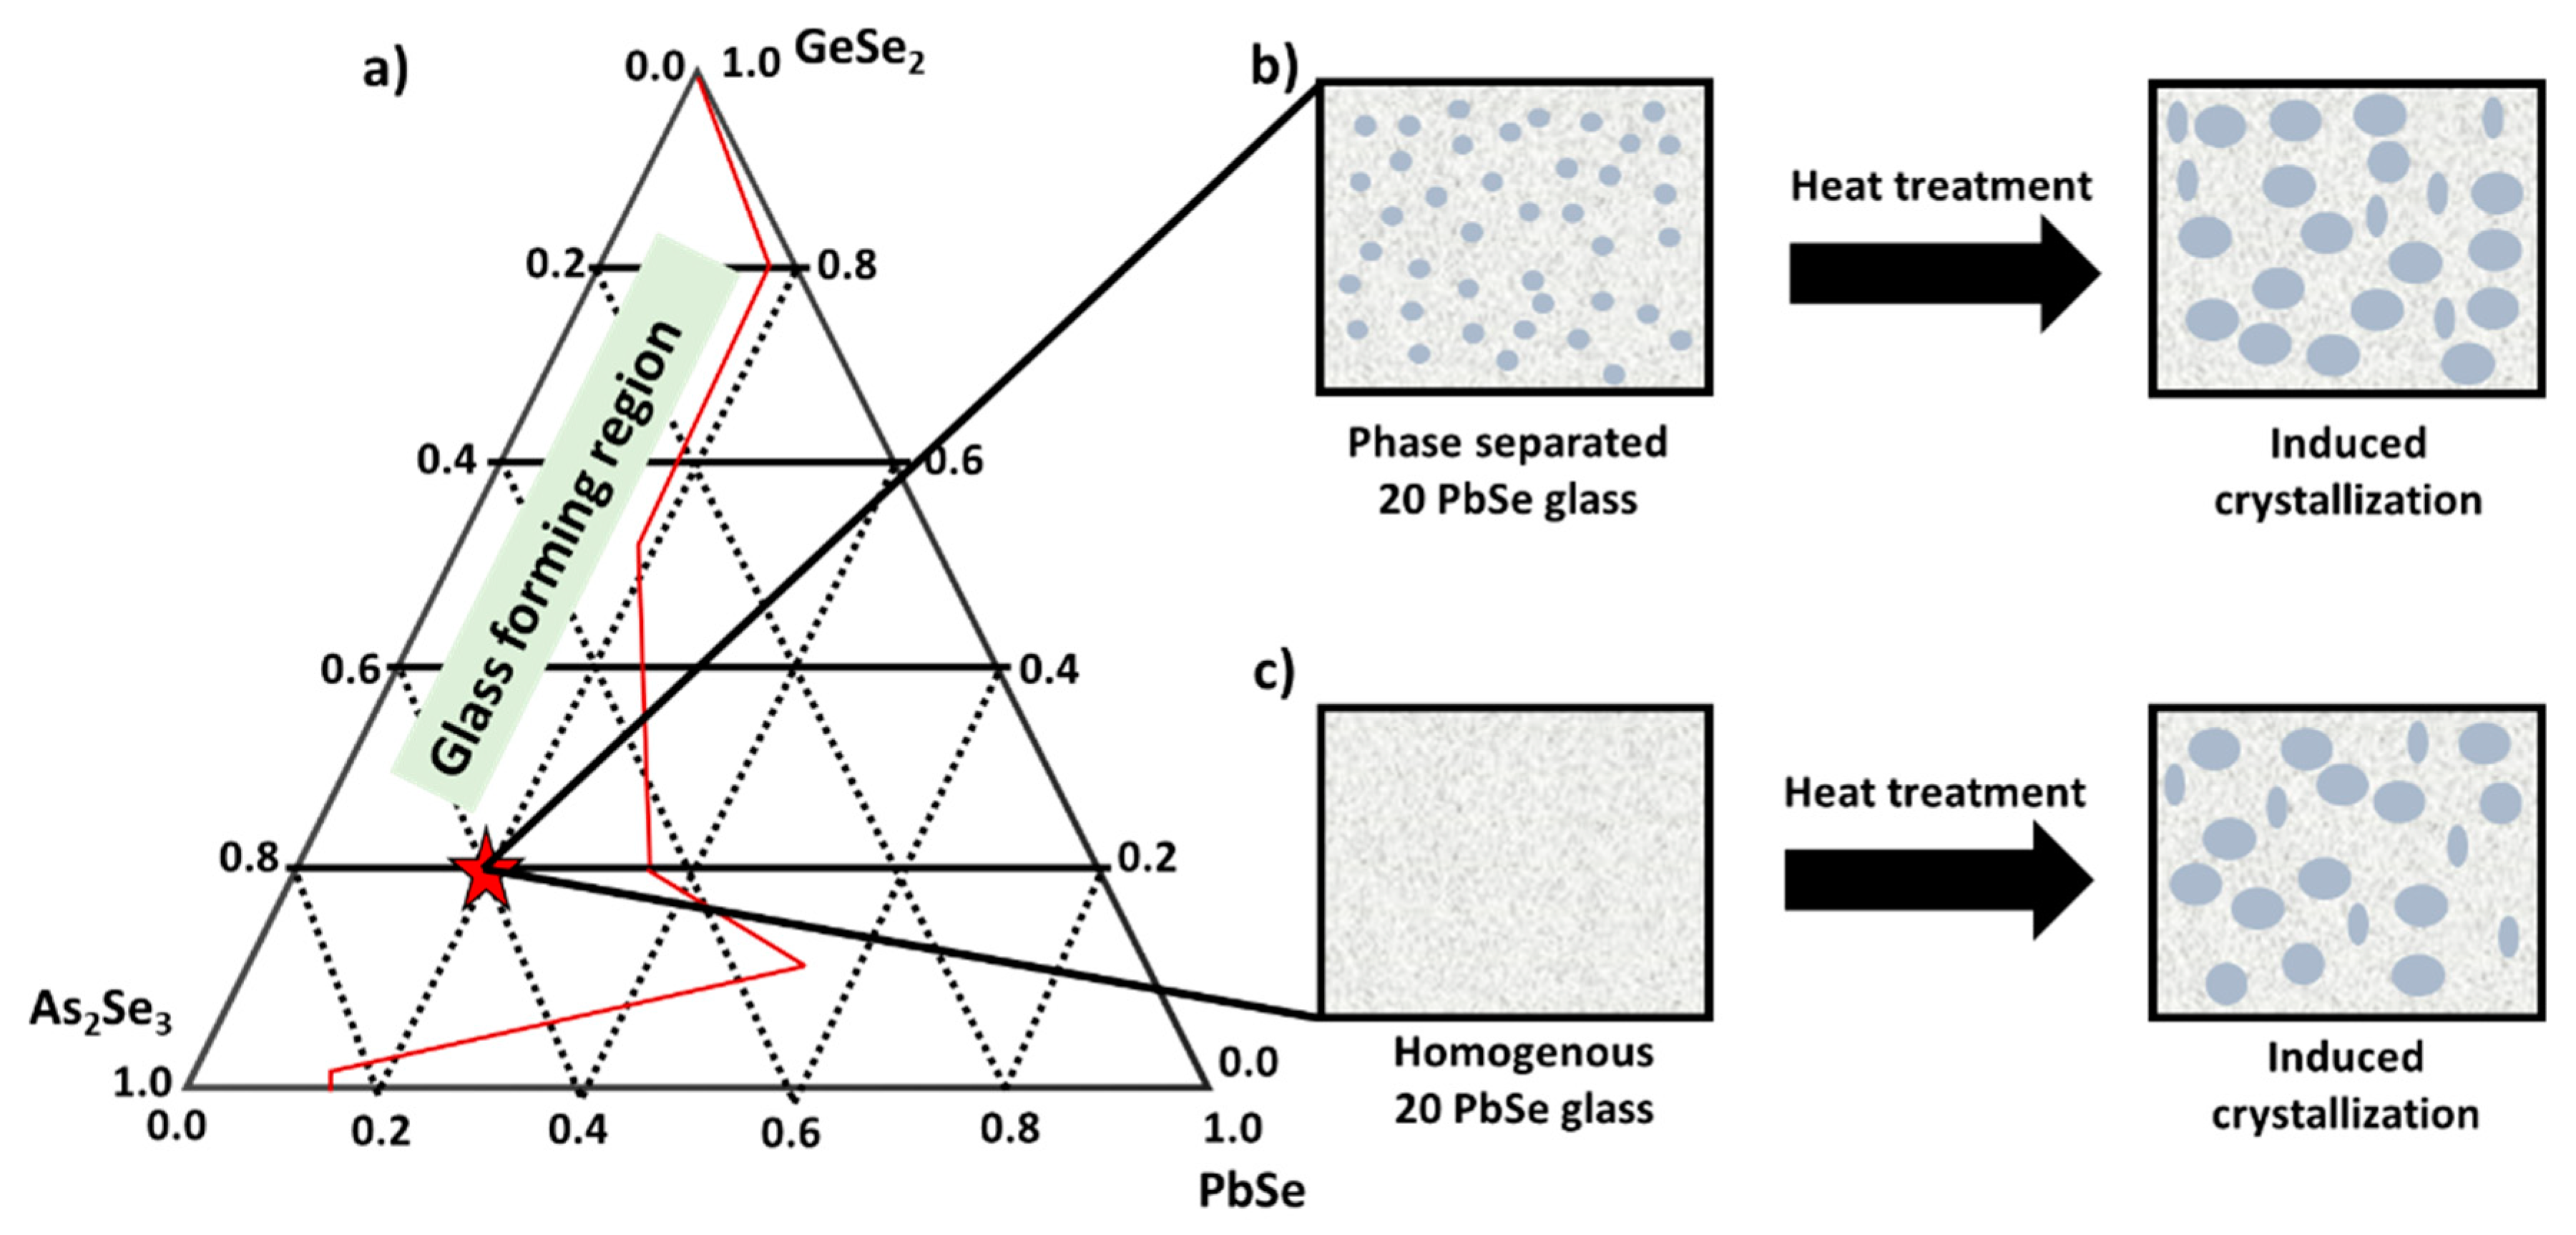
Figure 1a shows the ternary phase diagram of the As
2Se
3–GeSe
2–PbSe glass system, where x = 20 mole% PbSe [20 PbSe] composition has been shown with a star.
Figure 1b,c depicts a schematic of the phase separated and homogenous 20 PbSe base glass composition prior to and after an identical nucleation and growth heat-treatment protocol. A systematic pre- and post-heat-treatment protocol was applied to the respective parent glasses, and Transmission electron microscopy (TEM) and X-ray diffraction (XRD) analysis was carried out to assess the volume fraction of the specific crystal phase formed. Scanning electron microscopy (SEM) was used to measure the average size and size distribution of the individual crystalline phases formed at each heat-treatment step. Lastly, the change in the effective mechanical properties such as Vickers hardness and Young’s modulus in the two glasses (homogenous and phase separated) were measured and compared, correlating the changes to the average size, and size distribution of the individual crystalline phases formed at each heat-treatment step.
2. Experimental
Coupons of PSPG, the lab-melted parent 20 PbSe glass, were compared to commercially melted (DFPG) coupons to assess the role of varying melt protocols and the resulting as-melted glass morphology. A 100 g ‘lab-scale’ batch of 20GeSe2–60As2Se3–20PbSe [20 PbSe] was prepared using the conventional melt-quenching technique in the Glass Processing and Characterization Lab (GPCL) at University of Central Florida (UCF). The glass was prepared using high purity elements from Alfa Aesar: Selenium (99.999%), Germanium (99.999%), Lead (99.999%), and Arsenic (99.999%). The elements were weighed in a nitrogen purged MBraun Labmaster 130 glove box and loaded in a 30 mm (in diameter) quartz tube. The quartz tube was sealed under vacuum using a methane–oxygen torch. The tube was melted in a rocking furnace overnight (16 hr.) at melting temperature of Tm = 850 °C and quenched at TQ = 650 °C using compressed air flowing over the tube. The glass was annealed at Ta = 177 °C for 2 hr. to prevent any quench-related stress in the glass. The prepared glass rod was cut into 2.5-mm-thin slices using a slow speed saw. The slices were polished on both sides using a SiC paper with a final 0.05 µm Al2O3 slurry polishing.
Employing their specialized method designed to eliminate phase separation upon cooling, collaborators at Amorphous Materials Inc. (AMI) produced the same 20 PbSe composition using 5Ns or higher purity chemicals and the proprietary melt processing protocol previously described. The 2.4 kg commercial melt was made as a ~200 mm diameter plate. An IR camera was used to inspect the plate visually in the NIR and identify regions with excessive levels of striae. Based on this information, low striae regions of the plate were selected, core drilled, and sliced into several 2.5 cm diameter (~3 mm thick) coupons. The coupons were polished on both sides and used for the measurement of physical properties prior to and following heat-treatment protocols. Both sets of coupons were subjected to side-by-side heat-treatments and re-polished prior to measurement of post-heat-treatment properties.
Thermal properties (ramp rate derived Tg, Tx) of the parent glasses were measured on a Netzsch DSC 2014 F1 Phoenix differential scanning calorimeter (DSC). An empty aluminum crucible was used as a reference, and a constant sample size (20 ± 2 mg) of glass (sieved to be <150 µm particle size) was used to measure the thermal profile of the glass. The DSC was operated at a rate of 10 °C/min, with the relative glass transition temperature (Tg) and crystallization temperature (Tp) determined by applying the first derivative technique to the generated DSC curves.
Nucleation-like (I) and growth-like (U) curves were measured to compare the tendencies of crystals to form under identical thermal protocols. Such I-U curves, as discussed in [
43,
44], complement traditional DSC data that only measures
Tg and
Tp, as well as provides information on the relative rates for nucleation and growth of crystals as a function of temperature. However, the measurements do not give absolute values of crystallization rates, as the precise quantity of as-formed nuclei is non-zero and not accurately detectable. These I-U rate curves were used to define suitable temperatures and times for heat-treatments. An ideal material for completely controlled nucleation has an I-U curve consisting of two, well-separated nucleation and growth areas. The nucleation and growth-like curves in this study were quantified using methods described in detail elsewhere [
45]. An initial DSC program was run from 25 °C to 350 °C at a rate of 10 °C/min in order to determine the
Tg and
Tp. Further information about the theory and findings and the creation of nucleation-like and growth-like curves in ChGs and Tellurite glasses is outlined in previous works [
45,
46,
47].
To assess the impact of as-formed base glass morphology on post heat-treatment mechanical properties, coupons of both lab-melt and commercial melt glass were subjected to the same, two step heat-treatment protocol for a fixed set of growth temperatures. Specifically, all coupons saw a nucleation heat-treatment of 220 °C for 2 hr., followed by a growth step at temperatures of either 250 °C, 260 °C, or 270 °C for varying time durations. These values were chosen based on rates defined by the glass’ I-U curves. To evaluate the point at which growth proceeded to a point that reduced transmission to an unusable level (defined as 50 % of the initial transmission at 4.5 µm), the maximum time and temperature duration of heat-treatment was determined to be 270 °C for a total growth time of 150 min. All samples were polished (no annealing) after heat-treatment to remove any residue that may have developed on the coupon’s surface during the process.
TEM was used to study the morphology and chemical composition of phases within the parent base glass and post heat-treated glass samples. The glass was ground into powder and placed on a carbon grid. Bright field (BF) images were collected using a FEI Tecnai F30 TEM, with an electron beam acceleration voltage of 200 kV. A Zeiss Ultra 55 FEG SEM was used to image crystallite shape and their dispersion throughout the surrounding glass matrix. ImageJ software was utilized to detect crystallites and extract their sizes from the SEM images. The crystallization behavior of the base glass and that of the heat-treated samples was studied using a PAN analytical Empyrean X-ray diffraction system employing Cu K- alpha radiation source (λ = 154 nm). This system was used to probe samples across a 2θ range of 10 to 80°. Lab-prepared crystalline Selenium (Se), lead selenide (PbSe), and Germanium lead selenide (Ge0.1Pb0.9)Se were used as standards to quantify the volume fraction of crystallites in the heat- treated samples.
The density and transmission spectra of the pre and post heat-treated glass coupons is shown in
Figures S1 and S2 of the Supplementary Information. The Vickers hardness of pre- and post-heat-treated glass coupons was measured using an indentation technique [
48,
49] on a Shimadzu DUH-211S Hardness Tester, with a load of 100 mN (0.01 kgf). This load value was chosen as it resulted in clean indents without any crack initiation on the corners of the indents. The measurement of the resulting indent’s diameter,
d = 2
a (where
a is the average length of the diagonal left by the indenter) with the corresponding load
P, allows the calculation of the Vickers hardness according to Equation (1) (kgf/mm
2). A polished coupon of commercial glass of similar composition (Ge
10As
40Se
50) (SCHOTT IRG 24) with a known hardness value was used as a comparative reference. Sources of error for this measurement can be due to non-parallel sample surfaces, pre-existing surface damage (cracks or scratches), the specific annealing protocol applied to the glass sample, and from the manual measurement of the indent size on the display screen.
The Young’s modulus
E was measured using the Sonic Modulus method. Here,
E was calculated by using Equation (2), where
υ is the Poisson’s ratio,
C is the ultrasonic wave velocity and
ρ is the density of the sample. The Poisson’s ratio was measured by using Equation (3), where
CL, and
CT are measured ultrasonic wave velocities in the longitudinal and transverse directions, respectively. A 5 MHz piezoelectric transducer was used to measure
CL and
CT, and 10 measurements for each type of wave propagation direction (longitudinal or transverse) were carried out to obtain meaningful statistics. Sources of reporting error for this measurement may be due to errors in the measured sample thickness (
d), the interpreting of the waves’ period (Δ
t) from the oscilloscope screen, and the specific protocol used for annealing the glass sample. The ultrasonic wave velocity,
C was calculated by using Equation (4), where
d is the sample thickness and Δ
t is the time period between two waves.
3. Results and Discussion
The DSC spectra for the two 20 PbSe parent glass samples (lab-melt (PSPG) and commercial (DFPG) melt) were used as a preliminary indicator to assess the presence of phase separation. It has been previously reported, that the presence of more than one
Tg is an indication of possible phase separation in a glass [
50,
51].
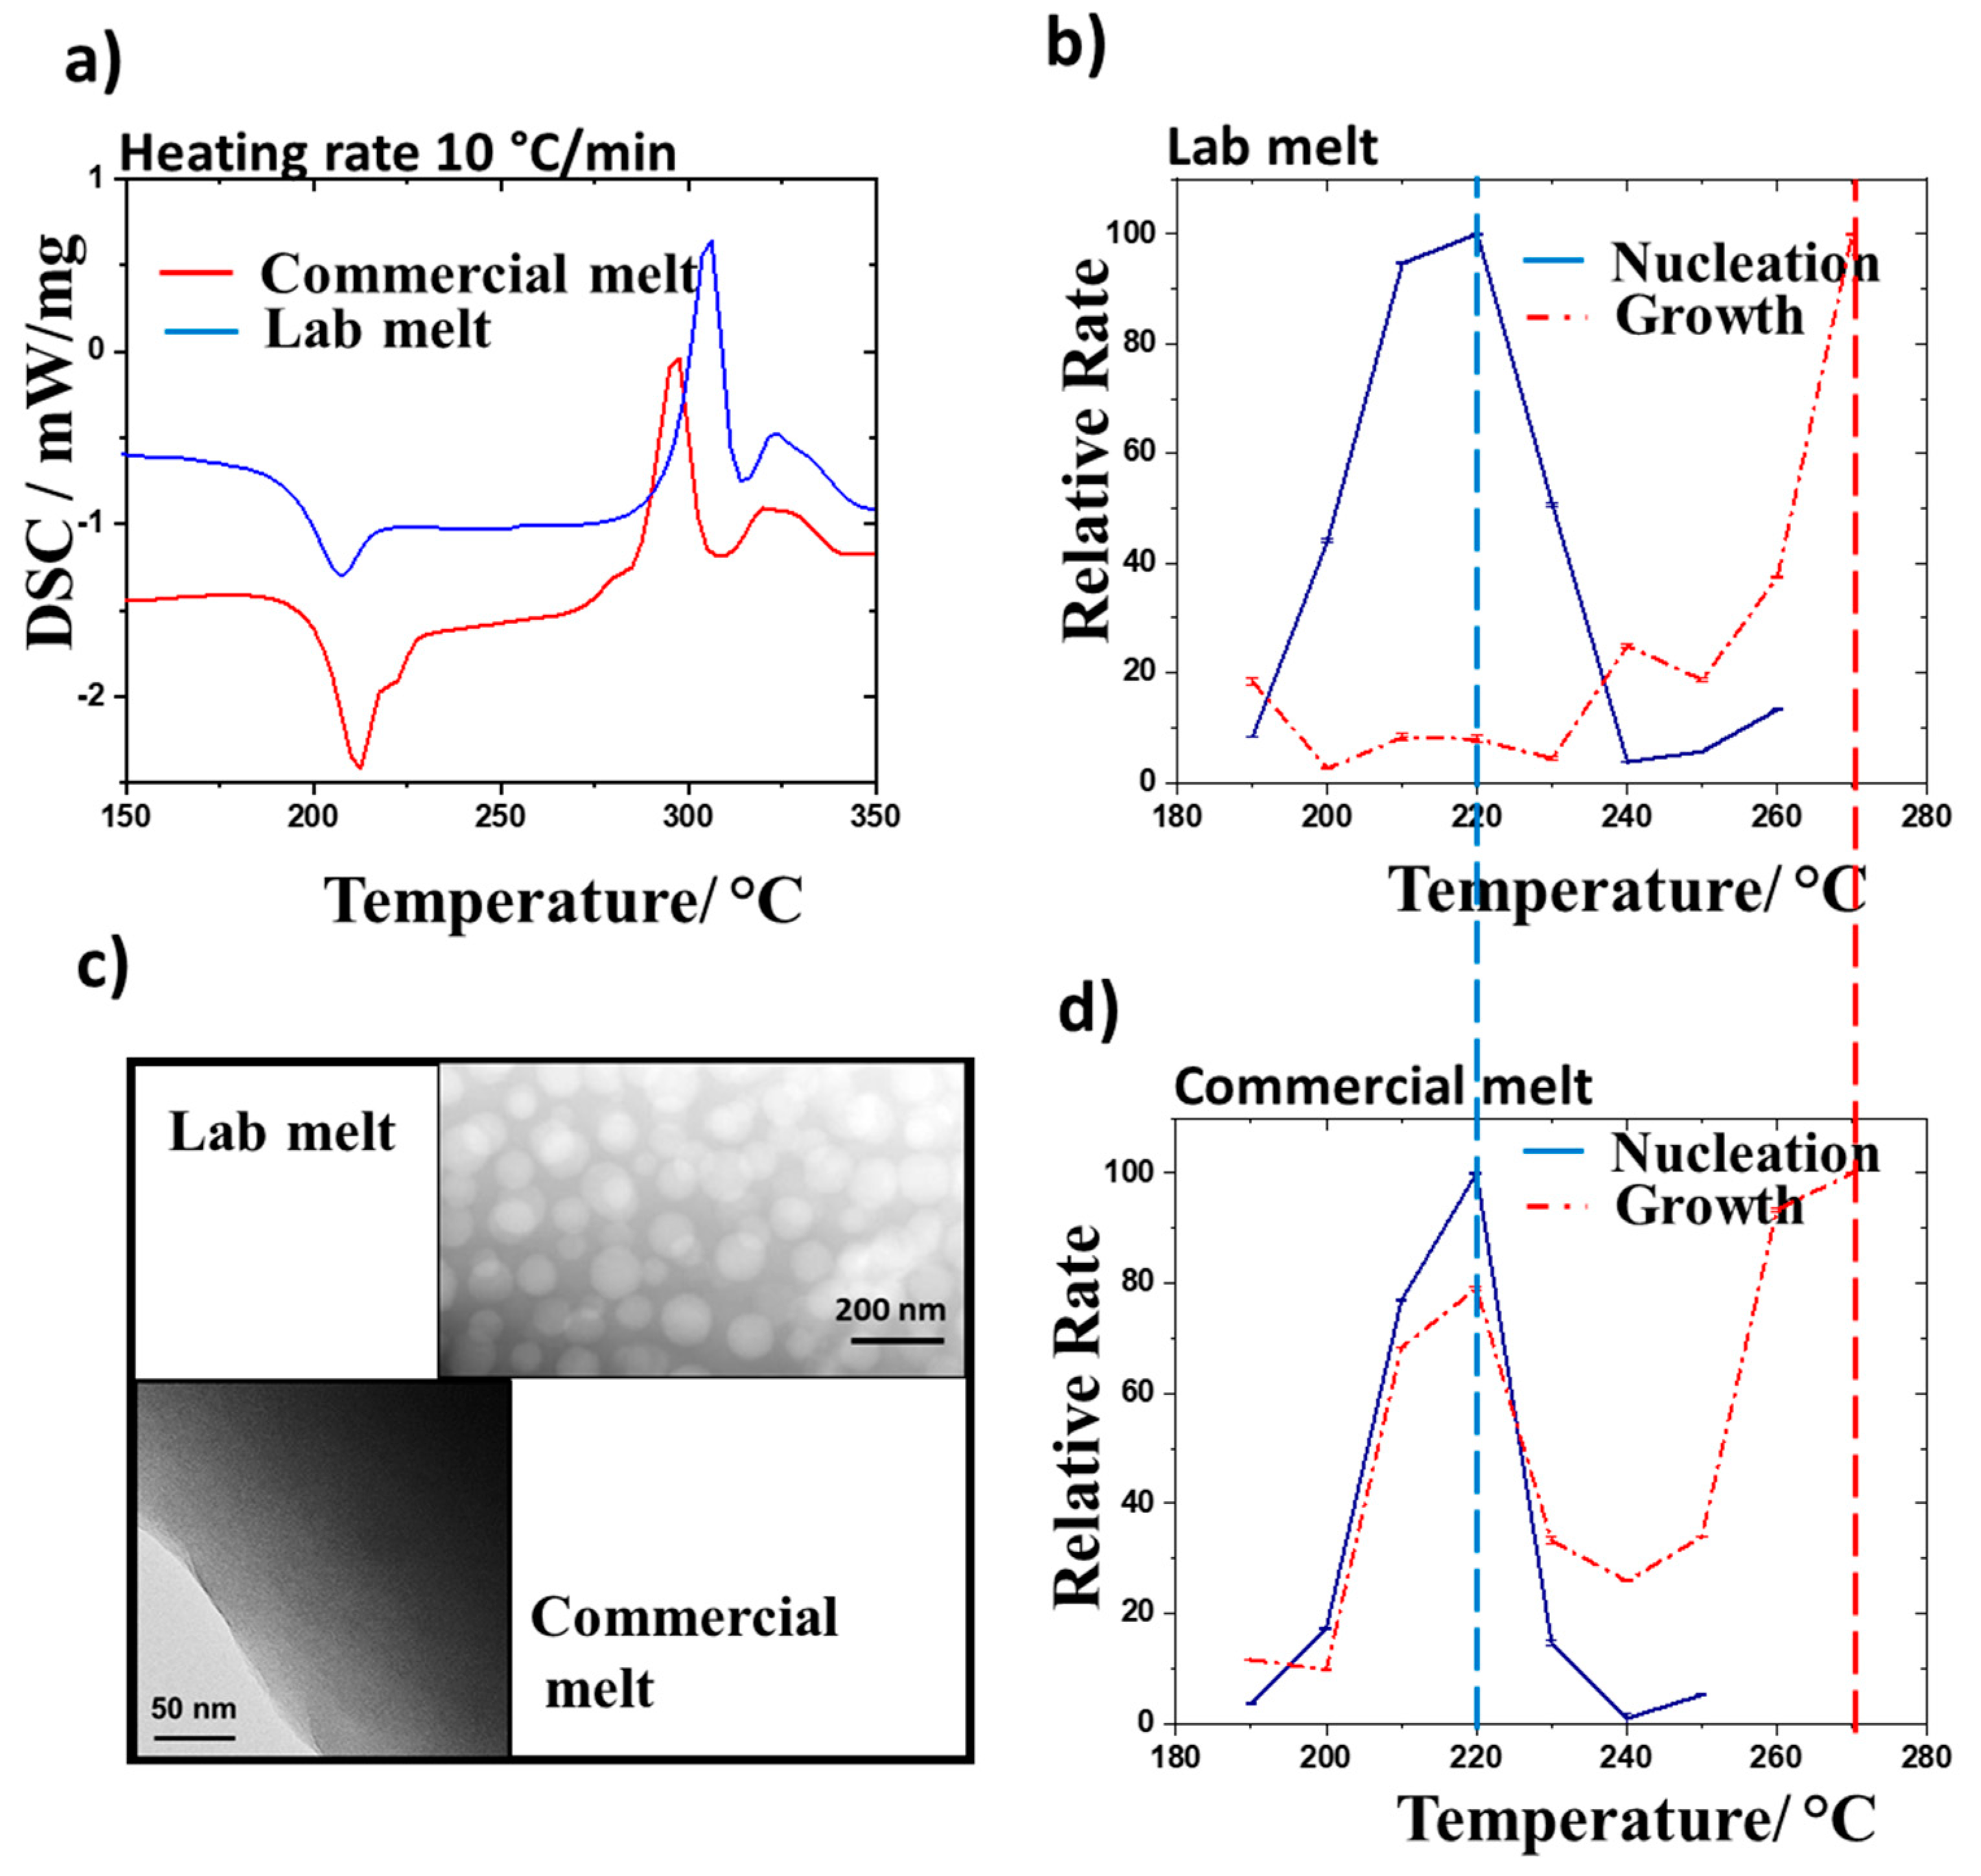
The DSC spectra for the two base glasses heated at 10 °C/min are shown in
Figure 2a. The traces show one endothermic inflection in the lab melt sample, followed by a broad exothermic crystallization peak, which has been attributed to Pb- and/or As- containing crystalline phases [
45]. In prior studies varying the amount of PbSe content, the exotherm was seen to shift to lower temperature indicating that it is likely associated with the PbSe containing phase(s). In this work, it was also shown that Pb-rich droplets precipitate in the amorphous glass matrix of the 20 PbSe composition due to the PS [
52]. However, the visible presence of only one
Tg in the DSC data for this well-known phase-separated glass matrix may be attributed to the small batch size and higher cooling rate during quenching of the glass. Here, the second
Tg may have been obscured by the small volume fraction of the secondary phase. The DSC traces of the commercial melt show two clearly resolved endothermic inflection points, suggesting the presence of two
Tg followed by two exothermic crystallization peaks. The presence of the second endotherm in the commercial melt is likely due to the thermally-induced development of a secondary phase in the glass matrix; a curious and perhaps anomalous behavior. It may be similar to that seen in similar composition melts discussed elsewhere [
52].
As seen in
Figure 2a, both the
Tg endotherm and the crystallization peaks shifted towards lower temperature in the commercial melt when compared to the lab melt. This slight shift is believed to be due to the vastly different thermal histories of the two glasses. The lab melt underwent very rapid quenching via constant air flow and eventually came to room temperature. Whereas, the commercial melt was rapidly brought from its initial, target temperature of 216 °C to room temperature, and subsequently, precision-annealed. The precision anneal involved raising the glass quickly to its annealing point temperature (185 °C) and soaking for 3 hr., cooling at 1 °C/hr. to 15 °C below its strain point temperature (160 ± 15 °C), and finally allowing it to cool more rapidly to room temperature. The vastly different cooling protocol may result in the formation of a higher concentration of as-quenched nuclei. Therefore, this glass might be expected to crystallize at lower temperature. This is consistent with the lower temperature onset of the crystallization peak for the same composition glass. The variation in the thermal history did not result in any new features in the DSC traces, which would be an indicative of formation a new species in the glass matrix. While the
Tg’s for the two melts were close, the variations in position of the first crystallization peak temperatures suggest that heat-treatment near this temperature could lead to the formation of varying crystallization phases. Thus, further analysis of the first crystallization peak in the nucleation- and growth-like curves helped in the selection of suitable heat-treatment protocol for these glasses. From the I-U curves, the evolution of different crystalline phases and their estimated volume fractions in the post heat-treated glass matrix could be predicted.
As discussed earlier, the nucleation and growth-like curves are instrumental in understanding the relative rates of crystallization in the glass, based on the temperatures at which the glass matrix is soaked. The understanding of the relative rates helps in preparing the heat-treatment protocol (suitable temperature and time) for the optimal crystallization in the base glass, to gain a better control over the engineering of the GC properties, specifically, towards a control over the size and number density of the crystallites. The nucleation and growth-like curve for both lab and commercial melts were studied and are shown in
Figure 2b,d. For identical chemical compositions, the role of the parent glass morphology resulting from the varied glass melting protocols on these curves is dramatic. The lab melt showed a clear separation between the nucleation and growth regime of the glass, which is important when engineering GCs with desired properties. Measurable nucleation is shown to start at 200 °C and reaches a maximum near 210–220 °C. Whereas, crystal growth is seen to begin at 240 °C and reaches its peak at 270 °C. This clear separation of ~20–25 °C between the nucleation, and the growth regimes is desirable as it enables the material to selectively nucleate, and then grow crystallites with a narrow size distribution, thereby ensuring a lower level of scattering. The peak temperatures of the nucleation and growth-like curve were used to define the heat-treatment protocol.
Despite having the same chemical compositions as the lab melt, the commercial melt exhibited markedly different relative nucleation and growth curves as shown in
Figure 2d. Here, the onset of nucleation started at 200 °C and reached its maximum at 210–220 °C, which is similar to what was observed in the lab melt. However, the growth curve over the same temperature range (210–220 °C) suggests the earlier onset and growth of one phase, followed by a second phase that appears to start growing at 240 °C, reaching its peak growth at 270 °C. This is not an ideal case scenario for generating crystallites with a narrow size distribution, but it does gives us an opportunity to understand the mechanism of the crystallite formation. This data is consistent with the broad crystallization peaks shown in the DSC data of
Figure 2a. The nucleation and growth curve exhibited by the commercial melt highlights the impact of the lack of phase separation, when all constituents, including the crystallization-inducing constituent Pb, are homogeneously dispersed in the parent glass matrix. This presence of Pb throughout the parent glass matrix, combined with the glass’s much slower cooling rate, encourages not only more nuclei formation during parent glass processing, but also more growth of either Pb- or As-containing crystallites upon heat-treatment.
This information on the dispersion of batch elemental constituents and their impact on thermally induced crystallization is further exemplified in microscopy of the parent glasses. High resolution TEM images of the commercial melt illustrating this homogeneous dispersion of constituents and lack of immiscibility were collected to both quantify if phase separation was present and to further substantiate if there are TEM-visible nano-phases responsible for two
Tg shown in
Figure 2c. Similarly,
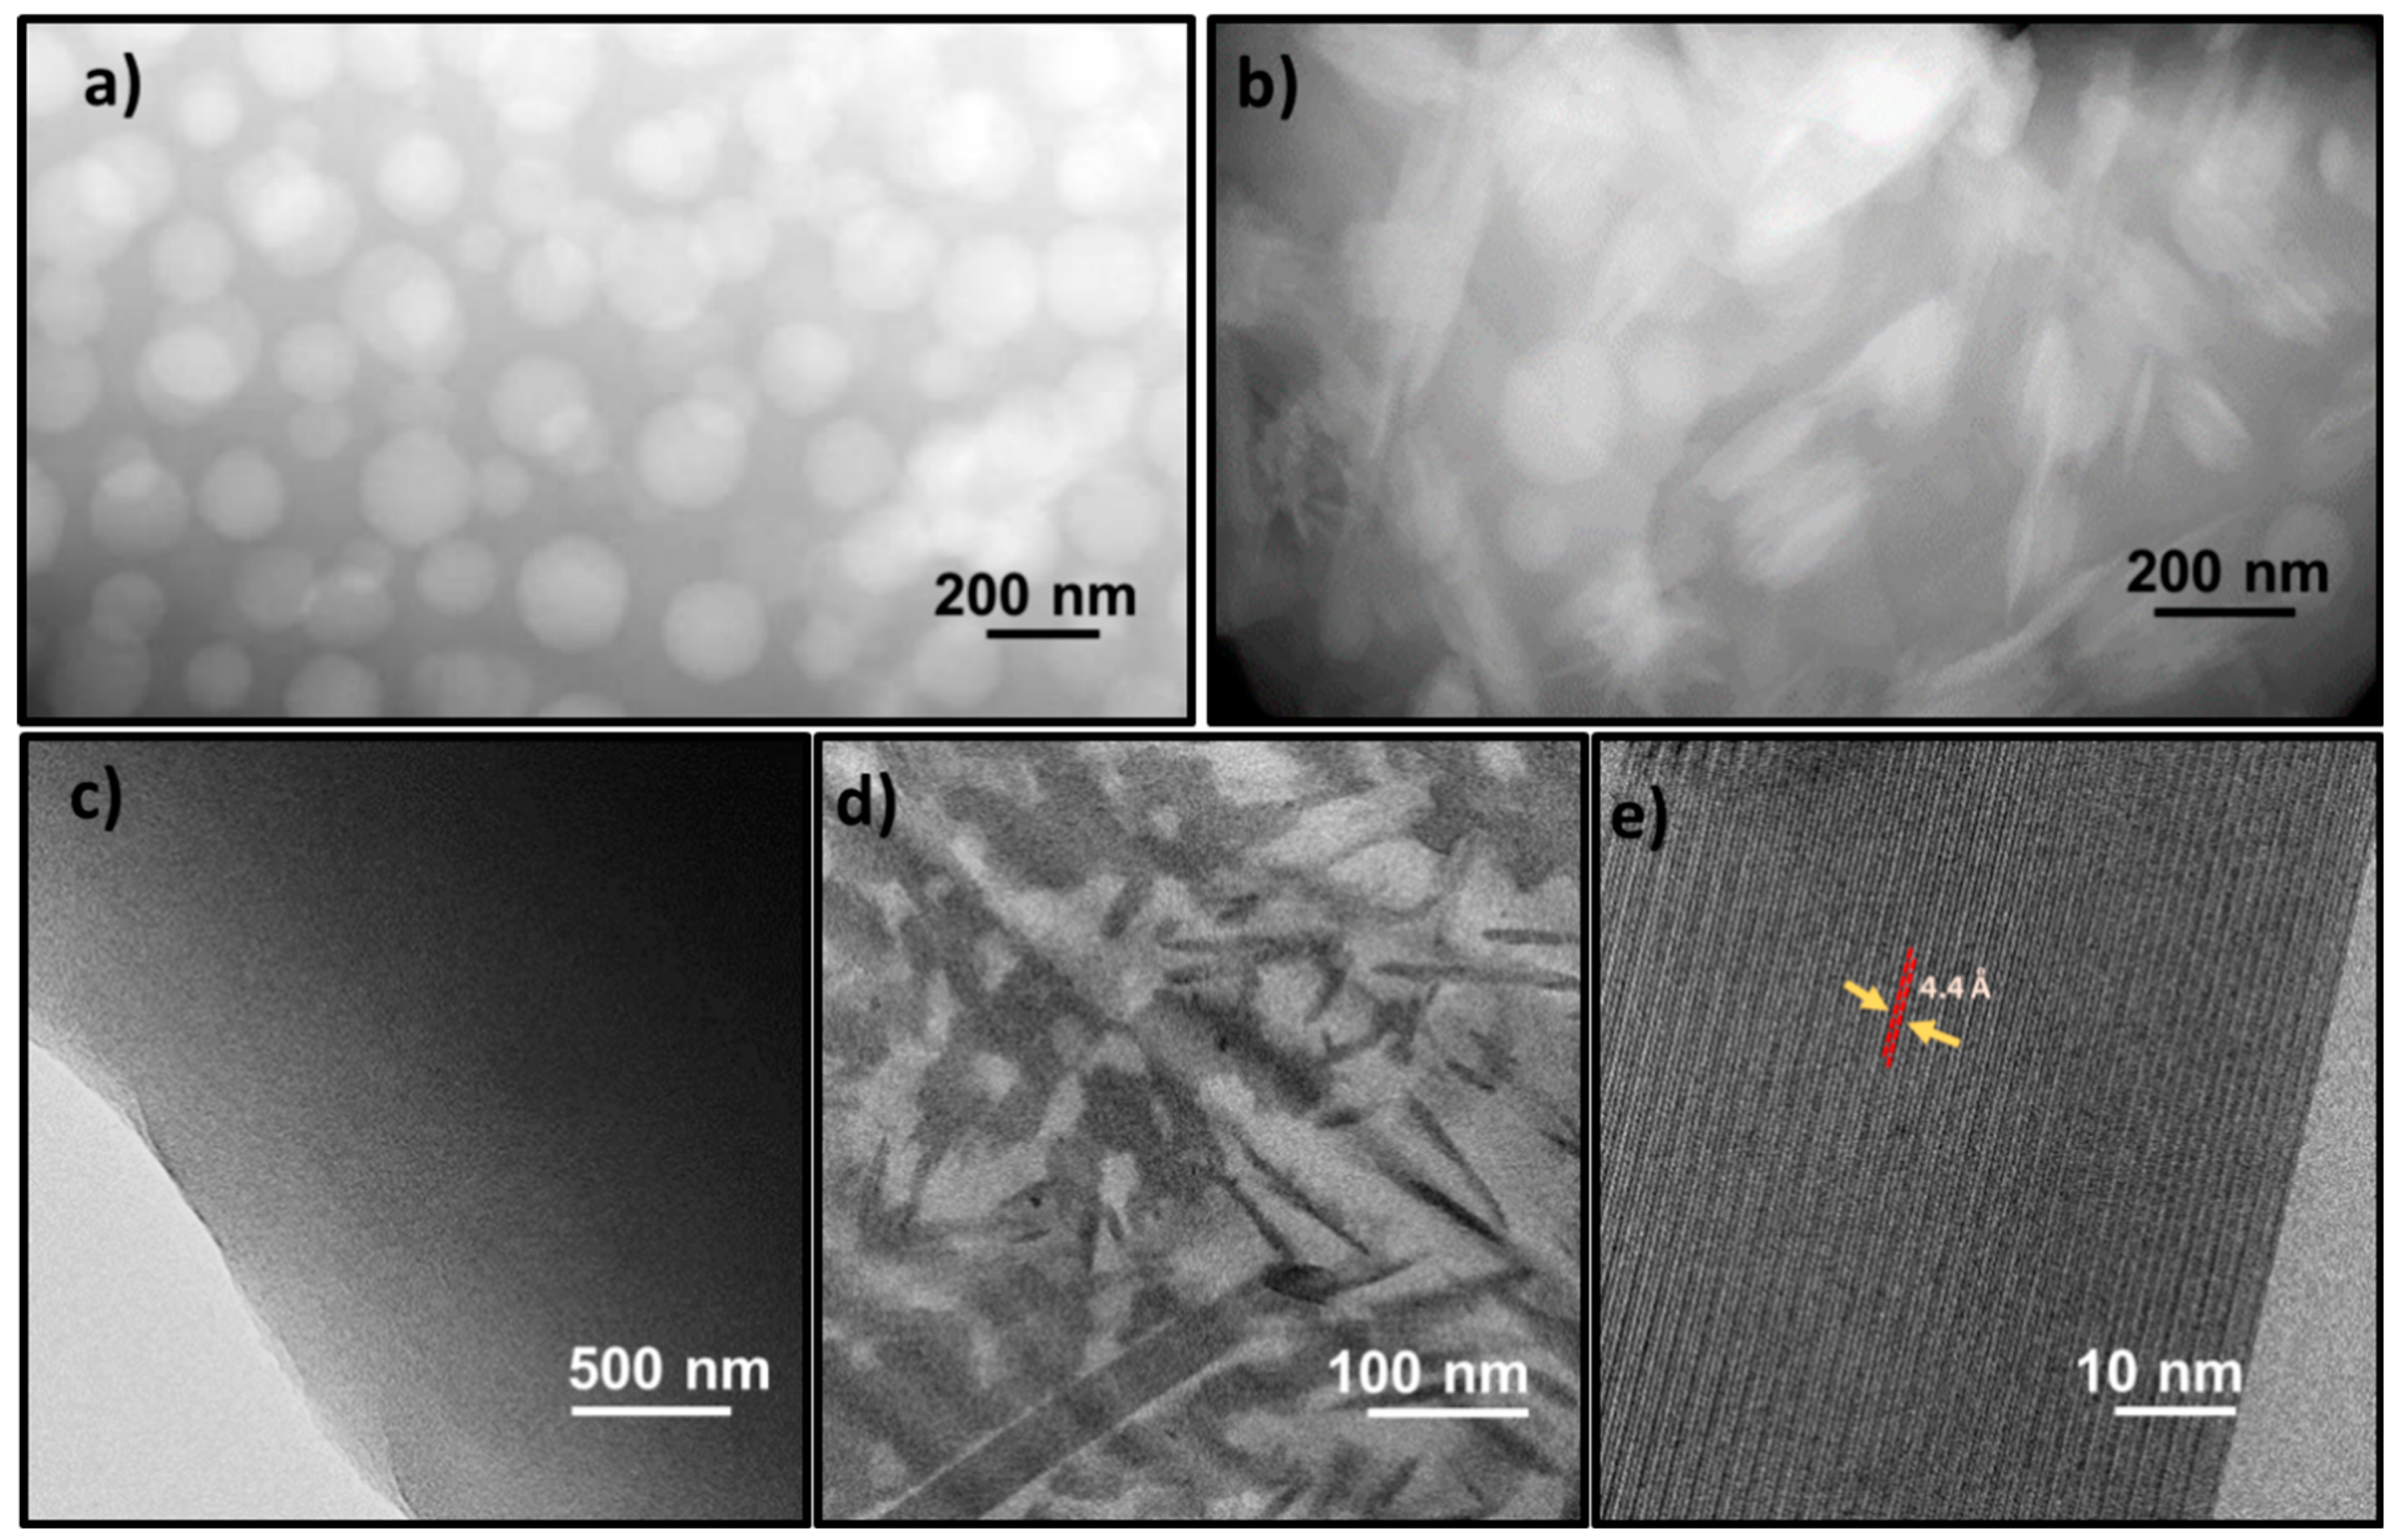
Figure 3a,b shows the TEM image of the base and the heat-treated lab melt as measured and analyzed in previous works [
45,
52].
Figure 3c,d shows the TEM images of the base and the heat-treated commercial melt following identical thermal treatment. The heat-treatment protocol used in the present study matched that used in the previous work (
Figure 3a,b), which includes nucleation at 220 °C-2 hr. and growth at 270 °C-30 min. The secondary crystalline phase that resulted can be seen embedded in the heat-treated amorphous matrix.
The interplanar spacing was extracted from
Figure 3e to identify the crystalline phase present in the glass. The extracted interplanar spacing of ~4.4 Å matches closely the reported value of (333) As
2Se
3 lattice plane [
53]. These results indicate that in the commercial melt, thermally-induced crystallization resulted in the formation of As
2Se
3 as the principal secondary phase. The principal crystalline phase formed in the droplet rich 20 PbSe is a mixture of Pb-rich (Ge
0.1Pb
0.9)Se and PbSe, which has been studied and reported elsewhere [
19,
45,
52].
The variation in post-heat-treated microstructures seen in
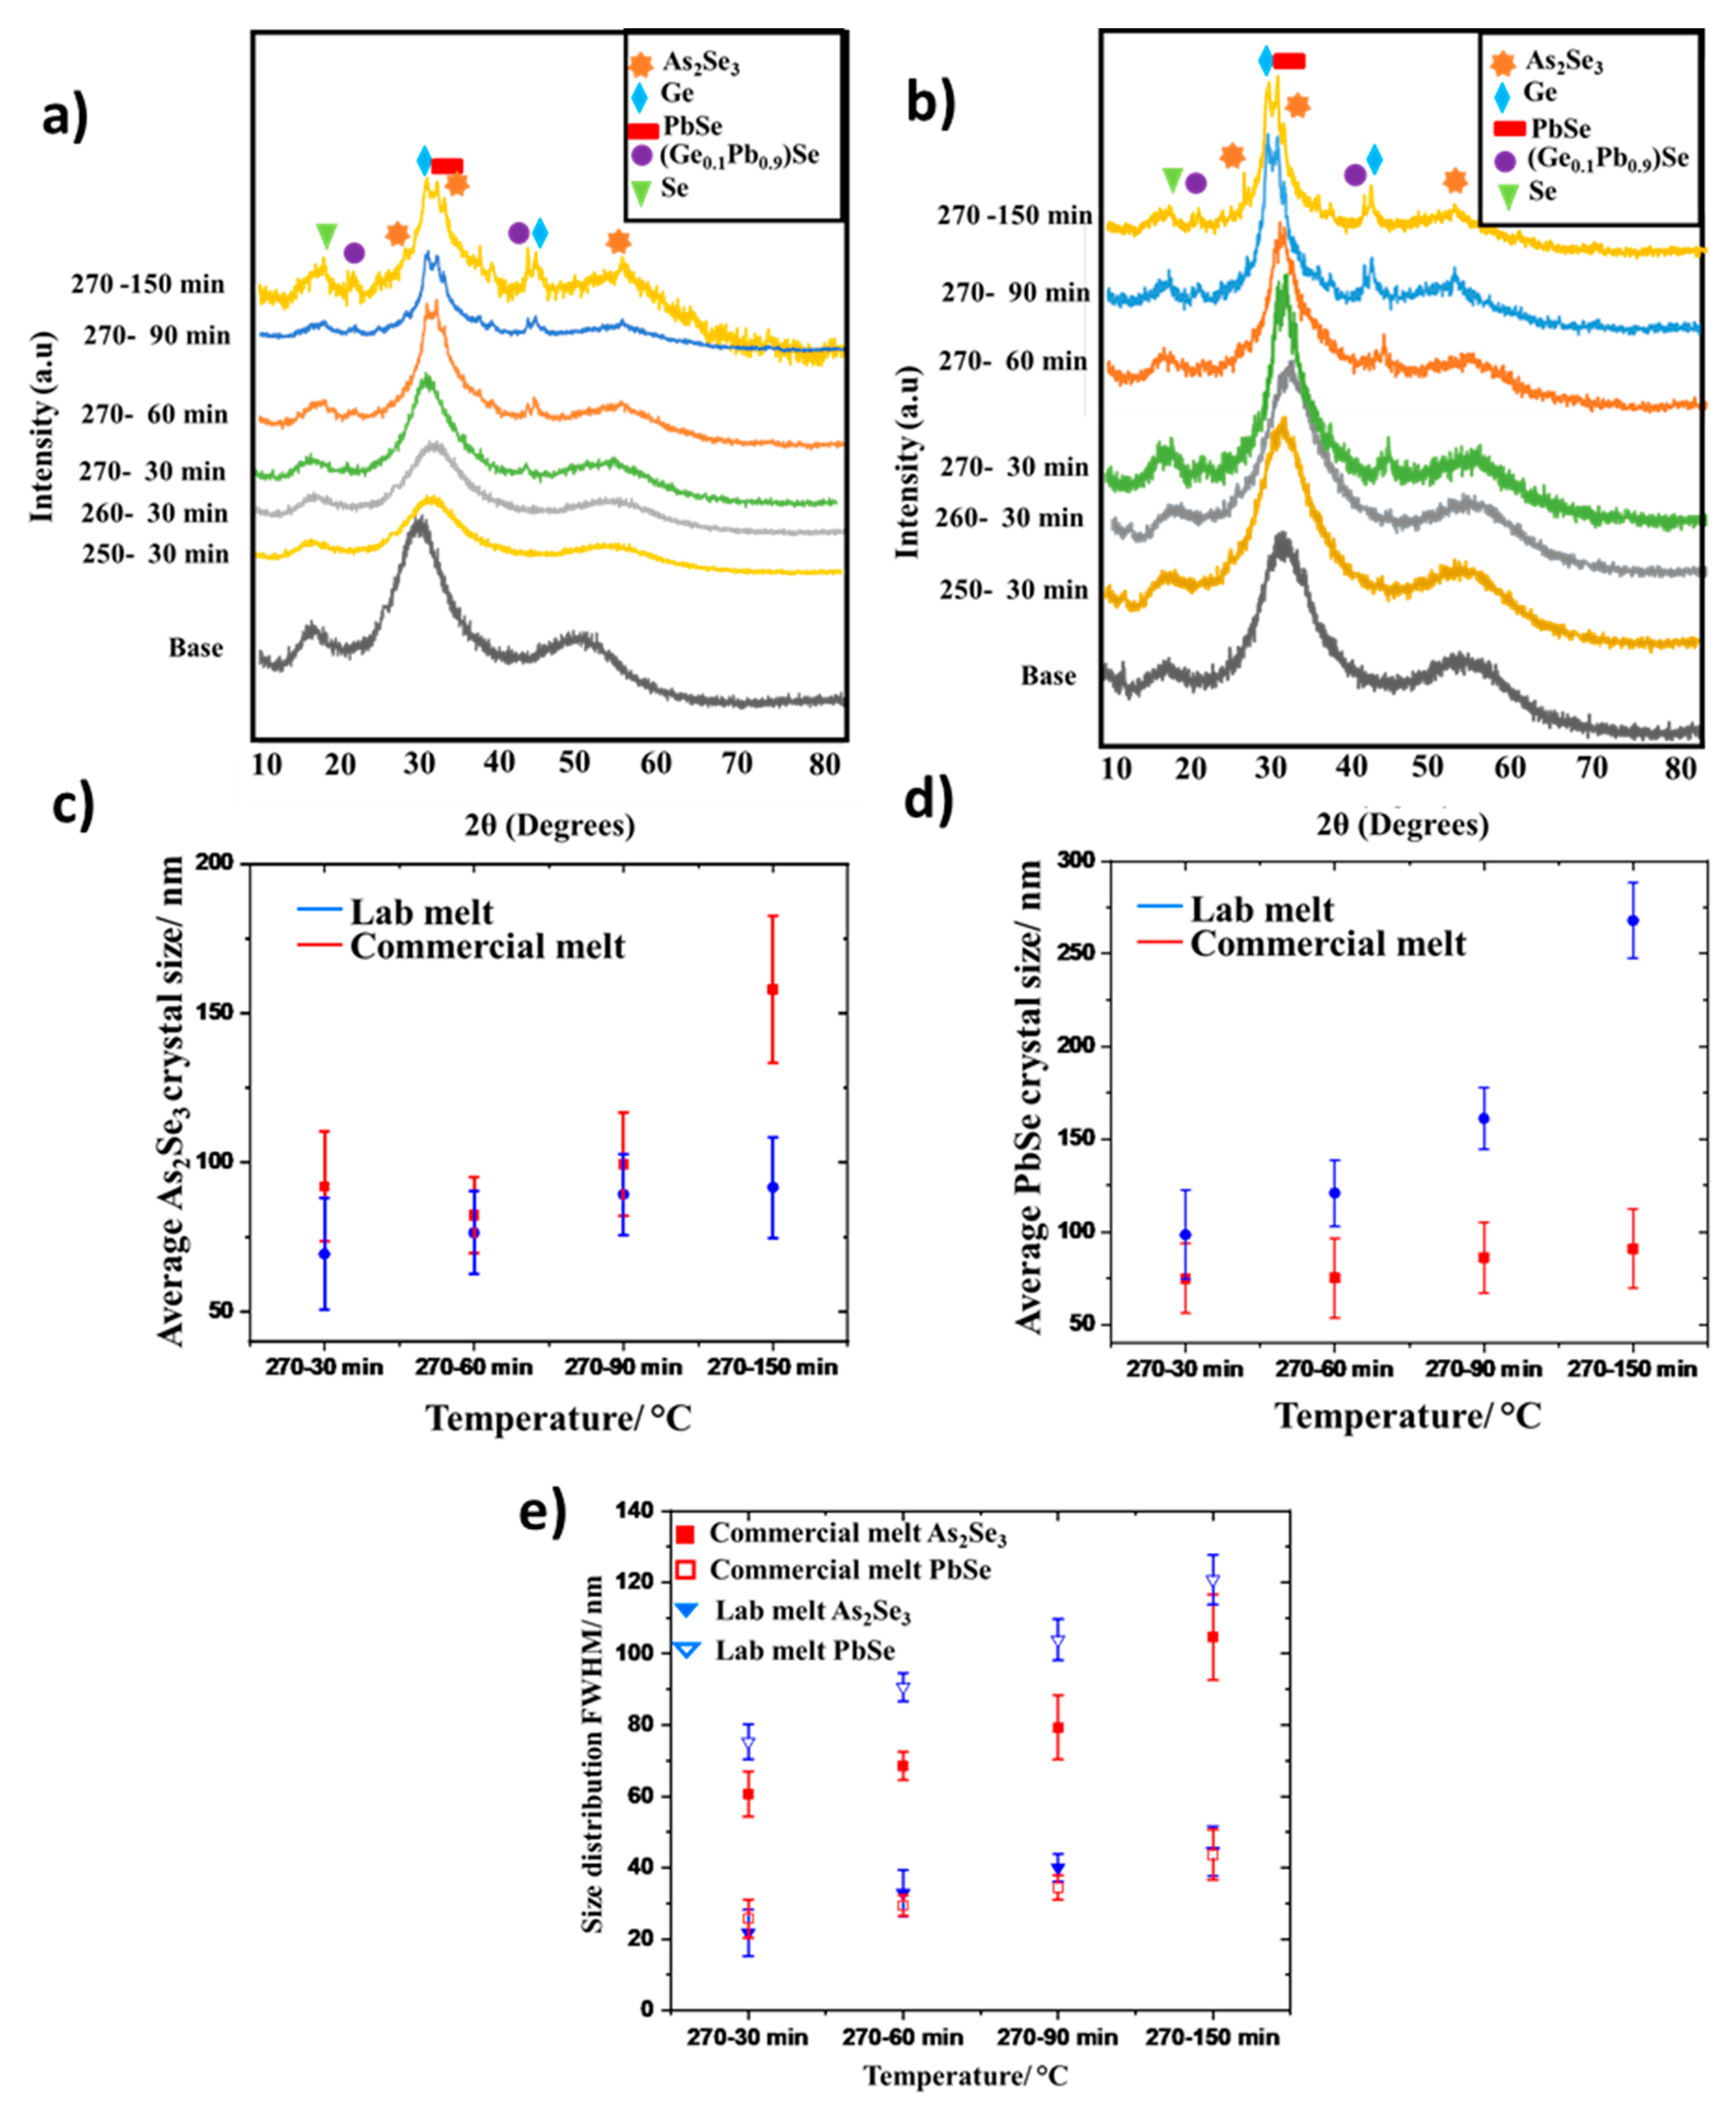
Figure 3 suggest a variation in resulting crystal phases formed under similar heat-treatment protocols. Thus, comparison of the XRD patterns of the post-heat-treated GC samples as they evolve with individual thermal protocols for both commercial and lab melts reveals this variation, as shown in
Figure 4a,b. Both the samples followed the same heat-treatment protocols, as can be seen by the labels shown in the side-by-side figures. The presence of Pb-rich droplets in the lab melt makes it more prone to crystallization than the commercial melt, which can be seen by the presence of crystallite diffraction peaks emerging earlier than that for the commercial melt (270 °C, 30 min). The volume fractions of the crystalline phases were calculated by preparing calibration curves of the individual crystals in the base glass at different concentrations; this protocol is discussed elsewhere [
54]. The nucleation and growth of the lab-melted sample held at 270 °C (30 min) sample, showed new crystal peaks at 24, 28, 31, 31.5, and 42° which correspond to (Ge
0.1Pb
0.9)Se, As
2Se
3, PbSe, As
2Se
3, and (Ge
0.1Pb
0.9)Se crystallites, respectively.
The XRD pattern of the commercial melt under same conditions showed crystallization peaks at 28, 31.5, and 42°, where the first two peaks correspond to As2Se3, and the last peak corresponds to (Ge0.1Pb0.9)Se crystallites. Extended heat-treatment of the lab and commercial melt coupons at 270 °C (60, 90 and 150 min) showed new crystalline phases at 18, 30, 41, and 53°, which corresponds to Se, Germanium (Ge), Se, and As2Se3, respectively. Although, all the above-mentioned crystalline peaks were present in both the melts, the Pb-rich crystallites were the preferred crystallites in the lab melt, whereas As2Se3 was the principal crystalline phase in the commercial melt. This is the key difference that substantiates our assumption of the role of glass constituent’s physical dispersion within the parent glass matrix, and how that dispersion impacts which crystal phase dominates the post-heat-treated GC’s microstructure. As noted below, this variation impacts the resulting GC’s mechanical properties. What is important for our understanding is that, despite using the same heat-treatment protocol, the type and rate of formation of secondary crystalline phases was different, which supports the fact that the base glass morphology is the limiting factor in the formation of GCs.
Figure 4c,d illustrates the average crystal size and size distribution of the As
2Se
3, as well as PbSe crystals formation in the commercial and lab melt during the stepwise heat-treatment protocol, respectively, depicted in the series of steps shown in the XRD data. The average size and the size distribution of the crystals were measured on SEM images of the heat-treated samples, using ImageJ software to distinguish between different crystal phases. The average size of the PbSe crystals in the lab melt sample is ~2.96x (lab melt = 267.89 ± 20.34 nm, commercial melt = 90.93 ± 21.16 nm) of the average PbSe crystal in commercial melt for the same heat-treatment conditions (temp/times), while the As
2Se
3 crystal size in commercial melt is ~1.72x (lab melt = 91.56 ± 16.89 nm, commercial melt = 157.93 ± 24.56 nm) that of lab melt under the same conditions. The large error bars for the data are due to the error in manually measuring the crystallite size in ImageJ software, which relies on visual estimation. This variation in crystal size and (apparent) growth rates between the two materials might be expected, as the Pb-containing phases in the lab melt are isolated in the droplets of the phase separated glass and not in the homogeneous plate where all four glass constituents are uniformly spatially dispersed. Here, the thermal energy during the nucleation and growth goes to crystallize the more (prone to crystallization) susceptible phases first, that being the PbSe-containing crystallites. In the homogeneous plate, there is little activation energy barrier difference, which results in crystallization of As
2Se
3 phase first, followed by crystallization at high temperature for Pb-rich phases. The difference in the average crystal size also gives us an indication about the preferred crystal phase in-between the two glasses as the phase that nucleates (forms) first, starts growing first, and thus, for a fixed time, would be larger in size.
Figure 4e shows the variation in the size distribution of the As
2Se
3 and PbSe crystals phases in the two glasses based on exposure to the same heat-treatment protocol. In the commercial melt, the As
2Se
3 is present across the sample, whereas in the lab melt, the PbSe-containing crystal phase(s) are predominant. Therefore, the commercial melt with the overlaid growth and nucleation curve (homogeneous plate) has a broader size distribution of As
2Se
3 crystals as nucleation and growth of this dominant phase is believed to be occurring concurrently. The onset of formation and growth of Pb-containing phases is seen to occur earlier and faster in the droplet containing phase-separated material, resulting in a broader size distribution in the lab melt samples as compared to that of the commercial melt.
How this microstructure evolution translates to changes in mechanical properties of the resulting GC is the primary thesis of this work. Hence, these crystallites and their ability to impart changes to crack formation and propagation, will depend on their type and quantity throughout the residual glass matrix.
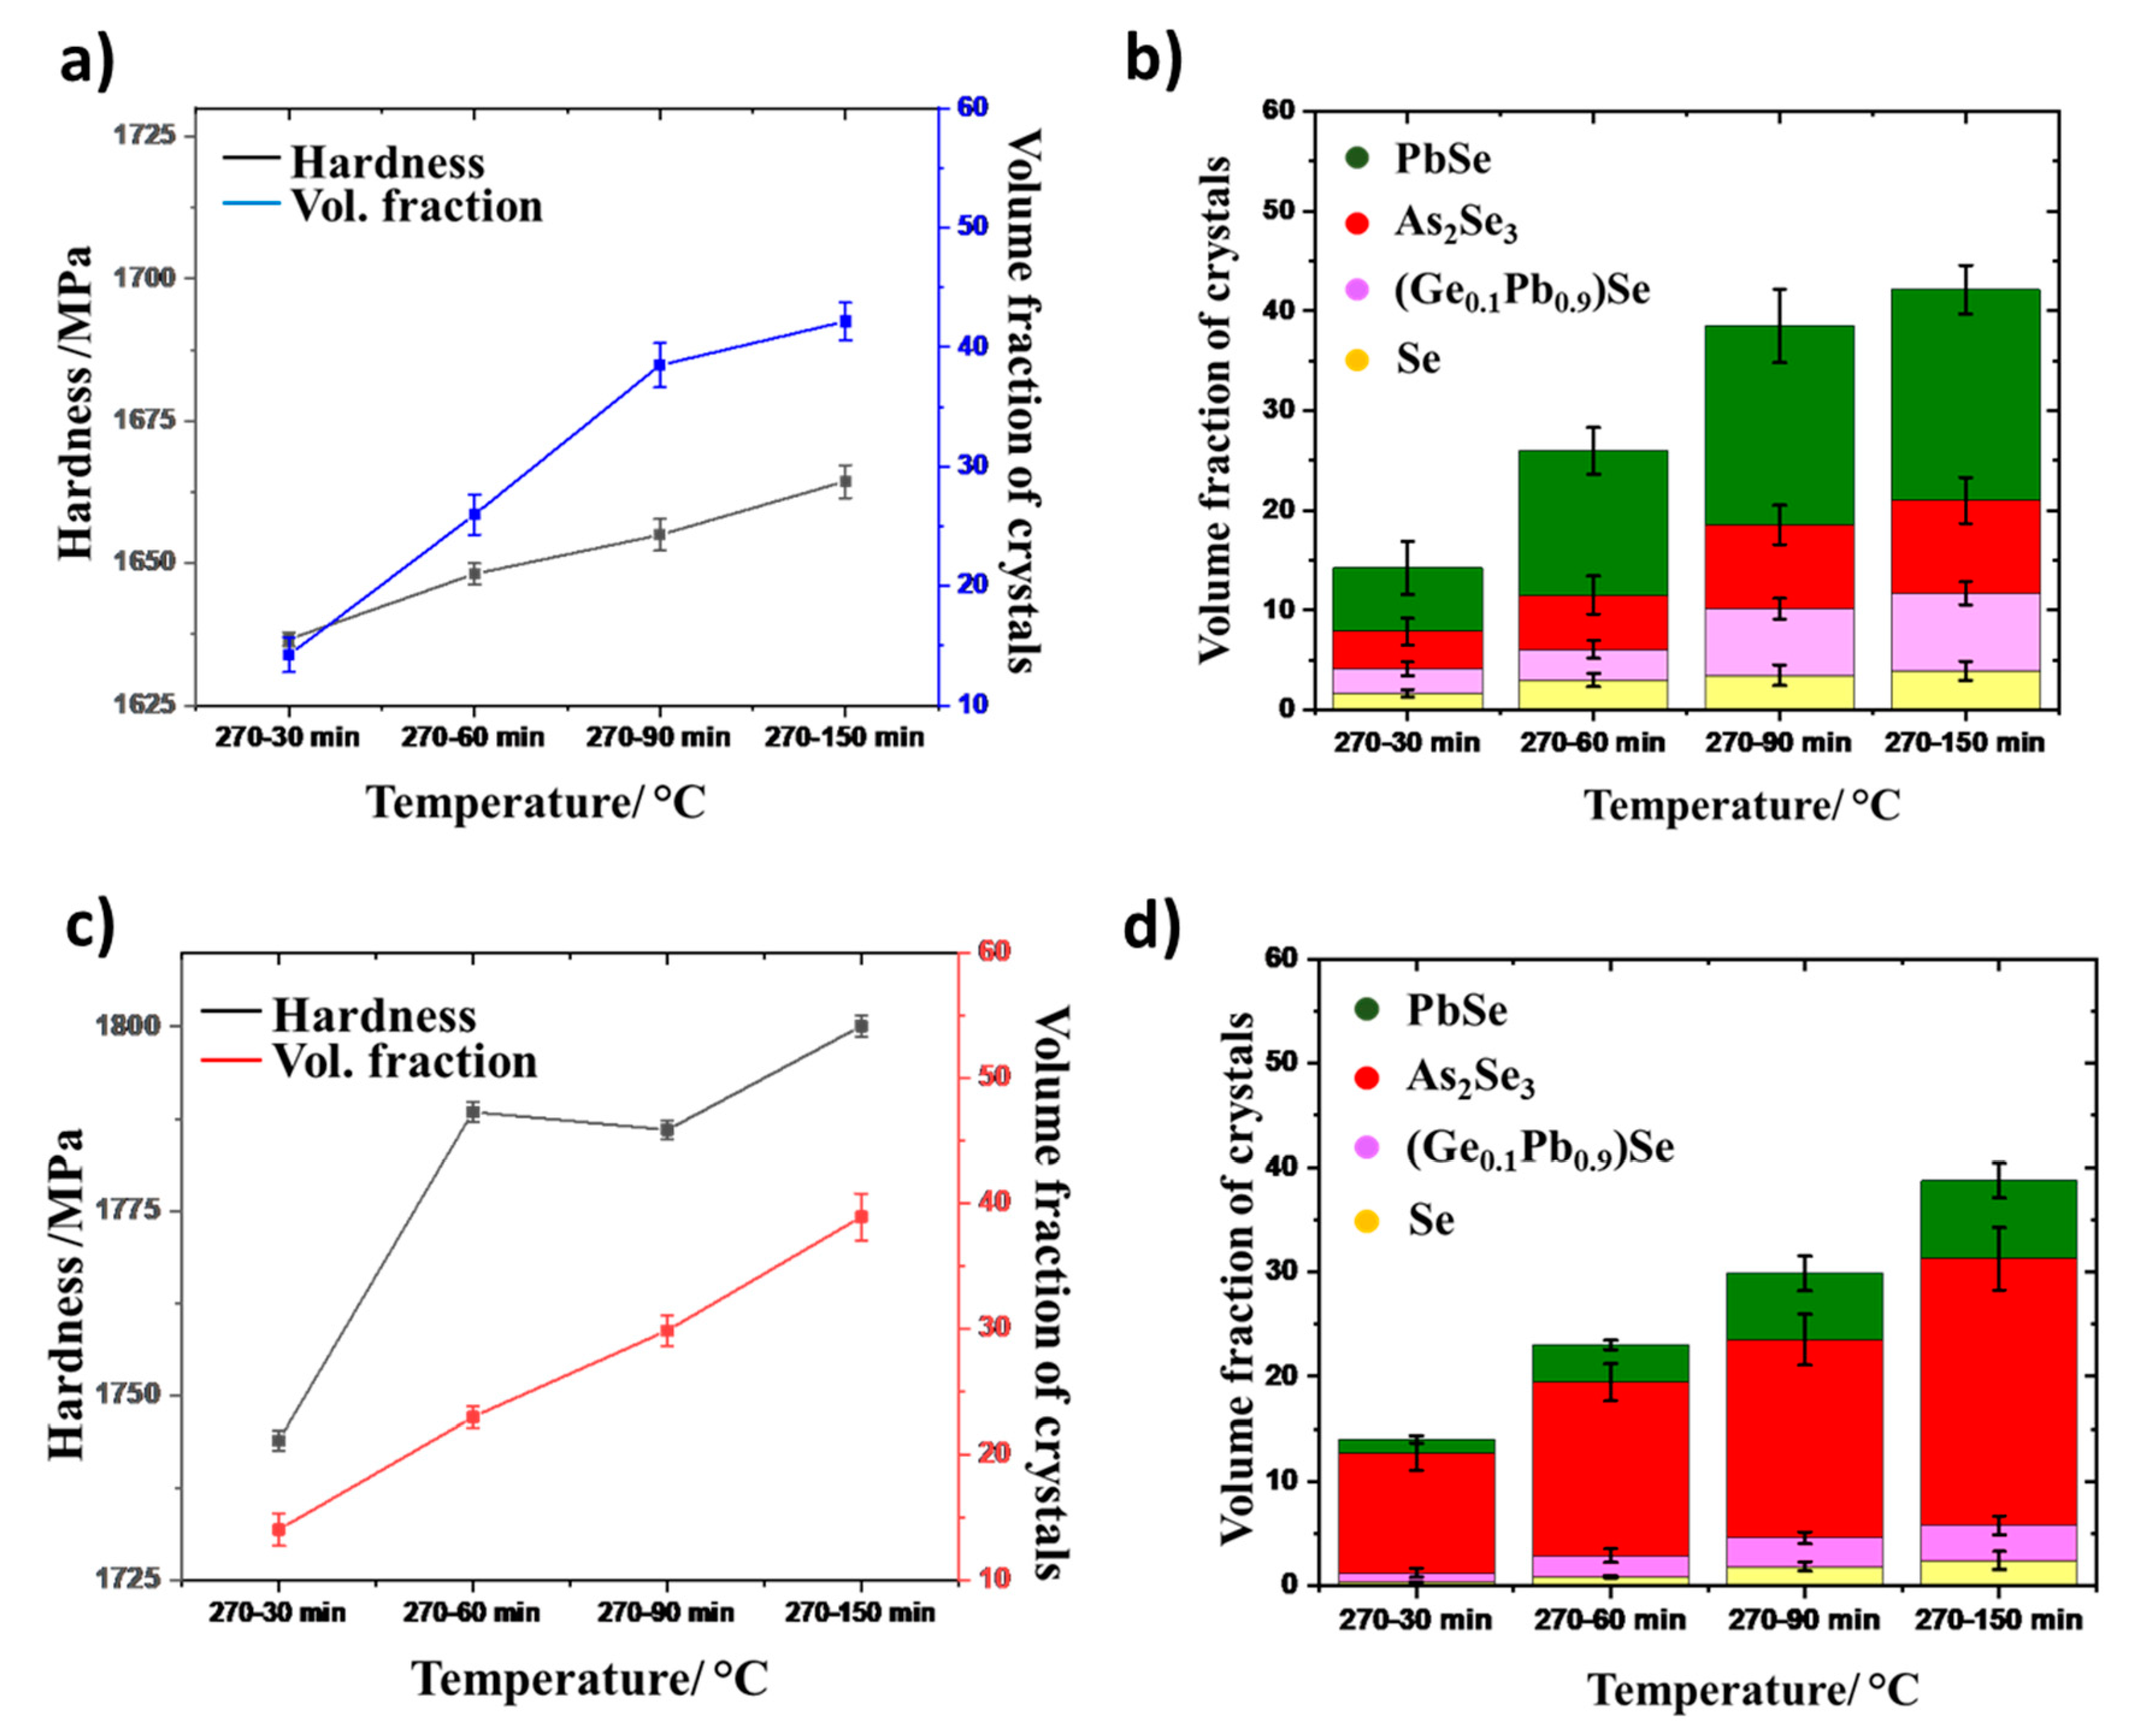
Figure 5a,c illustrates a correlation between the Vickers hardness and the volume fraction of the crystalline phases in the lab melt and commercial melt, respectively. An increase in hardness was observed in both lab and commercial melts as the crystallization progressed towards an extended period of 150 min. The heat-treatment at 270 °C (150 min) results in nearly 40% of the parent glass (for both lab and commercial melt) being converted to crystallite-containing glass (i.e., a GC). This conversion results in a modified residual glass matrix chemistry, depleted of these crystal- forming constituents. While similar, as shown below, the types and fractions of the formed crystals (and thus depleted species) were not identical in the two glasses. In the lab melt, a slight increase in hardness was observed during this extended heat-treatment at 270 °C (150 min).
In the post-heat-treated lab-melt data in
Figure 5b, crystallization of both the cubic Pb-rich phases and As
2Se
3 phases were observed during the 30–60 min heat-treatments. However, during the extended (90 additional minutes) heat treatment, an increase of only the Pb-rich phases was observed, suggesting a significant depletion in the early forming As-species in the matrix.
Figure 5b also corroborates the fact that after 60 min, a consistent crystallization of the Pb-rich phase was observed. Converse to these observations in the commercial melt, the anisotropic As
2Se
3 phase is the dominant phase contributing to the initial increase in hardness and total volume fraction of crystals formed (at 30 and 60 min), but after ~60 min, the PbSe and (Ge
0.1Pb
0.9)Se phase fractions appears to grow at a more rapid rate than the (perhaps) depleted As-containing phase. Since hardness does not appreciably increase in this window, and instead the volume fraction of cubic crystals continues to increase, this validates the assumption that the crystal phase responsible for the hardness increase is dominated by the anisotropic crystalline phase and is changing with time as shown in
Figure 5d. The volume fraction of various heat-treated sample is also shown in
Supplementary Information, Table S1.
These findings support our hypothesis that as the As is initially partially depleted during As
2Se
3 formation, it is subsequently thus easier for Se to now participate in crystal formation of Pb-containing phases rather than ‘finding’ As available for further crystallization. Stoichiometrically, this makes sense as the number of atoms needed to form the crystal are greater (2-As and 3-Se) versus 1 Pb and Se in the cubic crystals. Se tends to crystallize (as it is present in excess) in small amounts initially but at a much more extensive rate later in the heat-treatment process. The enthalpy of formation (ΔH
f) of the major crystalline phases As
2Se
3 (−83.7 kJmol
−1) [
55] and PbSe (−96.3 kJmol
−1) [
56] measured via drop calorimetry at 298 K, also supports the proposed mechanistic evolution of species available to participate most easily (lowest activation energy barrier) for crystallization.
Figure 6a depicts the change in hardness measured in both the droplet-free (DFPG) commercial melt and the PSPG lab melt glasses, with each iteration of heat treatment. At first, the hardness of the heat-treated lab melt GC increased consistently until 270 °C, 30 min, due to formation of both Pb-rich (major phase) and As
2Se
3 (minor) crystallites. However, with extended heat-treatment beyond this time, only a small increase in hardness was observed. This can be explained by the presence of cubic Pb-rich crystallites as the principal secondary phase. The presence of a high concentration of large cubic crystallites can result in an increase in residual stresses, causing strength degradation in GCs. However, no evidence of stress-induced birefringence was ever observed in these GCs. The homogeneous droplet-free commercial melt on the other hand achieved a maximum hardness at a growth temperature of 270 °C for 60 min. For the same times and temperature, this corresponds to a hardness increase of ~1.1x times that seen in the lab melt. However, with further treatment up to 150 min at 270 °C, only a slight increase (within one standard deviation) in the hardness was observed, and further hardness changes reached a plateau. This further substantiates our interpretation that constituents available to form (nucleate) new crystals may be depleted at this point and any further heat-treatment only results in existing crystal growth. The improved hardness in the commercial melt over that seen in the lab-melt can be attributed to the presence of a greater quantity of needle-shaped As
2Se
3 crystallites as the major secondary phase in the GC. The needle-shaped crystallites on their own, and upon extensive growth into clusters, can form interlocking microstructure inside the glass matrix, therefore slowing and/or preventing the crack propagation.
Figure 6b shows the change in Young’s modulus in the two samples post heat-treatment. The extended heat-treatment of the commercial melt also resulted in a ~1.1x increase at 270 °C for 150 min. In both the commercial melt as well as the lab melt, a consistent increase in Young’s modulus was observed, likely due to the increase in volume fraction crystals generated, at the expense of the parent glass phase.


