A Hybrid Dispatch Strategy Based on the Demand Prediction of Shared Bicycles

 , ,
, ,  and
and
Abstract
:1. Introduction
- It is an utter green path that can reduce environmental effects, regulate air pollution, and effectively save money. There are no exhaust emissions that are dangerous for the atmosphere without fossil fuel consumption. Since cycling is a form of physical practice, both the community and users benefit from the shared bicycle.
- For the last mile journey, it provides the perfect solution. Actually, on long-distance journeys, many citizens do not prefer cycling today. However, given that, in most instances, the range of metro or bus stations and commercial or residential communities is not that long, shared bicycles are most cost-efficient and suitable for people for short distances.
- The urban market is a typical example of public resource-shared operation, capable of improving the cycling usage rate. Today, increasing numbers of people favor shared bicycles than their conventional private bicycles. The traffic pressure will, therefore, be helpful.
2. Related Work
3. Models and Preliminaries
3.1. System Models
- Reduce scheduling work and time;
- Alleviate cycling mess;
- Boost users’ satisfaction with using shared bicycles.
- The number of bicycles initially in station i at time t is defined as ;
- The Demand of station i in next period predicted at time t is defined as .
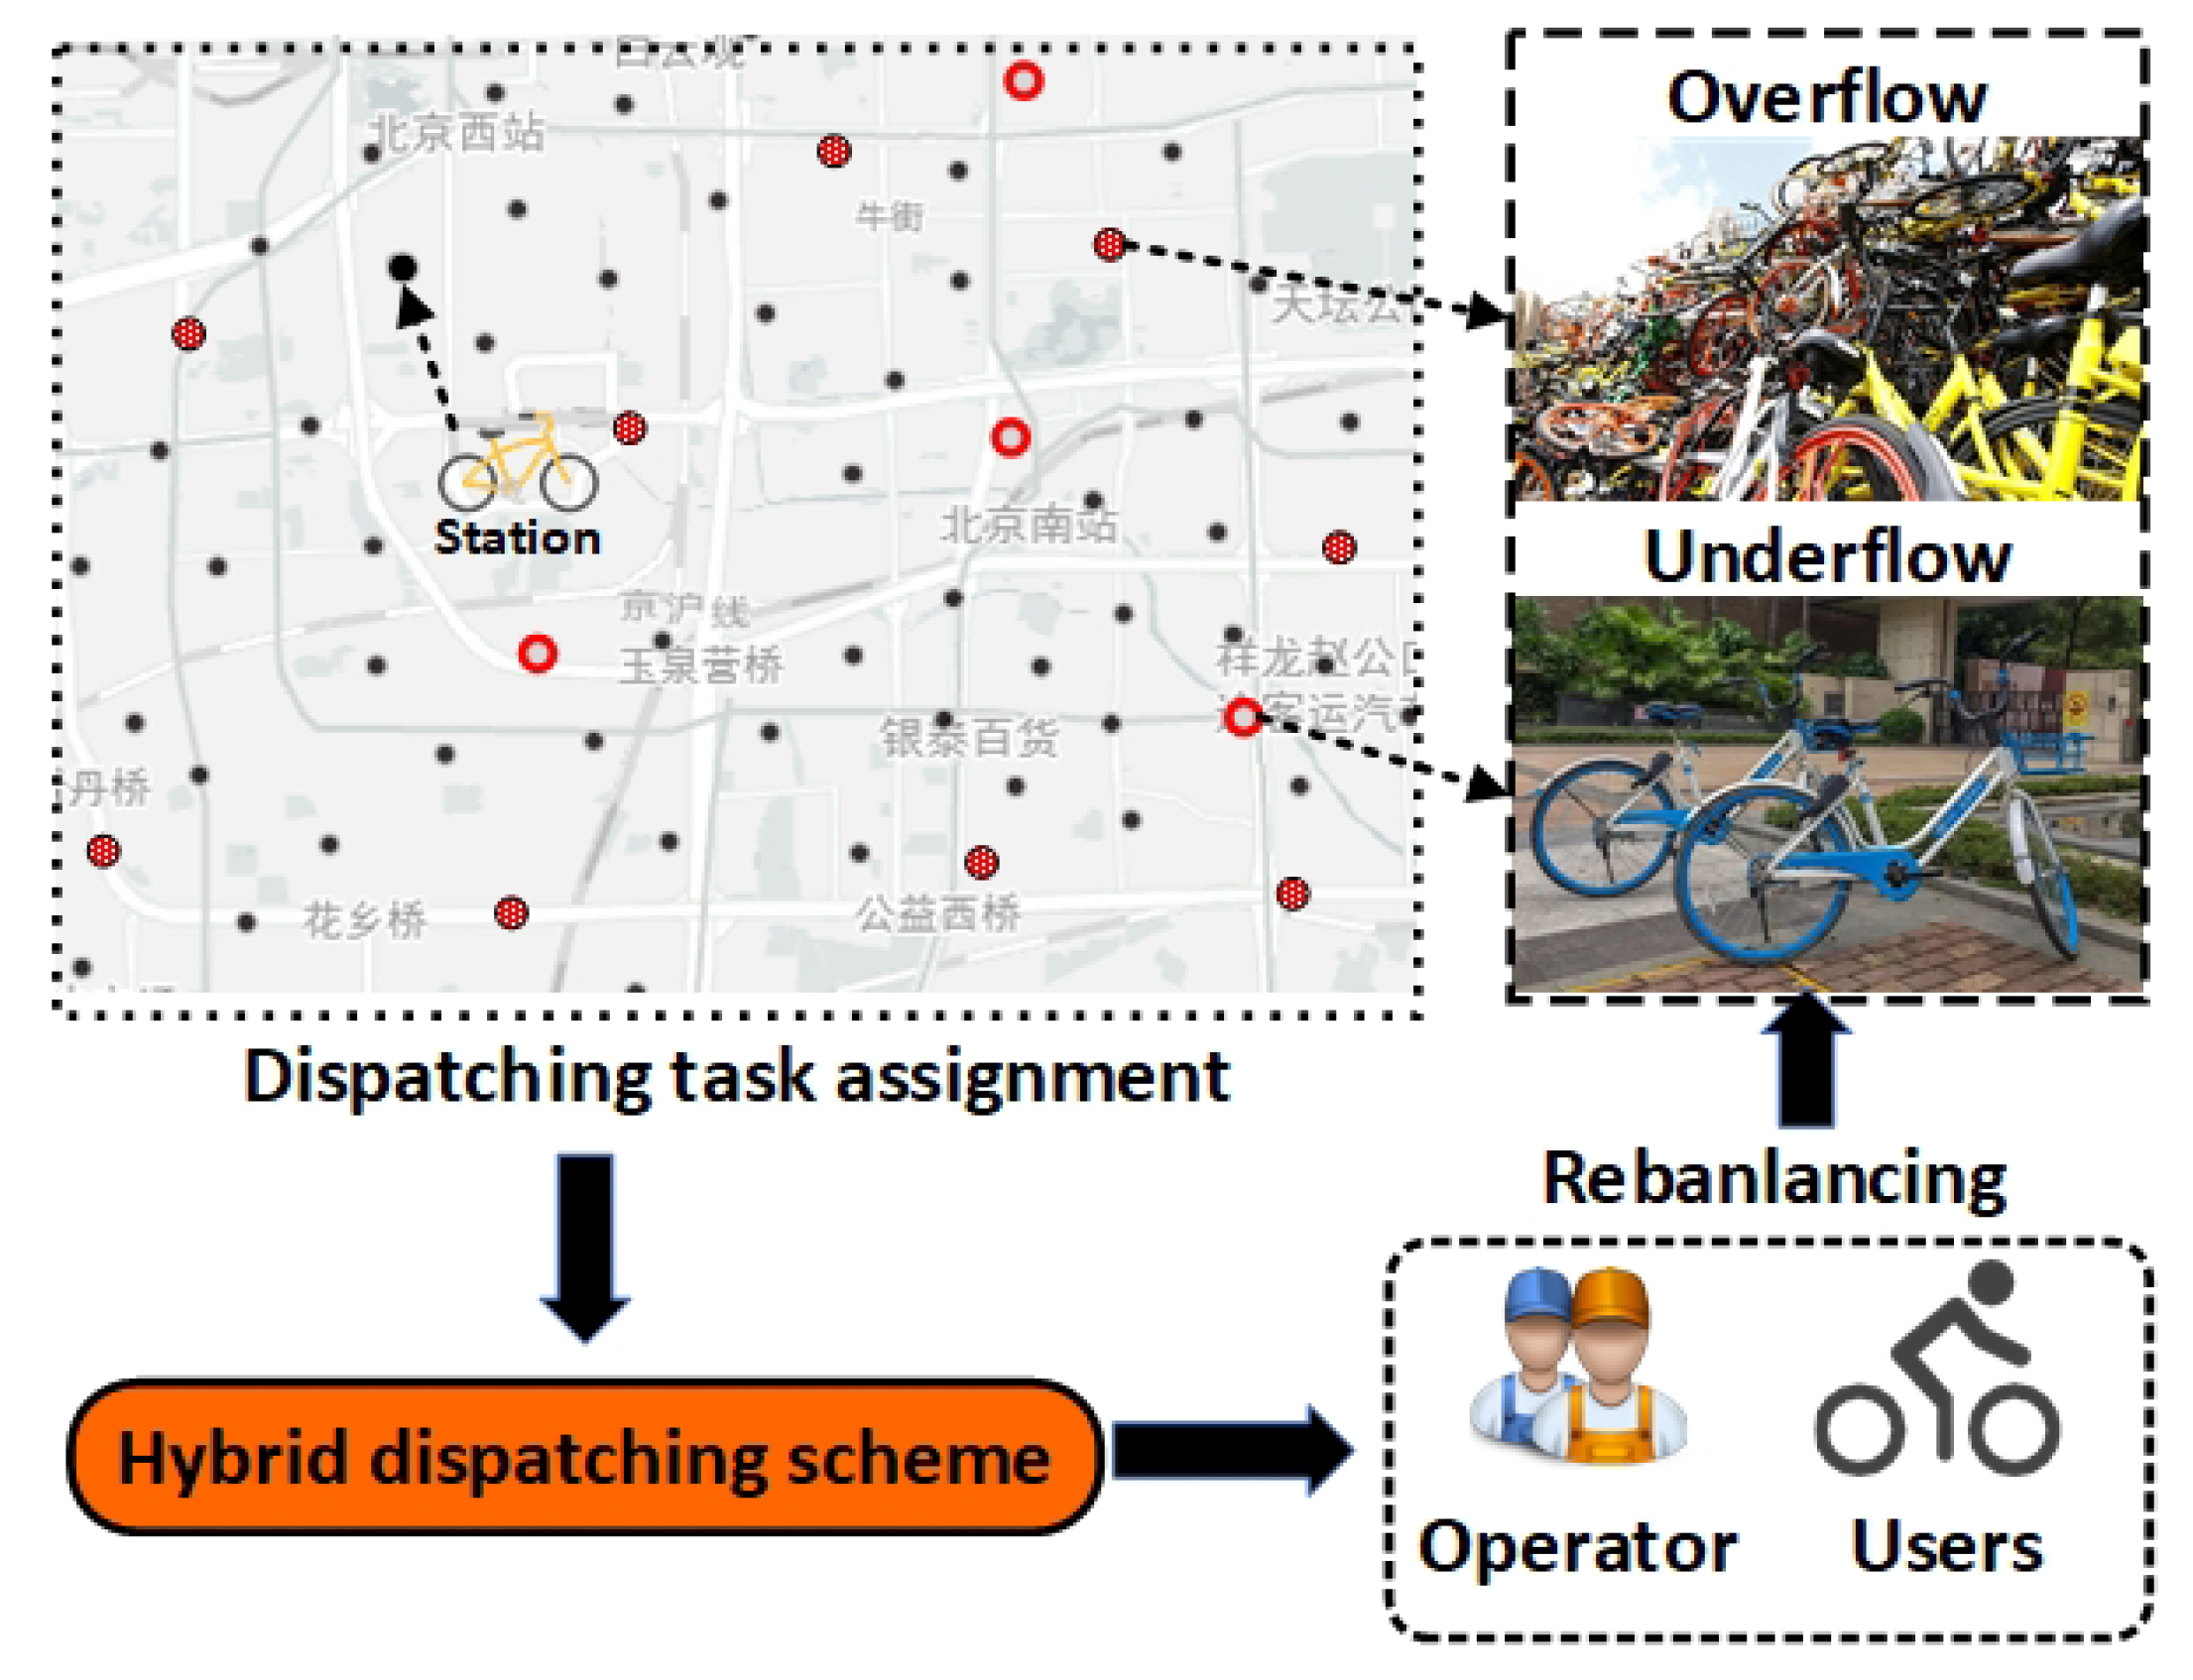
3.2. Main Idea
- It ignores the time gap between arrival and departure of a bicycle at time t, and assumes that the departure time of a bicycle at a travel station is unified at the beginning of time t, and then reach the destination at the end of time t, during which the bicycle is independent of all the stations.
- It assumes that, during manual dispatching, the bicycle leaves the travel point at the beginning of time t, and then arrives at the destination at the next moment.
- It assumes that the revenue and cost of the operator only come from three parts: the charge for bicycle riding, the cost for manual dispatching, and the cost for user incentive dispatching.
- It assumes that the dispatching of shared bicycles is only carried out within the research region, and will not involve places outside the research region.
4. Hybrid Dispatching Scheme
4.1. Manual Dispatching Scheme
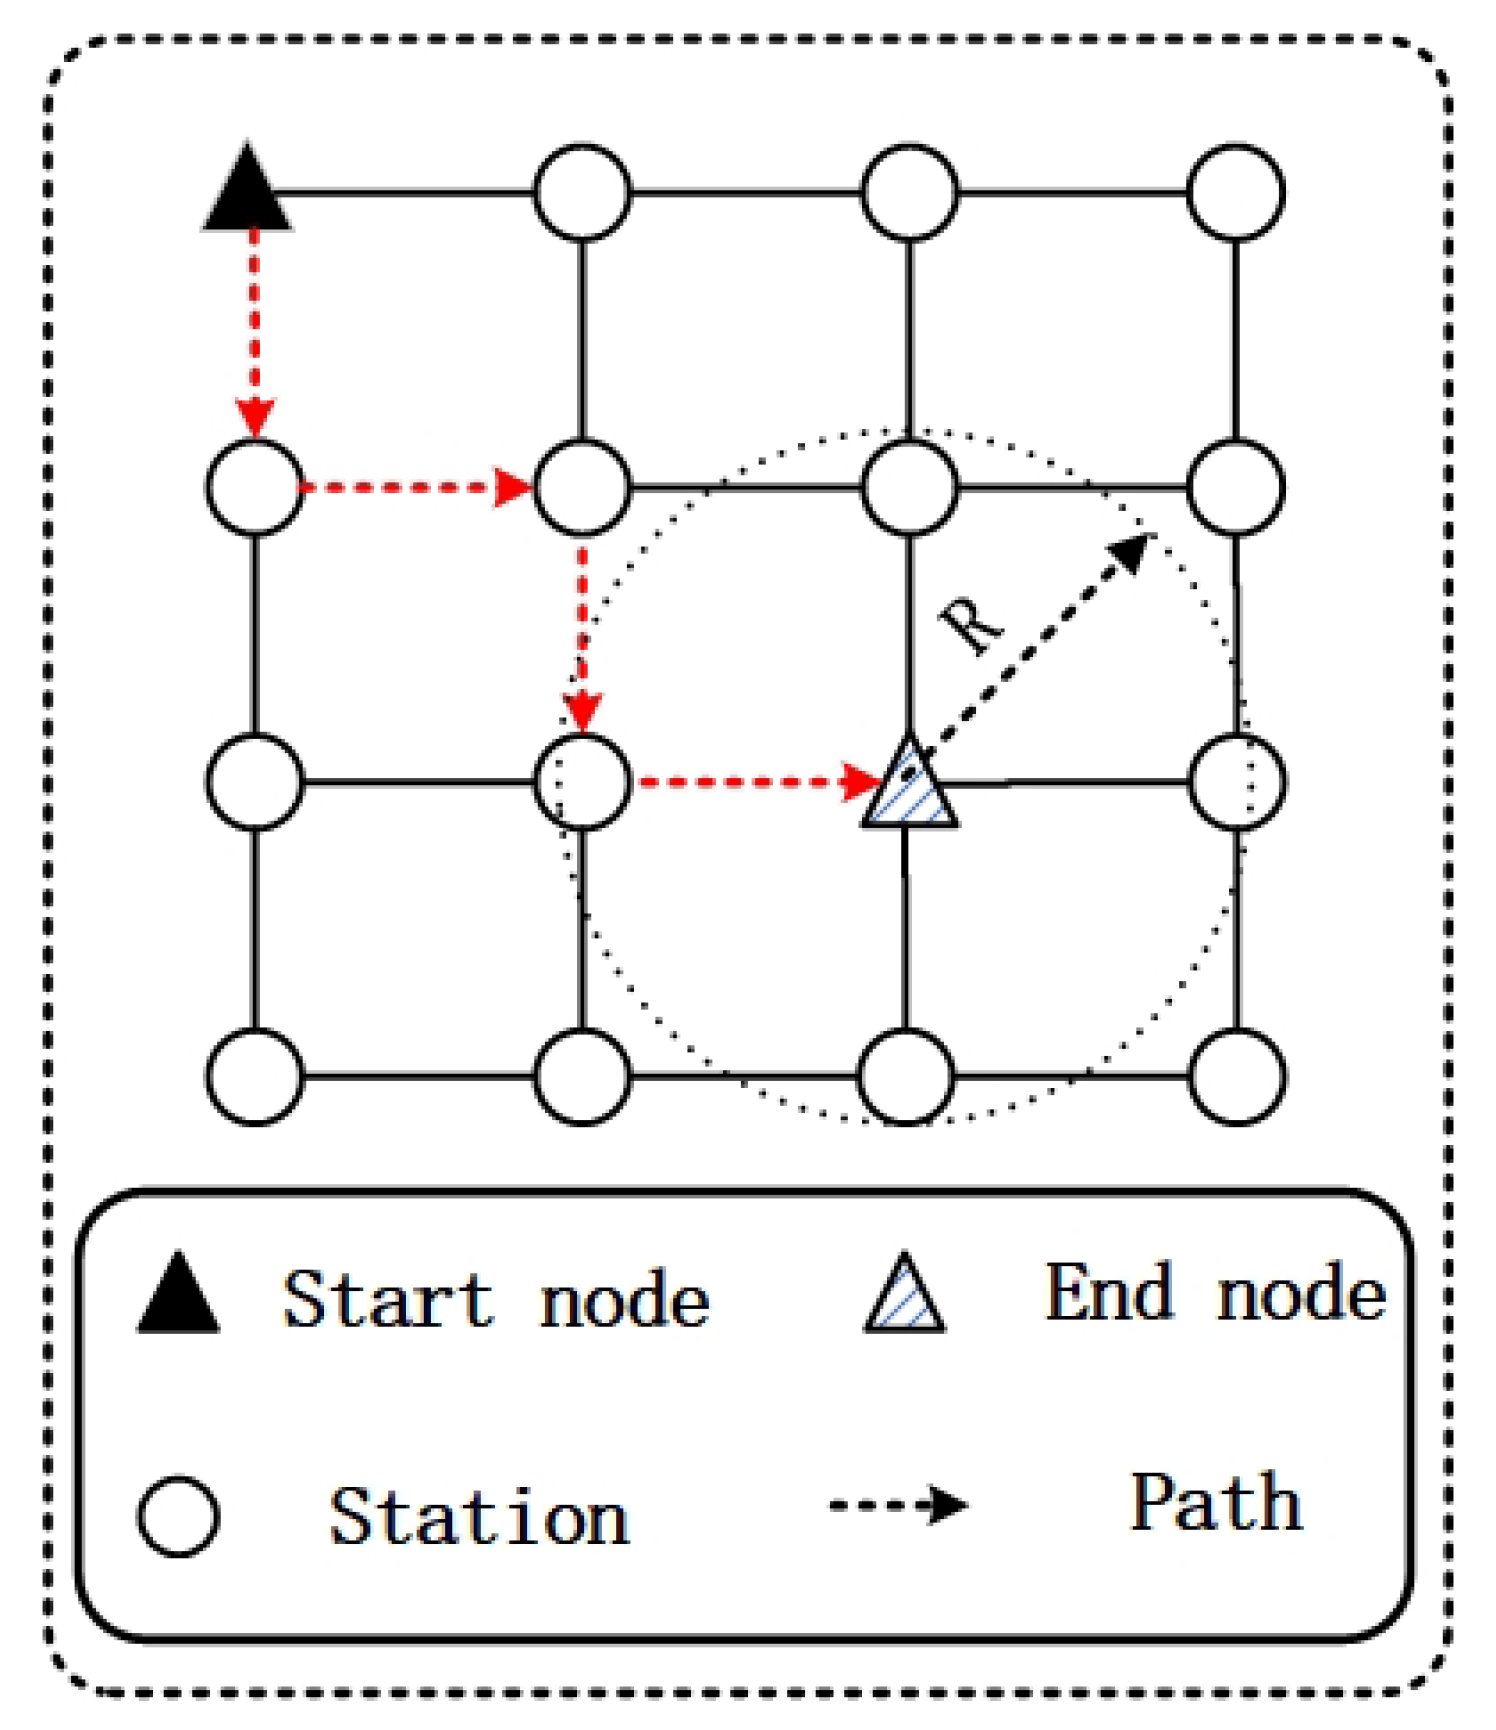
- The first is to select a better dispatching endpoint in the dispatching region;
- The second is to choose the optimal route between the start and end of dispatching.
- (1)
- The selection of dispatching endpoint: As mentioned earlier in our work, we use greedy idea to ensure that the total imbalance of station at the next moment in the future within IoSB is minimized. Therefore, when selecting the endpoint in each manual dispatching, we can select the station with the most imbalance in IoSB, in order to achieve a rebalancing of the station. However, there is still a problem that needs to be considered in which bicycles in a single station will randomly move in the R field of the station, which makes it difficult to select the endpoint for manual dispatching. In the paper, we choose the sum of the imbalances of all stations in the range of R at time t from a station as the basis for selecting the endpoint of manual dispatching, which is and its definition is shown in Formula (5):
- (2)
- The determination of dispatching path: After solving the problem of dispatching endpoints, we need to figure out the route within manual dispatching. The truth is that the cost of manual dispatching is mainly related to the dispatching distance and the farther dispatching distance bring higher dispatching cost. Therefore, when seeking the optimal path, we give priority to the imbalance and distance of the stations. The weight in the undirected graph that is related to distance and imbalance of station is defined as the basis for route optimization. Finally, the Dijkstra algorithm is used to figure out the optimal path of manual dispatching. The details of manual dispatching are shown in Algorithm 1.
| Algorithm 1 |
| Input: The state information of all nodes in STG right moment , the station number to be dispatched , the number of bicycles to be dispatched k. Output: Dispatching path , bicycles assignment .
|
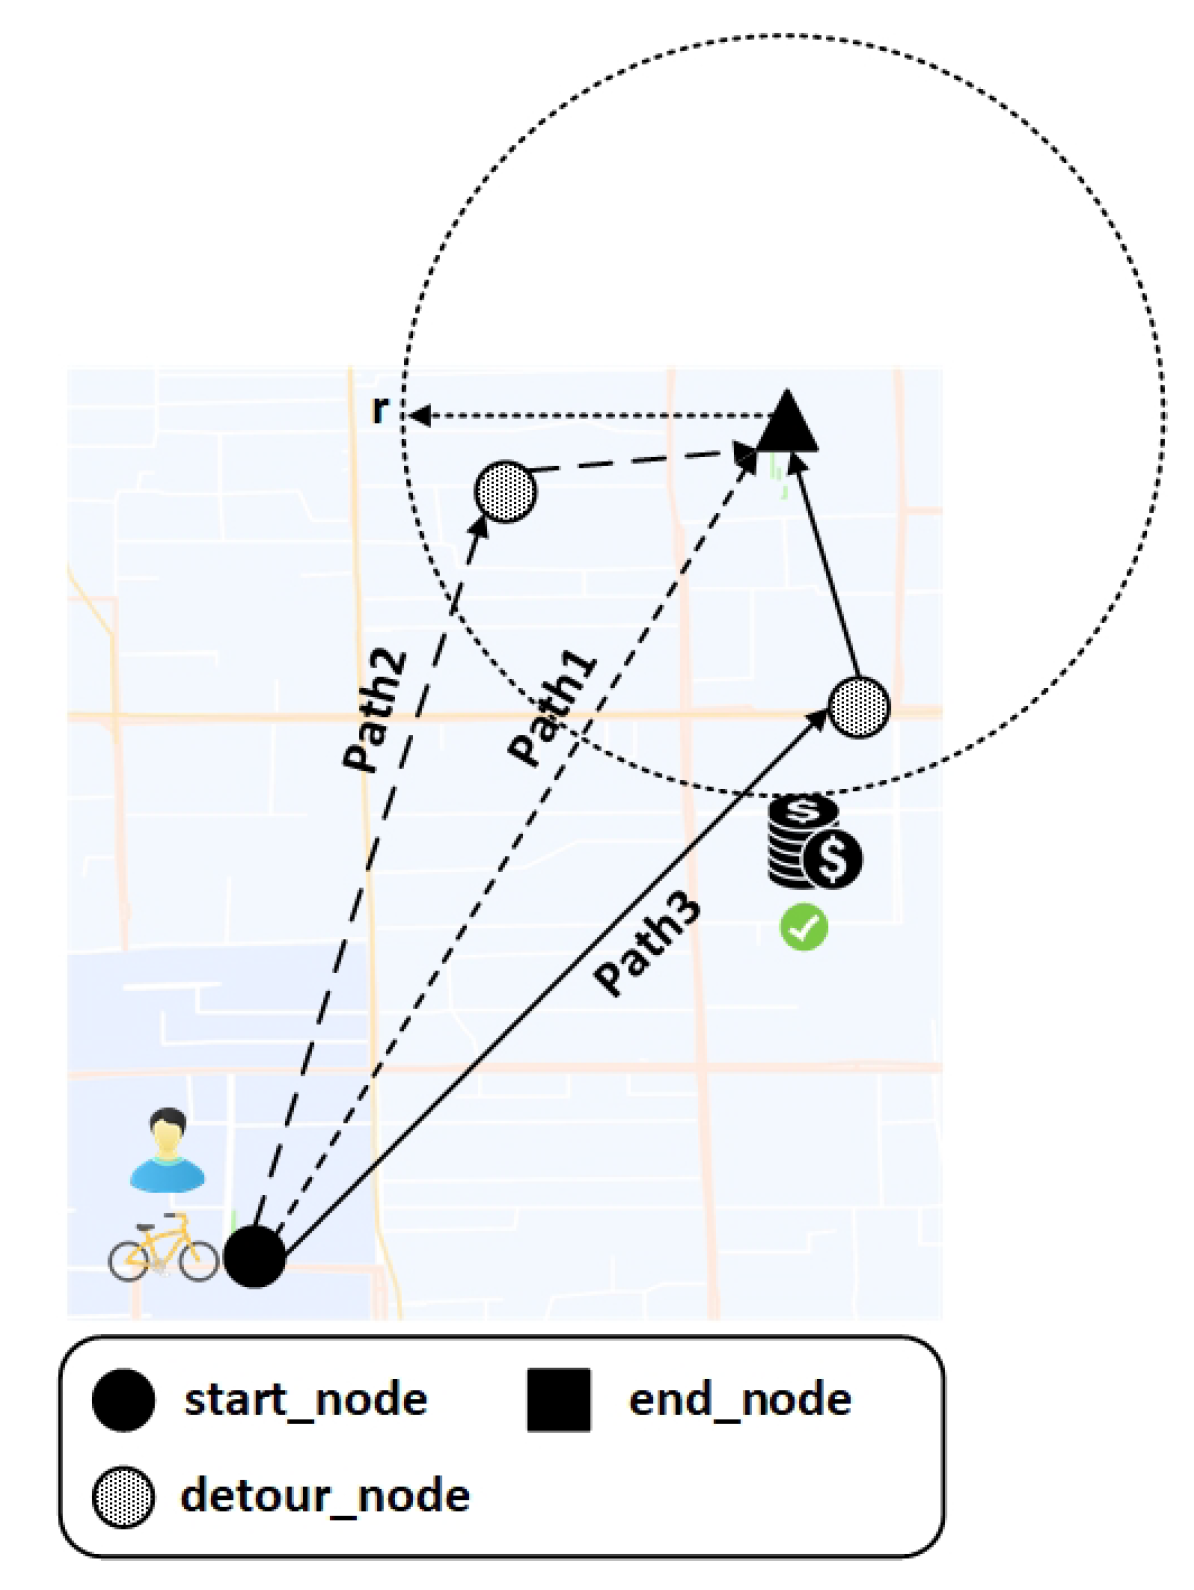
4.2. User Incentive Scheme
- The first is how to devise effective incentive strategy to encourage users to accept the Crowdsourcing dispatching task;
- The second is how to choose the target station of the detour to make the distribution of bicycle more balanced and reasonable.
| Algorithm 2 |
| Input: The state information of all nodes in STG right moment , the destination of the current user . Output: Recommended detour node for user.
|
5. Experiment
5.1. Experiment Preparation
- (1)
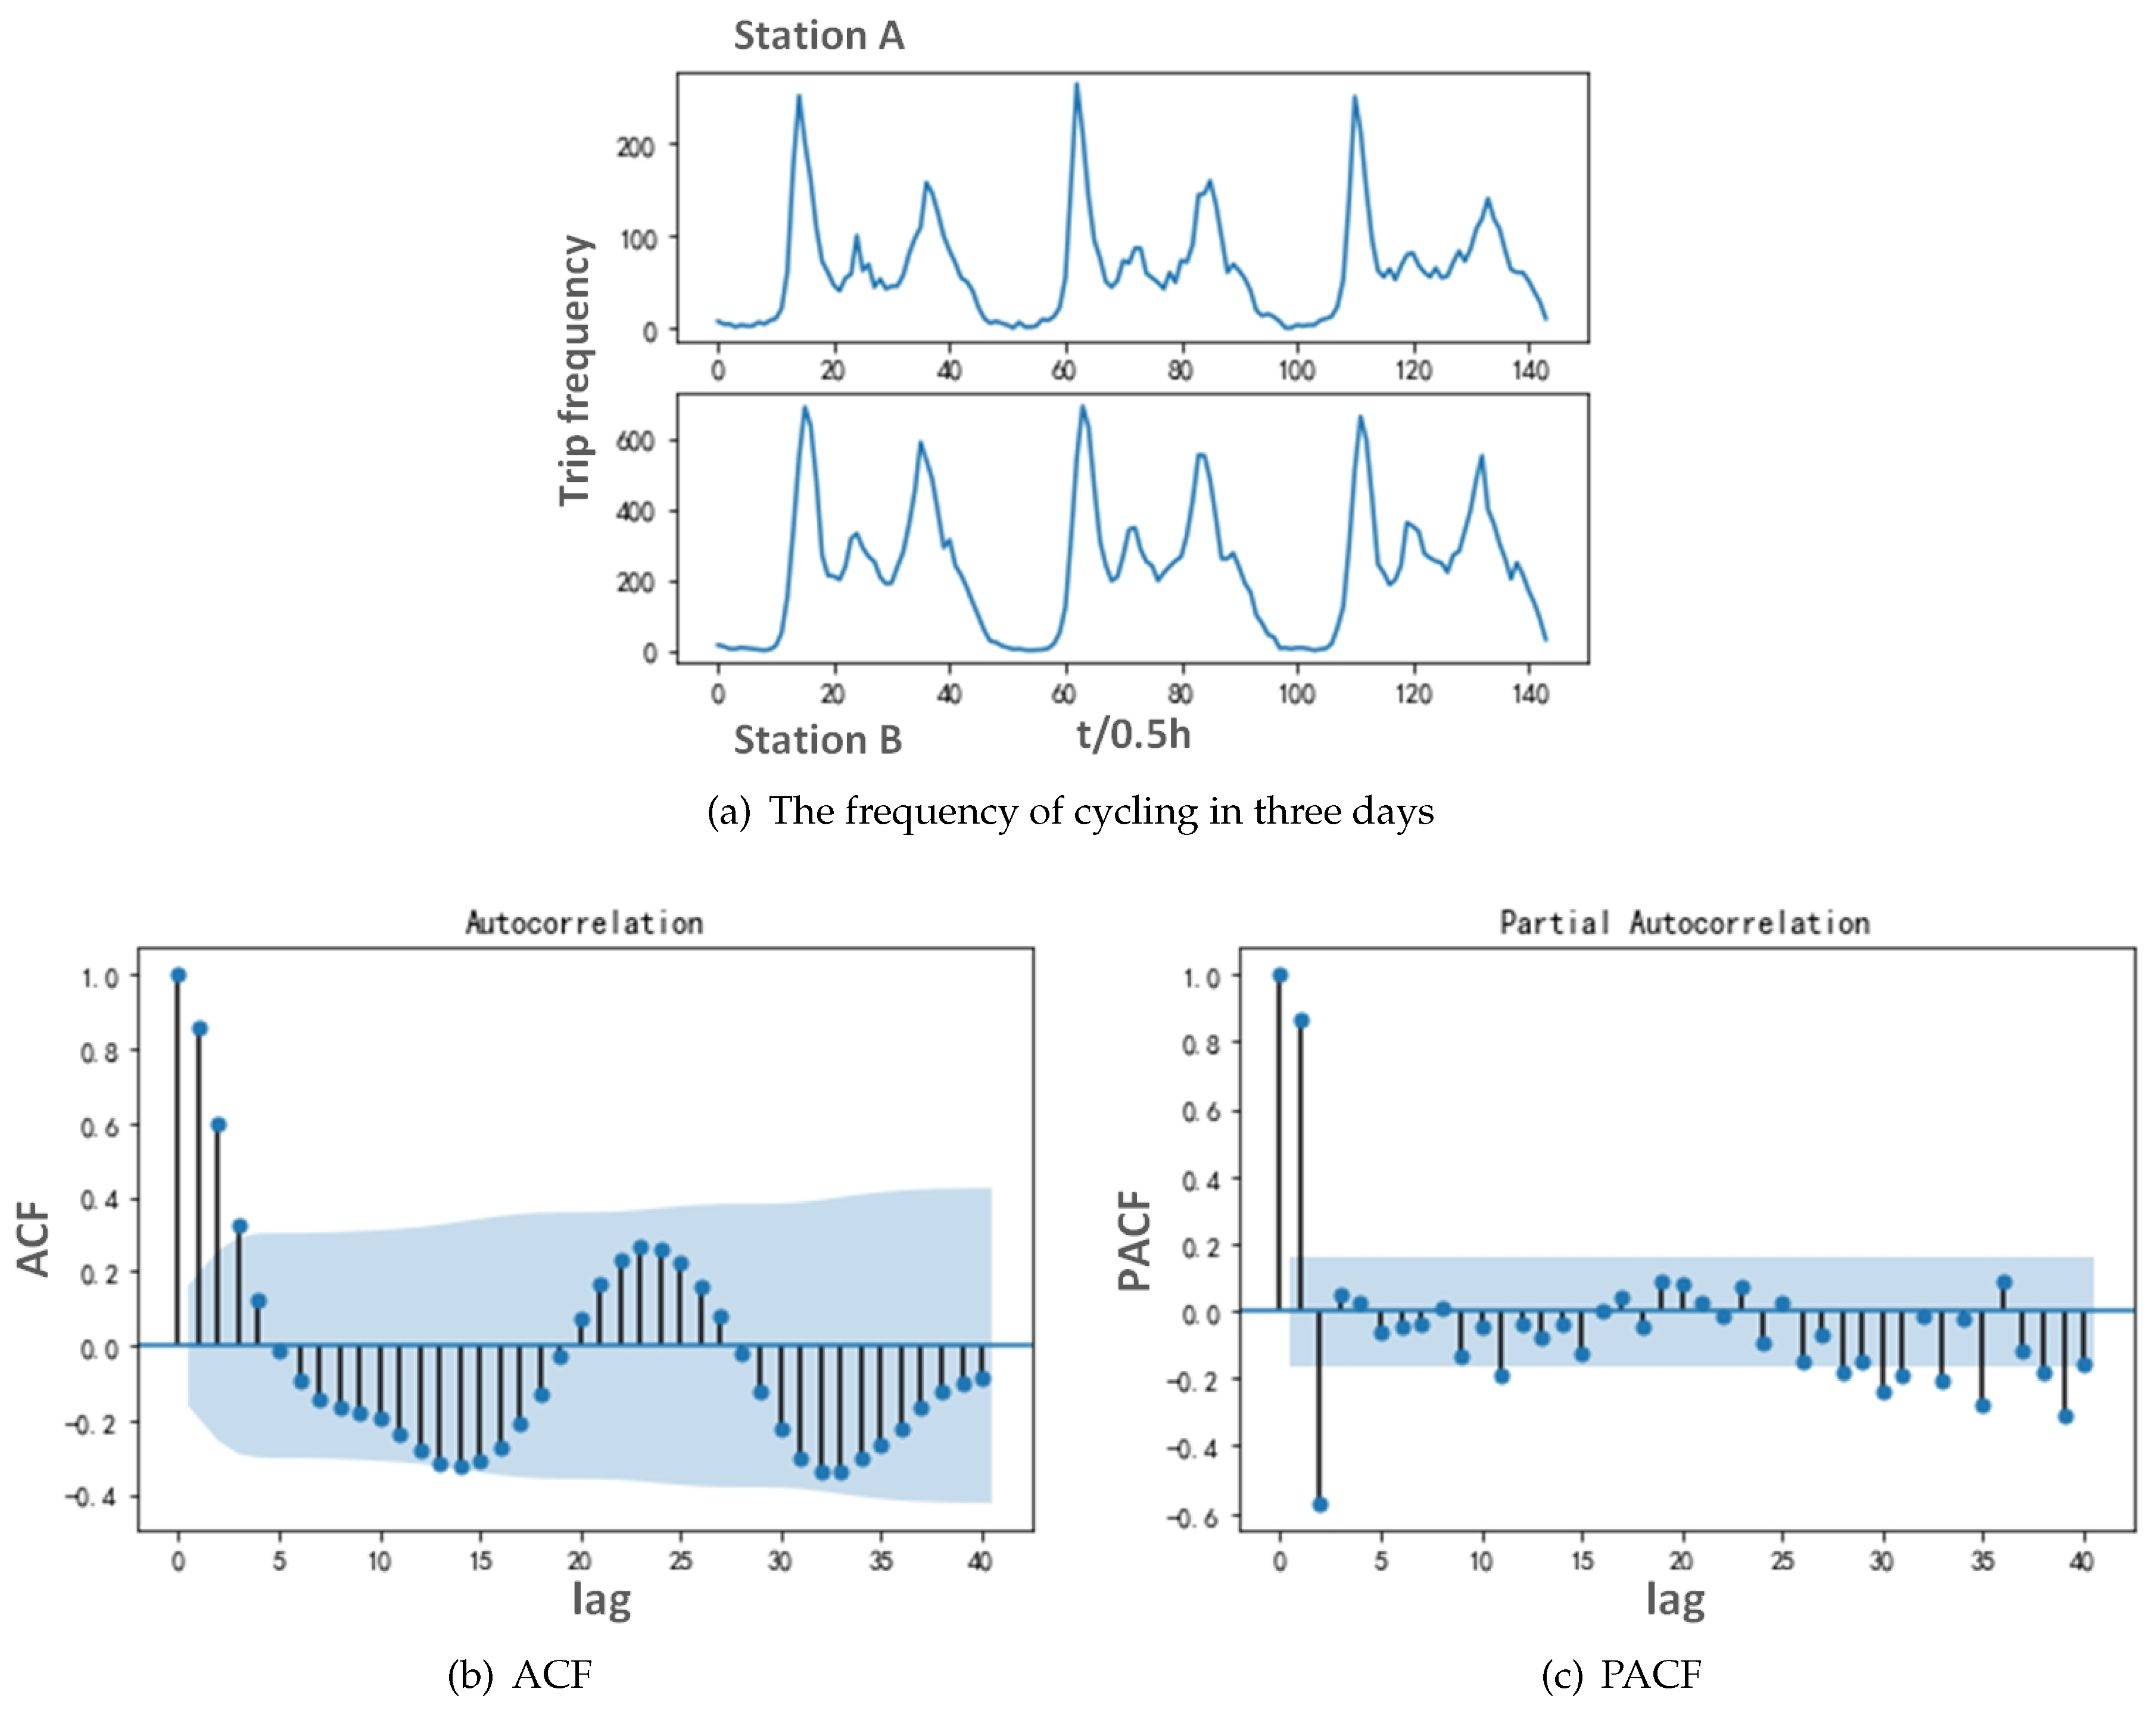
- Stationary correction of the trip data: The premise of ARMA is that the series are stationary, which means that the statistical characteristics (mean, variance, correlation, etc.) will not change with different time Windows, and the mathematical expression is the same joint distribution. As shown in Figure 6a, we can determine that the trip record is a stationary sequence.
- (2)
- Test of white noise: Next, we will judge whether the original sequence is white noise or not. If it is white noise, then the sequence is random disturbance, which cannot be predicted and used. The sequence is white noise in three conditions as follows:We utilize the Ljung–Box test to judge the white noise. By calculation, we get that p = 1.47620 × when values are up to the lag of h. As a result, we can reject the original hypothesis and assume that the sequence is not a white noise sequence.
- (3)
- Determination of time series lag: Auto-Correlation Factor (ACF) and Partial Auto-Correlation Factor (PACF) are utilized to determine the order of the model. As shown in Figure 6b,c, the appropriate lags of p and q in ARMA model both are 2.
5.2. Results and Discussion
6. Conclusions
Author Contributions
Funding
Acknowledgments
Conflicts of Interest
References
- Midgley, P. Bicycle-Sharing Schemes: Enhancing Sustainable Mobility in Urban Areas. Technical Report, Global Tranport Knowledge Partnership & International Road Federation. 2011. Available online: http://10.10.254.10/cache/3/03/www.un.org/6c48ce0251b0cfe3605d275f9709807e/Background-Paper8-P.Midgley-Bicycle.pdf (accessed on 12 June 2018).
- DeMaio, P. Bike-sharing: History, Impacts, Models of Provision, and Future. J. Public Transp. 2009, 14, 41–56. [Google Scholar] [CrossRef]
- DeMaio, P.; Gifford, J. Will Smart Bikes Succeed as Public Transportation in the United States? J. Public Transp. 2004, 7, 1–15. [Google Scholar] [CrossRef] [Green Version]
- Midgley, P. The Role of Smart Bike-sharing Systems in Urban Mobility. In Journeys; Red Avocado Film: Hochberg, Germany, 2009; pp. 23–31. [Google Scholar]
- Shen, S.; Wei, Z.Q.; Sun, L.J.; Su, Y.Q.; Wang, R.C.; Jiang, H.M. The Shared Bicycle and Its Network-Internet of Shared Bicycle (IoSB): A Review and Survey. Sensors 2018, 18, 2581. [Google Scholar] [CrossRef] [PubMed] [Green Version]
- OFO Bicycles. Available online: http://m.ofo.so/ (accessed on 12 June 2018).
- Mobike Bicycles. Available online: https://mobike.com/cn/classic/ (accessed on 12 June 2018).
- Sha, C.; Qiu, J.M.; Li, S.Y.; Qiang, M.Y.; Wang, R.C. A type of low-latency data gathering method with multi-sink for sensor networks. Sensors 2016, 16, 923. [Google Scholar] [CrossRef] [PubMed]
- Sha, C.; Zhong, L.H.; Bian, Y.; Song, D.D.; Ren, C.H. A type of energy-efficient target tracking approach based on grids in sensor networks. Peer Peer Netw. Appl. 2019, 12, 1041–1060. [Google Scholar] [CrossRef]
- Jefri, N.N.N.B.; Anuar, K.; Arjunan, S. Real Time Indoor Measurement of 2G, 3G and LTE Mobile Networks in Malaysia. In Proceedings of the 2016 IEEE 3rd International Symposium on Telecommunication Technologies (ISTT), Kuala Lumpur, Malaysia, 28–30 November 2016; pp. 19–24. [Google Scholar]
- Raza, U.; Kulkarni, P.; Sooriyabandara, M. Low Power Wide Area Networks: An Overview. IEEE Commun. Surv. Tutor. 2017, 19, 855–873. [Google Scholar] [CrossRef] [Green Version]
- Ratasuk, R.; Mangalvedhe, N.; Zhang, Y.; Robert, M.; Koskinen, J.P. Overview of Narrowband IoT in LTE Rel-13. In Proceedings of the 2016 IEEE Conference on Standards for Communications and Networking (CSCN), Berlin, Germany, 31 October–2 November 2016. [Google Scholar]
- Anand, S.; Regi, R. Remote Monitoring of Water Level in Industrial Storage Tanks Using NB-IoT. In Proceedings of the 2018 International Conference on Communication Information and Computing Technology (ICCICT), Mumbai, India, 2–3 February 2018. [Google Scholar]
- Shi, J.; Jin, L.; Li, J.; Fang, Z. A Smart Parking System Based on NB-IoT and Third-party Payment Platform. In Proceedings of the 2017 17th International Symposium on Communications and Information Technologies (ISCIT), Cairns, Australia, 25–27 September 2017. [Google Scholar]
- Zhang, H.; Li, J.; Wen, B.; Xun, Y.; Liu, J. Connecting Intelligent Things in Smart Hospitals using NB-IoT. IEEE Internet Things J. 2018, 5, 1550–1560. [Google Scholar] [CrossRef]
- Chemla, D.; Meunier, F.; Calvo, R.W. Bike sharing systems: Solving the static rebalancing problem. Discret. Optim. 2013, 10, 120–146. [Google Scholar] [CrossRef]
- Dell’Amico, M.; Hadjicostantinou, E.; Iori, M.; Novellani, S. The bike sharing rebalancing problem: Mathematical formulations and benchmark instances. Omega 2014, 45, 7–19. [Google Scholar] [CrossRef]
- Ho, S.C.; Szeto, W.Y. Solving a static repositioning problem in bike-sharing systems using iterated tabu search. Transp. Res. Part E Logist. Transp. Rev. 2014, 69, 180–198. [Google Scholar] [CrossRef] [Green Version]
- Li, Y.F.; Szeto, W.; Long, J.C.; Shui, C. A multiple type bike repositioning problem. Transp. Res. Part B Methodol. 2016, 90, 263–278. [Google Scholar] [CrossRef] [Green Version]
- Fu, S.Y.; Han, L.W.; Tian, Y.; Yang, G.S. Path planning for unmanned aerial vehicle based on genetic algorithm. In Proceedings of the 2012 IEEE 11th International Conference on Cognitive Informatics & Cognitive Computing (ICCI*CC), Kyoto, Japan, 22–24 August 2012. [Google Scholar]
- Martins, M.S.R.; Fuchs, S.C.; Pando, L.U.; Delgado, M.R. Pso with Path Relinking for Resource Allocation Using Simulation Optimization. Comput. Ind. Eng. 2013, 65, 322–330. [Google Scholar] [CrossRef]
- Horoba, C.; Sudholt, D. Running Time Analysis of ACO Systems for Shortest Path Problems. In International Workshop on Engineering Stochastic Local Search Algorithms; Springer: Berlin/Heidelberg, Germany, 2009. [Google Scholar]
- Ahmed, S.A.A.; Safar, M.J.A. Shortest Path Planning for Noncircular Omnidirectional Mobile Robot. In Intelligent Manufacturing & Mechatronics; Springer: Singapore, 2018. [Google Scholar]
- Gao, X.; Lee, G.M. Moment-based rental prediction for bicycle-sharing transportation systems using a hybrid genetic algorithm and machine learning. Comput. Ind. Eng. 2019, 128, 60–69. [Google Scholar] [CrossRef]
- El-Assi, W.; Salah Mahmoud, M.; Nurul Habib, K. Effects of built environment and weather on bike sharing demand: A station level analysis of commercial bike sharing in Toronto. Transportation 2017, 44, 589–613. [Google Scholar] [CrossRef]
- Feng, C.; Hillston, J.; Reijsbergen, D. Moment-based probabilistic prediction of bike availability for bike-sharing systems. In International Conference on Quantitative Evaluation of Systems; Springer: Cham, Switzerland, 2016. [Google Scholar]
- Dickinson, E.; Euston, S.R. Statistical study of a concentrated dispersion of deformable particles modeled as an assembly of cyclic lattice chains. Mol. Phys. 1989, 66, 865–886. [Google Scholar] [CrossRef]
- García-Palomares, J.; Gutiérrez, J.; Latorre, M. Optimizing the location of stations in bike-sharing programs: A GIS approach. Appl. Geogr. 2012, 35, 235–246. [Google Scholar] [CrossRef]
- Dai, J.F.; Zhao, X.L.; Lin, J.X. Public bicycle system station deployment and scale prediction. Adv. Mater. Res. 2013, 790, 510–514. [Google Scholar] [CrossRef]
- Lin, F.; Zhang, L.; Xu, H.; Sun, Y. The application research of long-term and short-term prediction in the rental trends of public bicycle stations. J. Comput. Theor. Nanosci. 2016, 13, 9419–9425. [Google Scholar] [CrossRef]
- Bao, J.; He, T.; Ruan, S.; Li, Y.; Zheng, Y. Planning Bike Lanes based on Sharing-Bikes’ Trajectories. In Proceedings of the 23rd ACM SIGKDD International Conference on Knowledge Discovery and Data Mining (KDD ’17). Association for Computing Machinery, New York, NY, USA, 13–17 August 2017; pp. 1377–1386. [Google Scholar]
- Evans, M.R.; Oliver, D.; Shekhar, S.; Harvey, F. Fast and exact network trajectory similarity computation: A case-study on bicycle corridor planning. In Proceedings of the 2nd ACM SIGKDD International Workshop on Urban Computing (UrbComp ’13). Association for Computing Machinery, New York, NY, USA, 11 August 2013. [Google Scholar]
- Lv, M.X.; Liu, Y.N. Study of public bicycle system based on metro shuttle. Urban Roads Bridges Flood Control 2016, 9, 79–81. [Google Scholar]
- 2017 Mobike Cup Algorithm Challenge on Biendata Competitions. Available online: https://www.biendata.com/competition/mobike/ (accessed on 10 February 2020).


| Orderid | Userid | Bikeid | Biketype | Start_time | Geohashed_start_loc | Geohashed_end_loc |
|---|---|---|---|---|---|---|
| 163020 | 378959 | 22541 | 1 | 2017/5/10 0:00 | wx4f5pf | wx4f5pe |
| 3428602 | 140756 | 354271 | 1 | 2017/5/10 0:00 | wx4g20b | wx4erbf |
| 4580017 | 693933 | 459074 | 1 | 2017/5/10 0:00 | wx4ersk | wx4ersf |
| 4117589 | 482046 | 420604 | 1 | 2017/5/10 0:00 | wx4dnv2 | wx4dphv |
| 2780838 | 1018307 | 293542 | 2 | 2017/5/10 0:00 | wx4g2p1 | wx4exbf |
| t | s_Type | e_Type | if_Detour |
|---|---|---|---|
| 0 | 7 | 66 | 0 |
| 0 | 39 | 16 | 1 |
| 0 | 67 | 89 | 1 |
| 0 | 4 | 4 | 0 |
| 0 | 66 | 38 | 0 |
| Parameter | Value |
|---|---|
| Duration | 48 |
| Threshold number of station | 30 |
| Remuneration of single trip | 2 |
| Cost on single manual dispatching | 10 |
| Cost on single user incentive dispatching | 1 |
| Average trip distance of the shared bicycle | 0.05 |
| Maximum working distance of users | 0.01 |
| Maximum number of bicycles in manual dispatching | 50 |
| The initial distribution of bicycles | 7.45302, 8.56492 |
| The percent of users receiving dispatching tasks | 0, 0.2, 0.4, 0.6, 0.8, 1 |
| The number of trip records | 48365 |
| Dispatching Method | User’s Satisfaction |
|---|---|
| CUMD | |
| MDP | |
| HDP |
© 2020 by the authors. Licensee MDPI, Basel, Switzerland. This article is an open access article distributed under the terms and conditions of the Creative Commons Attribution (CC BY) license (http://creativecommons.org/licenses/by/4.0/).
Share and Cite
Shen, S.; Wei, Z.; Sun, L.; Rao, K.S.; Wang, R. A Hybrid Dispatch Strategy Based on the Demand Prediction of Shared Bicycles. Appl. Sci. 2020, 10, 2778. https://doi.org/10.3390/app10082778
Shen S, Wei Z, Sun L, Rao KS, Wang R. A Hybrid Dispatch Strategy Based on the Demand Prediction of Shared Bicycles. Applied Sciences. 2020; 10(8):2778. https://doi.org/10.3390/app10082778
Chicago/Turabian StyleShen, Shu, Zhaoqing Wei, Lijuan Sun, Khalida Shaheen Rao, and Ruchuan Wang. 2020. "A Hybrid Dispatch Strategy Based on the Demand Prediction of Shared Bicycles" Applied Sciences 10, no. 8: 2778. https://doi.org/10.3390/app10082778