Article

Carbon-Efficient Virtual Machine Placement Based on Dynamic Voltage Frequency Scaling in Geo-Distributed Cloud Data Centers

1
School of Computing, SASTRA Deemed University, Thanjavur 613401, India
2
School of Electrical and Electronics Engineering, SASTRA Deemed University, Thanjavur 613401, India
3
Department of Management & Innovation Systems, University of Salerno, 84084 Fisciano (SA), Italy
*
Authors to whom correspondence should be addressed.
Appl. Sci. 2020, 10(8), 2701; https://doi.org/10.3390/app10082701
Submission received: 27 February 2020 / Revised: 5 April 2020 / Accepted: 9 April 2020 / Published: 14 April 2020
(This article belongs to the Special Issue Low Carbon Technologies for Sustainable Environment)

Abstract

:
The tremendous growth of big data analysis and IoT (Internet of Things) has made cloud computing an integral part of society. The prominent problem associated with data centers is the growing energy consumption, which results in environmental pollution. Data centers can reduce their carbon emissions through efficient management of server power consumption for a given workload. Dynamic voltage frequency scaling (DVFS) can be applied to control the operating frequencies of the servers based on the workloads assigned to them, as this approach has a cubic increment relationship with power consumption. This research work proposes two DVFS-enabled host selection algorithms for virtual machine (VM) placement with a cluster selection strategy, namely the carbon and power-efficient optimal frequency (C-PEF) algorithm and the carbon-aware first-fit optimal frequency (C-FFF) algorithm.The main aims of the proposed algorithms are to balance the load among the servers and dynamically tune the cooling load based on the current workload. The cluster selection strategy is based on static and dynamic power usage effectiveness (PUE) values and the carbon footprint rate (CFR). The cluster selection is also extended to non-DVFS host selection policies, namely the carbon- and power-efficient (C-PE) algorithm, carbon-aware first-fit (C-FF) algorithm, and carbon-aware first-fit least-empty (C-FFLE) algorithm. The results show that C-FFF achieves 2% more power reduction than C-PEF and C-PE, and demonstrates itself as a power-efficient algorithm for CO2 reduction, retaining the same quality of service (QoS) as its counterparts with lower computational overheads.

1. Introduction

Datacenters are critical infrastructures that amalgamate vast computing and storage resources, offering online computing as and when needed. Virtualization techniques embedded in grid computing platforms aid data centers in providing computing resources as a service to customers [1]. The growing energy consumption is a significant problem in data centers. The consumption of energy is increasing by about 10%–12% per year [2]. Synchronized power and resource management are essential to assist data centers in conserving energy while providing the required quality of service (QoS) for hosted applications [3]. It is very much advantageous to maximize server utilization to lower energy consumption [4]. Virtual machine (VM) consolidation is performed to accomplish auto scaling, resulting in reduced energy consumption [5,6].It is essential to maintain the maximum number of servers possible in a running state to satisfy service level agreements (SLAs), which account for more than 80% of information technology (IT) budgets. The power consumption of an idle server is two-thirds of its energy consumption with 100% utilization at full load [7,8,9]. It is noteworthy that idle power and dynamic power consumption utilization levels vary based on different power models of physical servers. The energy reduction achieved by shrinking the number of existing resources through VM consolidation may result in lower resource availability, jeopardizing the credibility of the provider. Utilization of servers at high voltage results in high temperatures and shorter lifetimes. Resource utilization should be optimized based on the computing capacities of the servers in order to reduce idle and active server power consumption [10]. Considering the above, minimum power consumption is achieved through optimum central processing unit (CPU) utilization of the servers with our proposed algorithms.

2. Related Works

Complications in workload allotment in servers with reduced power consumption mean that optimal power management is required, which is dependent on the arrival rate of the tasks and the processor’s power-to-frequency relationship. Thus, it is vital to perform a quantitative analysis of the association between dynamic voltage frequency scaling (DVFS) and power consumption to optimize the use of servers [11]. The worst-fit decreasing (WFD) strategy has been proposed as a load balancing approach for task allocation and energy consumption reduction [12], where by DVFS-based fixed discrete CPU utilization levels were considered and 34% power reduction was achieved [13]. A polynomial complexity algorithm was presented, with the assumption that the energy consumption of servers with lower workloads is comparably less than higher workloads [14]. When optimizing power consumption, most of the research work has focused on optimizing the CPU and cooling devices, as they are the components that consume the most power. The CPU consumes 46% and the cooling device consumes 15% of the total power in a data center [15]. The DVFS-based approach can be used when there is a lower workload and no need to run the servers at their maximum performance level [16,17,18]. The job scheduling approach was used for workload management to achieve maximum utilization of servers with reduced energy consumption [19,20,21]. Many heuristic methods for VM placement have been used with constrained combinatorial optimization problems for different objectives, such as to identify energy-efficient hosts for VMs [22,23,24], to reduce the number of migrations [25], and to increase the number of idle hosts [26,27]. In heterogeneous environments, heuristic techniques generally cannot guarantee optimal long-term solutions [28]. Reducing power consumption through the VM migration approach involves limiting the number of powered servers operating at highest utilization level.This approach is not energy free, rather it is dependent on VM size and bandwidth [29]. The energy requirement for the live migration of idle VMs is estimated using their proposed power model [30]. The consecutive sequential migration of several VMs also has an energy impact [31]. DVFS is mainly applied to non-critical workloads to improve energy-efficient scheduling of idle servers or light-loaded servers [32]. The genetic algorithm-based model was proposed for VM placement to minimize energy consumption [33]. A multiobjective model of the VM placement problem was proposed to maximize resource utilization and minimize energy consumption and network traffic, with VM placement formulated as a bin-packing problem and the network traffic reduction formulated as a quadratic assignment problem, with resources constraints [34]. An optimization model with multiobjective formulation was considered to maximize server utilization and minimize the number of active servers with memory and CPU resource constraints [35]. The algorithm was designed in order to form an optimal initial population and to reduce the search space, and was evaluated on a small-scale data center. The author of [36] disagreed with the work performed in [35], insisting on the need for an exhaustive approach in order to arrive at an optimal solution for difficult NPproblems. Approaches for bin-packing-based modified best fit decreasing (BFD) placement and dynamic placement of VMs were considered to reduce operation costs and environmental impacts [37]. In the modified BFD approach, the VMs with the best utilization were placed in the physical machine (PM) with the least energy consumption. A multi dimension space partition model was used to balance resource utilization and energy consumption. Energy efficient virtual machine placement algorithm with balanced resource utilization was proposed to reduce power consumption by reducing the number of PMs [38]. A multi objective problem was formulated to reduce energy consumption by forecasting CPU and memory utilization in the forthcoming slot based on the previous history [39]. The result outcomes were compared with a grey forecasting model. A constrained optimization problem was formulated with virtual machine (VM) and physical machine (PM) profiles. New heuristic information was embedded in an ant colony algorithm to achieve energy efficiency [40].
A mixed-integer non-linear programming model was proposed for systematical allocation of workloads, considering the electricity price diversity of geo-distributed data centers and DVFS of servers without violating QoS requirements [41,42]. A tradeoff between energy consumption and cost was achieved by exploiting the electricity price, data center location, and energy source in the context of internet services sensitive to response time [43]. Reinforcement-learning-based resource management was optimized for information storage with QoS and power consumption as reward function [44]. The revenue from different tasks was considered as a QoS parameter and VM migration and network communication were considered for power consumption. Geo-distributed resource allocation was performed based on two heuristic force-directed load distribution (FDLD) methods, namely task-aware over provisioning and simple over provisioning with co-location interference, in order to estimate the co-location effects of different task execution rates [45]. Genetic-algorithm-based co-location-aware load distribution was also performed and compared with FDLD, with the result showing energy cost reductions with over provisioning elimination, making this an optimal choice. Regarding data center power efficiency measurement, PUE and carbon usage effectiveness metrics play vital roles. Most of the energy consumption in data centers is caused by the cooling load [46].
This work considers all three triangular dependent parameters, namely the power dissipation of the processor regarding the operating frequency, cooling device power consumption, and dynamic PUE. The carbon-aware power-efficient optimal frequency (C-PEF) and carbon conscious first-fit optimal frequency (C-FFF) algorithms proposed in this work distribute the load and maintain the lowest possible utilization level in all servers for the current workload. The placement algorithm considers the following factors:
  • Selection of data centers and clusters is performed based on the PUE and CO2 emission rate, aiming to reduce the overall carbon footprints of the data centers;
  • Load balancing is done by identifying a feasible server with a minimal operating frequency for the current workload with the required quality of service, aiming to reduce hot spots in CPU heat dissipation, which have a direct impact on hardware lifetime and performance;
  • The impacts of static and dynamic power usage effectiveness (PUE) on placement decisions are analyzed, along with cooling load power impacts.
The rest of this paper is organized as follows. In Section 1, the general facts about power consumption in data centers are outlined. Section 2 surveys several closely associated research approaches related to this work. Section 3 and Section 4 detail the system models and the research problem formulation. Subsequently, Section 5 elaborates on the algorithms proposed in this research work for solving the formulated stochastic problem. Then, the experimental set-up is presented in Section 6. Section 7 presents the simulation results and discussions about the significance of load balancing using the optimal frequency and the dynamic cooling load. Finally, Section 8 presents the findings of this research work.

3. System Overview

3.1. Power Model

The power consumption of the processor is directly proportional to the frequency. Hardware-based solutions to the problem of power consumption have reached a saturation point. The energy efficiency of multi core systems is entirely dependent on the workload. Cores that have no activity will experience static power loss, which is directly related to the supply voltage. Running a core at maximal workload means it will use the highest frequency and voltage, resulting in high power consumption. By distributing the workload among the processors, the work is completed in the same amount of time with less power consumption. In multi core systems, the only way to address this problem is to maintain the optimal CPU frequency with the minimum energy consumption ratio by distributing the workload. Operating the processor at minimum frequency is a sensible and more reasonable model for achieving minimum power requirements. There is a collective impact on P-states and workload activity on processor temperature [47]. A linear relationship exists between power consumption and the temperature of a processor in a well-cooled environment. DVFS is used to scale the supply voltage and frequency to prevent power wastage. As DVFS has a direct influence on the power consumption and temperature, it can be used as a workable thermal and power control mechanism.

3.2. System Model

Figure 1 presents the overall system model. The description and functionalities of every component are detailed below:
  • Resource Management System: The resource management system contains information about the cluster list, PUE, CFR, total utility power, current IT load, and other metadata information related to the data centers.
  • Management Node (MN): The Resource Allocation Management (RAM) algorithm is a daemon that is executed in the management node. It is updated with the cluster list, host list, PUE, carbon footprint rate, and other information related to the clusters in the data center. It activates the scheduling algorithm for VM-to-PM mapping and the resource deallocation algorithm to perform resource recovery, and updates target virtual machine queue (TargetVMQ) with VM-to-PM mapping information.
  • Cluster Manager (CM): A node in the cluster is nominated as the head node to function as the cluster manager. The overall utilization of the cluster, number of machines in on and off states, maximum and minimum utilization, number of VMs operating in the cluster, and power consumption are maintained by the cluster manager and updated by the management node.
  • Physical Machine Manager (PMM): The PM details related to available memory and CPU capacity, current operating frequency, power consumption, percentage of CPU utilization, number of active VMs, and other PM-related information are maintained by the PMM and updated by the CM in the head node.
  • Virtual Machine Manager (VMM): The VMM is a daemon that is executed in each PM. It is responsible for maintaining the VMs executing in PM. VM resource utilization, percentage of CPU time utilized, submission time, placement time, active and idle states, remaining execution time, power consumption, and other VM details are maintained by the VMM.

4. Problem Formulation

The VM request is in the form of a triplet (f, r, e), where f ϵ F represents the reserved frequency, r ϵ R represents the resource requirement, and e ϵ I represents the execution interval. Consider M heterogeneous servers, with each containing discrete frequencies (f0, f1, f2, f3, f4,…fk) with utilization (U0, U1, U2, U3, Uk),where U0= 0% (idle), Uk= 100%, and fixed dynamic power consumption (P0,P1, P2 P3 P4…, Pk). Here, U0 is considered as the idle state, with power consumption P0. Let S = {S1, S2, S3….SM} represent M servers for each Sj, where [1,M] with utilization (Uj,0, Uj,1, Uj,2, Uj,3, Uj,k), and power consumption (Pj,0, Pj,1, Pj,2, Pj,3, Pj,4…, Pj,k) can be characterized as a triplet (CUj, CPj, Cj); where CUj is the current utilization of server Sj, CPj is the power consumption of server Sj with utilization state CUj, and Cj is the total processing capacity of Sj.
The relation R between the jth PM and ith VM indicates whether VMi is placed in PMj, as below:
R j , i = { 1       V M i   i s   a l l o c a t e d   t o   P M j 0                               o t h e r w i s e }
The service level agreement (SLA) is measured using the ratio of virtual machine acceptance (RVA), calculated as:
R V A   ( V ) = T ( R ) / N
where N represents the total number of VM requests submitted and T(R) represents the total number of VM requests accepted and mapped to available PMs. This is derived as:
T ( R ) = j = 1 M i = 1 N R j , i

4.1. Objective Function

4.1.1. Server Power

The VM request of the ith VM in request Queue (ReqQ), (fi, ri, ei), remains constant throughout the execution. Here, ei is the total number of intervals reserved by the VM for the resource (fi × ri). The power consumption of the jth physical machine with utilization Ul at time t is represented as P j , l ( t ) and derived as [48]:
P j , l ( t ) = ( ( CU j ( t ) ) ( U j , l ) ( U j , l + 1 ) ( U j , l ) × ( ( P j , l + 1 ) ( P j , l ) ) + ( P j , l ) )
where Uj,l ˂ CUj(t) ˂ Uj,l+1, 0 ≤ l ≤ k, where l represents the operating frequency, CUj(t) is the current utilization of the jth server at time t, and k is the number of discrete frequencies. The energy consumption of the jth PM with utilization u within interval [0, I] can be calculated as:
0 I l = 0 k P j , l ( t ) d t
The total energy consumption of the M number of PMs within a reservation interval [0, I] can be calculated as:
j = 1 M 0 I l = 0 k P j , l ( t ) d t

4.1.2. Cooling Power

The cooling device power consumption contributes to the maximum electricity consumption of the data center. Dynamic tuning of the cooling load based on the current workload may help reduce power consumption in data centers, which will have a direct impact on the PUE. The cooling power cannot be ignored, as it prevents service disruption caused by the heat generated by servers [49]. To analyze the power consumption of a cooling device, standard computer room air conditioning (CRAC) units are considered in this work. The power consumption of the chiller does not change much with regard to the outside air temperature or IT load [50]. The coefficient of performance (CoP) is the measure used to compute the efficiency of the cooling unit to determine its cooling load. The CoP is the ratio (d/w) of heat removed (for server load d) to the quantity of work (w) needed to remove the heat. A larger CoP indicates better efficiency, meaning less work is required to remove a greater amount of heat. The CoP of the CRAC unit is a changeable value that increases in proportion to the increase of the supply air temperature in the CRAC unit [51].
The total carbon footprint (TCF) generated at time t, including overhead power, is formulated as:
T C F ( t ) = d = 1 t d c ( P U E d × c = 1 t c ( C F R d , c × P S d , c ) )
where tdc, tc, M and N represent the numbers of data centers, clusters, machines, and requests, respectively. The overall energy consumption of all servers in a cluster (PSc) within the interval [0, T], partitioned as a sequence of reservation intervals (ri) in the form of (tri, tri+1] (ri ϵ {0,1,…ri-1}), is formulated as:
P S c = j = 1 M α = 0 r i 1 l = 0 k × P j , l ( t α + 1 ) × ( t α + 1 t α )
The CoP for the CRAC unit can be modeled as in [52]:
C o P = { 0.0068 T s u p 2 + 0.0008 T s u p + 0.458   }
where Tsup = (current_temperature − safe_temperature)
The PUE of the data center can be calculated as:
P U E d = ( T o t a l   f a c i l i t y   P o w e r I T   p o w e r )
Total   facility   Power d = ( c = 1 t c P S c + c = 1 t c O P c )
I T   P o w e r d = c = 1 t c P S c
The total overhead power (OP) of a cluster (c) is calculated as:
O P c = ( P S c C o P )
The objective function TCF(t) is subject several limitations. The total number of VMs allocated to a machine should not exceed the servers computing (U) and memory capacity (mem), as follows:
i = 1 N R j , i U P M j c p u . m a x
i = 1 N R j , i m e m P M j m e m . m a x
The relation R between VMs and PMs is many-to-one, meaning RN × M if:
  i   ϵ   N   &   j , k   ϵ   M : ( i , j ) ϵ R ( i , k ) ϵ R j = k
The total energy (eng) consumed is supposed to be within the limit of the available brown energy (B) at the data center, as follows:
i = 1 N R j , i e n g T o t a l   a v a i l a b l e   B  
The total brown energy consumed is supposed to be within the limits of the cloud provider’s agreed upon grid electricity consumption (G):
T o t a l   a v a i l a b l e   B T o t a l   a s s i g n e d   G

5. Evaluated Algorithms

5.1. RAMAlgorithm

The high-level design of the resource allocation management (RAM) algorithm executed in the management node is presented in Algorithm 1. The functionality of Algorithm 1 can be grouped into two sections. In Section 1, lines 2–4 perform VM-to-PM mapping using the placement algorithm. In Section 2, lines 5 and 6 perform resource deallocation for every interval.
  Algorithm 1: High-level overview of the algorithm approach
   Input: Hostlist, VM instancelist
   Output: TargetVMQ
   1 for interval do
   2      ReqQ←Get VMs from VM instance list;
   3      HostQ←Get Hosts from HostList;
   4       TargetVMQ←Call placement algorithm (presented in Section 5.2, Section 5.3, Section 5.4, Section 5.5 and Section 5.6);
   5      if interval >min-exe-time then
   6          Completedlist←Get VMs with active time completion from TargetVMQ;
   7         for completedlistdo
   8            Deallocate resources associated with the VM;
   9        Endfor
   10   Endif
   11 Endfor
   12   Return Target VMQ.

5.2. Carbon- and Power-Efficient Optimal Frequency VM Placement (C-PEF)

The C-PEF algorithmic approach is detailed in Algorithm 2. The proposed strategy allocates the new VMs to feasible servers, ensuring:(i)carbon-efficient clusters based on the PUE and carbon footprint rate (CFR);(ii) the power-efficient optimal operating frequency of servers; and(iii) a minimum increase in overall power after allocation.
  Algorithm 2: CPEF Carbon and Power-Efficient Optimal Frequency VM Placement
  Applsci 10 02701 i001
The aim of the C-PEF algorithm is to distribute the load within the cluster. Each server is set to its minimum utilization level. The utilization level is increased gradually when the VM allocation is not feasible at the current utilization level. The greedy selection of the destination hosts for the VMs among the feasible hosts is based on a minimum increase in overall power consumption at the current utilization level. The utilization of each node is reduced to an extent by distributing the load without performance compromise to avoid hotspots due to CPU turbulence. Each node is utilized at the required minimum utilization level as much as possible. Algorithm 2 receives the Clusterlist of all data centers, the Hostlist of each cluster, and the VM resource request through ReqQ. Lines 2 and 3 consolidate the entire cluster list into the Totclusterlist. The algorithm considers the carbon footprint rate (CFR) and power usage effectiveness (PUE) for cluster selection and sorts the Totclusterlist in ascending order based on PUE × CFR. The greedy search, considering power limited to the current utilization level, is performed in line 6 of Algorithm 2. The feasible host system with nominal operating frequency for VM placement is identified as the SelectedHost. The difference in dynamic power before and after VM placement, ΔP, is calculated in line 14 of Algorithm 2. The power consumption P2 is not constant throughout the execution of the VM, as it depends on the next incoming and outgoing tasks of the machine to which it is allocated. As the incoming task is not known in advance, the known details of outgoing tasks based on the remaining execution time and utilization level are used effectively to predict the dynamic power. This approach has an impact if there is a time gap between the first request submission and the next.
The destination host (Desthost) is identified based on the new VM(NVM) execution time and the next outgoing task’s remaining execution time in lines 21–33 in algorithm 2. Figure 2 diagrammatically elucidates lines 21–23 with an example. Assume M1, M2, M3, M4, and M5 are machines in the SelectedHost. The execution time of the NVM is assumed to be 8 units. In each machine, P1 is the current dynamic power of the machine, P2 is the dynamic power after the NVM has been placed and R1 represents the remaining execution time interval of each task running in the machine at time to. The hosts are sorted based on ΔP. The SelectedHosts are {M4,M3,M2,M5,M1}. The number of tasks with the minimum remaining execution time (R1) at time to in M1 is 4(Task2), for M2 is 9(Task2),for M3 is 5(Task1), forM4 is 3(Task1), and for M5 is 2(Task1). Here, the execution time of NVM–R1 (ΔR) forM1 is 4, for M2 is (−1), for M3is3, for M4is5, and for M5is6. M2 has a greater minimum remaining execution time than the NVM execution time, so the selectedhost = {M4}, while all others are considered as “choosyhosts”. Pow1 represents the assumed dynamic power after the completion of the task with the minimum remaining execution time. Based on C-Exp-Pow, M3 is chosen as the Desthost, irrespective of M4, which has the minimum ΔP.
The time complexity of Algorithm 2 can be analyzed by considering n VM requests in ReqQ. The sort function inline 3 with c clusters takes O(c log(c)) times. Considering f frequency levels, line 8–17 and line 25–27 with m number of hosts take O (m) times. The sort function in lines 21 and 29 takes O (mlog(m)) times. The algorithm complexity is derived as O (n (clog(c) + cf (m + m log m + m+ m log m))).The final complexity is O(ncfmlog(m))).

5.3. Carbon-Aware First-Fit Optimal Frequency VM Placement (C-FFF)

The C-FFF algorithmic approach is detailed in Algorithm 3. The aim of the C-FFF algorithm is to distribute the load within the cluster. Each server is set to its minimum utilization level. The utilization level is increased gradually when the VM allocation is not feasible at the current utilization level. This approach differs from C-PEF in terms of host selection. There is no greedy selection performed for the minimum increase in overall power consumption, and the VM is placed in the first-fit host when feasibility is confirmed at the current utilization level. Algorithm 3 receives the Clusterlist of all data centers, the Hostlist of each cluster, and the VM resource request through ReqQ. Lines 2 and 3 consolidate the entire cluster list into the Totclusterlist. The algorithm considers the carbon footprint rate (CFR) and power usage effectiveness (PUE) for cluster selection and sorts the Totclusterlist in ascending order based on PUE×CFR. The C-FFF algorithm differs from C-PEF in terms of host selection. C-FFF does not use the greedy approach on the feasible host with minimum power, as with C-PEF; instead, it places the VM in the first feasible host that is limited to the current p-state. For n VM requests, m number of hosts, f frequency levels, and c number of clusters, the complexity of the algorithm is derived as O(nfmclog(c)).

5.4. Carbon- and Power-Efficient VM Placement (C-PE)

The cluster selection is the same as with C-FFF, meaning it is based on PUE and CFR. The standard power-efficient algorithm does consider the DVFS and remaining execution time for outgoing tasks for VM allocation [25]. In this work, the C-PE algorithm performs cluster selection similarly to C-PEF and C-FFF, but differs in its host selection policy. The aim of the C-PE algorithm is to find a feasible host for a VM, considering the maximum utilization level. The host selection is based on a minimum increase in overall power consumption (i.e., minimum ΔP). The Selected Hosts are sorted based on estimated ΔP (line 14of C-PEF). The destination host is selected as in Algorithm 2, with maximum utilization. The algorithm complexity with n VM requests, c clusters, and m nodes is derived as O(n(clog(c) + c(m + mlog(m) + m))). The final complexity is expressed as O(ncmlog(m)).

5.5. Carbon-Aware First-Fit Least-Empty VM Placement (C-FFLE)

This approach performs data center and cluster selections similarly to C-PEF, C-FFF, and C-PE, but differs in terms of its host selection policy. The C-FFLE algorithm considers the carbon footprint rate (CFR) and power usage effectiveness (PUE) for cluster selection and sorts the Totclusterlist in ascending order based on PUE×CFR. The host selection is based on the first-fit strategy, whereby the hosts are ordered based on the least available resources. This approach does not perform any greedy searching for minimum power heuristic methods; instead, it uses VM best-fit heuristic methods based on resource requirements for node selection.
  Algorithm 3: C-FFF Carbon-Aware First-Fit Least-Empty VM Placement
  Applsci 10 02701 i002

5.6. Carbon-Aware First-Fit VM Placement (C-FF)

The cluster selection by the C-FF algorithm is similar to C-PEF,C-FFF,C-FFLE, and C-PE algorithms, but differs in terms of the host selection policy. The algorithm considers the carbon footprint rate (CFR) and power usage effectiveness (PUE) for data center selection and sorts the Totclusterlist in ascending order based on PUE×CFR. It uses first-fit heuristic methods for host selection.

6. Experimental Environment and Assumptions

Considering the expense and time incurred in the evaluation of large-scale experiments in real time, Matlab software is used to simulate the environment. Each reservation interval is assumed to have duration of 300 s. The input request is accepted at the beginning of each reservation cycle. A data center with heterogeneous systems with different power models capable of provisioning multiple VMs is considered. The virtual resource size is not known and the VM request has no limitations. The VM is assumed to be active throughout the execution time. All the tasks are considered to be CPU-intensive. The power consumption of a task is measured by its CPU utilization, as this is considered to consume a significant fraction of energy. All the machines are assumed to be in an off state when not in use. The VM’s resource requirements are assumed to be constant throughout the reservation interval. The data center’s safe operating temperature is considered to be 23 °C. The peak IT load (server only) power estimation for the data center is 52 kW for the physical machine specifications given in Table 1 [53]. The data center is assumed to have a floor space of approximately 500 square feet. The total electricity power requirement is calculated as 124 kW (including cooling and lighting load). The CPU power consumption for all servers should not exceed 17.3kW. The cooling load concerning CPU utilization is limited to 12.11 kW [54]. The data centers are assumed to be powered only by grid energy sources.

Physical Machine and VM Reservation Modeling

Table 1 shows model of physical machines with varying power models to simulate heterogeneity and configurations of heterogeneous systems taken from the SPEC power benchmark [53] used in the simulation. Table 2 presents the power consumption, with equal CPU utilization distribution ranging from 0% to 100%. The power calculation for the periods in between intervals is estimated based on Equation (4). For example, the power consumption with 13% CPU utilization for power model 1 is between 10% and 20%,while the resulting power is 64.14 W based on ((13%−10%)/(20%−10%) ×(66−63)) + 63 with reference to Table 2.
To evaluate the proposed algorithms, 4 small-scale data centers with 100 heterogeneous systems are used to model infrastructure-as-a-service(IaaS).The VM characteristics for elastic compute units (ECU) shown in Table 3 are used to model the virtual machine reservations. Each data center is assumed to have 2 clusters with varying values for carbon footprint rates. The carbon footprint rates of clusters and PUE values of data centers are considered based on [55,56], as presented in Table 4. The workload is generated based on the Lublin–Feitelson model [57]. By taking advantage of the arrival rate, gamma, and hyper-gamma Lublin parameters, the bag-of-tasks and web requests are generated, which have long and short holding times, respectively, as compared to the VM types given in Table 3 (shown in Figure 3 and Figure 4). Figure 3 depicts the variation in the numbers of requests in each reservation cycle. Figure 4 presents the total number of CPU utilization requests received from the VMs concerning different reservation cycles.

7. Results and Discussions

The workload data described above are used to evaluate the proposed VM placement algorithms C-PEF and C-FFF against C-PE, C-FF, and C-FFLE approaches. The C-FFLE algorithm is used to show the impact on power consumption when only resource usage is considered as a parameter in the heuristic approach. The C-FF is the first-fit placement algorithm, which is used for initial placement for all algorithms in this work. The other algorithms improve the placement strategy for power reduction as an extension of C-FF. In this work, along with initial placement, C-FF is used separately to model the worst possible power consumption. Naturally, the C-FFLE and C-FF algorithms will have worse performance than the power management algorithms. The C-PE algorithm is considered as a fair measure to evaluate power management approaches.
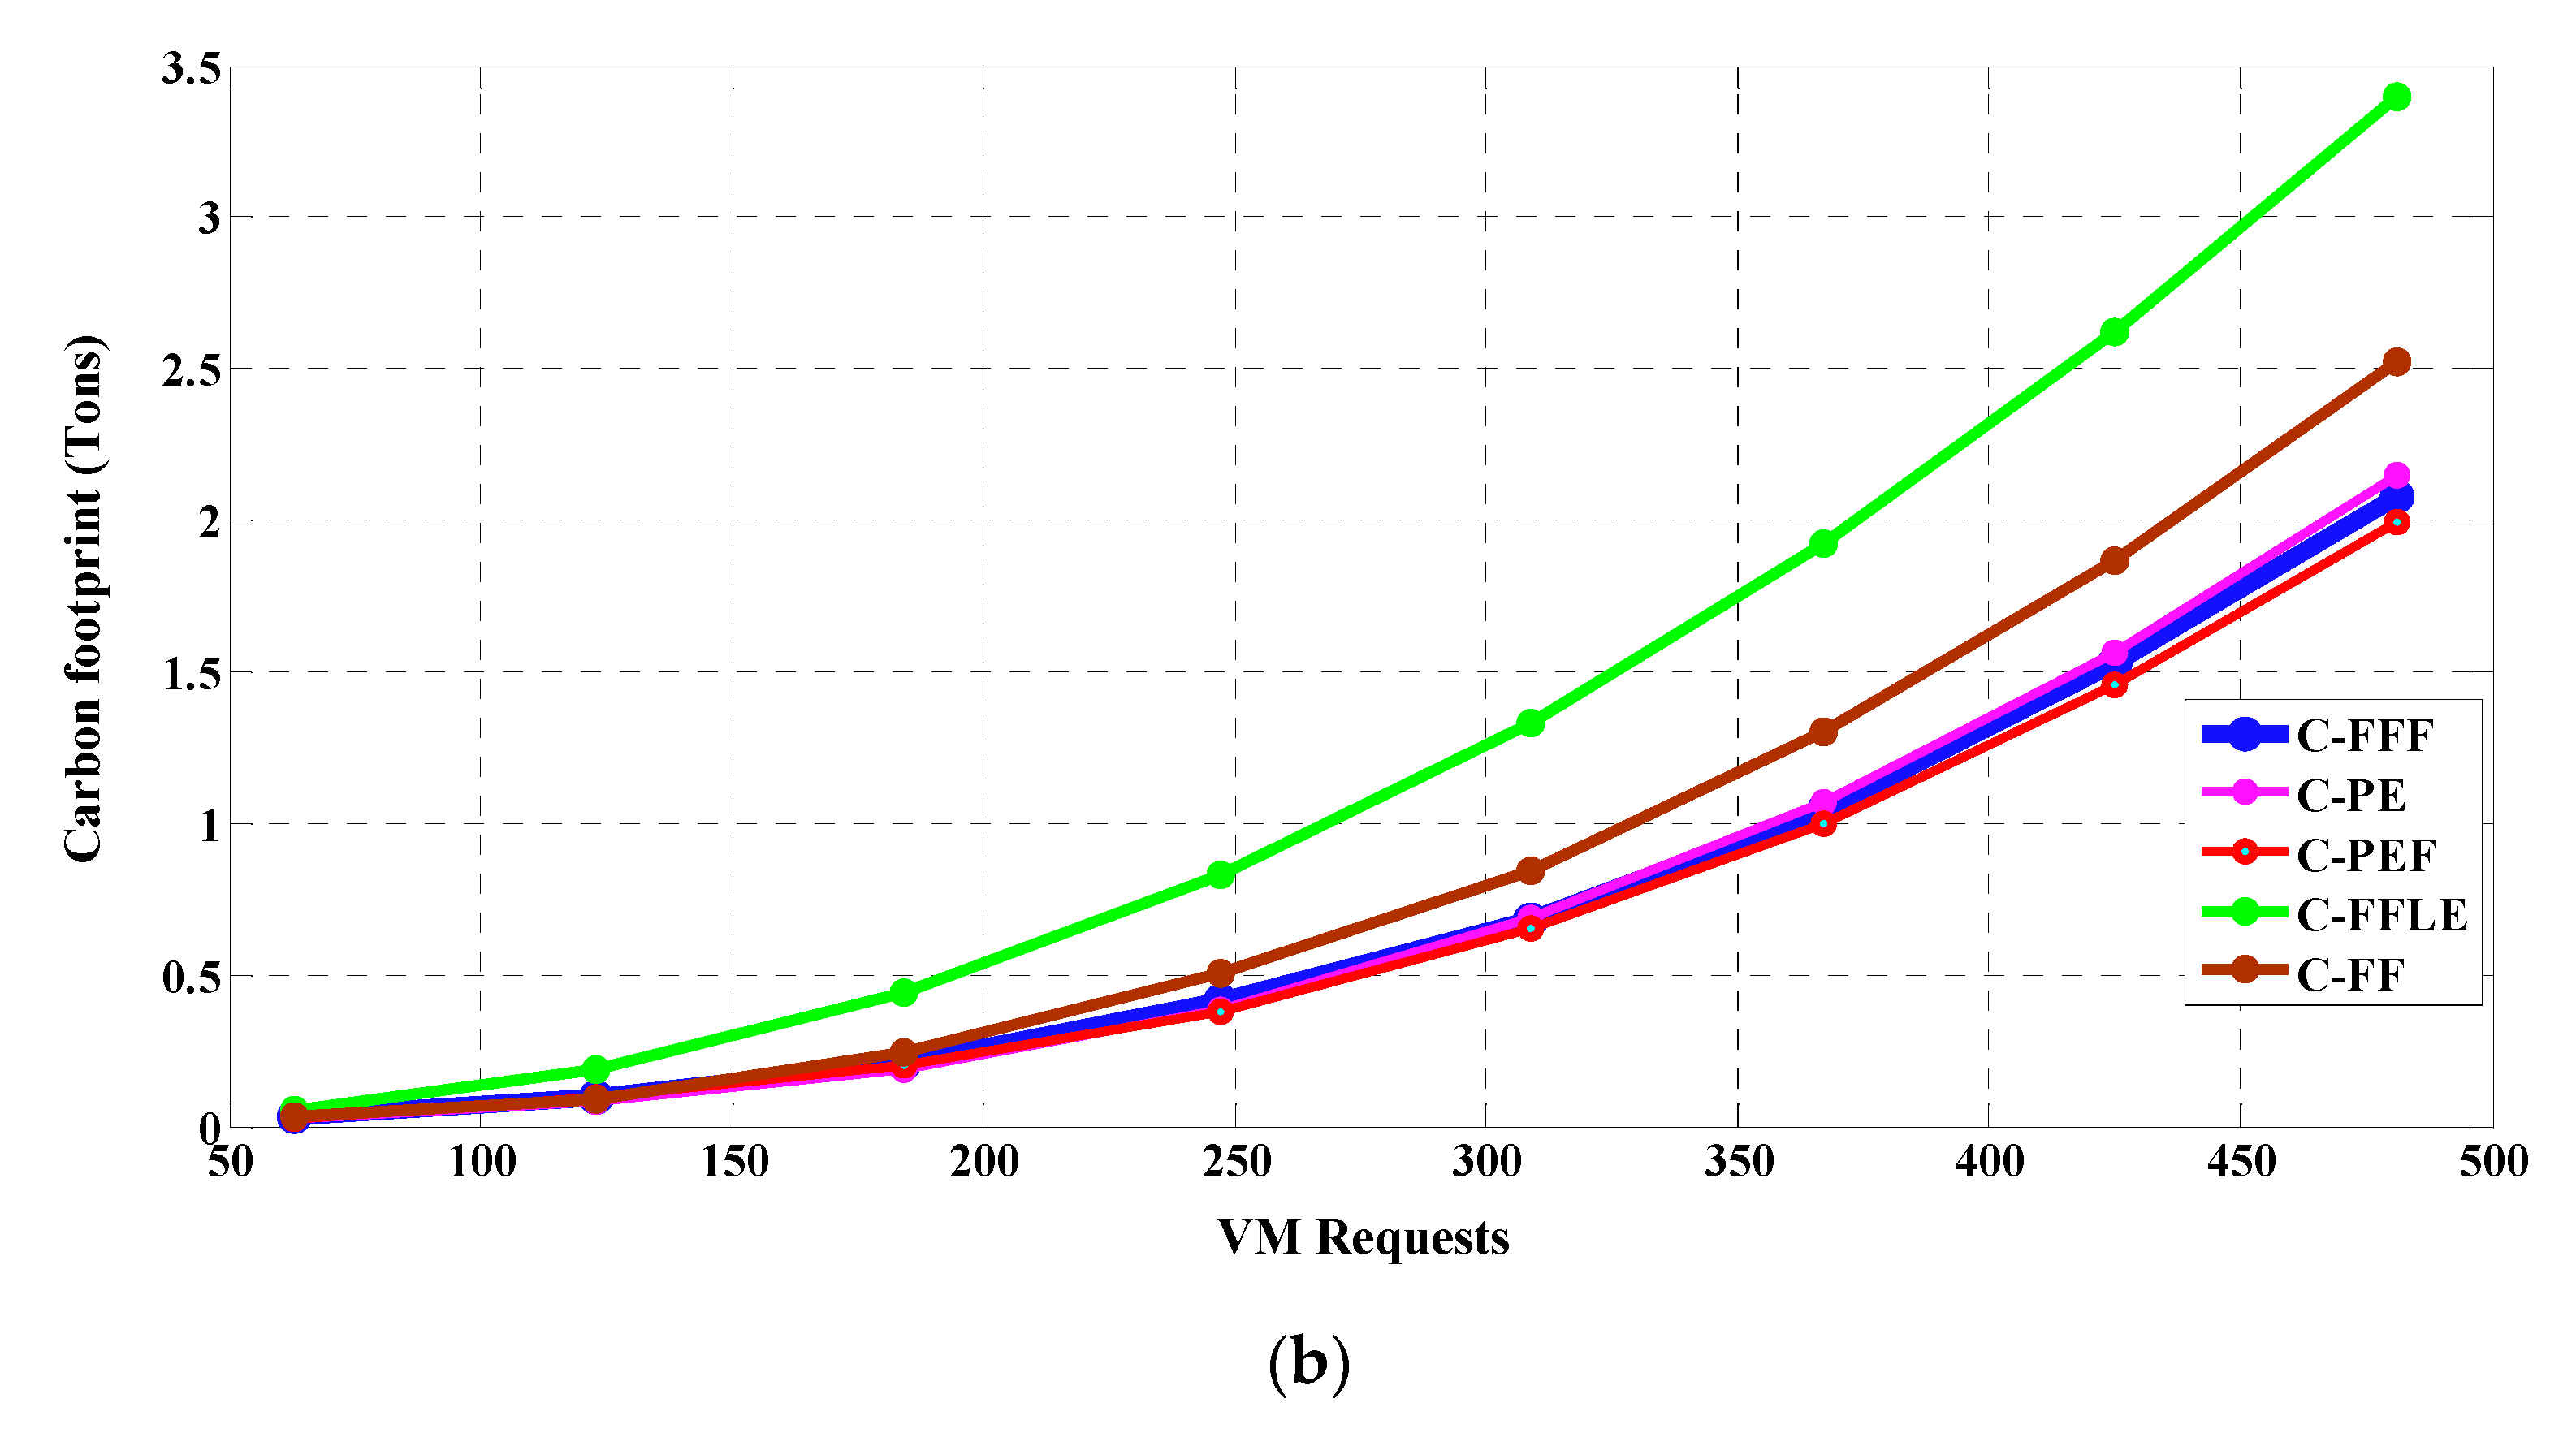
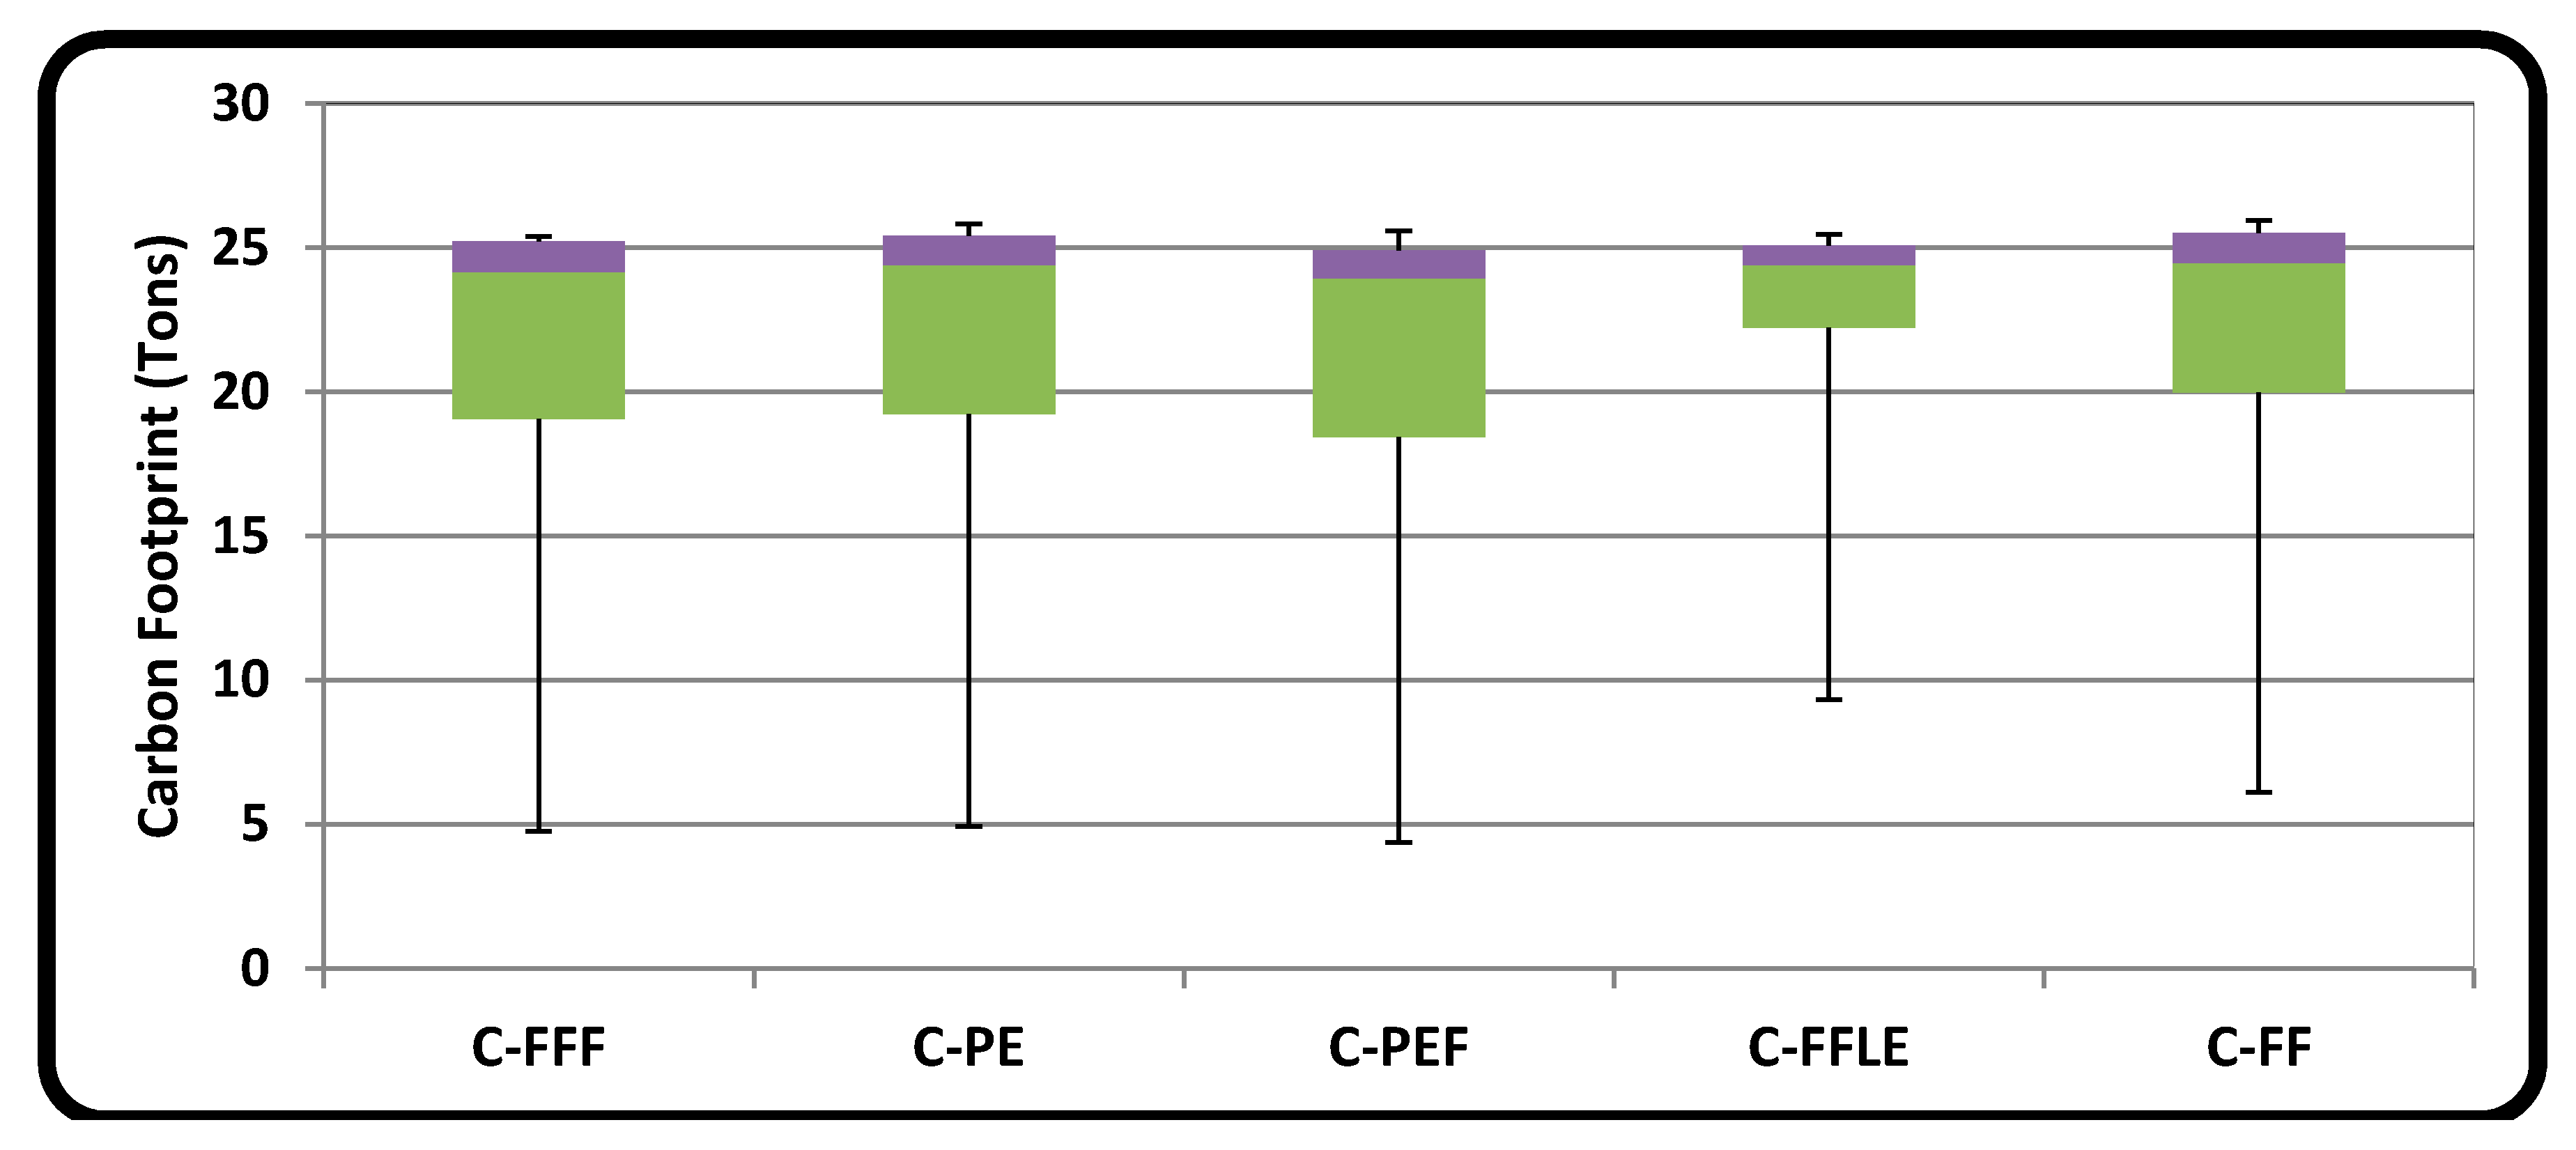
  • Reduction in Overall Carbon Footprint
The reduction of grid energy consumption in datacenters is considered as a crucial metric for carbon footprint reduction. Equation (7) formulates the total carbon footprint emission of data centers.
  • The ratio of VM acceptance (RVA)
The RVA is considered as a measure of service level agreement (SLA). The RVA is the ratio between the number of VM requests placed and the number of requests submitted.

7.1. Scenario-I: Energy-Efficient Mapping of VMs to PMs with StaticPUE

The VM placement algorithms are evaluated based on the reduction of the carbon footprint with static PUE, as shown in Table 4. Figure 5 and Table 5 present the number of active PMs for the same utilization level, with 100% RVA for all algorithms. In order to interpret the number of active PMs shown in Table 5, this has to be compared with the minimum and maximum utilization levels given in Table 6 for each interval. In C-PE, for 10% utilization, the number of active PMs is 36 with a minimum utilization 50% and the number of PMs with 100% utilization is 23. These numbers are far greater than C-FFF and C-PEF, for which the number of active PMs is 17, with minimum utilization ranging between 25% and 40.6%. The C-PE placement strategy utilizes a lower number of PMs with the maximum utilization possible for the current workload, but the C-FFF and C-PEF algorithms utilize the maximum number of PMs with the minimum possible utilization level and a lower number of fully utilized PMs. The results show that distribution of the load among the servers using DVFS with C-FFF and C-PE algorithms limits the percentage of load received at each interval. This approach does not lead to optimal results with very low loads. The minimum load required for best result depends on the machine configuration and power model. According to our specifications, repeated execution with different VM requests shows that20% is the minimum load. For the C-PEF algorithm, the optimal load requirement is less than C-FFF, because in spite of DVFS, it uses the greedy approach, which limits load distribution. It can be noticed that the C-FF algorithm achieves a significant improvement over C-FFLE, displaying a trade-off between effective resource utilization and power consumption. The utilization results presented in Table 6 prove the above algorithm strategies. Figure 6a,b and Table 5 illustrates the power consumption for all algorithms at 100% RVA for the first 8 intervals, the power consumption of the C-PEF algorithm is 3.79% lower than for C-FFF, while the power consumption for C-FFF is 2.26% lower than C-PE, 21.75% lower than C-FFLE, and 12.08% lower than C-FF. Based on the cumulative carbon footprint depicted in Figure 6b, which is equivalent to the power given in Table 5, the C-PEF reduces the carbon footprint to 4.09%, while C-PE, C-FFLE, and C-FF reduce the carbon footprint to 3.35%, 38.8%, and 17.6%, respectively. Based on Figure 7a and Table 7, the total power consumed by the servers using the C-PEF placement algorithm is reduced by 1.61%. The C-FFF algorithm reduces power consumption by2.16%, 13.54%, 2.77% when compared to C-PE, C-FFLE, and C-FF, respectively. Based on Figure 7b and Table 7, the C-PEF placement algorithm’s carbon emission is 1.64% less than C-FFF. The C-FFF placement algorithm consumes 2%, 15%, and 2.8% less power than C-PE, C-FFLE, and C-FF, respectively.
In Table 5, the carbon footprint values for C-FFF and C-PEF are about 2.30% and 3.18% lower than for C-PE, respectively, with an increased RVA of 1.2%. C-FFLE and C-FF algorithms have 19.89% and 1.23% greater carbon footprints than C-PE, respectively. Table 8 depicts the substantial improvement in VM request acceptance for C-PEF and C-FFF algorithms compared with other heuristic approaches with different numbers of VM requests. The C-FFF and C-PEF algorithms have approximately 1% higher RVA percentage than other counterparts. The statistical analysis presented in Table 9 supports the fact that the C-FFLE algorithm, which is based on resource utilization, operates with maximum utilization compared to other approaches. The C-FFF, C-PE, and C-PEF algorithms have approximately 1% variation in maximum CPU utilization rates, with similar average utilization rates. With regard to power, the C-PEF placement algorithm’s power consumption is 1.64% less than C-FFF. C-FFF consumes 2%, 15%, and 2.8% less power than C-PE, C-FFLE, and C-FF, respectively.
The results in Figure 8a,b were obtained by varying the system load with respect to the number of requests in order to measure the power consumption of different algorithms for a single interval with a common initial state. This was done so as to rank the performance of the algorithms from lowest to highest in terms of CPU utilization. Figure 8a displays the power consumption values for all the algorithms, with CPU utilization rates ranging between 40% and 90%. It can be noticed that the C-PEF algorithm shows significant performance improvement between 40%and 85% utilization. Figure 8b presents the carbon footprint values for all of the algorithms for utilization rates above 85%. Above 90% utilization, C-PEF and C-FFF are in close proximity to each other.
Figure 9 and Figure 10 present the amounts of carbon and power consumed by different power-efficient VM placement algorithms. C-PEF and C-FFF algorithms consume more power initially at lower loads than C-PE, which distributes the loads among all the servers. C-FFLE and C-FF algorithms consume more power as they do not utilize power-efficient allocation. The non-parametric Mann–Whitney U test and Wilcoxon rank sum test are utilized to test whether there is a noteworthy difference in the results obtained. Based on the abovementioned non-parametric tests on two samples for C-PEF with C-PE, C-FFLE, and C-FF, the p-values obtained are less than 0.0001. Therefore, it can be concluded that DVFS-aware scheduling (C-PEF and C-FFF) makes a significant difference compared with standard power-aware scheduling(C-PE) and other heuristic approaches interms of energy consumption. The difference between the two DVFS-aware algorithms, C-PEF and C-FFF, is not substantial (p-value of 0.76 > 0.05).

7.2. Scenario-II: Energy-Efficient Mapping of VMs to PMs with DynamicPUE

The power usage effectiveness is the metric used to analyze the efficiency of a datacenter. This is the ratio between the total energy requirements of a data center (total facility power) and the power consumed by IT devices. In total, 60% of the energy consumption is due to cooling device power consumption, which has a direct impact on PUE. The proposed power-aware algorithms C-FFF and C-PEF, along with the standard C-PE algorithm, are considered in scenario II to analyze the impact of dynamic PUE on carbon footprint values, based on Equation (11). Table 10 presents the power consumption and carbon footprint values observed with dynamic PUE under the same workload used for the observed values in Table 5 for fair comparison. Dynamic PUE reduces the carbon footprint by approximately 50%, as shown in Table 10. The RVA percentages for C-FFF and C-PE displayed in Table 11 show a slight dip at the beginning and then a significant increase of 1%. Table 12 shows the overall statistics for CPU utilization and power consumption related to dynamic PUE. The values in Table 10 confirm the impact of dynamic PUE. The power consumption of the C-PE algorithm is reduced by approximately 55% compared to static PUE. The power consumption for the mean CPU utilization presented in Table 9 and Table 12 reveals the impact of dynamic PUE on power reduction. C-FFF, C-PE, and C-PEF algorithms achieve approximately 14%, 9%, and 15% greater reductions than static PUE. The results support the approach of energy reduction by dynamically adjusting the cooling device load based on the active power consumption of the server for the current workload.
Let n, f, m, and c represent the number of VM requests, the fixed DVFS levels, the number of nodes, and number of clusters, respectively. The complexity of the C-PE algorithm is expressed by O(ncmlog(m)). Its complexity is dominated by mlog(m). The complexity of the proposed C-PEF algorithm is expressed by O(nfcmlog(m)). The C-PEF complexity is f times that of C-PE. The complexity of the C-FFF algorithm O(nfmclog(c)) is dominated by f (fixed frequency level) and clogc. As the number of nodes (m) in the data center increases, the complexity of the C-PE dominates the overhead caused by the constant f in C-FFF. The proposed C-FFF algorithm with complexity O(nfmclog(c)) performs load balancing, while maintaining a better tradeoff between utilization and power consumption than the standard C-PE algorithm with complexity O(ncmlog(m)).

8. Conclusions

Energy consumption and carbon footprint problems in data centers are handled using different VM placement algorithms with static and dynamic PUE. The data center energy efficiency metric PUE and carbon usage effectiveness are used as important measures for data center selection. The proposed C-FFF and C-PEF placement algorithms perform placement decisions by maintaining the optimal p-state of the servers. In C-PEF, host selection is based on the power-efficient optimal p-state of the servers. In C-FFF, the host selection is based on the optimal p-state of the servers. Both C-FFF and C-PE are compared with a standard power-efficient algorithm (C-PE), where the host selection is based on the highest power-efficient p-state of the servers. Different VM types with varying execution times and arrival rates are used to simulate the system load. The resulting outcomes for scenario I reveal that C-FFF can reduce the carbon footprint by a minimum of 2% more than C-PE, C-FFLE, and C-FF. The experimental results illustrate the importance of considering the DVFS of the servers, along with PUE and carbon release of clusters in data centers. The results for the algorithms in scenario II emphasize the impact of dynamic PUE on the carbon footprints. The C-FF algorithm shows significant improvement over C-FFLE in power reduction, displaying a trade-off between effective resource utilization and power consumption. Among the three power-aware algorithms, C-PEF and C-PE have additional computational overhead due to greedy search function. The results support the fact that C-FFF balances computational overhead and utilization, and stands in between C-PEF and C-PE with some degree of minimum resource request constraint. In conclusion, C-FFF is a power-efficient algorithm for VM placement with reduced computational overhead. The formulations presented in this work open new and challenging areas of further research relating to renewable energy sources.

Author Contributions

Conceptualization, T.R. and K.G.; methodology, T.R. and K.G.; writing—original draft preparation, T.R. and K.G.; supervision, K.G. and P.S.; writing—review and editing, N.P. and P.S. All authors have read and agreed to the published version of the manuscript.

Funding

This research received no external funding.

Conflicts of Interest

The authors declare no conflict of interest.

References

  1. Foster, I.; Zhao, Z.; Raicu, I.; Lu, S. Cloud Computing and Grid Computing 360-Degree Compared; Grid Computing Environments Workshop: Austin, TX, USA, 2008. [Google Scholar] [CrossRef] [Green Version]
  2. Ghatikar, G. Demand Response Opportunities and Enabling Technologies for Datacenters: Findings from Field Studies. Available online: https://escholarship.org/uc/item/7bh6n6kt (accessed on 9 December 2019). [CrossRef] [Green Version]
  3. Patel, P.; Ranabahu, A.H.; Sheth, A.P. Service Level Agreementin Cloud Computing. 2009. Available online: https://corescholar.libraries.wright.edu/knoesis/78/ (accessed on 9 December 2019).
  4. Liu, H. A measurement study of server utilization in public clouds. In Proceedings of the 2011 IEEE Ninth International Conference on Dependable, Autonomic and Secure Computing, Sydney, Australia, 12–14 December 2011; pp. 435–442. [Google Scholar] [CrossRef]
  5. Varasteh, A.; Goudarzi, M. Server consolidation techniques in virtualized data centers: A survey. IEEE Syst. J. 2015, 11, 772–783. [Google Scholar] [CrossRef]
  6. Gholami, M.F.; Daneshgar, F.; Low, G.; Beydoun, G. Cloud migration process—A survey, evaluation framework, and open challenges. J. Syst. Softw. 2016, 120, 31–69. [Google Scholar] [CrossRef]
  7. Buyya, R.; Beloglazov, A.; Abawajy, J. Energy-efficient management of data center resources for cloud computing: A vision, architectural elements, and openchallenges. In Proceedings of the 2010 International Conference on Parallel and Distributed Processing Techniques and Applications (PDPTA 2010), Las Vegas, NV, USA, 12–15 July 2010. [Google Scholar]
  8. Jin, Y.; Wen, Y.; Chen, Q.; Zhu, Z. An empirical investigation of the impact of server virtualization on energy efficiency for green data center. Comput. J. 2013, 56, 977–990. [Google Scholar] [CrossRef]
  9. Lu, Z.; Takashige, S.; Sugita, Y.; Morimura, T.; Kudo, Y. An analysis and comparison of cloud data center energy efficient resource management technology. Int. J. Serv. Comput. 2014, 2, 32–51. [Google Scholar] [CrossRef]
  10. Panneerselvam, J.; Liu, L.; Hardy, J.; Antonopoulos, N. Analysis, Modelling and Characterisation of Zombie Servers in Large-Scale Cloud Data centres. IEEE Access 2017, 5, 15040–15054. [Google Scholar] [CrossRef]
  11. Gandhi, A.; Harchol-Balter, M.; Das, R.; Lefurgy, C. Optimal power allocation in server farms. In ACMSIGMETRICS Performance Evaluation Review; Association for Computing Machinery: New York, NY, USA, 2009; Volume 37, pp. 157–168. [Google Scholar] [CrossRef] [Green Version]
  12. Aydin, H.; Yang, Q. Energy-aware partitioning for multi processor real-time systems. In Proceedings of the International Parallel and Distributed Processing Symposium, Nice, France, 22–26 April 2003; pp. 9–12. [Google Scholar] [CrossRef] [Green Version]
  13. LeSueur, E.; Heiser, G. Dynamic voltage and frequency scaling: The laws of diminishing returns. In Proceedings of the 2010 International Conference on Power Aware Computing and Systems, Atlanta, GA, USA, 19–23 April 2010; pp. 1–8. [Google Scholar]
  14. Yang, C.Y.; Chen, J.J.; Kuo, T.W.; Thiele, L. An approximation scheme for energy-efficient scheduling of real-time task sin heterogeneous multiprocessor systems. In Proceedings of the Design, Automation & Test in Europe Conference & Exhibition, Nice, France, 20–24 April 2009; pp. 694–699. [Google Scholar] [CrossRef] [Green Version]
  15. Barroso, L.A.; Clidaras, J.; Hölzle, U. The data center as a computer: An introduction to the design of warehouse-scale machines. Synth. Lect. Comput. Archit. 2009, 4, 1–108. [Google Scholar] [CrossRef]
  16. Khargharia, B.; Hariri, S.; Szidarovszky, F.; Houri, M.; El-Rewini, H.; Khan, S.U.; Ahmad, I.; Yousif, M.S. Autonomic power & performance management for large-scale data centers. In Proceedings of the 2007 IEEE International Parallel and Distributed Processing Symposium, Rome, Italy, 26–30 March 2007; pp. 1–8. [Google Scholar] [CrossRef]
  17. Mastroleon, L.; Bambos, N.; Kozyrakis, C.; Economou, D. Automatic power management schemes for internet servers and data centers. In Proceedings of the GLOBECOM’05 IEEE Global Telecommunications Conference, St. Louis, MO, USA, 28 November–2 December 2005; pp. 5–10. [Google Scholar] [CrossRef]
  18. Raghavendra, R.; Ranganathan, P.; Talwar, V.; Wang, Z.; Zhu, X. No power struggles: Coordinated multi-level power management for the data center. In Proceedings of the ACMSIGOPS Operating Systems Review 2008, Seattle, WA, USA, 1–5 March 2008; Volume 42, pp. 48–59. [Google Scholar] [CrossRef]
  19. Le, K.; Bianchini, R.; Martonosi, M.; Nguyen, T.D. Cost-and energy-aware load distribution across data centers. Proc. Hot Power 2009, 1–5. [Google Scholar]
  20. Berral, J.L.; Goiri, Í.; Nou, R.; Julià, F.; Guitart, J.; Gavaldà, R.; Torres, J. Towards energy-aware scheduling in data centers using machine learning. In Proceedings of the 1st International Conference on Energy-Efficient Computing and Networking, Passau, Germany, 13–15 April 2010; pp. 215–224. [Google Scholar] [CrossRef] [Green Version]
  21. Kolodziej, J.; Khan, S.U.; Xhafa, F. Genetic algorithms for energy-aware scheduling in computational grids. In Proceedings of the International Conferenceon P2P, Parallel, Grid, Cloud and Internet Computing, Barcelona, Catalonia, Spain, 26–28 October 2011; pp. 17–24. [Google Scholar] [CrossRef]
  22. Barbagallo, D.; DiNitto, E.; Dubois, D.J.; Mirandola, R. Abio-inspired algorithm for energy optimization in a self-organizing data center. In Proceedings of the International Worksh opon Self-Organizing Architecture, Cambridge, UK, 14–17 September 2009; pp. 127–151. [Google Scholar] [CrossRef]
  23. Mazzucco, M.; Dyachuk, D.; Deters, R. Maximizing cloud providers’ revenues via energy aware allocation policies. In Proceedings of the IEEE 3rd International Conference on Cloud Computing, Miami, FA, USA, 5–16 July 2010; pp. 131–138. [Google Scholar] [CrossRef] [Green Version]
  24. Khosravi, A.; Garg, S.K.; Buyya, R. Energy and carbon-efficient placement of virtual machines in distributed cloud data centers. In Proceedings of the European Conference on Parallel Processing, Aachen, Germany, 26–30 August 2013; pp. 317–328. [Google Scholar] [CrossRef] [Green Version]
  25. Li, H.; Zhu, G.; Cui, C.; Tang, H.; Dou, Y.; He, C. Energy-efficient migration and consolidation algorithm of virtual machines in data centers for cloud computing. Computing 2016, 98, 303–317. [Google Scholar] [CrossRef]
  26. Beloglazov, A.; Buyya, R. Energy efficient allocation of virtual machines in cloud data centers. In Proceedings of the IEEE/ACM International Conference on Cluster, Cloud and Grid Computing, Melbourne, Australia, 17–20 May 2010; pp. 577–578. [Google Scholar] [CrossRef]
  27. Borgetto, D.; Casanova, H.; DaCosta, G.; Pierson, J.M. Energy-aware service allocation. Future Gener. Comput. Syst. 2012, 28, 769–779. [Google Scholar] [CrossRef]
  28. Mastelic, T.; Oleksiak, A.; Claussen, H.; Brandic, I.; Pierson, J.M.; Vasilakos, A.V. Cloud computing: Survey on energy efficiency. ACM Comput. Surv. 2014, 47, 1–36. [Google Scholar] [CrossRef]
  29. Strunk, A.; Dargie, W. Does live migration of virtual machines cost energy? In Proceedings of the IEEE 27th International Conference on Advanced Information Networking and Applications (AINA), Barcelona, Spain, 25–28 March 2013; pp. 514–521. [Google Scholar] [CrossRef]
  30. Strunk, A. A light weight model for estimating energy cost of live migration of virtual machines. In Proceedings of the IEEE Sixth International Conference on Cloud Computing, Santa Clara, CA, USA, 28 June–3 July 2013; pp. 510–517. [Google Scholar] [CrossRef]
  31. Ye, K.; Jiang, X.; Huang, D.; Chen, J.; Wang, B. Live migration of multiple virtual machines with resource reservation in cloud computing environments. In Proceedings of the 2011 IEEE 4th International Conference on Cloud Computing, Washington, DC, USA, 4–9 July 2011; pp. 267–274. [Google Scholar] [CrossRef]
  32. Wu, C.M.; Chang, R.S.; Chan, H.Y. A green energy-efficient scheduling algorithm using the DVFS technique for cloud data centers. Future Gener. Comput. Syst. 2014, 37, 141–147. [Google Scholar] [CrossRef]
  33. Wu, G.; Tang, M.; Tian, Y.C.; Li, W. Energy-efficient virtual machine placement in data centers by genetic algorithm. In Proceedings of the 19th International Conference on Neural Information Processing, Doha, Qatar, 12–15 November 2012; pp. 315–323. [Google Scholar] [CrossRef] [Green Version]
  34. Dong, J.; Jin, X.; Wang, H.; Li, Y.; Zhang, P.; Cheng, S. Energy-saving virtual machine placement in cloud data centers. In Proceedings of the 13th IEEE/ACM International Symposium on Cluster, Cloud, and Grid Computing, Delft, The Netherlands, 13–16 May 2013; pp. 618–624. [Google Scholar] [CrossRef]
  35. Sun, M.; Gu, W.; Zhang, X.; Shi, H.; Zhang, W. A matrix transformation algorithm for virtual machine placement in cloud. In Proceedings of the 12th IEEE International Conference on Trust, Security and Privacy in Computing and Communications, Melbourne, Australia, 16–18 July 2013; pp. 1778–1783. [Google Scholar] [CrossRef]
  36. Pires, F.L.; Barán, B. A virtual machine placement taxonomy. In Proceedings of the 15th IEEE/ACM International Symposium on Cluster, Cloud and Grid Computing, Shenzhen, China, 4–7 May 2015; pp. 159–168. [Google Scholar] [CrossRef]
  37. Beloglazov, A.; Abawajy, J.; Buyya, R. Energy-aware resource allocation heuristics for efficient management of data centers for cloud computing. Future Gener. Comput. Syst. 2012, 28, 755–768. [Google Scholar] [CrossRef] [Green Version]
  38. Li, X.; Qian, Z.; Lu, S.; Wu, J. Energy efficient virtual machine placement algorithm with balanced and improved resource utilization in a datacenter. Math. Comput. Model. 2013, 58, 1222–1235. [Google Scholar] [CrossRef]
  39. Tseng, F.H.; Wang, X.; Chou, L.D.; Chao, H.C.; Leung, V.C. Dynamic resource prediction and allocation for cloud data center using the multi objective genetic algorithm. IEEE Syst. J. 2017, 12, 1688–1699. [Google Scholar] [CrossRef]
  40. Alharbi, F.; Tian, Y.C.; Tang, M.; Zhang, W.Z.; Peng, C.; Fei, M. An ant colony system for energy-efficient dynamic virtual machine placement in data centers. Expert Syst. Appl. 2019, 120, 228–238. [Google Scholar] [CrossRef]
  41. Gu, L.; Zeng, D.; Barnawi, A.; Guo, S.; Stojmenovic, I. Optimal task placement with QoS constraints in geo-distributed data centers using DVFS. IEEE Trans. Comput. 2014, 64, 2049–2059. [Google Scholar] [CrossRef]
  42. Gu, L.; Zeng, D.; Guo, S. QoS-Aware Task Placement in Geo-distributed Data Centers with Low OPEX Using Dynamic Frequency Scaling. In Proceedings of the 2013 IEEE 10th International Conference on High Performance Computing and Communications & 2013 IEEE International Conference on Embedded and Ubiquitous Computing, Zhangjiajie, China, 13–15 November 2013; pp. 80–84. [Google Scholar] [CrossRef]
  43. Le, K.; Bianchini, R.; Nguyen, T.D.; Bilgir, O.; Martonosi, M. Capping the brown energy consumption of internet services at low cost. In Proceedings of the International Conference on Green Computing, Chicago, IL, USA, 15–18 August 2010; pp. 3–14. [Google Scholar] [CrossRef] [Green Version]
  44. Zhou, X.; Wang, K.; Jia, W.; Guo, M. Reinforcement learning-based adaptive resource management of differentiated services in geo-distributed data centers. In Proceedings of the 2017 IEEE/ACM 25th International Symposium on Quality of Service (IWQoS), VilanovaIla Geltrú, Spain, 14–16 June 2017; pp. 1–6. [Google Scholar] [CrossRef]
  45. Jonardi, E.; Oxley, M.A.; Pasricha, S.; Maciejewski, A.A.; Siegel, H.J. Energy cost optimization for geo graphically distributed heterogeneous data centers. In Proceedings of the 2015 Sixth International Green and Sustainable Computing Conference (IGSC), Las Vegas, NV, USA, 14–16 December 2015; pp. 1–6. [Google Scholar] [CrossRef]
  46. Smart City Cluster Collaboration. Existing Data Centres Energy Metrics—Task1; Smart City Cluster Collaboration. 2014. Available online: http://www.dolfin-fp7.eu/wp-content/uploads/2014/01/Task-1-List-of-DC-Energy-Related-Metrics-Final.pdf (accessed on 9 December 2019).
  47. Hanson, H.; Keckler, S.W.; Ghiasi, S.; Rajamani, K.; Rawson, F.; Rubio, J. Thermal response to DVFS: Analysis with an Intel Pentium M. In Proceedings of the 2007 International Symposium on Low Power Electronics and Design (ISLPED’07), Portland, OR, USA, 27–29 August 2007; pp. 219–224. [Google Scholar] [CrossRef]
  48. Zhang, X.; Wu, T.; Chen, M.; Wei, T.; Zhou, J.; Hu, S.; Buyya, R. Energy-aware virtual machine allocation for cloud with resource reservation. J. Syst. Softw. 2019, 147. [Google Scholar] [CrossRef]
  49. Mukherjee, T.; Tang, Q.; Ziesman, C.; Gupta, S.K.; Cayton, P. Software architecture for dynamic thermal management in data centers. In Proceedings of the 2007 2nd International Conference on Communication Systems Software and Middleware, Bangalore, India, 7–12 January 2007; pp. 1–11. [Google Scholar] [CrossRef]
  50. Liu, Z.; Chen, Y.; Bash, C.; Wierman, A.; Gmach, D.; Wang, Z.; Marwah, M.; Hyser, C. Renewable and cooling aware work load management for sustainable data centers. In Proceedings of the ACMSIGMETRICS Performance Evaluation Review, London, UK, 11–15 June 2012; Volume 40, pp. 175–186. [Google Scholar] [CrossRef] [Green Version]
  51. Moore, J.D.; Chase, J.S.; Ranganathan, P.; Sharma, R.K. Making Scheduling “Cool”: Temperature-Aware Work load Placement in Data Centers. In Proceedings of the USENIX Annual Technical Conference, Marriott Anaheim, CA, USA, 10–15 April 2005; pp. 61–75. [Google Scholar]
  52. Wang, L.; Khan, S.U.; Dayal, J. Thermal aware work load placement with task-temperature profiles in a data center. J. Supercomput. 2012, 61, 780–803. [Google Scholar] [CrossRef]
  53. Standard Performance Evaluation Corporation. SPEC Power 2008; Standard Performance Evaluation Corporation: Gainesville, VA, USA, 2008; Available online: http://www.spec.org/power_ssj2008 (accessed on 9 December 2019).
  54. Sawyer, R. Calculating Total Power Requirements for Data Centers. White Paper, American Power Conversion. 2004. Available online: http://accessdc.net/Download/Access_PDFs/pdf1/Calculating%20Total%20Power%20Requirements%20for%20Data%20Centers.pdf (accessed on 9 December 2019).
  55. Available online: http://cloud.agroclimate.org/tools/deprecated/carbonFootprint/references/Electricity_emission_factor.pdf. (accessed on 2 February 2020).
  56. Beloglazov, A.; Buyya, R. Optimal online deterministic algorithms and adaptive heuristics for energy and performance efficient dynamic consolidation of virtual machines in cloud data centers. Concurr. Comput. Pract. Exp. 2012, 24, 1397–1420. [Google Scholar] [CrossRef]
  57. Lublin, U.; Feitelson, D.G. The work load on parallel supercomputers: Modeling the characteristics ofrigid jobs. J. Parallel Distrib. Comput. 2003, 63, 1105–1122. [Google Scholar] [CrossRef]
Figure 1. System model.
Applsci 10 02701 g001
Figure 2. Host selection policy for carbon- and power-efficient optimal frequency(C-PEF).
Applsci 10 02701 g002
Figure 3. VM Request arrival
Applsci 10 02701 g003
Figure 4. Processor demand at different intervals
Applsci 10 02701 g004
Figure 5. Active PMs with 100% RVA (first 8 reservation cycles).
Applsci 10 02701 g005
Figure 6. (a)Power consumption and (b) carbon footprint of all algorithms with 100% RVA.
Applsci 10 02701 g006aApplsci 10 02701 g006b
Figure 7. (a)Power consumption and (b) carbon footprint comparisons of all algorithms.
Applsci 10 02701 g007
Figure 8. (a) Power consumption values with low utilization. (b) Carbon footprint values with high utilization. C-PEF and C-FFF are compared with other algorithms in terms of CPU utilization.
Applsci 10 02701 g008
Figure 9. Carbon footprint.
Applsci 10 02701 g009
Figure 10. Power consumption.
Applsci 10 02701 g010
Table 1. Physical machine characteristics [24].
MachinesFrequency(GHz)No. of CoresPower ModelMemory(GB)Storage (GB)Network Bandwidth (Mbps)
M12211620001000
M24413260001000
M34823270002000
M48826470004000
M5168212890004000
Table 2. Power (in watts) model of physical machines (PMs) [24].
Power ModelIdle10%20%30%40%50%60%70%80%90%100%
1606366.871.376.883.290.7100111.5125.4140.7
241.646.752.357.965.47380.789.599.6105113
Table 3. Virtual machine request types [24].
NameECUCore Speed(GHz)Memory(MB)Storage(GB)Network Band Width(Mbps)Probability
M1.small1117401605000.25-BT
M1.large2476808505000.25-BT/0.12-WR
M1.xlarge4815,360100010000.08-WR
M2xlarge26.517,510100010000.12-WR
M22.xlarge41335,020100010000.08-WR
C1.median2517405005000.1-BT
Table 4. Datacenter features [24].
Data CenterCarbon Footprint Rate
(CFR) in Tons/MWh
PUE
DC10.124, 0.1471.56
DC20.350, 0.6581.7
DC30.466, 0.7821.9
DC40.678, 0.7302.1
Table 5. Power consumption for 100% ratio of VM acceptance (RVA).
Interval (300 s)Active VMsPower Consumption (kW)Total Active PMs Total CPU Utilization %
C-PEFC-PEC-FFFC-FFLEC-FFC-PEFC-PEC-FFFC-FFLEC-FF
1641512.531436.841626.452070.331954.24503656605610.94
21232596.982624.792879.363624.093185.068974981069120.90
31813646.544106.174003.475360.294935.6411111612315113629.34
42374997.415505.735272.046951.476278.7114115215319617238.46
52886228.526717.206270.418246.137189.1717518617523119947.02
63347056.557453.367207.619257.918179.2519820820325822754.36
73818010.128428.668295.9010295.599043.7422723823828925263.09
84208770.999264.718951.7111077.279856.8125326225831227669.76
Table 6. Processor utilization for 100% RVA.
Reservation IntervalMinimum CPU Utilization %Number of Hosts with 100% CPU Utilization
C-PEFC-PEC-FFFC-FFLEC-FFC-PEFC-PEC-FFFC-FFLEC-FF
140.625502550501723173533
231.2562.5255062.51942276256
340.6255040.62562.562.55675649691
462.562.540.6255062.59110194127118
562.550505062.5113121117152138
65040.62540.62562.562.5125146135173159
762.562.540.6255040.625142162153188172
831.2562.531.2540.62562.5156176164204189
Table 7. Power and carbon footprint for different VM placement algorithms.
Placement AlgorithmPower (kW)Carbon Footprint(Tons)Number of VMs Placed
C-FFF676,296.277548.723825751634
C-PE691,256.289449.873350091611
C-PEF665,341.003148.284960061623
C-FFLE782,225.641959.797329011622
C-FF695,623.9250.49027891598
Table 8. RVA for all VM placement algorithms.
RVA% Under Different VM Requests
Algorithm4819101276159118612000
C-FFF10088.6813281.504781.5839181.3003881.7909
C-PE10087.0329780.1724180.3268480.0644880.5903
C-PEF10088.3516581.0344881.0182380.6555681.14057
C-FFLE10087.2527580.72181.2696480.6018381.14057
C-FF10087.0329780.0156780.0125779.3659379.93997
Table 9. Statistical analysis of different VM placement algorithms.
C-FFFC-PEC-PEFC-FFLEC-FF
Metric% CPU UtilizationPower (kW)% CPU UtilizationPower (kW)% CPU UtilizationPower (kW)% CPU UtilizationPower (kW)% CPU UtilizationPower (kW)
Min0.147116260.147114370.147115130.147120700.14711954
Max89.126.76 × 105 90.046.91 × 105 588.386.65 × 10592.467.82 × 10589.876.96 × 105
Mean48.64.49 × 10548.914.58 × 10547.824.42 × 10550.465.17 × 10548.974.64 × 105
Table 10. Power and carbon footprint with dynamic power usage effectiveness (PUE).
Placement AlgorithmPower(kW)Carbon Footprint (Tons)Number of VMs Placed
C-PEF564,350.923.6312271617
C-PE628,328.424.1913221636
C-FFF582,335.124.354451641
Table 11. RVA % with dynamic PUE.
RVA% with Different VM Requests
Algorithm4819101276159118612000
C-PEF98.9687.1481.4280.9580.6580.89
C-PE10088.481.9782.0881.6782.09
C-FFF99.3788.6982.6683.5882.382.84
Table 12. Statistical analysis with dynamic PUE.
C-FFFC-PEC-PEF
Metric%CPU UtilizationPower (kW)%CPU UtilizationPower (kW)%CPU UtilizationPower (kW)
Min0.147110290.1471644.50.1471969
Max88.945.823 × 10589.676.283 × 10586.695.644 × 105
Mean48.333.854 × 10548.484.156 × 10546.253.74 × 105

