Topology and Response Surface Optimization of a Bicycle Crank Arm with Multiple Load Cases


Abstract
:1. Introduction
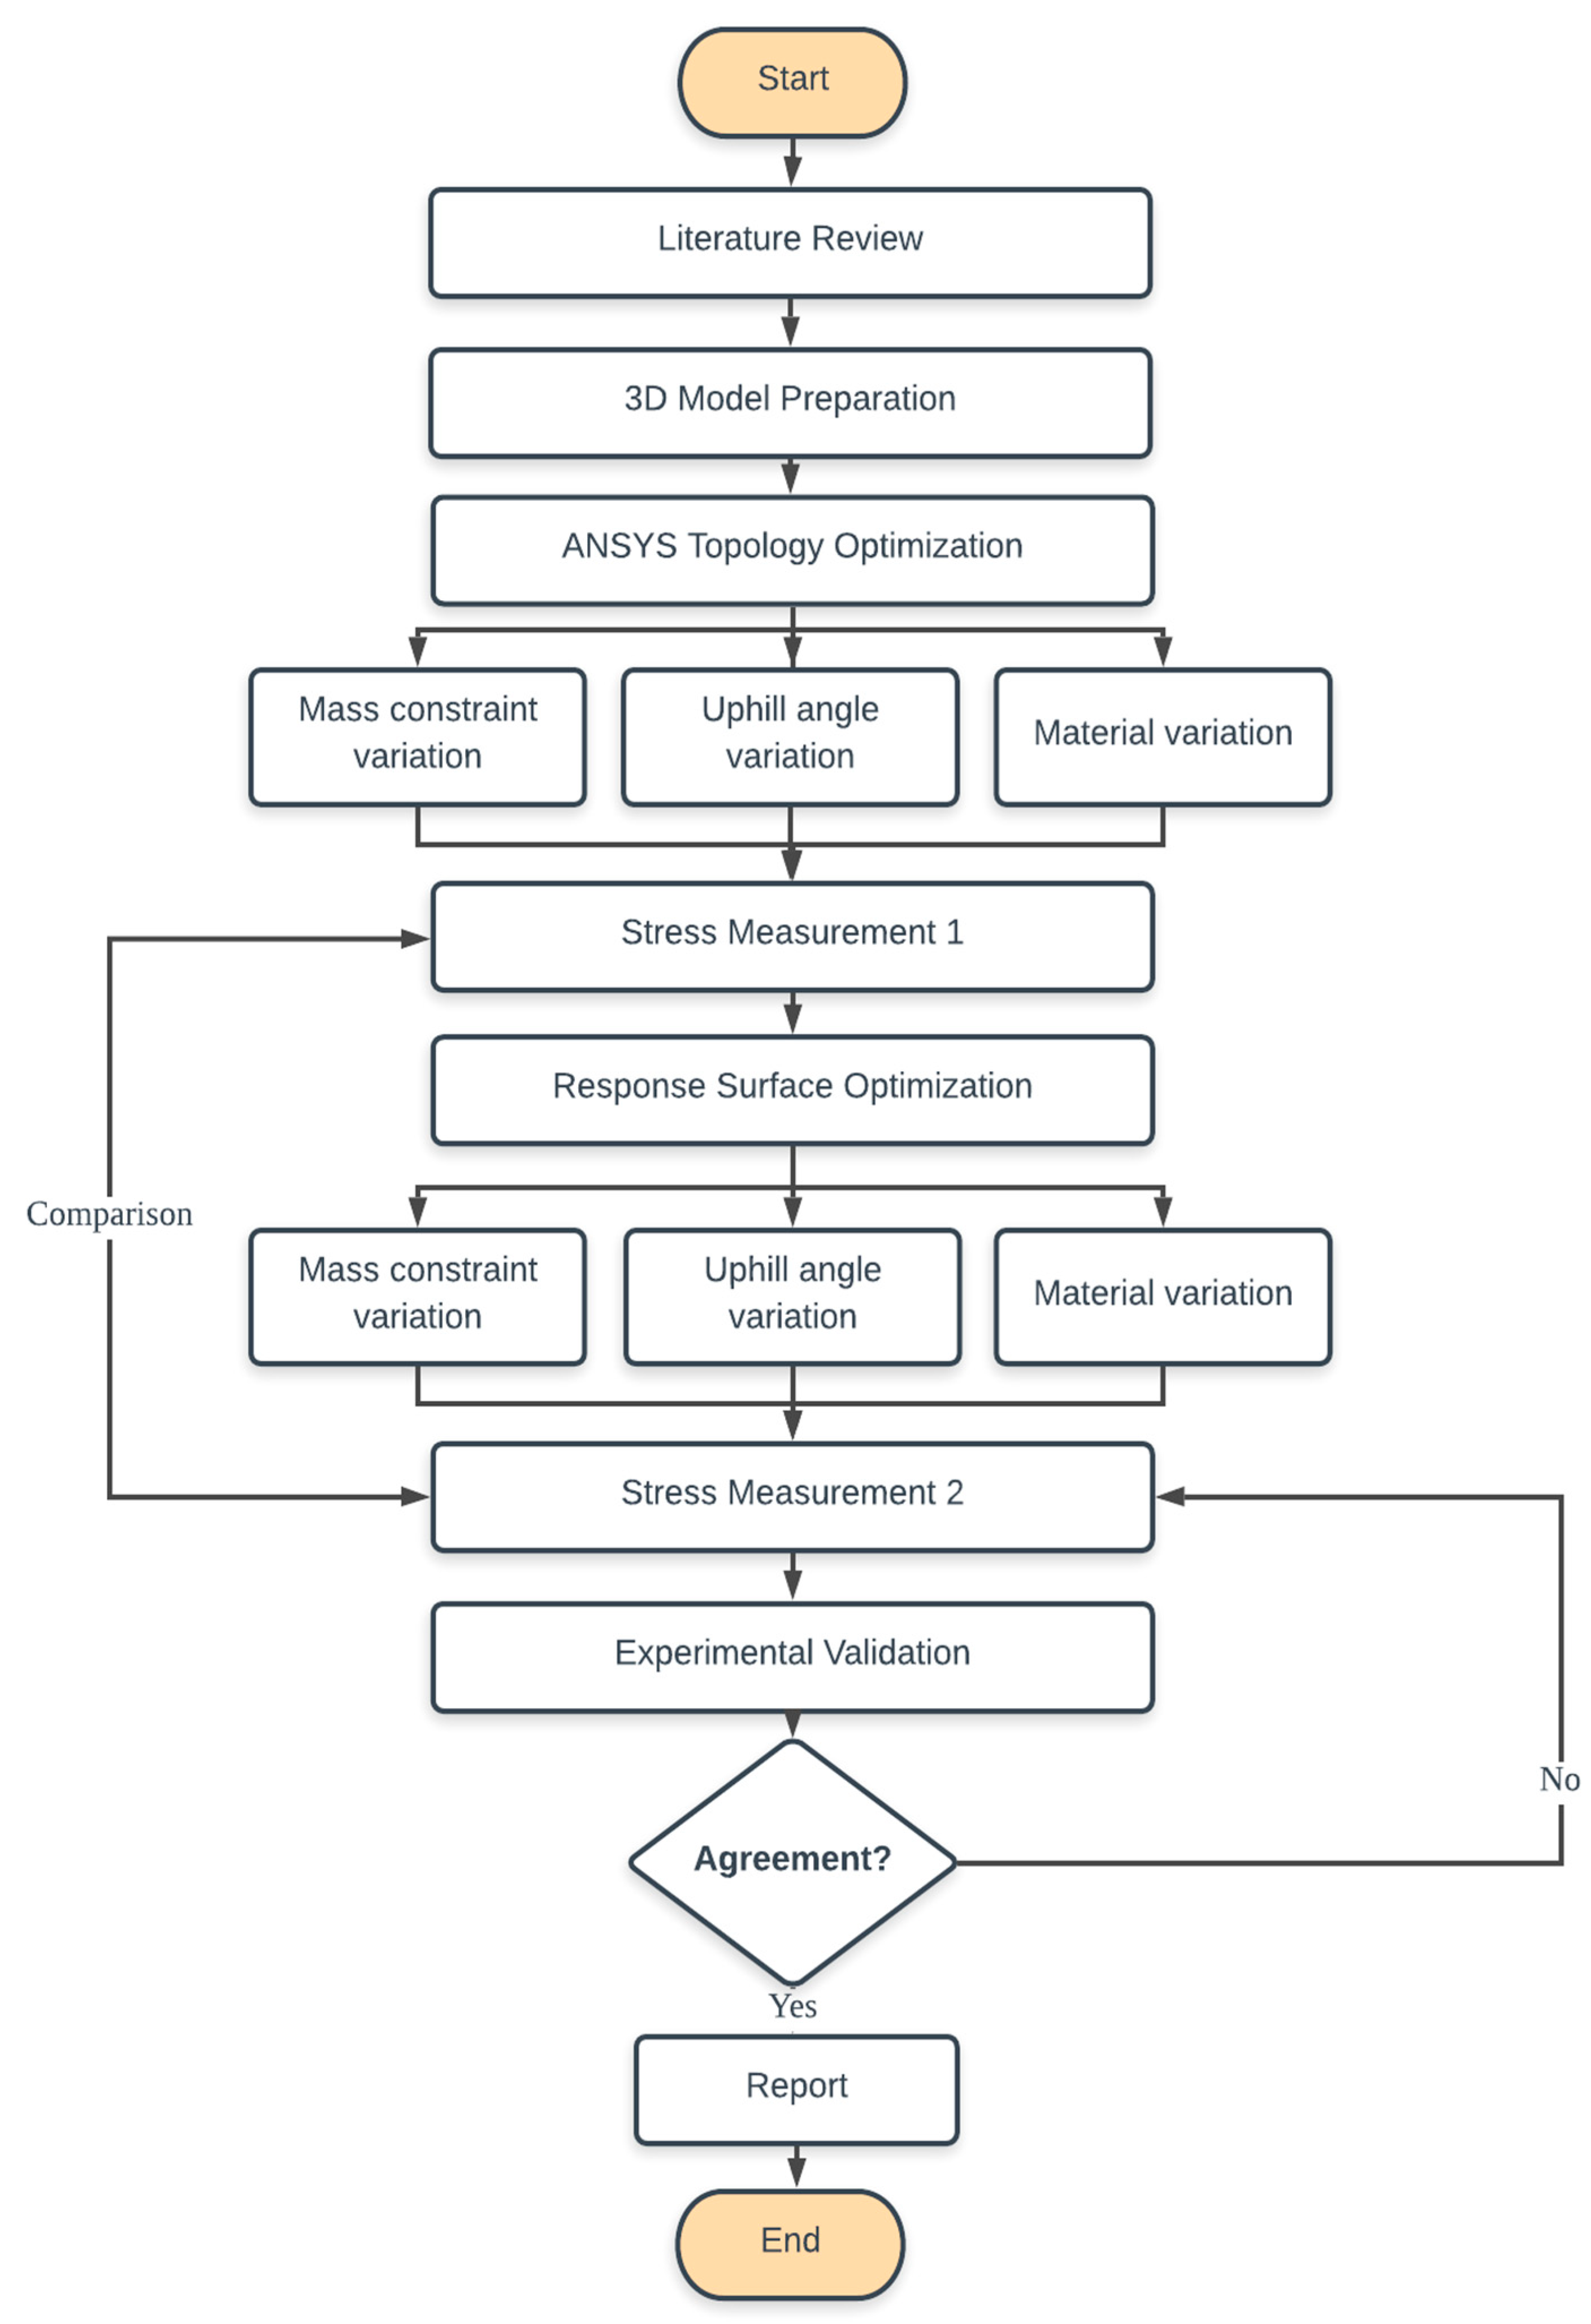
2. Methods
2.1. Models
2.2. Topology Optimization Method
2.2.1. Effect of Mass Constraint
2.2.2. Effect of Stress Constraint
2.2.3. Effect of Uphill Angle
2.2.4. Effect of Materials
2.3. Response Surface Optimization Method
2.4. Experimental Validation
3. Results and Discussion
3.1. Topology Optimization Result
3.1.1. Geometry Creation
3.1.2. Effect of Mass Constraint
3.1.3. Effect of Stress Constraint
3.1.4. Effect of Uphill Angle
3.1.5. Effect of Materials
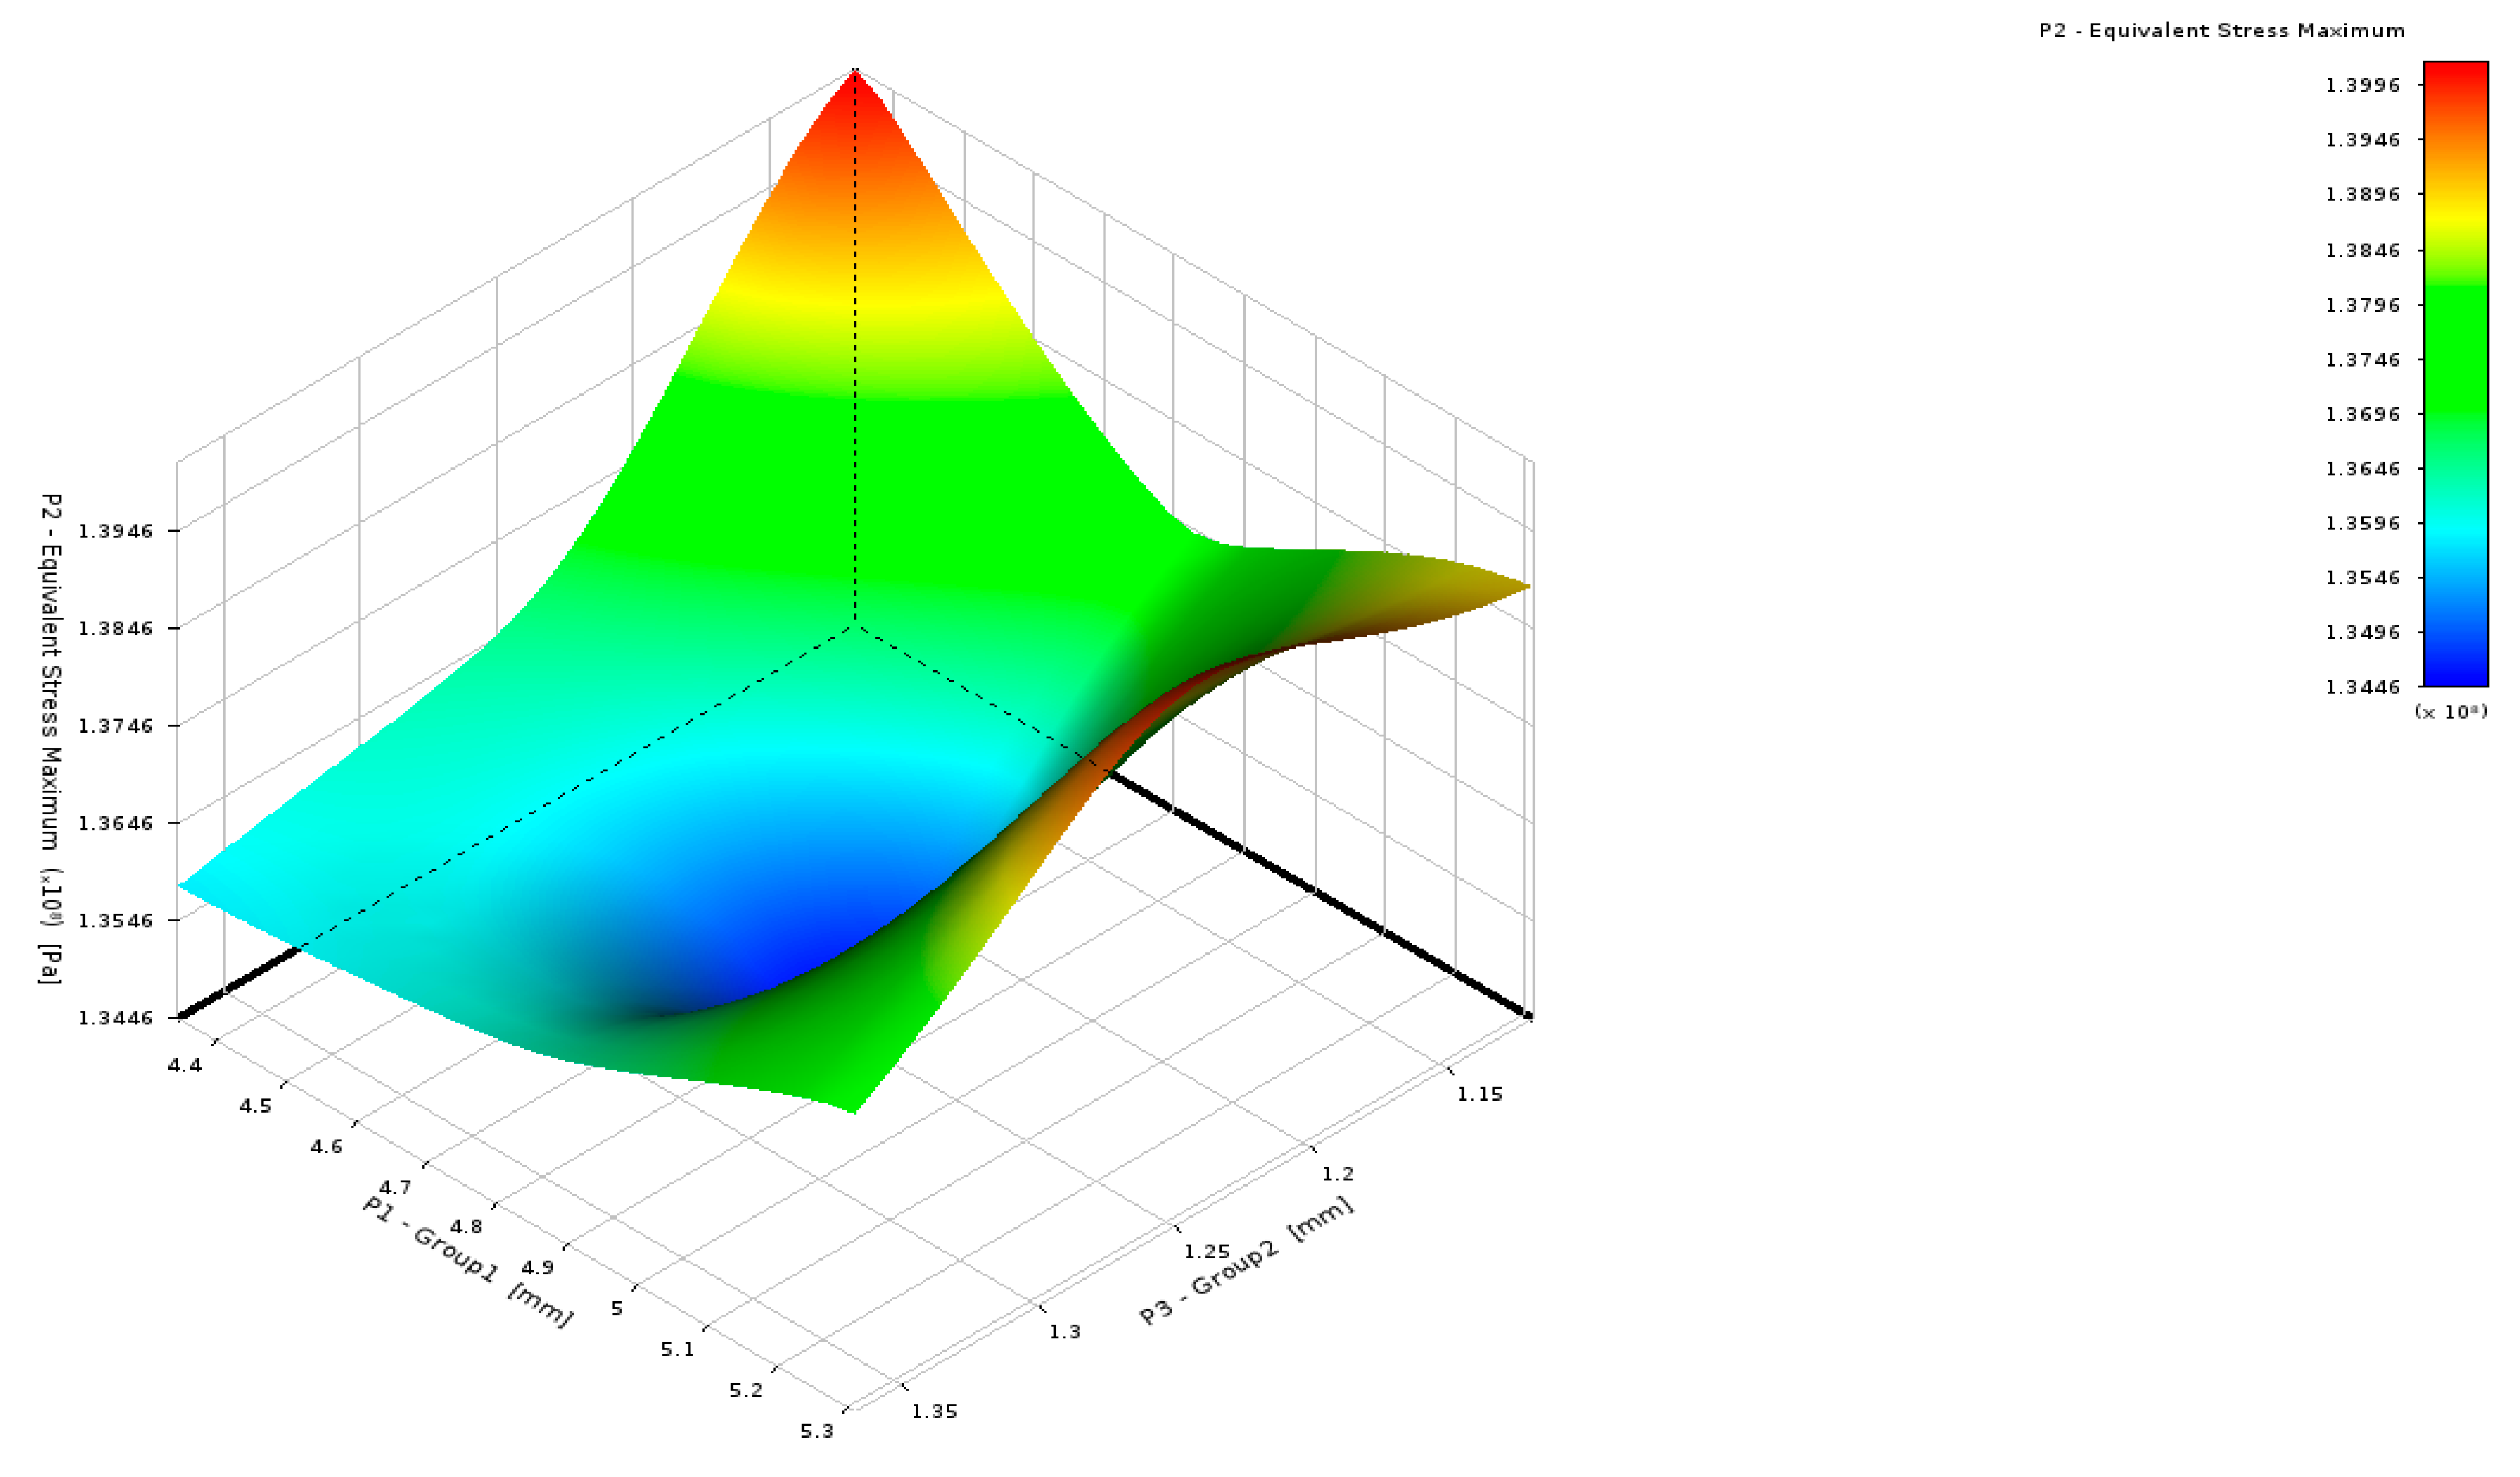
3.2. Response Surface Optimization
3.3. Experimental Validation
4. Conclusions
- The topology optimization successfully provides structural mass reduction up to 70% from the initial mass. This is a very effective way to create a lightweight structure that is important in the development of future bicycle design. From several constraint investigations, the topology optimization method is also capable of providing many geometrical options for the design of a lightweight crank arm.
- The response surface method is also found to be effective as a shape optimization tool for this crank arm case. It is able to enhance the stress level performance of the optimized crank arm obtained from topology optimization.
- The optimized model has been validated by static and dynamic experiments which shows a very well agreement. A comparison study with the previous conventional bike crank arm design shows that the optimized geometry, with less mass, can give a similar performance and possibly be improved in the future.
- Improvement opportunities can be made in the future involving more detail of dynamic analysis and experimental studies, i.e., speed variations and road conditions to enhance the application of the crank arm in some particular application, i.e., hybrid and electric bicycle.
Author Contributions
Funding
Conflicts of Interest
References
- Höchli, B.; Brügger, A.; Abegglen, R.; Messner, C. Using a goal theoretical perspective to reduce negative and promote positive spillover after a bike-to-work campaign. Front. Psychol. 2019, 10, 433. [Google Scholar] [CrossRef] [PubMed] [Green Version]
- Shin, H.C.; Kim, D.; Lee, J.Y.; Park, J.; Jeong, S.Y. Bicycle Transport Policy in Korea; Korea Transport Institute: Geumnam-myeon, Korean, 2013. [Google Scholar]
- ISO. International Standard ISO and Safety Requirements for Systems and Components Used on Machinery as Defined; ISO: Geneve, Switzerland, 2010; Volume 2010. [Google Scholar]
- Sena Cardoso, F.; Rasmussen, K.J.R.; Zhang, H. System reliability-based criteria for the design of steel storage rack frames by advanced analysis: Part I—Statistical characterisation of system strength. Thin-Walled Struct. 2019, 141, 713–724. [Google Scholar] [CrossRef]
- Dai, W.; Chi, Y.; Lu, Z.; Wang, M.; Zhao, Y. Research on reliability assessment of mechanical equipment based on the performance-feature model. Appl. Sci. 2018, 8, 1619. [Google Scholar] [CrossRef] [Green Version]
- Batchelder, J.S.; Crump, S.S. Method for Rapid Prototyping of Solid Models. U.S. Patent 5866058, 2 February 1999. Available online: https://patents.google.com/patent/US5866058A/en (accessed on 3 April 2019).
- Edwards, C.H. Light-Weight Bicycle Crankshaft Assembly Utilizing Two-Piece Axle Integrally Joined to Crank Arms. U.S. Patent 5493937, 27 February 1996. [Google Scholar]
- Zamparo, P.; Minetti, A.E.; Di Prampero, P.E. Mechanical efficiency of cycling with a new developed pedal-crank. J. Biomech. 2002, 35, 1387–1398. [Google Scholar] [CrossRef]
- Bendose, M.P.; Sigmund, O. Toplogy Optimization, Theory, Methods and Applications; Springer: Berlin, Germany, 2003. [Google Scholar]
- Yang, D.; Liu, H.; Zhang, W.; Li, S. Stress-constrained topology optimization based on maximum stress measures. Comput. Struct. 2018, 198, 23–39. [Google Scholar] [CrossRef]
- Viviani, A.; Iuspa, L.; Aprovitola, A. Multi-objective optimization for re-entry spacecraft conceptual design using a free-form shape generator. Aerosp. Sci. Technol. 2017, 71, 312–324. [Google Scholar] [CrossRef]
- Zhang, P.; Xu, Y.; Le, C.; Ding, H.; Guo, Y. Structural Optimization Method for the Transition Section in Composite Bucket Foundations of Offshore Wind Turbines. Energies 2018, 11, 3230. [Google Scholar] [CrossRef] [Green Version]
- Slavov, S.; Konsulova-Bakalova, M. Optimizing Weight of Housing Elements of Two-stage Reducer by Using the Topology Management Optimization Capabilities Integrated in SOLIDWORKS: A Case Study. Machines 2019, 7, 9. [Google Scholar] [CrossRef] [Green Version]
- Orme, M.; Madera, I.; Gschweitl, M.; Ferrari, M. Topology Optimization for Additive Manufacturing as an Enabler for Light Weight Flight Hardware. Designs 2018, 2, 51. [Google Scholar] [CrossRef] [Green Version]
- Qu, Y.; Jiang, Y.; Feng, L.; Li, X.; Liu, B.; Wang, W. Lightweight Design of Multi-Objective Topology for a Large-Aperture Space Mirror. Appl. Sci. 2018, 8, 2259. [Google Scholar] [CrossRef] [Green Version]
- Sleesongsom, S.; Bureerat, S. Topology Optimisation Using MPBILs and Multi-Grid Ground Element. Appl. Sci. 2018, 8, 271. [Google Scholar] [CrossRef] [Green Version]
- Frascolla, V.; Dominicini, C.K.; Paiva, M.H.M.; Caporossi, G.; Marotta, M.; Riberio, M.R.N.; Segatto, M.E.V.; Martenillo, M.; Monteiro, M.E.; Both, C.B. Optimizing C-RAN Backhaul Topologies: A Resilience-Oriented Approach Using Graph Invariants. Appl. Sci. 2019, 9, 136. [Google Scholar] [CrossRef] [Green Version]
- Tauzowski, P.; Blachowski, B.; Lógó, J. Advances in Engineering Software Functor-oriented topology optimization of elasto-plastic structures. Adv. Eng. Softw. 2019, 135, 102690. [Google Scholar] [CrossRef]
- Pinskier, J.; Shirinzadeh, B. Topology optimization of leaf flexures to maximize in-plane to out-of-plane compliance ratio. Precis. Eng. 2019, 55, 397–407. [Google Scholar] [CrossRef]
- Hu, Z.; Gadipudi, V.K.; Salem, D.R. Topology Optimization of Lightweight Lattice Structural Composites Inspired by Cuttlefish Bone. Appl. Compos. Mater. 2019, 26, 15–27. [Google Scholar] [CrossRef]
- Tsavdaridis, K.D.; Efthymiou, E.; Adugu, A.; Hughes, J.A.; Grekavicius, L. Application of structural topology optimisation in aluminium cross-sectional design. Thin Walled Struct. 2019, 139, 372–388. [Google Scholar] [CrossRef]
- Jewett, J.L.; Carstensen, J.V. Topology-optimized design, construction and experimental evaluation of concrete beams. Autom. Constr. 2019, 102, 59–67. [Google Scholar] [CrossRef]
- McEwen, I.; Cooper, D.; Warnett, J.; Kourra, N.; Williams, M.; Gibbons, G. Design & Manufacture of a High-Performance Bicycle Crank by Additive Manufacturing. Appl. Sci. 2018, 8, 1360. [Google Scholar]
- Casas, O.V.; Dalazen, R.; Balbinot, A. 3D load cell for measure force in a bicycle crank. Meas. J. Int. Meas. Confed. 2016, 93, 189–201. [Google Scholar] [CrossRef]
- Sung, J.; Ba Hung, N.; Yoon, S.; Lim, O. A study of the dynamic characteristics and required power of an electric bicycle equipped with a semi-automatic transmission. Energy Procedia 2017, 142, 2057–2064. [Google Scholar] [CrossRef]
- Ba Hung, N.; Lim, O. The effects of operating conditions and structural parameters on the dynamic, electric consumption and power generation characteristics of an electric assisted bicycle. Appl. Energy 2019, 247, 285–296. [Google Scholar] [CrossRef]
- Minus, M.L.; Kumar, S. The processing, properties, and structure of carbon fibers. JOM 2005, 57, 52–58. [Google Scholar] [CrossRef]
- Li, Q.; Xu, R.; Liu, J.; Liu, S.; Zhang, S. Topology optimization design of multi-scale structures with alterable microstructural length-width ratios. Compos. Struct. 2019, 230, 111454. [Google Scholar] [CrossRef]
- Kazakis, G.; Kanellopoulos, I.; Sotiropoulos, S.; Lagaros, N.D. Topology optimization aided structural design: Interpretation, computational aspects and 3D printing. Heliyon 2017, 3, e00431. [Google Scholar] [CrossRef]
- Bouillod, A.; Pinot, J.; Valade, A.; Cassirame, J.; Soto-Romero, G.; Grappe, F. Influence of standing position on mechanical and energy costs in uphill cycling. J. Biomech. 2018, 72, 99–105. [Google Scholar] [CrossRef]
- Farhan, A.M.; Abd-Alla, A.M.; Khder, M.A. On problem of the stresses in a non-homogeneous composite of an infinite cylinder of orthotropic material. Results Appl. Math. 2019, 3, 100014. [Google Scholar] [CrossRef]
- Ramos, J.A.C.; lvarez-Caldas, C.; Quesada, A.; Román, J.L.S. Determining the Stress Distribution in a Bicycle Crank Under In-Service Loads. Exp. Tech. 2016, 40, 885–890. [Google Scholar] [CrossRef]


| Crank angle | 30° | 45° | 60° | 90° | 120° | 135° | 150° |
| Force (N) | 1300 | 1625 | 2250 | 2750 | 2250 | 2125 | 1900 |
| Case | 1 | 2 | 3 | ||||||
|---|---|---|---|---|---|---|---|---|---|
| Angle (θ) | 1 | 2 | 3 | 1 | 2 | 3 | 1 | 2 | 3 |
| 10° | 20° | 30° | 10° | 20° | 30° | 10° | 20° | 30° | |
| Weight (w) | 0.9 | 0.05 | 0.05 | 0.05 | 0.9 | 0.05 | 0.05 | 0.05 | 0.9 |
| Material | AL 7005 Aluminum (Isotropic) | Carbon Fiber (Anisotropic) |
|---|---|---|
| Density | 2780 kg/m3 | 1750 kg/m3 |
| Young’s Modulus | 71,000 MPa | - |
| Young’s Modulus (x-direction) | - | 3.95 × 10¹¹ Pa |
| Young’s Modulus (y-direction) | - | 6 × 10⁹ Pa |
| Young’s Modulus (z-direction) | - | 6 × 10⁹ Pa |
| Poisson’s ratio | 0.33 | - |
| Poisson’s ratio (xy-direction) | - | 0.2 |
| Poisson’s ratio (yz-direction) | - | 0.4 |
| Poisson’s ratio (xz-direction) | - | 0.2 |
| Shear Modulus | 2.67 × 10¹⁰ Pa | - |
| Shear Modulus (xy-direction) | - | 8 × 10⁹ Pa |
| Shear Modulus (yz-direction) | - | 2.14 × 10⁹ Pa |
| Shear Modulus (xz-direction) | - | 8 × 10⁹ Pa |
| Ultimate Tensile Strength | 280 MPa | 3500 MPa |
| Sample | Final Mass (kg) | Compliance (J) | Stress (MPa) | ||||
|---|---|---|---|---|---|---|---|
| Coarse Mesh | Fine Mesh | Coarse Mesh | Fine Mesh | Coarse Mesh | Fine Mesh | ||
| Compliance Minimization | 50% Mass constraint | 0.15 | 0.15 | 0.0002 | 0.00021 | 68.27 | 91.09 |
| 60% Mass constraint | 0.18 | 0.19 | 0.0002 | 0.00021 | 57.63 | 85.01 | |
| Mass Minimization | 80% Stress Constraint | 0.17 | 0.16 | 0.0003 | 0.0003 | 64.8 | 92.0 |
| 90% Stress Constraint | 0.16 | 0.15 | 0.0007 | 0.00069 | 66.7 | 133.6 | |
| Sample | Topology Optimization (MPa) | Response Surface Method (MPa) | Reduction (%) | |
|---|---|---|---|---|
| Compliance Minimization | 30% Mass constraint | 127.5 | 126.4 | 0.80 |
| 40% Mass constraint | 105.8 | 105.7 | 0.10 | |
| 50% Mass constraint | 91.09 | 71.2 | 21.8 | |
| 60% Mass constraint | 85.01 | 71.4 | 16.0 | |
| Mass Minimization | 80% Stress Constraint | 92.0 | 87.2 | 5.21 |
| 90% Stress Constraint | 133.6 | 133.3 | 0.22 | |
| Compliance Minimization | Uphill Angle Case 1 | 101.3 | 99.9 | 1.38 |
| Uphill Angle Case 2 | 115.9 | 113.9 | 1.72 | |
| Uphill Angle Case 3 | 124.3 | 120.3 | 3.21 | |
| Carbon Fiber | 187.8 | 186.2 | 0.85 | |
| ANSYS Simulation (MPa) | Static Load Experiment (MPa) | % Error |
|---|---|---|
| 1.078 | 0.98 | 8.4 |
© 2020 by the authors. Licensee MDPI, Basel, Switzerland. This article is an open access article distributed under the terms and conditions of the Creative Commons Attribution (CC BY) license (http://creativecommons.org/licenses/by/4.0/).
Share and Cite
Ismail, A.Y.; Na, G.; Koo, B. Topology and Response Surface Optimization of a Bicycle Crank Arm with Multiple Load Cases. Appl. Sci. 2020, 10, 2201. https://doi.org/10.3390/app10062201
Ismail AY, Na G, Koo B. Topology and Response Surface Optimization of a Bicycle Crank Arm with Multiple Load Cases. Applied Sciences. 2020; 10(6):2201. https://doi.org/10.3390/app10062201
Chicago/Turabian StyleIsmail, Ahmad Yusuf, Gangta Na, and Bonyong Koo. 2020. "Topology and Response Surface Optimization of a Bicycle Crank Arm with Multiple Load Cases" Applied Sciences 10, no. 6: 2201. https://doi.org/10.3390/app10062201