Article

Experimental Study on Stress Corrosion Index Governing Time-Dependent Degradation of Rock Strength

1
TBM Team, SK E&C, Seoul 03149, Korea
2
Department of Earth Resources and Environmental Engineering, Hanyang University, Seoul 04763, Korea
*
Author to whom correspondence should be addressed.
Appl. Sci. 2020, 10(6), 2175; https://doi.org/10.3390/app10062175
Submission received: 14 February 2020 / Revised: 10 March 2020 / Accepted: 20 March 2020 / Published: 23 March 2020

Abstract

:
Rock fractures in geological conditions are caused not only by applied stress, but also by stress corrosion. Stress corrosion is an environmentally activated chemical process, associated with the fluid-assisted crack growth. Crack growth due to stress corrosion is related to the time-dependent behaviours of rocks and is a crucial factor in determining the stability of underground structures over the long period of time. In this study, constant stress-rate tests including Brazilian tension and three-point flexural tests for the tensile strength, short-beam compression and single-shear tests for the in-plane shear strength, and a torsion test of rectangular section specimens and a circumferentially notched cylindrical specimen test for the out-of-plane shear strength were conducted at a different loading rate from 0.01 to 10 MPa/s using Coconino sandstone. The results show that the rock strength was proportional to the 1/(n+1)th power of the loading rate, where the parameter n indicates the stress corrosion index. The stress corrosion index (n) ranged from 34 to 38, with an average value of 36. The stress corrosion indices (n) were similar, irrespective of the loading configuration and specimen geometry. The stress corrosion index (n) can, therefore, be regarded as a material constant of rocks.

1. Introduction

According to conventional fracture mechanics, cracks typically form when the stress intensity factor approaches or surpasses a critical stress intensity factor, Kc. However, crack formation in structures which have been loaded over time do not adhere to conventional fracture mechanics, and may propagate at a stress intensity factors significantly lower than the critical value, commonly referred to as subcritical crack growth. Scholars have proposed various potential mechanisms explaining the phenomenon of subcritical crack growth: stress corrosion, dissolution, diffusion, ion change, and microplasticity [1,2]. All of these mechanisms involve the influence of an environmental agent’s chemical activity at the tip of a crack in rocks.
The fundamental mechanism for subcritical crack growth of rocks is known as stress corrosion [1]. The interaction of strained bonds with pore water at a crack tip leads to a degraded condition in which the bonds may be separated at lower stresses than the substantial bonds [1]. The hydrolysis of strong Si-O bonds for silicate rocks results in weaker H-bonded hydroxyl groups connecting the Si atoms [3,4,5,6]. The following chemical reaction explains this process.
H-O-H + [≡Si-O-Si≡] ↔ 2[≡Si-OH]
Figure 1 provides a diagram for the crack velocity and normalised stress intensity factor of subcritical crack growth in rocks [2,7]. The rate of stress corrosion at crack tips affects the crack growth velocity in region 1, i.e., the interval 0.2KcK ≤ 0.8Kc [2,7]. Region 2 is found in certain glasses and ceramics but rarely in rocks [2,7,8]. Crack growth is mainly driven by mechanical rupture in region 3.
The empirical power law relationship can describe the subcritical crack growth as follows [2,7]:
v = A ( K K c ) n
where v indicates the crack velocity, A and n are the parameters of subcritical crack growth, K is the stress intensity factor, and Kc refers to fracture toughness. The parameter n in the equation is referred to as the stress corrosion index.
Rock fractures in geological conditions are caused not only by applied stress, but also by stress corrosion. Stress corrosion is an environmentally activated chemical process associated with the fluid-assisted crack growth. Crack growth caused by stress corrosion is related to the time-dependent behaviours of rocks and is a crucial factor in determining the stability of underground structures over a long period of time.
Sano et al. [9] reported that the influence of stress rate on the uniaxial compressive strength can be expressed as the 1/(n+1)th power of the loading rate. Similarly, according to the subcritical crack growth theory [10], the fracture strength is directly proportionate to the 1/(n+1)th power of the loading rate, where the parameter n represents the stress corrosion index, which is related to the time dependence of rocks. Many researchers have reported that the strength of rocks increases slightly when the loading rate increases under static and quasi-static loading [11,12,13,14,15,16]. Zhang and Zhao [17] reported that the rock strength increases significantly after the loading rate is above a critical value under dynamic loading.
The degradation of the rock strength on the loading rate under static and quasi-static loading is related to subcritical crack growth caused by stress corrosion. Under static loading, the strength of rock decreases when the rock has a relatively low value of the stress corrosion index for a given loading rate [9]. Kemeny [18] developed a time-dependent model of rock joint cohesion degradation. At a higher value of the stress corrosion index, it was shown to have a higher value of cohesion and a longer lifetime.
Many experimental studies involving double-torsion tests have been conducted on subcritical crack growth to determine the stress corrosion index [1,2,7,19,20,21]. Atkinson [1,6,7] and Swanson [19] characterised the subcritical crack growth according to the relationship between the stress intensity factor and crack velocity. Nara et al. [20] investigated the effect of relative humidity on subcritical crack growth in sandstone using the double-torsion testing method. They reported that subcritical crack growth in sandstone was significantly affected by relative humidity. Although double-torsion tests have been used in many studies to examine subcritical crack growth, they have limitations [22,23]. First, the double-torsion tests require a significantly thin plate with a thickness of 3–5 mm, and it is challenging to produce the specimens. Second, the heterogeneity of the rock results in poor repeatability of the relationship between stress intensity factor and crack velocity. Third, the loading equipment and method are sophisticated. Finally, only mode I tension loading is applicable. Ko and Kemeny [22] conducted several experimental tests to verify the constant stress-rate test to determine the stress corrosion index in rocks. They reported that the results of the constant stress-rate test agreed well with those of a double-torsion test.
The effects of loading rate on the rock strength have long been studied, but there have been few studies on the relationship between stress corrosion and the degradation of rock strength with applied loading rate. Moreover, the effects of loading conditions, such as tensile or shear loading, and the fracture modes on the degradation of strength with loading rate have not been studied in detail. The objective of this study was to investigate the relationship between stress corrosion, which is the major cause of time-dependent cracking and the degradation of rock strength with loading rate under different loading conditions and fracture modes. The constant stress-rate test was used to determine the stress corrosion index. The constant stress-rate tests including Brazilian tension and three-point flexural tests for the tensile strength, short-beam compression and single-shear tests for the in-plane shear strength, and a torsion test of rectangular section specimens and a circumferentially notched cylindrical specimen test for the out-of-plane shear strength were conducted at different loading rates from 0.01 to 10 MPa/s using Coconino sandstone.
The degradation of rock strength on the loading rate was analysed with different loading conditions and fracturing modes. The values of stress corrosion index (n) obtained from tensile, in-plane, and out-of-plane shear strength tests were compared. Additionally, the values of n were obtained from published data for different rock types with different loading conditions and compared with the results of the laboratory tests.

2. Materials and Methods

2.1. Determination of Stress Corrosion Index thouhgh Constant Stress-Rate Tests

Material strength increases with an increased stress rate generally. This principle is used in the constant stress-rate test to relate the fracture strength, and the stress rate applied.
Under a uniform remote stress, the generalised expression of the stress intensity factor is
K = Y σ a
where Y is a geometric factor associated with the crack geometry, σ is the stress applied, and a is the length of the crack.
The crack velocity, v, is given by
v = d a d t = d a d σ d σ d t = d a d σ σ ˙
where σ ˙ represents the stress rate.
Rearranging Equation (4) yields
d σ = σ ˙ v d a
By substituting Equation (2) in Equation (5), we obtain
d σ = σ ˙ A ( K K C ) n d a
Substituting Equation (3) in Equation (6) yields
d σ = σ ˙ A ( Y σ a K C ) n d a = σ ˙ K C n A Y n 1 σ n a n / 2 d a
Rearranging Equation (7) and integrating it yields
1 n + 1 ( σ f n + 1 σ o n + 1 ) = 2 K C n ( n 2 ) A Y n σ ˙ a i 2 n 2 ( 1 1 ( a f a i ) n 2 2 )
where σo represents the initial stress, σf represents the fracture stress in a corrosive environment, ai represents the initial crack length, and af represents the final crack length.
Initial stress is assumed to have zero and that (af/ai)(n−2)/2 quickly becomes significantly greater than unity, since n is usually a large number. Then, Equation (8) can be reduced to
σ f n + 1 = 2 ( n + 1 ) K C n σ ˙ ( n 2 ) A Y n a i n 2 2
The fracture toughness in an inert environment can be expressed as
K C = Y σ i a i
where σi represents the inert strength in an inert state in which there is no subcritical crack growth.
By rearranging Equation (10) with respect to the crack length, we obtain
a i = ( K C σ i Y ) 2 ; σ i n 2 2 = K C n 2 σ i n 2 Y n 2
Substituting Equation (11) in Equation (9) yields
σ f n + 1 = 2 ( n + 1 ) K C 2 ( n 2 ) A Y 2 σ i n 2 σ ˙
Then, taking the log on both sides of Equation (12) gives
log σ f = 1 n + 1 log σ ˙ + log C
where
log C = 1 n + 1 log ( 2 K C 2 ( n + 1 ) A Y 2 ( n 2 ) σ i n 2 )
The stress corrosion index n is determined on the basis of the slope (α) of the linear regression using all the log fracture strength values compared with the log stress rate results. The stress corrosion index (n) is defined
n = 1 α 1
This research used four specific loading rates of 10−2, 10−1, 100, and 10 MPa/s. Seven to eight specimens were tested at each loading rate and 28 to 32 specimens in total were utilized in each test procedure.

2.2. Mechanical Properties of Tested Material

Coconino sandstone from quarries near Flagstaff, Arizona, was used in this study. Table 1 presents the mechanical properties of Coconino sandstone, such as the uniaxial compressive strength (σc), Brazilian tensile strength (σt), Young’s modulus (E), Poisson’s ratio (ν), bulk modulus (K), internal friction angle (ϕ), and cohesion (C). Bulk modulus can be used to determine that material is soft or hard [24].
Bedding is one of the features commonly observed in sedimentary rocks. All bedding planes are generally weak planes. All specimens were designed so that the direction in which the crack or fracture propagated was perpendicular to the bedding planes. All specimens were dried in an oven at 40 °C for 24 h. Then, they were placed in the desiccator until the specimens were tested to reduce air humidity exposure. The relative humidity was less than 15 percent in the laboratory.

2.3. Test Methods

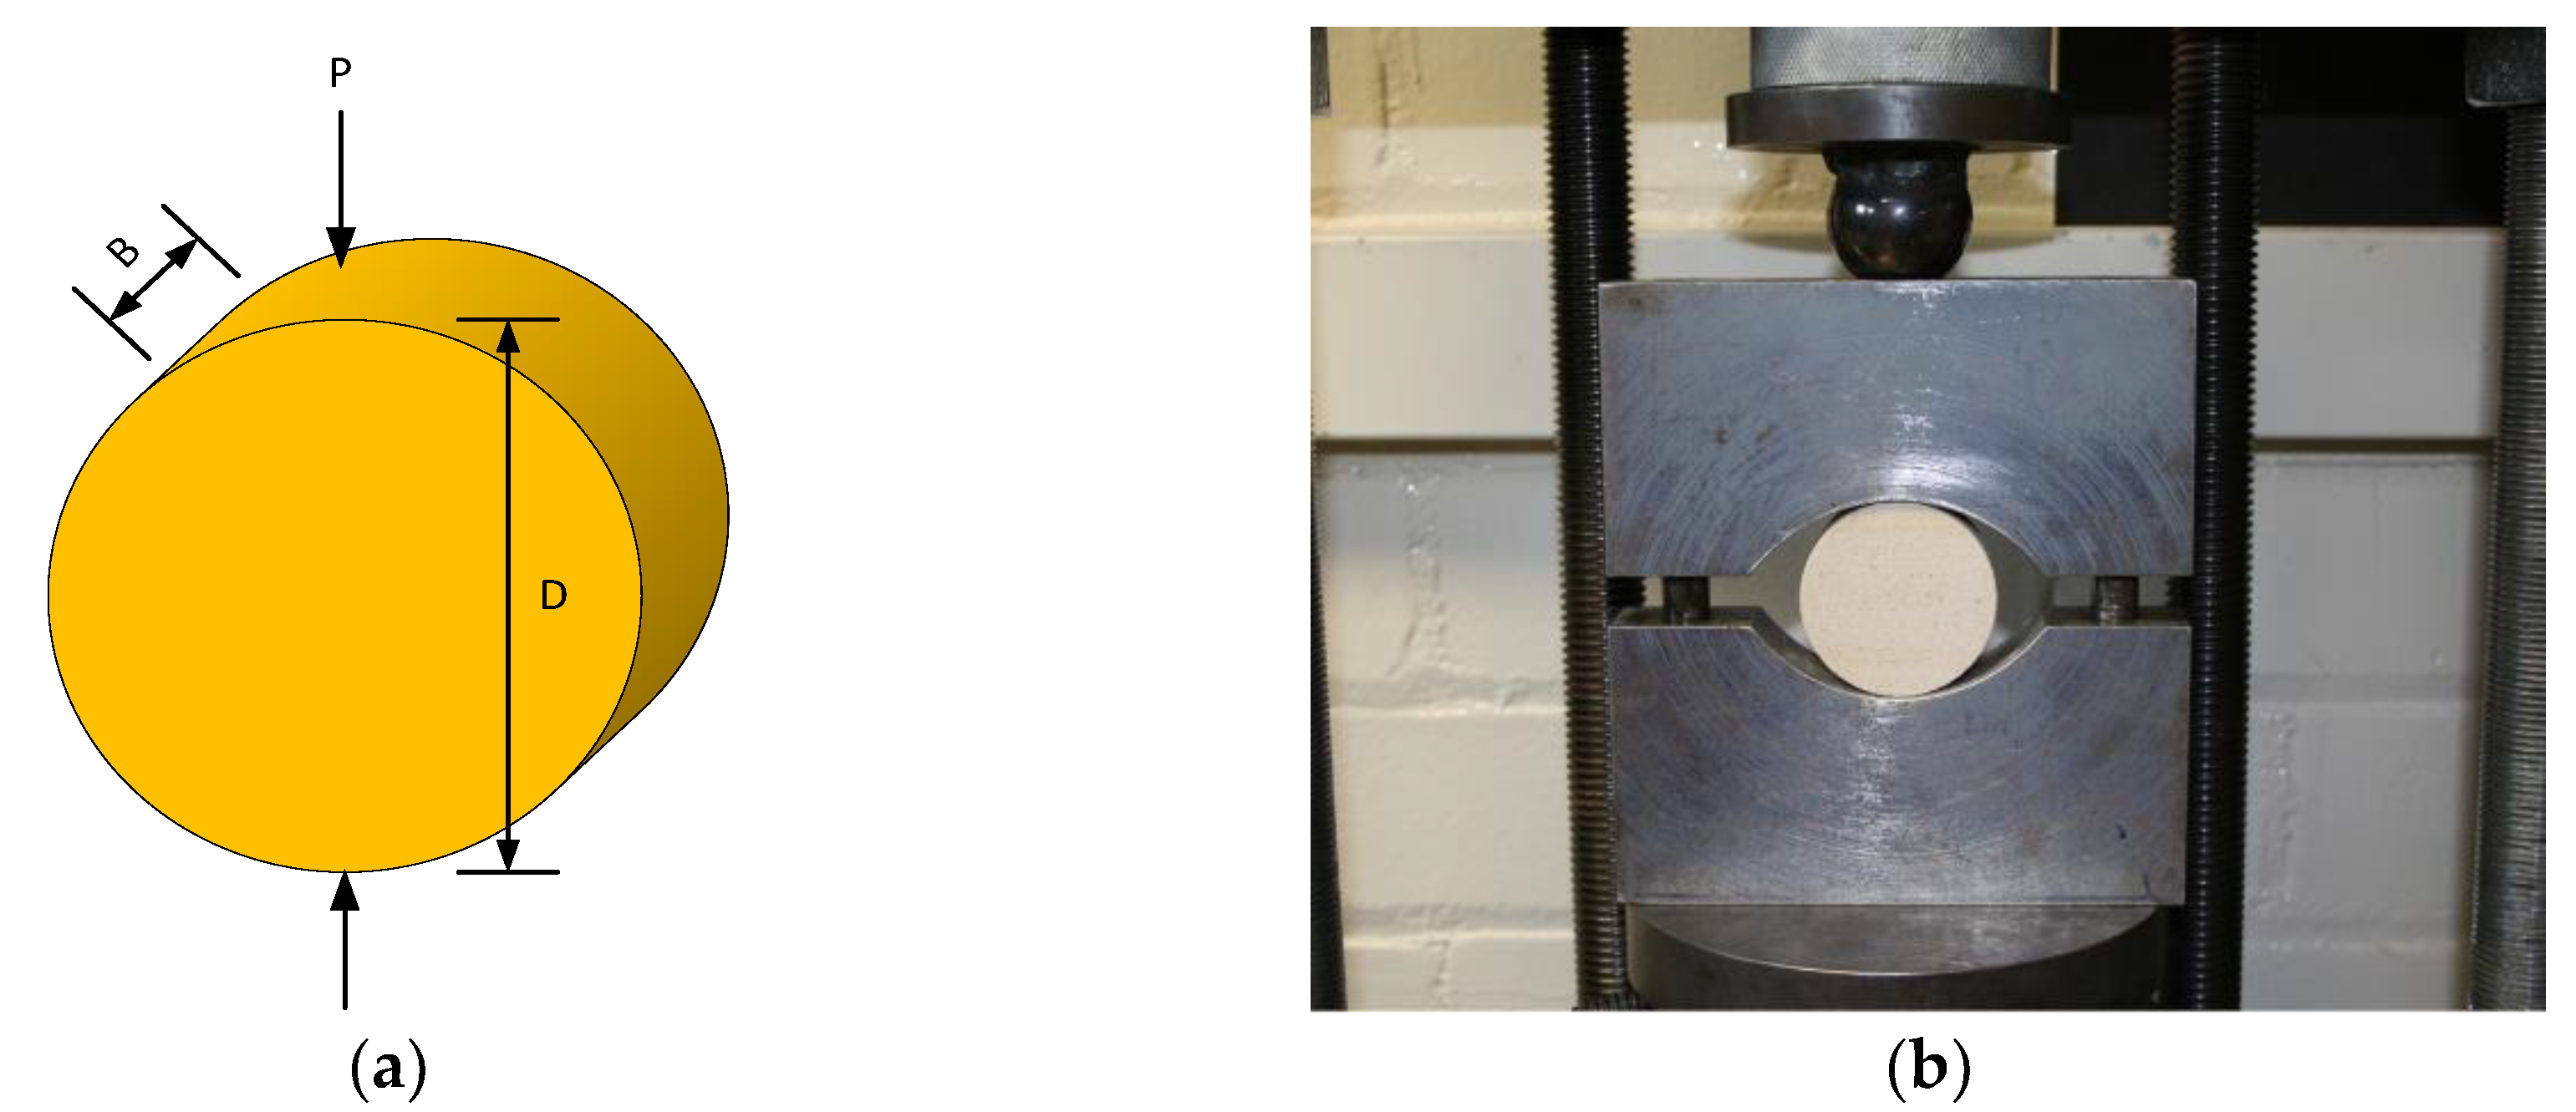
2.3.1. Brazilian Tension Test

The Brazilian tension test involves subjecting a disc or cylinder of rock to compression. The specimens were prepared by taking a core of 50.8 mm diameter D from blocks of Coconino sandstone. The cores were cut to a thickness B of 25.4 mm. Figure 2 shows the specimen geometry and test configuration. The fracture strength (or tensile strength), σf, can be determined using the following equation:
σ f = 2 P π D B
where P is the load applied to failure, D is the diameter of the disc, and B is the thickness of the disc.
Four loading rates were employed: 10−2, 10−1, 100, and 10 MPa/s. At each loading stage, eight specimens were used and thus, the Brazilian tension test evaluated a total of 32 specimens to determine the stress corrosion index (n).

2.3.2. Three-Point Flexural Test

In the three-point flexural test, a beam rests on two outer supports, and a concentrated load is applied to the top of the specimen at its centre. The top of the specimen is under compression, while the surface at the bottom is tensioned. The maximum tensile stress takes place under the loading point on the base of the specimen. The flexural strength is given by
σ f = 3 P S 2 B b 2
where σf represents the flexural strength, P represents the applied load, S represents the support span (152.4 mm), B represents the width of the specimen (38.1 mm), and b represents the thickness of the specimen (38.1 mm).
In the load control scheme, four loading rates (102, 101, 100, and 10 MPa/s) were used. For each loading rate, seven specimens were used; thus, 28 specimens in total were tested. Figure 3 shows the specimen geometry and test set-up for the three-point flexural test.

2.3.3. Short-Beam Compression Test

A short-beam compression test was conducted to assess the in-plane shear strength of the Coconino sandstone. The geometry of a specimen and test set-up are presented in Figure 4.
The height H, width W, and thickness B of the specimen were 101.6, 50.8, and 25.4 mm, respectively. At the central part of the specimen, two parallel and separate straight-through notches were sawed. The notches had a length of a = W/2 = 25.4 mm and were separated by a distance of c = 20.32 mm. For the specimen used in the short-beam compression test, the notch separation ratio (c/H) was set as 0.2.
During the test, a guide frame was used to prevent the buckling and bending of the specimen. The guide frame also reduced the lateral movement of the specimen and allowed the propagation of the fracture under in-plane shear failure. To reduce the friction, Teflon sheets were positioned between the specimen and the guide frame.
The in-plane shear strength was calculated as follows:
τ f = P c B
where τf represents the shear strength, and P represents the applied force at failure (when a shear crack is produced).
In the load control scheme, four loading rates (10−2, 10−1, 100, and 10 MPa/s) were used. Seven specimens were used under each loading-rate condition; thus, in total, 28 specimens were evaluated in the short-beam compression tests to determine the stress corrosion index (n).

2.3.4. Single-Shear Test

The width W, height H, and thickness B of the single-shear test specimens were 76.2, 71.12, and 25.4 mm, respectively. Figure 5 presents the specimen geometry and the test set-up. The top and bottom of the specimens had a straight-through notch with a length of a = 25.4 mm. Rollers were mounted between the guide frame and the loading plate on the right side to enable the loading plate to move freely vertically and reduce the friction between the right guide frame and the loading plate. To prevent the guide frame from falling or tilting during the experiment, a heavy weight was mounted on top of the left guide frame. The left guide frame was set once the specimen was mounted in the guide frame so that the specimen was laterally constrained to facilitate in-plane shear failure in the specimen.
The strength of in-plane shear is calculated as follows:
τ f = P 2 ( b a ) B
where b represents half of the specimen height.

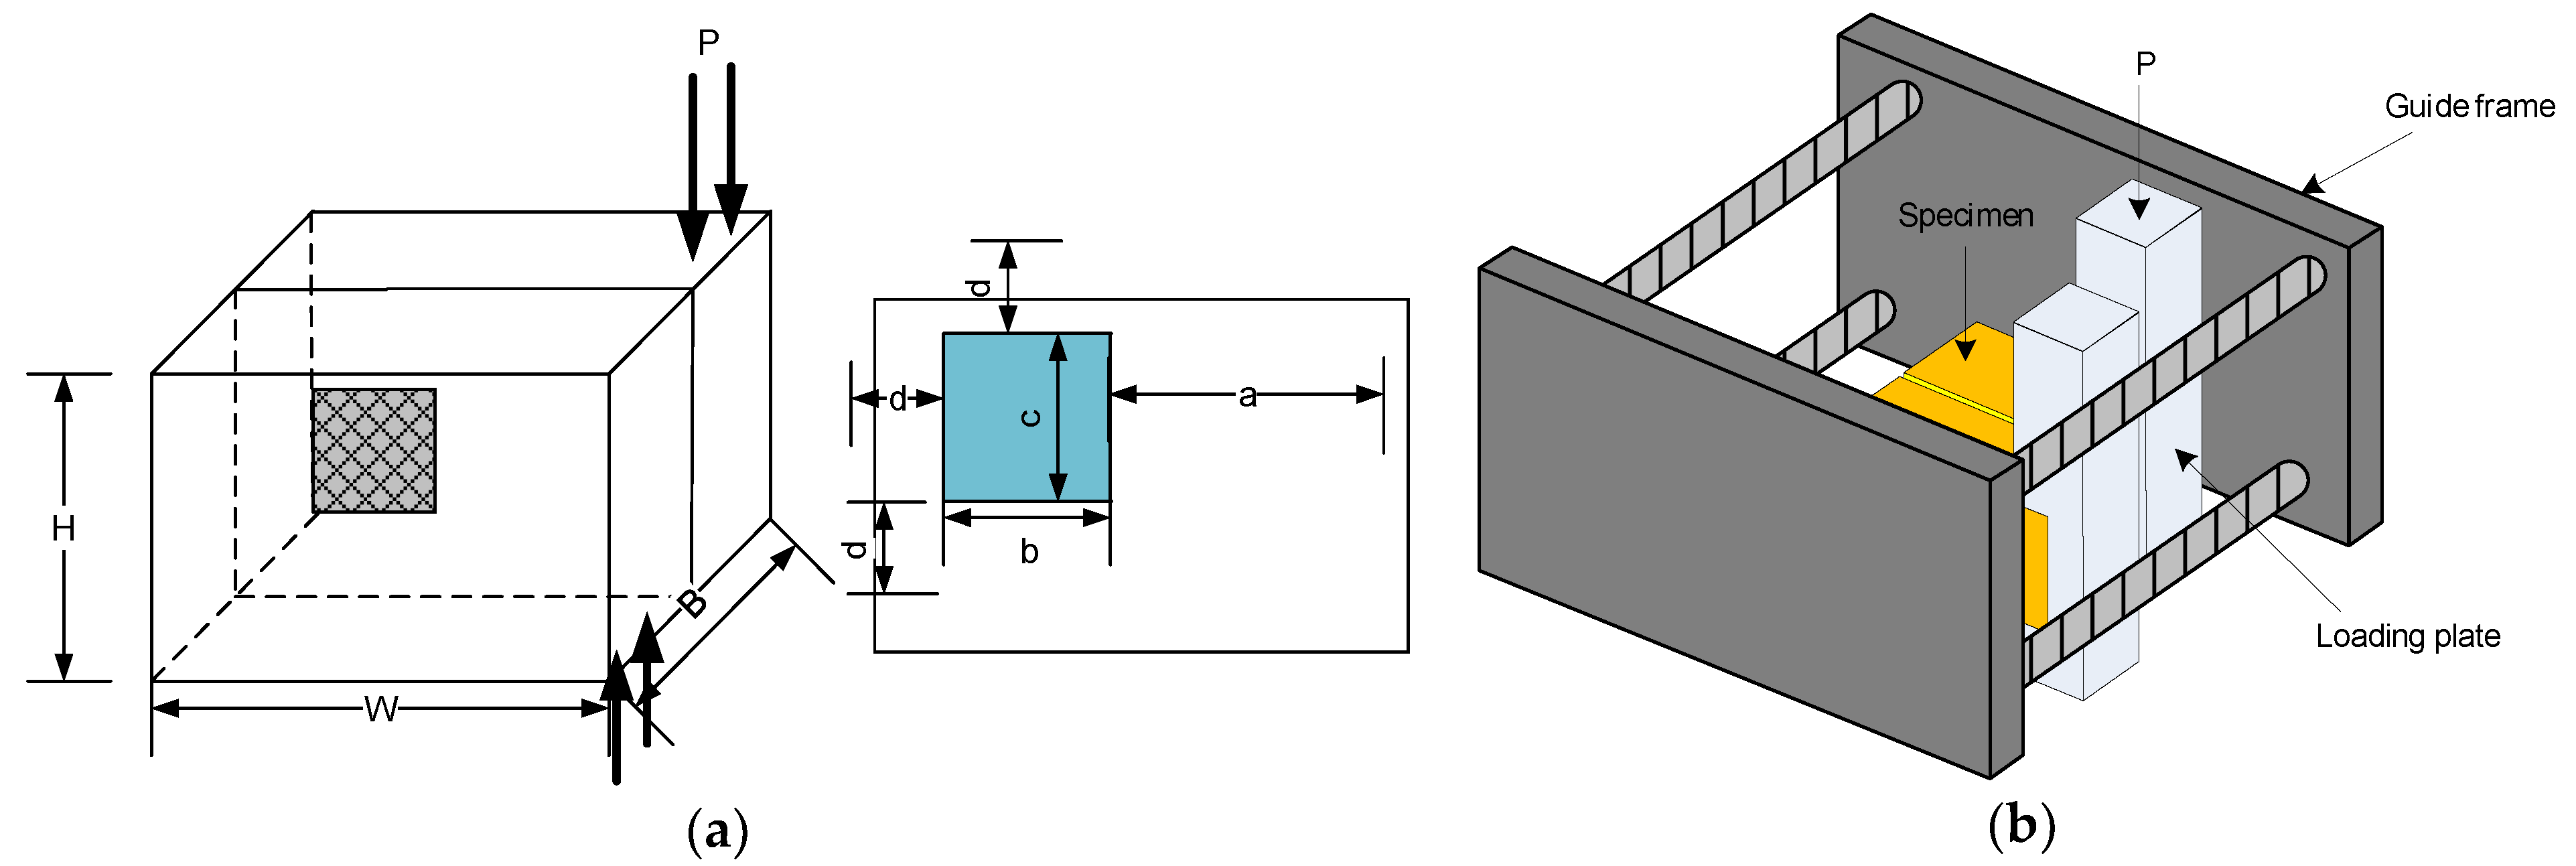
2.3.5. Torsion Test of Rectangular Section Specimens

Under out-of-plane shear loading or tearing loading, a shear stress parallel to the crack plane and parallel to the crack front was induced. The height H, width W, and thickness B of the rectangular section specimens used in the torsion test were 53.3, 81.3, and 78.7 mm, respectively. Side grooves were cut to allow out-of-plane shear failure in the fracture propagation. A 41.9 mm-deep notch and three 14 mm-deep side grooves were made using a diamond wheel saw. The notch and side grooves were 2 mm thick. Figure 6 shows the geometry and loading configuration for the torsion test of the rectangular section specimens. The loading plates were designed to hold the specimens. In order to hold the specimen, the left loading plate was fixed to the guide frame, and the specimen was loaded via the right loading plate.
The nominal out-of-plane shear strength in the torsion test of the rectangular section specimens is given by [25]
τ f = T α b c 2
where T represents the torque applied, α is the geometry factor, and b and c represent the length of the uncracked section.
The values of α for the ratio b/c is shown in Figure 7.

2.3.6. Circumferentially Notched Cylindrical Specimen Test

The challenge of out-of-plane shear testing for a traditional compression system is to produce torsional force. We have used specially prepared split collars to retain the specimen and generate compression torque. The specimen was a cylinder; its diameter D, length L, circumferential depth notch a were 50.8, 114.3, and 25.4 mm, respectively. A diamond wheel saw was used to cut circumferential notches with a thickness of 2 mm perpendicular to the axis of the cylinder in the centre of the specimen. Figure 8 shows the specimen geometry and test set-up. Split collars were attached to the specimen ends. Screws were fixed to the two sections of the collars. Additional screws in the collars were used to provide additional friction between the specimen and the collars. The specimens were placed on the opposite two pins, and an axial load was applied to both end of the split collars.
The out-of-plane shear strength of the circumferentially notched cylindrical specimen is given by [26]
τ f = 2 T π ( b a ) 3
where T represents the torque, and b represents the radius of the specimen.

3. Results

3.1. Tension Tests

The average values of the tensile strength in the Brazilian tension test for loading rates of 10−2, 10−1, 100, and 10 MPa/s were 6.4, 6.8, 7.0, and 7.7 MPa, respectively. The average values of the tensile strength in the three-point flexural test for loading rates of 10−2, 10−1, 100, and 10 MPa/s were 7.3, 8.2, 8.1, and 8.9 MPa, respectively. The tensile strength in the three-point flexural test was approximately 16.0% higher than that in the Brazilian tension test. Figure 9 presents a comparison of the tensile strength between the Brazilian tension and three-point flexural tests. The figure indicates that the variation in strength in the three-point flexural test was greater than that in the Brazilian tension test.
In Figure 10, the tensile strength is plotted in a log-log scale according to the loading rate. A linear-regression analysis based on the tensile strength and loading rate gave a stress corrosion index (n) of 38 with a standard deviation of 8 for the Brazilian tension test and a stress corrosion index (n) of 38 with a standard deviation of 14 for the three-point flexural test. For the Brazilian tension test, the variation in tensile strength was lower, and the standard deviation of the stress corrosion index was smaller.

3.2. In-Plane Shear Tests

The average values of the in-plane shear strength in the short-beam compression test for loading rates of 10−2, 10−1, 100, and 10 MPa/s were 20.9, 21.0, 23.5, and 24.9 MPa, respectively. The average values of the in-plane shear strength in the single-shear test for loading rates of 10−2, 10−1, 100, and 10 MPa/s were 18.6, 21.1, 22.0, and 22.7 MPa, respectively. The in-plane shear strength in the short-beam compression test was approximately 7.2% higher than that in the single-shear test. Figure 11 presents a comparison of the in-plane shear strength between the short-beam compression and single-shear tests. The figure indicates that the variation in strength was greater for the short-beam compression test than for the single-shear test.
Figure 12 shows the results of a linear-regression model with the in-plane shear strength and loading rate. The stress corrosion index was n = 36 (with a standard deviation of 9) for the short-beam compression test and n = 35 (with a standard deviation of 13) for the single-shear test. For the short-beam compression test, the variation in the shear strength was lower, and the standard deviation of the stress corrosion index was smaller.

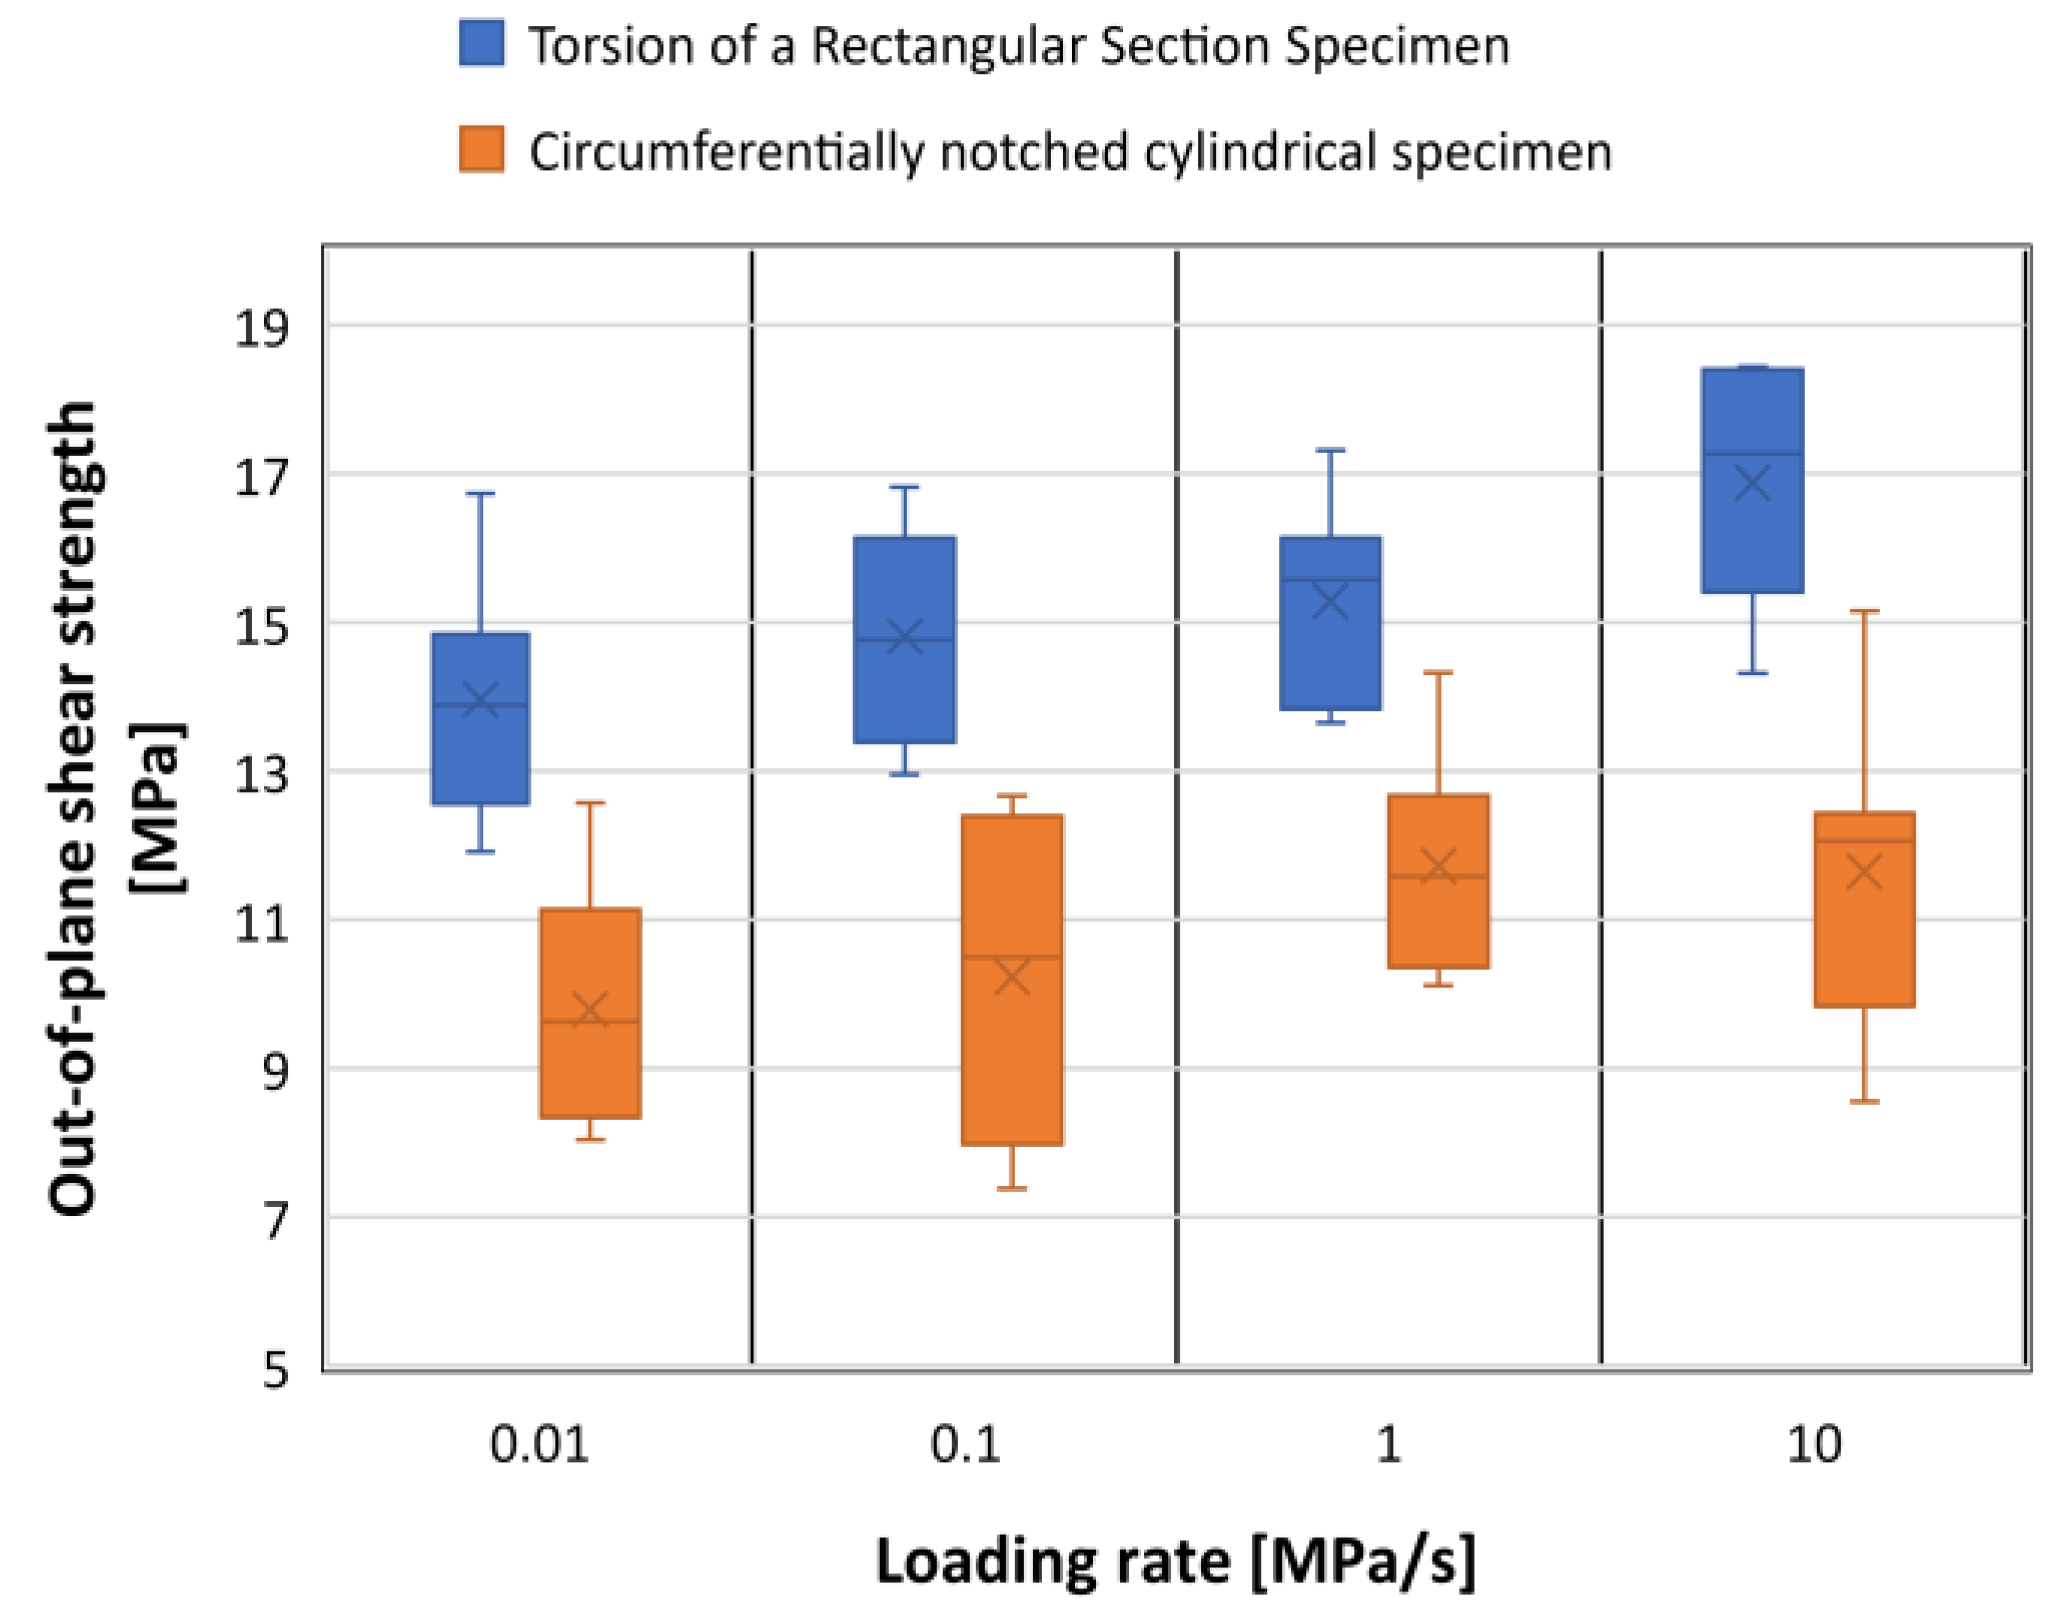
3.3. Out-of-Plane Shear Tests

The average values of the out-of-plane shear strength in the torsion test of rectangular section specimens for loading rates of 10−2, 10−1, 100, and 10 MPa/s were 13.9, 14.9, 15.5, and 17.1 MPa, respectively. The average values of the out-of-plane shear strength in the circumferentially notched cylindrical specimen test for loading rates of 10−2, 10−1, 100, and 10 MPa/s were 9.8, 10.2, 11.7, and 11.7 MPa, respectively. The out-of-plane shear strength in the torsion test of the rectangular section specimens was approximately 42% higher than that in the circumferentially notched cylindrical specimen test. Figure 13 presents a comparison of the out-of-plane shear strength between the torsion test of rectangular section specimens and the circumferentially notched cylindrical specimen test. The variation of the out-of-plane shear strength was greater for the circumferentially notched cylindrical specimen test than for the torsion test of rectangular section specimens.
Figure 14 presents the results of a linear-regression analysis using the out-of-plane shear strength and loading rate. The stress corrosion index was determined to be n = 37 (with a standard deviation of 9) for the torsion test of rectangular section specimens and n = 34 (with a standard deviation of 14) for the circumferentially notched cylindrical specimen test. For the torsion test of rectangular section specimens, the variability in the out-of-plane shear strength was lower, and the standard deviation of the stress corrosion index was smaller.

4. Discussion

The average values of strength with respect to the specimen geometry are presented in Figure 15. The strength was measured at a loading rate of 1 MPa/s. The average tensile strength, in-plane shear strength, and out-of-plane shear strength were 7.55, 22.75, and 13.6 MPa, respectively. The results indicate that the maximum strength was attained in the in-plane shear test.
The tensile strength was shown to be lower than the other strengths. Furthermore, the out-of-plane shear strength was approximately 60% lower than the in-plane shear strength, whereas the values of the in-plane shear strength and cohesion (22.7 MPa) were very close. Cohesion is defined as the shear strength of the Mohr–Coulomb failure criteria without a confining stress. Fracture formation in rock structures typically involves in-plane shear, out-of-plane shear, and a mixed mode loading system. Although it is possible for a rock mass to undergo simple sliding loads due to the complex geometry and random crack orientation within the rock structure, crack growth typically takes place in the presence of mixed-mode loading [27]. X-ray tomography can help to understand the crack formation under stress [28]. For instance, Figure 16 illustrates a penny-shaped crack placed under shear loads in an infinite medium [29]. In-plane shear loads are placed on the edge of the x-axis of the penny-shaped (point A), whereas the edge of the y-axis of the penny-shaped crack (point B) is subjected to out-of-plane shear loads.
Figure 17 presents the variation in stress corrosion index for the different tests performed in this study. According to the experimental results, the stress corrosion indices (n) were highly similar irrespective of the loading configuration and the specimen geometry. It was not affected by the loading configuration, including tension, in-plane shearing, or out-of-plane shearing.
The fact that subcritical crack growth, causing time-dependent behaviour of rocks, is environmentally induced rather than mechanically induced explains these results. The stress corrosion index (n) is affected by the chemical process with the strained silicate material and pore water at the crack tip in rocks. The chemical reaction rates are not significantly affected by the loading configuration. Additionally, under in-plane or out-of-plane shear loading, the prevailing cracking process at the crack tip is tensional; thus, the microstructural interactions at the crack tip are similar irrespective of the far-field loading configuration. Examples of the formation of shear cracks due to the interaction and coalescence of micro-tensile cracks are found in the relevant literature. Healy et al. reported that the elastic stress around tensile microcracks promoted a mutual interaction that produced shear fractures in brittle rock [30].
Table 2 presents the stress corrosion indices (n) for different rock types, obtained from previous works [31]. The stress corrosion indices are similar irrespective of the loading configuration, but they vary with respect to the rock type.
Combining the results of this study with those of existing literature reveals that the stress corrosion indices (n) for rocks are similar irrespective of the loading configuration, but they are different for different rock types. Therefore, the stress corrosion index can be considered a material constant for rocks.
Stress corrosion index can be used to evaluate the time-dependent behaviours of rocks, such as the degradation of rock strength and lifetime prediction in rock structures.
Degradation of rock strength on strain rate can be represented by the following form [9,32,33].
σ c ε ˙ 1 n + 1
where σc is rock strength, ε ˙ is strain rate below about 10−2 s−1, and n is stress corrosion index.
The rock strength is susceptible to stress corrosion index. For a given strain rate about 10−2 s−1, increasing stress corrosion index n = 30 to n = 60 increases the rock strength by approximately 7.6%. The rate of rock strength increase is more susceptible at a lower strain rate. For a strain rate of 10−4 s−1, increasing stress corrosion index n = 30 to n = 60 results in the increasing of the rock strength by approximately 15.7%.
Figure 18 shows an example of time-dependent slope stability model to predict time to failure [18]. The same material and slope parameters are maintained and only different stress corrosion indexes of n = 15 and n = 20 are applied. The time to failure of rock slope is susceptible to stress corrosion index. The time to failure of the rock slope at the stress corrosion index n = 20 is approximately 145 times longer than that at the stress corrosion index n = 15.

5. Conclusions

This study investigated the relationship between stress corrosion, which plays a significant role in the development of time-dependent cracking and the degradation of rock strength with loading rate subjected under various loading conditions and fracture modes. Constant stress-rate tests including the Brazilian tension and three-point flexural tests to examine tensile strength, short-beam compression and single-shear tests for in-plane shear strength, and a torsion test of rectangular section specimens and circumferentially notched cylindrical specimen test to measure the out-of-plane shear strength were performed under various loading rates ranging from 0.01 to 10 MPa/s using Coconino sandstone. The results indicate that rock strength is proportional to the 1/(n+1)th power of the loading rate, where the parameter n represents the influence of stress corrosion on subcritical crack growth. The average tensile strength, in-plane shear strength, and out-of-plane shear strength were 7.55, 22.75, and 13.6 MPa, respectively. The stress corrosion index (n) ranged from 34 to 38, with an average value of 36. The stress corrosion indices were similar irrespective of the loading configuration and specimen geometry. Additionally, a literature review indicated that the values of n are different for different rock types. Thus, the stress corrosion index (n) can be considered a material constant for rocks.

Author Contributions

Writing–Original Draft Preparation, T.Y.K.; Writing–Review and Editing, S.S.L. All authors have read and agreed to the published version of the manuscript.

Funding

The research fund of Hanyang University (HY-201700000002431) supported this study and the APC.

Acknowledgments

The research fund of Hanyang University (HY-201700000002431) supported this study, and the authors greatly appreciate the financial support.

Conflicts of Interest

The authors declare no conflict of interest. The funders had no role in the design of the study; in the collection, analyses, or interpretation of the data; in the writing of the manuscript; or in the decision to publish the results.

References

  1. Atkinson, B.K. Subcritical crack growth in geological materials. J. Geophys. Res. 1984, 89, 4077–4114. [Google Scholar] [CrossRef]
  2. Atkinson, B.K.; Meredith, P.C. The theory of subcritical crack growth with applications to minerals and rocks. In Fracture Mechanics of Rock, 1st ed.; Atkinson, B.K., Ed.; Academic Press: Cambridge, MA, USA, 1987. [Google Scholar]
  3. Scholz, C.H. Static fatigue of quartz. J. Geophys. Res. 1972, 77, 2104–2114. [Google Scholar] [CrossRef]
  4. Martin, R.J. Time-dependent crack growth in quartz and its application to the creep of rocks. J. Geophys. Res. 1972, 77, 1405–1419. [Google Scholar] [CrossRef] [Green Version]
  5. Swain, M.V.; Williams, J.S.; Lawn, B.R.; Beek, J.J.H. A comparative study of the fracture of various silica modifications using the Hertzian test. J. Mater. Sci. 1973, 8, 1153–1164. [Google Scholar] [CrossRef]
  6. Atkinson, B.K. A fracture mechanics study of subcritical tensile cracking of quartz in wet environments. Pure Appl. Geophys. 1979, 117, 1011–1024. [Google Scholar] [CrossRef]
  7. Atkinson, B.K. Subcritical crack propagation in rocks: Theory, experimental results and applications. J. Struct. Geol. 1982, 4, 41–56. [Google Scholar] [CrossRef]
  8. Costin, L.S. Time-dependent deformation and failure. In Fracture Mechanics of Rock, 1st ed.; Atkinson, B.K., Ed.; Academic Press: Cambridge, MA, USA, 1987. [Google Scholar]
  9. Sano, O.; Ito, I.; Terada, M. Influence of strain rate on dilatancy and strength of Oshima granite under uniaxial compression. J. Geophys. Res. 1981, 86, 9299–9311. [Google Scholar] [CrossRef]
  10. Ko, T.Y.; Kemeny, J. Subcritical crack growth in rocks under shear loading. J. Geophys. Res. 2011, 116, B01407. [Google Scholar] [CrossRef]
  11. Rinehart, J.S. Dynamic Fracture Strength of Rocks. In Proceedings of the 7th US Symposium on Rock Mechanics, Pennsylvania, PA, USA, 14–16 June 1965. [Google Scholar]
  12. Green, S.J.; Perkins, R.D. Uniaxial Compression Tests at Varying Strain Rates on Three Geologic Materials. In Proceedings of the 10th US Symposium on Rock Mechanics, Austin, TX, USA, 20–22 May 1968. [Google Scholar]
  13. Grady, D.E.; Kipp, M.E. Dynamic rock fragmentation. In Fracture Mechanics of Rock, 1st ed.; Atkinson, B.K., Ed.; Academic Press: Cambridge, MA, USA, 1987. [Google Scholar]
  14. Bazant, Z.P.; Bai, S.P.; Gettu, R. Fracture of rock: Effect of loading rate. Eng. Fract. Mech. 1993, 45, 393–398. [Google Scholar] [CrossRef]
  15. Zhang, Z.X.; Kou, S.Q.; Jiang, L.G.; Lindqvist, P.A. Effects of loading rates on rock fracture: Fracture characteristics and energy partitioning. Int. J. Rock Mech. Min. Sci. 2000, 37, 745–762. [Google Scholar] [CrossRef]
  16. Fukui, K.; Okubo, S.; Ogawa, A. Some aspects of loading rate dependency of Sanjome andesite strengths. Int. J. Rock Mech. Min. Sci. 2006, 41, 1215–1219. [Google Scholar] [CrossRef]
  17. Zhang, Q.B.; Zhao, J. Quasi-static and dynamic fracture behaviour of rock materials: Phenomena and mechanisms. Int. J. Fract. 2014, 189, 1–32. [Google Scholar] [CrossRef] [Green Version]
  18. Kemeny, J. The time-dependent reduction of sliding cohesion due to rock bridges along discontinuities: A fracture mechanics approach. Rock Mech. Rock Engng. 2003, 36, 27–38. [Google Scholar] [CrossRef]
  19. Swanson, P.L. Subcritical crack propagation in Westerly granite: An investigation into the double torsion method. Int. J. Rock Mech. Min. Sci. Geomech. Abstr. 1981, 18, 445–449. [Google Scholar] [CrossRef]
  20. Nara, Y.; Kaneko, K. Study of subcritical crack growth in andesite using the double torsion test. Int. J. Rock Mech. Min. Sci. 2005, 42, 521–530. [Google Scholar] [CrossRef]
  21. Nara, Y.; Morimoto, K.; Yoneda, T.; Hiroyoshi, N.; Kaneko, K. Effects of humidity and temperature on subcritical crack growth in sandstone. Int. J. Solids Struct. 2011, 48, 1130–1140. [Google Scholar] [CrossRef] [Green Version]
  22. Ko, T.Y.; Kemeny, J. Determination of the subcritical crack growth parameters in rocks using the constant stress-rate test. Int. J. Rock Mech. Min. Sci. 2013, 59, 166–178. [Google Scholar] [CrossRef]
  23. Yuan, H.; Wang, F.; Liu, Y.; Bian, H.; Chen, W.; Wang, Y. Time-dependent behavior of subcritical crack growth for rock plate: Experimental and numerical study. Int. J. Distrib. Sens. Netw. 2018, 14, 1–10. [Google Scholar] [CrossRef]
  24. Errandonea, D.; Ferrer-Roca, C.; Martínez-Garcia, D.; Segura, A.; Gomis, O.; Muñoz, A.; Rodríguez-Hernández, P.; López-Solano, J.; Alconchel, S.; Sapiña, F. High-pressure x-ray diffraction and ab initio study of Ni2Mo3N, Pd2Mo3N, Pt2Mo3N, Co3Mo3N, and Fe3Mo3N: Two families of ultra-incompressible bimetallic interstitial nitrides. Phys. Rev. B. 2010, 82, 174105. [Google Scholar] [CrossRef] [Green Version]
  25. Ugural, A.C.; Fenster, S.K. Torsion of prismatic bars. In Advanced Strength and Applied Elasticity, 4th ed.; Ugural, A.C., Fenster, S.K., Eds.; Prentice Hall: Upper Saddle Rive, NJ, USA, 2003. [Google Scholar]
  26. Tada, H.; Paris, P.C.; Irwin, G.R. The Stress Analysis of Cracks Handbook, 3rd ed.; ASME Press: New York, NY, USA, 2000. [Google Scholar]
  27. Gudmundsson, A. Rock Fractures in Geological Processes, 1st ed.; Cambridge University Press: Cambridge, UK, 2011. [Google Scholar]
  28. Hanaor, D.A.H.; Hu, L.; Kan, W.H.; Proust, G.; Foley, M.; Karaman, I.; Radovic, M. Compressive performance and crack propagation in Al alloy/Ti2AlC composites. Mater. Sci. Eng. A 2016, 672, 247–256. [Google Scholar] [CrossRef] [Green Version]
  29. Kundu, T. Fundamentals of Fracture Mechanics, 1st ed.; CRC Press: Boca Raton, FL, USA, 2008. [Google Scholar]
  30. Healy, D.; Jones, R.R.; Holdsworth, R.E. Three-dimensional brittle shear fracturing by tensile crack interaction. Nature 2006, 439, 64–67. [Google Scholar] [CrossRef] [PubMed]
  31. Hashiba, K.; Okubo, S.; Fukui, K. A new testing method for investigating the loading rate dependency of peak and residual rock strength. Int. J. Rock Mech. Min. Sci. 2006, 43, 894–904. [Google Scholar] [CrossRef]
  32. Lankford, J. The role of tensile microfracture in the strain rate dependence of compressive strength of fine-grained limestone-analogy with strong ceramics. Int. J. Rock Mech. Min. Sci. Geomech. Abstr. 1981, 18, 173–175. [Google Scholar] [CrossRef]
  33. Brantut, N.; Heap, M.J.; Meredith, P.G.; Baud, P. Time-dependent cracking and brittle creep in crustal rocks: A review. J. Struct. Geol. 2013, 52, 17–43. [Google Scholar] [CrossRef]
Figure 1. Diagram of crack velocity/normalised stress intensity factor for subcritical crack growth in rocks; Ko represents the stress corrosion limit.
Applsci 10 02175 g001
Figure 2. Brazilian tension test: (a) specimen geometry; (b) test configuration.
Applsci 10 02175 g002
Figure 3. Three-point flexural test: (a) specimen geometry; (b) test set-up.
Applsci 10 02175 g003
Figure 4. Short-beam compression test: (a) specimen geometry; (b) test set-up.
Applsci 10 02175 g004
Figure 5. Single-shear test: (a) specimen geometry; (b) test set-up.
Applsci 10 02175 g005
Figure 6. Torsion test of rectangular section specimens: (a) specimen geometry; (b) test set-up.
Applsci 10 02175 g006
Figure 7. α as regards to b/c.
Applsci 10 02175 g007
Figure 8. Circumferentially notched cylindrical specimen test: (a) specimen geometry; (b) split collars; (c) test set-up.
Applsci 10 02175 g008
Figure 9. Comparison of the tensile strength between the Brazilian tension and three-point flexural tests.
Applsci 10 02175 g009
Figure 10. Tensile strength versus loading rate: (a) Brazilian tension test; (b) three-point flexural test.
Applsci 10 02175 g010
Figure 11. Comparison of the in-plane shear strength between the short-beam compression and single-shear tests.
Applsci 10 02175 g011
Figure 12. In-plane shear strength versus loading rate: (a) short-beam compression test; (b) single-shear test.
Applsci 10 02175 g012
Figure 13. Comparison of the out-of-plane shear strength between the torsion test of rectangular section specimens and the circumferentially notched cylindrical specimen test.
Applsci 10 02175 g013
Figure 14. Out-of-plane shear strength versus loading rate: (a) torsion test of rectangular section specimens; (b) circumferentially notched cylindrical specimen test.
Applsci 10 02175 g014
Figure 15. Variation in strength for the different tests.
Applsci 10 02175 g015
Figure 16. Penny-shaped crack in an infinite medium under shear stresses.
Applsci 10 02175 g016
Figure 17. Variation in stress corrosion index.
Applsci 10 02175 g017
Figure 18. Example of time-dependent slope stability model: (a) slope model geometry; (b) factor of safety as a function of time.
Applsci 10 02175 g018
Table 1. Material properties of Coconino sandstone.
Propertyσc [MPa]σt [MPa]E [GPa]νK [GPa]Φ [°]C
Value118.06.424.30.3628.950.622.7
Table 2. Stress corrosion indices for different rock types.
Rock TypeTestn
Tage tuffUniaxial compression42
Uniaxial tension46
Indirect tension45
Sanjome andesiteUniaxial compression35–38
Uniaxial tension36–39
Indirect tension39–41
Akiyoshi marbleUniaxial compression64

