Article

Improving and Optimizing Sound Absorption Performance of Polyurethane Foam by Prepositive Microperforated Polymethyl Methacrylate Panel

1
Engineering Training Center, Nanjing Institute of Industry Technology, No. 1 north Yangshan road, Nanjing 210023, China
2
Department of Mechanical Engineering, College of Field Engineering, Army Engineering University, No. 1 Haifu Street, Nanjing 210007, China
3
State Key Laboratory in Ultra-precision Machining Technology, Department of Industrial and Systems Engineering, The Hong Kong Polytechnic University, Kowloon, Hong Kong 999077, China
*
Author to whom correspondence should be addressed.
Appl. Sci. 2020, 10(6), 2103; https://doi.org/10.3390/app10062103
Submission received: 15 February 2020 / Revised: 14 March 2020 / Accepted: 17 March 2020 / Published: 20 March 2020
(This article belongs to the Special Issue Characterization and Application of Nanoporous Materials)

Abstract

:
Sound absorption performance of polyurethane foam could be improved by adding a prepositive microperforated polymethyl methacrylate panel to form a composite sound-absorbing structure. A theoretical sound absorption model of polyurethane foam and that of the composite structure were constructed by the transfer matrix method based on the Johnson–Champoux–Allard model and Maa’s theory. Acoustic parameter identification of the polyurethane foam and structural parameter optimization of the composite structures were obtained by the cuckoo search algorithm. The identified porosity and static flow resistivity were 0.958 and 13078 Pa·s/m2 respectively, and their accuracies were proved by the experimental validation. Sound absorption characteristics of the composite structures were verified by finite element simulation in virtual acoustic laboratory and validated through standing wave tube measurement in AWA6128A detector. Consistencies among the theoretical data, simulation data, and experimental data of sound absorption coefficients of the composite structures proved the effectiveness of the theoretical sound absorption model, cuckoo search algorithm, and finite element simulation method. Comparisons of actual average sound absorption coefficients of the optimal composite structure with those of the original polyurethane foam proved the practicability of this identification and optimization method, which was propitious to promote its practical application in noise reduction.

Graphical Abstract

1. Introduction

Polyurethane foam is considered a promising and prospective sound-absorbing material for its high porosity, low density, fine transparency, mature fabrication technology, low manufacturing cost, excellent machinability, and so on [1,2], which meets some special requirements in the fields of sound absorption and noise reduction [3,4]. Gwon et al. [1] studied sound absorption behavior of the flexible polyurethane foam with distinct cellular structure, the research result of which indicated that the strong gelling catalyst could generate a high number of small cells for a better sound absorption property. A new tung oil-based polyurethane composite foam (TOPUF) was prepared by Ji et al. [2] through a one-step method, and the average sound absorption coefficient of 0.518 and transmission loss of 19.05 dB in the frequency range of 100–6300 Hz were gained with the filler content of 0.3 wt%. Wang et al. [3] proposed and fabricated multifunctional fabric-reinforced composites (MFRCs), which could obtain the average sound absorption coefficient of 0.7 in the 1000–4000 Hz range. The nitrile butadiene rubber-polyurethane foam composites (NBRPFCs) with stratified structure were designed and optimized by Jiang et al. [4], and the sandwich structure with thickness ratio 1:8:1 could achieve the optimal average sound absorption coefficient of 0.56 in the 500–1600 Hz range. These sound absorbers with fine sound absorption performance [1,2,3,4] prove that the polyurethane foam has huge potential in the noise reduction, which makes it a new research hotspot in acoustics and material science.
In order to promote practical application of the polyurethane foam in the sound absorption and noise reduction, it is essential to identify its acoustic characteristic parameters, especially the porosity and static flow resistivity, because they are the most important factors to determine the sound absorption performance [5,6,7,8,9]. Zhang et al. [5] studied sound absorption performance of the polyurethane foam with porosity in the range from of 16.0% to 88.6%, which achieved the optimal sound absorption coefficient of 0.66 in the low frequency range of 250–600 Hz. Magnesium hydroxide filler was used by Sung et al. [6] to fabricate the polyurethane composite foam for improving its acoustic property, the results of which proved that the sound absorption coefficient was improved by 70% at the optimal open porosity of 0.63 compared with the non-filler case. Acoustic characteristic parameters of the polyurethane/rice husk (PU-RH) composite were investigated by Wang et al. [7], which consisted of the porosity, static flow resistance, tortuosity, and characteristic constants, the research results of which proved that sound absorption coefficients of PU-RH composite increased at low frequency along with a small decrease at high frequency with the addition of RH. The gradient-compressed porous material was proposed by Yang et al. [8] to develop acoustic absorber with high–efficiency and thin thickness, the results of which indicated that sound absorption properties could be adjusted through changing permutations of the compressed layers with different porosity and static flow resistivity. Su et al. [9] investigated influences of the acoustic characteristic parameters to sound absorption properties of the multilayer composite made of glass, wool, glue, and polyurethane foam, which indicated that influences of the outer material were more obvious than that of the inner material. These achievements on influences of the acoustic characteristic parameters to sound absorption performance of the polyurethane foam proved that identification and optimization were critical procedures to develop a novel sound absorber from the polyurethane foam for practical application in the noise reduction.
For the purpose of further improving sound absorption performance of the polyurethane foam, the composite sound-absorbing structure was proposed, which included the polyurethane foam and other sound-absorbing materials [10,11,12,13,14]. Barium titanate/nitrile butadiene rubber and polyurethane foam were combined to form a sound absorbing material with alternating multilayered structures by Jiang et al. [10], which gained excellent low-frequency sound absorption performances due to the organic combination of the airflow resistivity, resonance absorption, and interface dissipation. Tiuc et al. [11] developed new composite materials based on sawdust as reinforcing material and polyurethane foam as a binder agent, and their sound absorption coefficients were over 0.5 in the large frequency range. The rigid polyurethane foam and panel were combined to form the rigid foam composites by Peng et al. [12], and excellent sound absorption was obtained when the aluminum hydroxide was 20 wt%. Statharas et al. [13] fabricated the polyurethane/poly(vinylidene fluoride)/multi-walled carbon nanotube (PU/PVDF/MWCNT) composite foam, which could benefit the sound absorption property by introducing the interfacial damping and local piezoelectric damping effects. Acoustic properties of the polyurethane foam with the addition of bamboo leaves particles were investigated by Chen and Ji [14], the results of which obtained the best sound insulation with high transmission loss around 18.9 dB over the entire frequency range of 100–6300 Hz. Although these composite structures developed from the original polyurethane foam achieved better sound absorption performance [10,11,12,13,14], their fabrication processes were complex, which indicated that the fabrication costs were increased. Moreover, these composite structures were different materials for the original polyurethane foam, which meant that improvement of the sound absorption performance required replacement of the polyurethane foam in use, such as meeting room, cinema, theatre, and so on. The replacement not only increased the cost, but also took more time. Therefore, the prepositive microperforated polymethyl methacrylate panel was used to form the composite structure with polyurethane foam in this research, which indicated that improvement of the sound absorption performance was realized by adding an appropriate thin panel instead of replacement of the material. By this way, cost and time of the alteration could be reduced, which was favorable to promote practical application of the proposed composite structure.
Therefore, improving and optimizing sound absorption performance of the polyurethane foam by prepositive microperforated polymethyl methacrylate panel was conducted in this study. The sound absorption mechanism of the polyurethane foam and that of the composite sound absorbing structure were investigated according to their structures, and their theoretical sound absorption models were constructed based on the Johnson–Champoux–Allard model [15,16,17] and Maa’s theory [18,19,20] by the transfer matrix method [21,22,23]. Afterwards, identification of acoustic characteristic parameters of the polyurethane foam and optimization of structural parameter of the composite structure were realized through the cuckoo search algorithm [24,25,26,27]. Later, the composite structure was verified by the finite element simulation method [28,29,30,31] and validated through the standing wave tube measurement [32,33,34,35]. Finally, the accuracy of identified acoustic characteristic parameters of the polyurethane foam and effectiveness of improved sound absorption performance of the composite structure were proved. Through the theoretical sound absorption modeling, cuckoo search identification and optimization, finite element simulation, and standing wave tube measurement, sound absorption performances of the investigated polyurethane foams were improved by the prepositive microperforated polymethyl methacrylate panel and further optimized, which aimed to promote their practical application.

2. Materials and Methods

2.1. Materials and Models

2.1.1. Polyurethane Foam and Its Theoretical Sound Absorption Model

There were porous structures in the polyurethane foam, as shown in Figure 1, which could realize sound absorption by the sticky effect and heat conduction [15,16,17]. When the incident sound wave diffused in the porous structure, there existed velocity gradations among different particles, which resulted in the relative motion between the vibrant air and skeleton structures. Sticky effect of the air could generate the friction force and viscous resistance, which blocked motion of the particles. The friction and viscous effects could transform the partial sound energy to the heat energy, and the heat energy was consumed in the conduction process. By this method, the sound energy was partially reduced and the sound absorption effect was realized.
According to the Johnson–Champoux–Allard model [15,16,17], calculation of sound absorption coefficient α p f of the polyurethane foam was obtained by the Equation (1). For the convenience of following the calculation of the sound absorption coefficients for the composite structures, the transfer matrix method was utilized in this research [21,22,23], and that for the polyurethane foam T p f was calculated by Equation (2). In the Equation (1), Re( ) and Im( ) represented the real part and imaginary part of one complex number respectively; ρ 0 was the density of the air with the room temperature and atmospheric pressure, 1.21 kg/m3; c 0 was the acoustic velocity in the air with the room temperature and atmospheric pressure, 340 m/s; T p f 11 and T p f 21 were the two components of transfer matrix T p f for the polyurethane foam. In Equation (2), k p f was the number of the wave in the polyurethane foam, which was calculated by Equation (3); d p f was its thickness, which could be measured by the vernier caliper; Z p f is its characteristic impedance, which could be derived by the Equation (4); j was the symbol of the imaginary number, j = 1 [15,16,17].
α p f = 4 Re ( T p f 11 T p f 21 1 ρ 0 c 0 ) [ 1 + Re ( T p f 11 T p f 21 1 ρ 0 c 0 ) ] 2 + [ Im ( T p f 11 T p f 21 1 ρ 0 c 0 ) ] 2
T p f = [ T p f 11 T p f 12 T p f 21 T p f 22 ] = [ cos ( k p f d p f ) j Z p f sin ( k p f d p f ) j Z p f 1 sin ( k p f d p f ) cos ( k p f d p f ) ]
k p f = ω ρ ( ω ) K ( ω )
Z p f = ρ ( ω ) K ( ω )
In Equations (3) and (4), ω was the angular frequency of the sound wave, which was gained by Equation (5), and f was sound frequency and π was the circular constant; ρ ( ω ) and K ( ω ) were complex effective density and complex effective bulk modulus of the polyurethane foam, which were obtained by Equations (6) and (7) respectively [15,16,17]. In Equations (6) and (7), ρ 0 was still density of the air with the room temperature and the atmospheric pressure, 1.21 kg/m3; σ and ϕ were static flow resistivity and porosity of the polyurethane foam respectively; γ was the specific heat ratio of the air with the room temperature and the atmospheric pressure, 1.40; P 0 was the static pressure of the air with the room temperature and atmospheric pressure, 1.013×10⁵ Pa; N u was the Nusselt number, 4.36; P r was the Prandtl number, 0.71; j was the still symbol of the imaginary number, j = 1 [15,16,17]. For a certain polyurethane foam sample with a thickness of d p f , its sound absorption coefficients in the frequency range [ f min , f max ] could be calculated by changing the value of the frequency f in the given range. From Equations (1)–(7), it could be found that except for static flow resistivity σ and porosity ϕ , the other parameters were constants or selected values in the given range. Thus, it was feasible to identify these two acoustic characteristic parameters through measuring the actual sound absorption coefficient α a of the polyurethane foam with the corresponding thickness d p f and corresponding frequency f .
ω = 2 π f
K ( ω ) = γ P 0 [ γ ( γ 1 ) ( 1 N u ( j 8 ω ρ 0 P r σ ϕ + N u ) 1 ) ] 1
ρ ( ω ) = ρ 0 [ 1 + ( 3 2 + 4 ω ρ 0 σ ϕ ) 0.5 j σ ϕ ω ρ 0 ( 1 + ω ρ 0 4 σ ϕ ) 0.5 ]
Relative to the porous metal, the polyurethane foam had the advantages of higher porosity and larger static flow resistivity, which was favorable to obtain a better sound absorption performance. However, it is generally known that the porous material was not good at absorbing the noise in the low-frequency range, no matter the porous metal or the polyurethane foam. Therefore, the composite sound absorbing structure was essential to improve sound absorption performance of polyurethane foam in the low-frequency range.

2.1.2. Composite Sound Absorbing Structure and Its Theoretical Sound Absorption Model

It was well known that the microperforated panel could achieve an outstanding low-frequency sound performance [18,19,20]. Thus, in order to improve low-frequency sound absorption properties of the polyurethane foam, a prepositive microperforated polymethyl methacrylate panel was fixed in front, which formed the composite sound-absorbing structure, and its sound absorption coefficient could be calculated through the transfer matrix method [21,22,23].
The transfer matrix T m p m a of the prepositive microperforated polymethyl methacrylate panel was derived according to Maa’s theory [18,19,20], as shown in the Equation (8). Here, Z s was acoustic impedance, as shown in Equation (9), and its real part and imaginary part were symbolled as R and X respectively; j is the still symbol of the imaginary number, j = 1 . Moreover, R and X could be calculated by Equations (10) and (11) respectively [18,19,20].
T m p m a = [ 1 Z s 0 1 ]
Z s = R + j X
R = 32 μ ρ 0 ε t d 2 k r
X = t ω ρ 0 ε k m
In Equations (10) and (11), μ was the viscosity coefficient of the air with normal atmospheric temperature, 1.506·10−5 m2/s; ρ 0 was still density of the air, 1.21 Kg/m3; ε was the perforating rate, which could be calculated by the Equation (12); k r was the acoustic resistance constant, which was obtained by Equation (13); ω was angular frequency of the sound wave; k m was the acoustic mass constant, which was achieved by Equation (14) [18,19,20]. Moreover, in the Equations (13) and (14), k was the perforated panel constant, which was derived by Equation (15). Furthermore, in the Equations (10)–(15), these symbols t , d , and b represented thickness of the microperforated polymethyl methacrylate panel, diameter of the microholes, and distance between the neighboring holes, respectively [18,19,20]. From Equations (8)–(15), it could be found that the transfer matrix of the microperforated polymethyl methacrylate panel was determined by its structural parameters of t , d , and b for a given frequency range [ f min , f max ] .
ε = π 4 ( d b ) 2
k r = 1 + k 2 32 + 2 8 k d t
k m = 1 + 1 ( 9 + k 2 2 ) + 0.85 d t
k = ω μ d 2
According to the derived transfer matrix T p f of the polyurethane foam in Equation (2) and the calculated transfer matrix T m p m a of the microperforated polymethyl methacrylate panel in Equation (8), total transfer matrix T c s of the composite structure was obtained based on the transfer matrix method [21,22,23], as shown in Equation (16). Moreover, similar to the calculation of sound absorption coefficient α p f of the polyurethane foam through Equation (1), theoretical sound absorption coefficient α c s of the composite structure could be calculated by Equation (17).
T c s = [ T c s 11 T c s 12 T c s 21 T c s 22 ] = T m p m a T p f
α c s = 4 Re ( T c s 11 T c s 21 1 ρ 0 c 0 ) [ 1 + Re ( T c s 11 T c s 21 1 ρ 0 c 0 ) ] 2 + [ Im ( T c s 11 T c s 21 1 ρ 0 c 0 ) ] 2

2.2. Cuckoo Search Algorithm

2.2.1. Identification of Acoustic Characteristic Parameters of the Polyurethane Foam

Based on the theoretical sound absorption model of the polyurethane foam in Section 2.1.1 and the experimental data obtained in the following measurement, identification of acoustic characteristic parameters of the polyurethane foam was achieved by the cuckoo search algorithm [24,25,26,27], and the calculation flow chart is shown in Figure 2. In this study, experimental data of sound absorption coefficients of the polyurethane foam with thicknesses of 20 mm, 30 mm, 40 mm, and 50 mm were measured and utilized in this identification process, and the detected frequency points were in the range of 100–6000 Hz with the interval of 100 Hz, which indicated that there were 240 groups of data (4 × 60 = 240). It could be easy to confirm that reasonable range of the porosity ϕ was (0,1) according to its definition, as shown in Equation (18). Meanwhile, it was reported by the present literatures [1,2,3,4,8,9,10,11,12,13,14] that normal possible boundary of the static flow resistivity σ was [10000, 50000], so the investigated range in this research was set to [1000, 200000], as shown in Equation (19). Moreover, the optimization target was to achieve minimized differences between the sound absorption coefficient of the experimental data α a ( f , d p f ) and that of the theoretical data α t ( f , d p f ) , as shown in Equation (20). According to the constructed theoretical sound absorption model in Equations (1)–(7), the defined constraint conditions in Equations (18) and (19), and the selected optimization target in Equation (20), the definition of the objective function was obtained to initialize the cuckoo search, as shown in Figure 2. Maximum discovery probability and maximum iteration number were set to give judgment for the end of the identification process. Through randomly generating the initial solutions (as shown in Equation (21)) and continuously updating the new generation solutions according to levy flight (as shown in Equation (22), here β is step size, and β = O ( 1 ) is used; L ( λ ) is the step length, which follows Levy distribution), the superior solution was achieved in the iterative process, and the identification of acoustic characteristic parameters of the polyurethane foam was obtained.
0 < ϕ < 1
10 3 P a s m 2 σ 2 10 5 P a s m 2
min ( α a ( f , d p f ) α t ( f , d p f ) ) f = 100 : 100 : 6000 , d p f = 20 : 10 : 50
X = ( X 1 , X 2 , , X i , , X n ) , X i = ( x 1 , x 2 , , x j , , x m )
X i ( t + 1 ) = X i ( t ) + β L ( λ )

2.2.2. Optimization of Structural Parameters of the Composite Sound Absorbing Structure

Similar with the cuckoo search identification algorithm in Section 2.2.1, it was necessary to determine the optimization objects, the parameters pending optimization, the constraint conditions, and the optimization target in the cuckoo search optimization algorithm. Taking into account normal practical application of the sound absorber, the selected optimization objects in this study were the polyurethane foam with the thickness of 10 mm, 20 mm, 30 mm, and 40 mm respectively. Meanwhile, the investigated frequency ranges for each polyurethane foam were 100–1000 Hz and 100–2000 Hz, which aimed to improve low-frequency sound absorption performance of the polyurethane foam. Moreover, taking the compressive and tensile properties into consideration, the thickness of the selected microperforated polymethyl methacrylate panel was set as a constant of 0.3 mm, which indicated that the parameters pending optimization were the diameter of the microholes d and distance between the neighboring microholes b (in the equidistant linear array). Furthermore, constraint conditions for the parameters pending optimization were summarized and shown in Equations (23) and (24), which were set according to the normal requirement of the microperforated panel [18,19,20]. Finally, the optimization target for each optimization object was to obtain the maximum average sound absorption coefficient of the composite structure in the given frequency ranges, as shown in Equation (25). Through introducing the constructed theoretical sound absorption model in Equations (1)–(17), the confirmed constraint conditions in Equations (23) and (24), and the optimization target in Equation (25) into the calculation flow chart of the cuckoo search algorithm in Figure 2, theoretical optimal structural parameters of the composite sound-absorbing structures were achieved to improve the sound absorption performance of the polyurethane foam in this research.
10 5 m d 10 3 m
10 5 m b 2 × 10 2 m
max ( a v e r a g e ( α c s ( f ) ) ) f [ f min , f max ]

2.3. Finite Element Simulation

According to these optimal structural parameters of the composite sound-absorbing structures obtained in Section 2.2.2, finite element simulation of the sound absorption property of the composite structure was conducted in the virtual acoustic laboratory [28,29,30,31], and the constructed simulation model is shown in Figure 3. The size of the standing wave tube was 60 mm × 60 mm × 300 mm, and its front surface was treated as the acoustic source inlet for transmission of the incident sound wave. The composite structure was installed at the back surface of the standing wave tube. Meanwhile, there were two microphones fixed on the standing wave tube. Through giving the investigated frequency range and detecting the sound pressures at the two microphones, the sound absorption coefficient of the composite sound-absorbing structure for a certain frequency range was obtained.
Finite element simulation of the microperforated polymethyl methacrylate panel was realized through confirming the acoustic transfer relation admittance from its optimal structural parameters and selecting the appropriate tolerance data in the built finite element simulation model, which was loaded between the back surface of the standing wave tube and the front surface of the polyurethane foam, as shown in Figure 3. Moreover, Finite element simulation of the investigated polyurethane foam was conducted through determining its acoustic characteristic parameters in the finite element model, which consisted of the fluid parameters (such as the sound velocity, mass density, specific heat ratio, Prandtl number, dynamic viscosity, and so on), the geometric parameters (such as the static flow resistivity, porosity, tortuosity, characteristic viscous length and thermal length, and so on), and the elastic parameters (such as the Young’s modulus, mass density, and so on). Furthermore, the plane wave with a certain frequency was loaded at the acoustic source inlet and treated as the incident sound wave, and the sound-transmitting medium in the standing wave tube in Figure 3 was air. When the incident sounds wave reached the composite sound-absorbing structure, some of them were absorbed and the others were reflected. Through detecting the sound pressures of the incident sound wave and those of the reflected sound wave at the two microphones in Figure 3, the sound absorption coefficient could be calculated based on the standing wave tube method [22]. By this method, sound absorption characteristics of the composite sound absorbing structures were simulated in this study.

2.4. Standing Wave Tube Measurement

2.4.1. Actual Sound Absorption Coefficients of the Polyurethane Foam

The investigated polyurethane foam samples in this study were purchased from the GreenCARE International (Guangzhou) Ltd., Guangzhou, Guangdong, China. Sound absorption coefficients α a of the polyurethane foam were achieved by the AWA6128A detector (Hangzhou Aihua instruments Co., Ltd., Hangzhou, Zhejiang, China) based on the standing wave tube measurement [32,33,34,35], which acted in accordance with the ISO 10534-1: 1996 Acoustics—Determination of sound absorption coefficient and impedance in impedance tubes—Part 1: Method using standing wave ratio and the ISO 10534-2: 1998 Acoustics—Determination of sound absorption coefficient and impedance in impedance tubes—Part 2: Transfer-function method [36,37]. In order to improve the accuracy of the identification and examine the effectiveness of the identified acoustic characteristic parameters, the polyurethane foam samples with thicknesses of 10 mm, 20 mm, 30 mm, 40 mm, 50 mm, and 60 mm were measured, and the selected frequency range was [100 Hz, 6000 Hz] with an interval of 100 Hz. Experimental data of sound absorption coefficients of the samples with thicknesses of 20 mm, 30 mm, 40 mm, and 50 mm were utilized to identify the acoustic characteristic parameters, and those with thicknesses of 10 mm and 60 mm were used to examine the effectiveness of the identification. Schematic diagram of standing wave tube measurement of the sound absorption coefficient by the AWA6128A detector is shown in Figure 4. The polyurethane foam sample was installed in the sample fixer and supported by the sample holder. The incident sound wave was generated by the loudspeaker and introduced into the standing wave tube, and its frequency was controlled by the workstation. The reflected sound wave was received by the acoustic probe, and the detected sound signal was transferred to the workstation by the pickup. Through moving the pulley along the slideway on the foundation support, the peak sound level S max and valley sound level S min of the reflected sound wave could be achieved. According to the ISO 10534-1: 1996 Acoustics—Determination of sound absorption coefficient and impedance in impedance tubes—Part 1: Method using standing wave ratio and the ISO 10534-2: 1998 Acoustics—Determination of sound absorption coefficient and impedance in impedance tubes—Part 2: Transfer-function method [36,37], the relationship between the sound absorption coefficient α a and the incident sound frequency f was shown in Equation (26).
α a ( f ) = 4 × 10 S max - S min 20 ( 1 + 10 S max - S min 20 ) 2

2.4.2. Actual Sound Absorption Coefficients of the Composite Sound Absorbing Structure

According to the achieved optimal structural parameters of the composite structure, the required microperforated polymethyl methacrylate panels were fabricated through the laser beam drilling [38,39], and the prepared composite structures are exhibited in Figure 5. In order to distinguish different components in the composite structure, the utilized polymethyl methacrylate was black, which was an obvious contrast with white of the polyurethane foam, as shown in Figure 5. In fact, the color of the polymethyl methacrylate had no effect on its sound absorption performance. Moreover, the used polymethyl methacrylate was purchased from the Xinyue Chemical Industrial Co., Nanjing, Jiangsu, China and of industrial grade. Judging from theoretical sound absorption mechanism of the microperforated panel absorber [18,19,20], it could be found that its sound absorption performance was determined by its geometric parameters and had little to do with its physical or chemical parameters.
Owing to the investigated frequency ranges of 100–1000 Hz and 100–2000 Hz, the diameter of the prepared composite structures was 96 mm, which satisfied the requirement of the utilized AWA6128A detector for standing wave tube measurement of the sound absorption coefficients [33,35]. Through replacing the detected polyurethane foam by the prepared composite structure in Figure 4, actual sound absorption coefficients of the composite sound-absorbing structures were tested, which could provide experimental validation of the identification and optimization results. Moreover, in order to decrease the accidental measuring error in the testing program, each composite structure was tested 10 times, and the final experimental data was the average value of the 10 tests [40].

3. Results and Discussion

3.1. Acoustic Characteristic Parameters of the Polyurethane Foam

Judging from the Johnson–Champoux–Allard model in the Equations (1)–(7), it could be found that it was impossible to identify the accurate porosity ϕ and the accurate static flow resistivity σ simultaneously, because they always appeared in the form of product σ ϕ in Equations (6) and (7). It indicated that so long as the product of porosity and static flow resistivity was equal, the calculated sound absorption coefficient would be same, although the corresponding porosity and static flow resistivity might be different. Therefore, the obtained identification result would be the product of porosity and static flow resistivity, the evolutions of which and those of the residual error along with the increase of the function evaluation time from 1 to 1000 are shown in Figure 6. It could be observed that when the function evaluation time reached 115, the identified product of porosity and static flow resistivity was steady around 12500, and the final accurate identified value was 12503 with a final residual error of 0.021.
Nominal porosity of the utilized polyurethane foam sample was 0.97, which was provided by the supplier of the GreenCARE International (Guangzhou) Ltd., Guangzhou, Guangdong, China, and the static flow resistivity was not supplied. The actual porosity was tested and calculated according to the drainage method in this research [41], and the obtained data was 0.956, which was very close to the nominal porosity of 0.97. Meanwhile, according to the identified product 12503 of porosity and static flow resistivity in Figure 6, it could be derived that the corresponding static flow resistivity was 13078 Pa·s/m2. At present, measurement of static flow resistivity of the polyurethane foam sample according to the ISO 9053: 1991 Acoustics—Materials for acoustical applications—Determination of airflow resistance was not conducted in this study, because the measuring process was complex and difficult to realize [42,43]. Although check of the static flow resistivity was difficult to realize through the direct testing [42,43], the accuracy of the identification could be examined indirectly through comparing sound absorption coefficients of the theoretical data with those of the experimental data, as shown in Figure 7. It could be observed that for each thickness of the polyurethane foam, its theoretical sound absorption coefficients were exactly consistent with the corresponding actual data. Meanwhile, comparisons of the theoretical and actual sound absorption coefficients of the studied polyurethane foams with the thicknesses of 10 mm and 60 mm were conducted respectively, which are shown in Figure 8. Identification of the acoustic characteristic parameters was achieved through using the experimental data of sound absorption coefficients of the polyurethane foam samples with thicknesses of 20 mm, 30 mm, 40 mm, and 50 mm, hence it was unsurprising that the calculated theoretical data and those experimental data were consistent in Figure 7. The further verification in Figure 8 certified effectiveness and accuracy of the identified acoustic characteristic parameters for the polyurethane foam with various thicknesses. However, for the polyurethane foams with thicknesses from 10 mm to 60 mm, the corresponding actual average sound absorption coefficients in the frequency range 100–1000 Hz were 0.0866, 0.1885, 0.2689, 0.4077, 0.5239, and 0.6362 respectively, which indicated that the achievement of the excellent low-frequency sound absorption performance required the polyurethane foam with large thickness. Therefore, it limited practical application of the polyurethane foam in the low-frequency noise reduction.
Through identification of the parameters by the cuckoo search algorithm and measurement of the porosity through the drainage method [41], the gained porosity and static flow were 0.956 and 13078 Pa·s/m2 respectively. It would achieve an excellent sound absorption performance for the porous material with high porosity and moderate static flow resistivity, and that is why this polyurethane foam sample was selected for the noise reduction. Through forming the composite sound-absorbing structures, better sound absorption property could be obtained, which could promote its application.

3.2. Sound Absorption Performance of the Composite Sound Absorbing Structure

3.2.1. Optimal Structural Parameters

Optimal structural parameters of the composite sound-absorbing structures were obtained and summarized in Table 1, and comparisons of the theoretical sound absorption coefficients without and those with the optimization are shown in Table 2. It could be found that the sound absorption performance of the polyurethane foam was obviously improved by the prepositive microperforated polymethyl methacrylate panel, especially for the conditions of small thickness of the sample and low frequency of the sound. Meanwhile, when the frequency range was 100–2000 Hz, the absolute value and relative percentage of improvement of the theoretical average sound absorption coefficient fell from 0.3690 and 247.76% to 0.1050 and 15.44% respectively with thickness of the polyurethane foam increased from 10 mm to 40 mm. The major reason for this phenomenon was that sound absorption performance of the polyurethane foam in the entire frequency range was raised when its thickness rose, which was consistent with normal absorption property of the porous material [15,16,17,31,33,35].

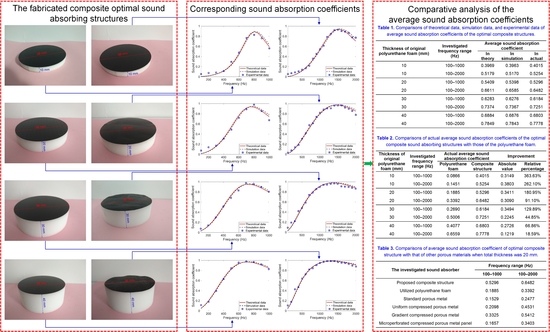
3.2.2. Comparative Analysis of Theoretical Data, Simulation Data, and Experimental Data

Comparisons of theoretical data, simulation data, and experimental data of the sound absorption coefficients of the composite sound-absorbing structure are shown in Figure 9 and Figure 10 respectively. It could be observed that consistencies among the theoretical data, simulation data, and experimental data were good, and effectiveness of the utilized cuckoo search identification/optimization algorithm, the constructed theoretical sound absorption model, and the used finite element simulation method were validated. Meanwhile, comparisons of theoretical data, simulation data, and experimental data of average sound absorption coefficients of the optimal composite sound-absorbing structures are summarized in Table 3. When the original thicknesses of the polyurethane foam were 10 mm, 20 mm, 30 mm, and 40 mm, actual average sound absorption coefficients of the composite sound-absorbing structure for the investigated frequency range of 100–1000 Hz were 0.4015, 0.5296, 0.6184, and 0.6803 respectively, and those for the investigated frequency range of 100–2000 Hz were 0.5254, 0.6482, 0.7251, and 0.7778 respectively, which exhibited excellent sound absorption efficiency with a smaller total thickness of the sound absorber.
It could be observed that when thickness of the composite structure was 10 mm, its actual sound absorption coefficients in the 100–500 Hz range were slightly larger than those obtained in theory and those achieved in simulation, as shown in Figure 9a and Figure 10a. Similar phenomenon also existed for the composite structures with other thicknesses, which demonstrated that the theoretical and simulation data tended to slightly underestimate the experimental data in the low-frequency range. The different testing mechanism was the major reason. The theoretical data was derived by the transfer matrix method, and the simulation data was achieved by the transfer function method. The experimental data was obtained by the standing wave tube method, which was realized by measuring the peak and valley values of the incident and reflected waves [32,33,34,35]. There existed a superposition between the incident and reflected waves, and this superposition in the low-frequency range was more effective than that in the high-frequency range, which resulted in the different deviations for different frequency ranges.
It could be found from Table 3 that there existed some deviations among the average sound absorption coefficients in theory with those in simulation and those in actual, and these deviations increased along with the increase of thickness of the original polyurethane foam and the increase of the investigated frequency ranges generally, which were consistent with the contrast of sound absorption coefficients of the composite structures in Figure 9 and Figure 10. This phenomena was generated by the different utilized calculation methods in theory, in simulation, and in experiment [38].

3.2.3. Contrast with the Original Polyurethane Foam

Actual average sound absorption coefficients of the composite sound-absorbing structures were compared with those of the polyurethane foams, and they are summarized in Table 4. It could be observed that principles of absolute value and relative percentage of improvement of the actual average sound absorption coefficients were consistent with those of theoretical data in Table 2. Moreover, it could be found that for the investigated frequency range of 100–1000 Hz, the actual average sound absorption coefficient of the composite structure consisted of the polyurethane foam with the initial thickness of 10 mm was 0.4015, and it was close to that 0.4077 of the original polyurethane foam with the thickness of 40 mm, which indicated that the optimal composite sound absorbing structure could achieve the same sound absorption performance by only utilizing 1/4 of the original material and occupancy space. Accordingly, for the investigated frequency range of 100–2000 Hz, the actual average sound absorption coefficient of the composite structure consisted of the polyurethane foam with the initial thickness of 30 mm, which was 0.7257, and there was a gap between it and that 0.7778 of the original polyurethane foam with the thickness of 40 mm, which agreed with the normal principle that further improvement of the sound absorption performance in a large frequency range was more difficult than that in a small frequency range. Furthermore, absolute value and relative percentage of improvements of the actual average sound absorption coefficient were 0.3149 and 363.63% respectively when the investigated frequency range was 100–1000 Hz and the initial thickness of the polyurethane foam was 10 mm, while those were only 0.1219 and 18.59% respectively when the investigated frequency range was 100–2000 Hz and the initial thickness of the polyurethane foam was 40 mm, which could further prove that the improvement of the sound absorption property was more effective when the total thickness of the sound absorber and the investigated frequency range were small.

3.2.4. Comparisons with the Other Porous Materials

Similar with the polyurethane foam, porous metal was another common porous material used in the field of sound absorption [8,17,22,27,29,33,35]. Besides common standard porous metal, some novel sound absorbers had been proposed, such as uniform compressed porous metal [35], gradient compressed porous metal [8,22,27], microperforated compressed porous metal panel [29], and so on. The horizontal comparisons of the actual average sound absorption coefficient of the optimal composite sound absorbing structure with that of other porous materials were conducted when total thickness was 20 mm, as shown in Table 5. It could be observed that the utilized polyurethane foam could achieve a better sound absorption performance relative to the porous metal, no matter for 100–1000 Hz or for 100–2000 Hz. The major reason for this appearance was that porosity of the polyurethane foam could be up to 0.95 or even higher easily, and porosity of the porous metal was very difficult to exceed 0.95. The higher porosity was favorable for viscous effect and heat conduction in the sound absorption process. Moreover, it could be found that the proposed optimal composite structure could obtain the best actual average sound absorption coefficients, no matter for 100–1000 Hz or for 100–2000 Hz, which proved the practicability of this identification and optimization method.

4. Conclusions

Improving and optimizing the sound absorption performance of polyurethane foam by a prepositive microperforated polymethyl methacrylate panel was conducted in this research. Through theoretical sound absorption modeling, identification of the acoustic characteristic parameters, optimization of the composite structures, finite element simulation, and standing wave tube measurement, research achievements of this study were concluded and summarized as follows.
(1)
Prepositive microperforated polymethyl methacrylate panel was utilized to form a composite sound-absorbing structure together with the polyurethane foam, which aimed to improve the sound absorption performances within the low-frequency range. Theoretical sound absorption model of the investigated polyurethane foam and that of the proposed composite sound-absorbing structure were constructed through the transfer matrix method, which supplied a theoretical basis for identification of the acoustic characteristic parameters and optimization of the composite structure.
(2)
Acoustic characteristic parameters of the polyurethane foam were identified by the cuckoo search algorithm based on its experimental data of sound absorption coefficients, and the obtained porosity and static flow resistivity were 0.958 and 13078 Pa·s/m2 respectively. Comparisons of the sound absorption coefficients of the polyurethane foam with various thicknesses in theory and those in actual proved effectiveness and accuracy of the identification method. The achieved acoustic characteristic parameters provided a steady foundation for the improvement and optimization of the sound absorption performance of the polyurethane foam.
(3)
For the polyurethane foam with different thicknesses and the various investigated frequency ranges, structural parameter optimization of each composite sound-absorbing structure was realized through the cuckoo search algorithm, which aimed to achieve the maximum average sound absorption coefficient. Sound absorption performance of the polyurethane foam was significantly improved by a prepositive microperforated polymethyl methacrylate panel, especially for the conditions of small thickness of the sample and low frequency of the sound. The gained optimal structural parameters offered guidance for the following finite element simulation and sample preparation.
(4)
Sound absorption characteristics of the composite sound-absorbing structures were verified by finite element simulation in the virtual acoustic laboratory and validated through standing wave tube measurement in the AWA6128A detector. Consistencies among sound absorption coefficients of the composite structures in theory, those in simulation, and those in actual were very good, which proved the effectiveness and accuracy of the used cuckoo search identification/optimization algorithm, the founded theoretical sound absorption model, and the utilized finite element simulation method.
(5)
Relative to actual average sound absorption coefficients of the polyurethane foam, those of the optimal composite sound-absorbing structure were obviously larger, and the relative percentage of the improvement reached 363.63% when the initial thickness of the polyurethane foam was 10 mm and the investigated frequency range was 100–1000 Hz. Moreover, for the investigated frequency range of 100–1000 Hz, the actual average sound absorption coefficient of the composite structure which consisted of the polyurethane foam with the initial thickness of 10 mm, was 0.4015, and it was close to that 0.4077 of the original polyurethane foam with the thickness of 40 mm, which indicated that the optimal composite structure was favorable to save the utilized material and the occupied space.
(6)
When the limited total thickness was 20 mm, comparisons of the actual average sound absorption coefficient of the optimal composite sound-absorbing structure with that of other porous medias were conducted, such as standard porous metal, uniform compressed porous metal, gradient compressed porous metal, and microperforated compressed porous metal panel. The proposed composite sound-absorbing structure could obtain the best actual average sound absorption coefficient, which proved the practicability of this identification and optimization method.
An effective and practical way to improve and optimize sound absorption performances of the polyurethane foam by prepositive microperforated polymethyl methacrylate panel was proposed in this study, which was propitious to promote practical applications of the formed composite sound-absorbing structures in the fields of sound absorption and noise reduction.
Meanwhile, this study could also provide reference to identify acoustic characteristic parameters and improve sound absorption performances of the other materials, such as the mineral wool, natural fibers, and so on. Furthermore, by taking other environmental terms (such as the life cycle assessment, carbon footprint, and so on) instead of the sound absorption performance as the research target and optimization objective, this identification and optimization method could also be effective.

Author Contributions

Conceptualization, X.Y. and X.S.; Software, M.P.; Validation, H.D.; Formal analysis, X.Y. and X.S.; Investigation, F.Y. and Q.Y.; Data curation, H.D. and X.Z.; Writing—original draft preparation, X.Y. and H.D.; Writing—review and editing, X.S. and F.Y.; Supervision, X.S.; Funding acquisition, X.S. All authors have read and agreed to the published version of the manuscript.

Funding

This research was funded by National Natural Science Foundation of China, grant number 51505498; Natural Science Foundation of Jiangsu Province, grant number BK20150714; National Key R & D Program of China, grant number 2016YFC0802900; Hong Kong Scholars Program, grant number XJ2017025.

Acknowledgments

The authors wish to express their sincere thanks to Hangzhou Aihong instruments Co., Ltd. for support of the AWA6128A detector and GreenCARE International (Guangzhou) Ltd. for support of the polyurethane foam samples.

Conflicts of Interest

The authors declare no conflict of interest.

References

  1. Gwon, J.G.; Kim, S.K.; Kim, J.H. Sound absorption behavior of flexible polyurethane foams with distinct cellular structures. Mater. Des. 2016, 89, 448–454. [Google Scholar] [CrossRef]
  2. Ji, Y.J.; Chen, S.M.; Cheng, Y.B. Synthesis and Acoustic Study of a New Tung Oil-Based Polyurethane Composite Foam with the Addition of Miscanthus Lutarioriparius. Polymers 2019, 11, 1144. [Google Scholar] [CrossRef] [Green Version]
  3. Wang, H.Y.; Li, T.T.; Wu, L.W.; Lou, C.W.; Lin, J.H. Multifunctional, Polyurethane-Based Foam Composites Reinforced by a Fabric Structure: Preparation, Mechanical, Acoustic, and EMI Shielding Properties. Materials 2018, 11, 2085. [Google Scholar] [CrossRef] [Green Version]
  4. Jiang, X.L.; Wang, Z.J.; Yang, Z.; Zhang, F.Q.; You, F.; Yao, C. Structural Design and Sound Absorption Properties of Nitrile Butadiene Rubber-Polyurethane Foam Composites with Stratified Structure. Polymers 2018, 10, 946. [Google Scholar] [CrossRef] [Green Version]
  5. Zhang, C.H.; Li, J.Q.; Hu, Z.; Zhu, F.L.; Huang, Y.D. Correlation between the acoustic and porous cell morphology of polyurethane foam: Effect of interconnected porosity. Mater. Des. 2012, 41, 319–325. [Google Scholar] [CrossRef]
  6. Sung, G.; Kim, J.W.; Kim, J.H. Fabrication of polyurethane composite foams with magnesium hydroxide filler for improved sound absorption. J. Ind. Eng. Chem. 2016, 44, 99–104. [Google Scholar] [CrossRef]
  7. Wang, Y.H.; Wu, H.Q.; Zhang, C.C.; Ren, L.Q.; Yu, H.D.; Galland, M.A.; Ichchou, M. Acoustic characteristics parameters of polyurethane/rice husk composites. Polym. Compos. 2019, 40, 2653–2661. [Google Scholar] [CrossRef]
  8. Yang, X.C.; Shen, X.M.; Bai, P.F.; He, X.H.; Zhang, X.N.; Li, Z.Z.; Chen, L.; Yin, Q. Preparation and Characterization of Gradient Compressed Porous Metal for High-Efficiency and Thin-Thickness Acoustic Absorber. Materials 2019, 12, 1413. [Google Scholar] [CrossRef] [Green Version]
  9. Su, J.T.; Zheng, L.; Deng, Z.X. Study on acoustic properties at normal incidence of three-multilayer composite made of glass wool, glue and polyurethane foam. Appl. Acoust. 2019, 156, 319–326. [Google Scholar] [CrossRef]
  10. Jiang, X.L.; Yang, Z.; Wang, Z.; Zhang, F.; You, F.; Yao, C. Preparation and Sound Absorption Properties of a Barium Titanate/Nitrile Butadiene Rubber–Polyurethane Foam Composite with Multilayered Structure. Materials 2018, 11, 474. [Google Scholar] [CrossRef] [Green Version]
  11. Tiuc, A.E.; Nemes, O.; Vermesan, H.; Toma, A.C. New sound absorbent composite materials based on sawdust and polyurethane foam. Compos. B Eng. 2019, 165, 120–130. [Google Scholar] [CrossRef]
  12. Peng, H.K.; Wang, X.X.; Li, T.T.; Lou, C.W.; Wang, Y.T.; Lin, J.H. Mechanical properties, thermal stability, sound absorption, and flame retardancy of rigid PU foam composites containing a fire-retarding agent: Effect of magnesium hydroxide and aluminum hydroxide. Polym. Adv. Technol. 2019, 30, 2045–2055. [Google Scholar] [CrossRef]
  13. Statharas, E.C.; Yao, K.; Rahimabady, M.; Mohamed, A.M.; Tay, F.E.H. Polyurethane/poly (vinylidene fluoride)/MWCNT composite foam for broadband airborne sound absorption. J. Appl. Polym. Sci. 2019, 136, 47868. [Google Scholar] [CrossRef]
  14. Chen, S.M.; Ji, Y.J. The acoustic property study of polyurethane foam with addition of bamboo leaves particles. Polym. Compos. 2018, 39, 1370–1381. [Google Scholar] [CrossRef]
  15. Johnson, D.L.; Koplik, J.; Dashen, R. Theory of dynamic permeability and tortuosity in fluid-saturated porous media. J. Fluid Mech. 1987, 176, 379–402. [Google Scholar] [CrossRef]
  16. Champoux, Y.; Allard, J.-F. Dynamic tortuosity and bulk modulus in air-saturated porous media. J. Appl. Phys. 1991, 70, 1975–1979. [Google Scholar] [CrossRef]
  17. Yang, X.C.; Peng, K.; Shen, X.M.; Zhang, X.N.; Bai, P.F.; Xu, P.J. Geometrical and dimensional optimization of sound absorbing porous copper with cavity. Mater. Des. 2017, 131, 297–306. [Google Scholar] [CrossRef]
  18. Maa, D.Y. Potential of microperforated panel absorber. J. Acoust. Soc. Am. 1998, 104, 2861–2866. [Google Scholar] [CrossRef]
  19. Maa, D.Y. Design of microperforated panel constructions. Acta Acust. 1988, 13, 174–180. [Google Scholar]
  20. Yang, X.C.; Chen, L.; Shen, X.M.; Bai, P.F.; To, S.; Zhang, X.N.; Li, Z.Z. Optimization of geometric parameters of the standardized multilayer microperforated panel with finite dimension. Noise Control. Eng. J. 2019, 67, 197–209. [Google Scholar] [CrossRef]
  21. Verdière, K.; Panneton, R.; Elkoun, S.; Dupont, T.; Leclaire, P. Transfer matrix method applied to the parallel assembly of sound absorbing materials. J. Acoust. Soc. Am. 2013, 134, 4648–4658. [Google Scholar] [CrossRef] [PubMed]
  22. Shen, X.M.; Bai, P.F.; Chen, L.; To, S.; Yang, F.; Zhang, X.N.; Yin, Q. Development of thin sound absorber by parameter optimization of multilayer compressed porous metal with rear cavity. Appl. Acoust. 2020, 159, 107071. [Google Scholar] [CrossRef]
  23. Zhao, X.D.; Hu, P.; Sun, P. The comparative analyses of the calculation methods for absorptivity of multilayer micro-perforated panel absorbers. J. Appl. Acoust. 2012, 31, 196–201. [Google Scholar]
  24. Yang, X.S.; Deb, S. Engineering Optimisation by Cuckoo Search. Int. J. Math. Model. Numer. Optim. 2010, 1, 330–343. [Google Scholar] [CrossRef]
  25. Yang, X.S.; Deb, S. Cuckoo search: Recent advances and applications. Neural Comput. Appl. 2014, 24, 169–174. [Google Scholar] [CrossRef] [Green Version]
  26. Yang, X.C.; Bai, P.F.; Shen, X.M.; To, S.; Chen, L.; Zhang, X.N.; Yin, Q. Optimal design and experimental validation of sound absorbing multilayer microperforated panel with constraint conditions. Appl. Acoust. 2019, 146, 334–344. [Google Scholar] [CrossRef]
  27. Yang, F.; Shen, X.M.; Bai, P.F.; Zhang, X.N.; Li, Z.Z.; Yin, Q. Optimization and Validation of Sound Absorption Performance of 10-Layer Gradient Compressed Porous Metal. Metals 2019, 9, 588. [Google Scholar] [CrossRef] [Green Version]
  28. Li, S.Q.; Li, X.; Wang, Z.H.; Wu, G.Y.; Lu, G.X.; Zhao, L.M. Finite element analysis of sandwich panels with stepwise graded aluminum honeycomb cores under blast loading. Compos. Part A Appl. Sci. 2016, 80, 1–12. [Google Scholar] [CrossRef]
  29. Bai, P.F.; Yang, X.C.; Shen, X.M.; Zhang, X.N.; Li, Z.Z.; Yin, Q.; Jiang, G.L.; Yang, F. Sound absorption performance of the acoustic absorber fabricated by compression and microperforation of the porous metal. Mater. Des. 2019, 167, 107637. [Google Scholar] [CrossRef]
  30. Yan, Y.J.; Li, P.B.; Lin, H.G. Analysis and experimental validation of the middle-frequency vibro-acoustic coupling property for aircraft structural model based on the wave coupling hybrid FE-SEA method. J. Sound Vib. 2016, 371, 227–236. [Google Scholar] [CrossRef]
  31. Shen, X.M.; Bai, P.F.; Yang, X.C.; Zhang, X.N.; To, S. Low-frequency sound absorption by optimal combination structure of porous metal and microperforated panel. Appl. Sci. 2019, 9, 1507. [Google Scholar] [CrossRef] [Green Version]
  32. Bujoreanu, C.; Nedeff, F.; Benchea, M.; Agop, M. Experimental and theoretical considerations on sound absorption performance of waste materials including the effect of backing plates. Appl. Acoust. 2017, 119, 88–93. [Google Scholar] [CrossRef]
  33. Yang, X.C.; Bai, P.F.; Shen, X.M.; Zhang, X.N.; Zhu, J.W.; Yin, Q.; Peng, K. Theoretical modeling and experimental validation of sound absorbing coefficient of porous iron. J. Porous Media 2019, 22, 225–241. [Google Scholar] [CrossRef]
  34. Emanov, A.F.; Krasnikov, A.A. Use of the standing wave method to study seismically insulated buildings. Seism. Instrum. 2016, 52, 323–349. [Google Scholar] [CrossRef]
  35. Bai, P.F.; Shen, X.M.; Zhang, X.N.; Yang, X.C.; Yin, Q.; Liu, A.X. Influences of compression ratio on sound absorption performance of porous nickel-iron alloy. Metals 2018, 8, 539. [Google Scholar] [CrossRef] [Green Version]
  36. Iannace, G.; Ciaburro, G.; Trematerra, A. Modeling sound absorption properties of broom fibers using artificial neural networks. Appl. Acoust. 2020, 163, 107239. [Google Scholar] [CrossRef]
  37. Berardi, U.; Iannace, G. Predicting the sound absorption of natural materials: Best-fit inverse laws for the acoustic impedance and the propagation constant. Appl. Acoust. 2016, 115, 131–138. [Google Scholar] [CrossRef]
  38. Yang, X.C.; Shen, X.M.; Duan, H.Q.; Zhang, X.N.; Yin, Q. Identification of Acoustic Characteristic Parameters and Improvement of Sound Absorption Performance for Porous Metal. Metals 2020, 10, 340. [Google Scholar] [CrossRef] [Green Version]
  39. Qian, Y.J.; Kong, D.Y.; Fei, J.T. A note on the fabrication methods of flexible ultra microperforated panels. Appl. Acoust. 2015, 90, 138–142. [Google Scholar] [CrossRef]
  40. Duan, H.Q.; Shen, X.M.; Yang, F.; Bai, P.F.; Lou, X.F.; Li, Z.Z. Parameter Optimization for Composite Structures of Microperforated Panel and Porous Metal for Optimal Sound Absorption Performance. Appl. Sci. 2019, 9, 4798. [Google Scholar] [CrossRef] [Green Version]
  41. Anovitz, L.M.; Cole, D.R. Characterization and analysis of porosity and pore structures. Rev. Mineral. Geochem. 2015, 80, 61–164. [Google Scholar] [CrossRef] [Green Version]
  42. Iannace, G.; Ianniello, C.; Maffei, L.; Romano, R. Steady-state air-flow and acoustic measurement of the resistivity of loose granular materials. J. Acoust. Soc. Am. 1999, 106, 1416. [Google Scholar] [CrossRef]
  43. Passaro, J.; Russo, P.; Bifulco, A.; De Martino, M.T.; Granata, V.; Vitolo, B.; Iannace, G.; Vecchione, A.; Marulo, F.; Branda, F. Water Resistant Self-Extinguishing Low Frequency Soundproofing Polyvinylpyrrolidone Based Electrospun Blankets. Polymers 2019, 11, 1205. [Google Scholar] [CrossRef] [PubMed] [Green Version]
Figure 1. Surface morphologies of the polyurethane foam observed by scanning electron microscope. (a) With the low magnification; (b) With the high magnification.
Applsci 10 02103 g001
Figure 2. Calculation flow chart of cuckoo search identification algorithm for the polyurethane foam.
Applsci 10 02103 g002
Figure 3. Finite element simulation model for sound absorption property of the composite structure.
Applsci 10 02103 g003
Figure 4. Schematic diagram of the standing wave tube measurement by the AWA6128A detector.
Applsci 10 02103 g004
Figure 5. The prepared composite sound absorbing structures. (a) For the polyurethane foam with thickness of 10 mm in the 100–1000 Hz range; (b) For the polyurethane foam with thickness of 10 mm in the 100–2000 Hz range; (c) For the polyurethane foam with thickness of 20 mm in the 100–1000 Hz range; (d) For the polyurethane foam with thickness of 20 mm in the 100–2000 Hz range; (e) For the polyurethane foam with thickness of 30 mm in the 100–1000 Hz range; (f) For the polyurethane foam with thickness of 30 mm in the 100–2000 Hz range; (g) For the polyurethane foam with thickness of 40 mm in the 100–1000 Hz range; (h) For the polyurethane foam with thickness of 40 mm in the 100–2000 Hz range.
Applsci 10 02103 g005
Figure 6. Evolutions of the identified product of porosity and static flow resistivity and those of the residual error along with the increase of the function evaluation times.
Applsci 10 02103 g006
Figure 7. Comparisons of theoretical and actual sound absorption coefficients of polyurethane foam. (a) With the thickness of 20 mm; (b) With the thickness of 30 mm; (c) With the thickness of 40 mm; (d) With the thickness of 50 mm.
Applsci 10 02103 g007
Figure 8. Further verification of theoretical and actual sound absorption coefficients of polyurethane foam. (a) With the thickness of 10 mm; (b) With the thickness of 60 mm.
Applsci 10 02103 g008
Figure 9. Contrasts of sound absorption coefficients of composite structure for 100–1000 Hz. (a) For polyurethane foam with thickness of 10 mm; (b) For polyurethane foam with thickness of 20 mm; (c) For polyurethane foam with thickness of 30 mm; (d) For polyurethane foam with thickness of 40 mm.
Applsci 10 02103 g009
Figure 10. Contrasts of sound absorption coefficients of composite structure for 100–2000 Hz. (a) For polyurethane foam with thickness of 10 mm; (b) For polyurethane foam with thickness of 20 mm; (c) For polyurethane foam with thickness of 30 mm; (d) For polyurethane foam with thickness of 40 mm.
Applsci 10 02103 g010
Table 1. Theoretical optimal structural parameters of the composite sound-absorbing structures.
Investigated Frequency Range (Hz)Polyurethane FoamMicroperforated Polymethyl Methacrylate PanelOptimal Average Sound Absorption Coefficient
dpf
(mm)
σ
(Pa·s/m2)
ϕ t (   mm ) d (   mm ) b
(mm)
100–100010130780.9560.30.7912.790.3969
100–200010130780.9560.30.384.110.5179
100–100020130780.9560.30.486.510.5409
100–200020130780.9560.30.252.020.6611
100–100030130780.9560.30.394.590.6283
100–200030130780.9560.30.211.310.7374
100–100040130780.9560.30.363.710.6884
100–200040130780.9560.30.170.860.7849
Table 2. Comparisons of the theoretical sound absorption coefficients before and after optimization.
Thickness of Original Polyurethane Foam (mm)Investigated Frequency Range (Hz)Theoretical Average Sound Absorption CoefficientImprovement
Polyurethane FoamComposite StructureAbsolute ValueRelative Percentage
10100–10000.06940.39690.3275471.59%
10100–20000.14890.51790.3690247.76%
20100–10000.16730.54090.3736223.24%
20100–20000.34220.66110.318993.21%
30100–10000.29660.62830.3317111.83%
30100–20000.53690.73740.200537.35%
40100–10000.43310.68840.255358.95%
40100–20000.67990.78490.105015.44%
Table 3. Comparisons of theoretical data, simulation data, and experimental data of average sound absorption coefficients of the optimal composite sound-absorbing structures.
Thickness of Original Polyurethane Foam (mm)Investigated Frequency Range (Hz)Average Sound Absorption Coefficient
In TheoryIn SimulationIn Actual
10100–10000.39690.39630.4015
10100–20000.51790.51700.5254
20100–10000.54090.53980.5296
20100–20000.66110.65850.6482
30100–10000.62830.62760.6184
30100–20000.73740.73670.7251
40100–10000.68840.68760.6803
40100–20000.78490.78430.7778
Table 4. Comparisons of actual average sound absorption coefficients of the optimal composite sound-absorbing structures with those of the polyurethane foam.
Thickness of Original Polyurethane Foam (mm)Investigated Frequency Range (Hz)Actual Average Sound Absorption CoefficientImprovement
Polyurethane FoamComposite StructureAbsolute ValueRelative Percentage
10100–10000.08660.40150.3149363.63%
10100–20000.14510.52540.3803262.10%
20100–10000.18850.52960.3411180.95%
20100–20000.33920.64820.309091.10%
30100–10000.26900.61840.3494129.89%
30100–20000.50060.72510.224544.85%
40100–10000.40770.68030.272666.86%
40100–20000.65590.77780.121918.59%
Table 5. Comparisons of actual average sound absorption coefficient of the optimal composite sound-absorbing structure with that of other porous materials when the total thickness was 20 mm.
The Investigated Sound AbsorberInvestigated Frequency Range (Hz)
100–1000100–2000
Proposed optimal composite structure0.52960.6482
Utilized original polyurethane foam0.18850.3392
Standard porous metal [27]0.15290.2477
Uniform compressed porous metal [27]0.20980.4531
Gradient compressed porous metal [27]0.33250.5412
Microperforated compressed porous metal panel [29]0.16570.3403

