1. Introduction
To enhance user satisfaction and to meet the demands of the times, extensive efforts are being made to introduce multi-purpose flexible spaces in modern architectural structures. Structural members with long spans are essential for flexible structures, but larger cross-sections involve higher costs and increase the overall weight. As such, it is necessary to develop a rational structural system that remains lightweight.
Compared to general reinforced concrete slabs, prestressed concrete hollow core slabs (HCS), members with hollow cores and more structurally efficient cross-sections, are widely used in Europe and North America as tendons in upper and lower layers to help achieve superior flexural rigidity and strength [
1,
2,
3,
4,
5,
6,
7].
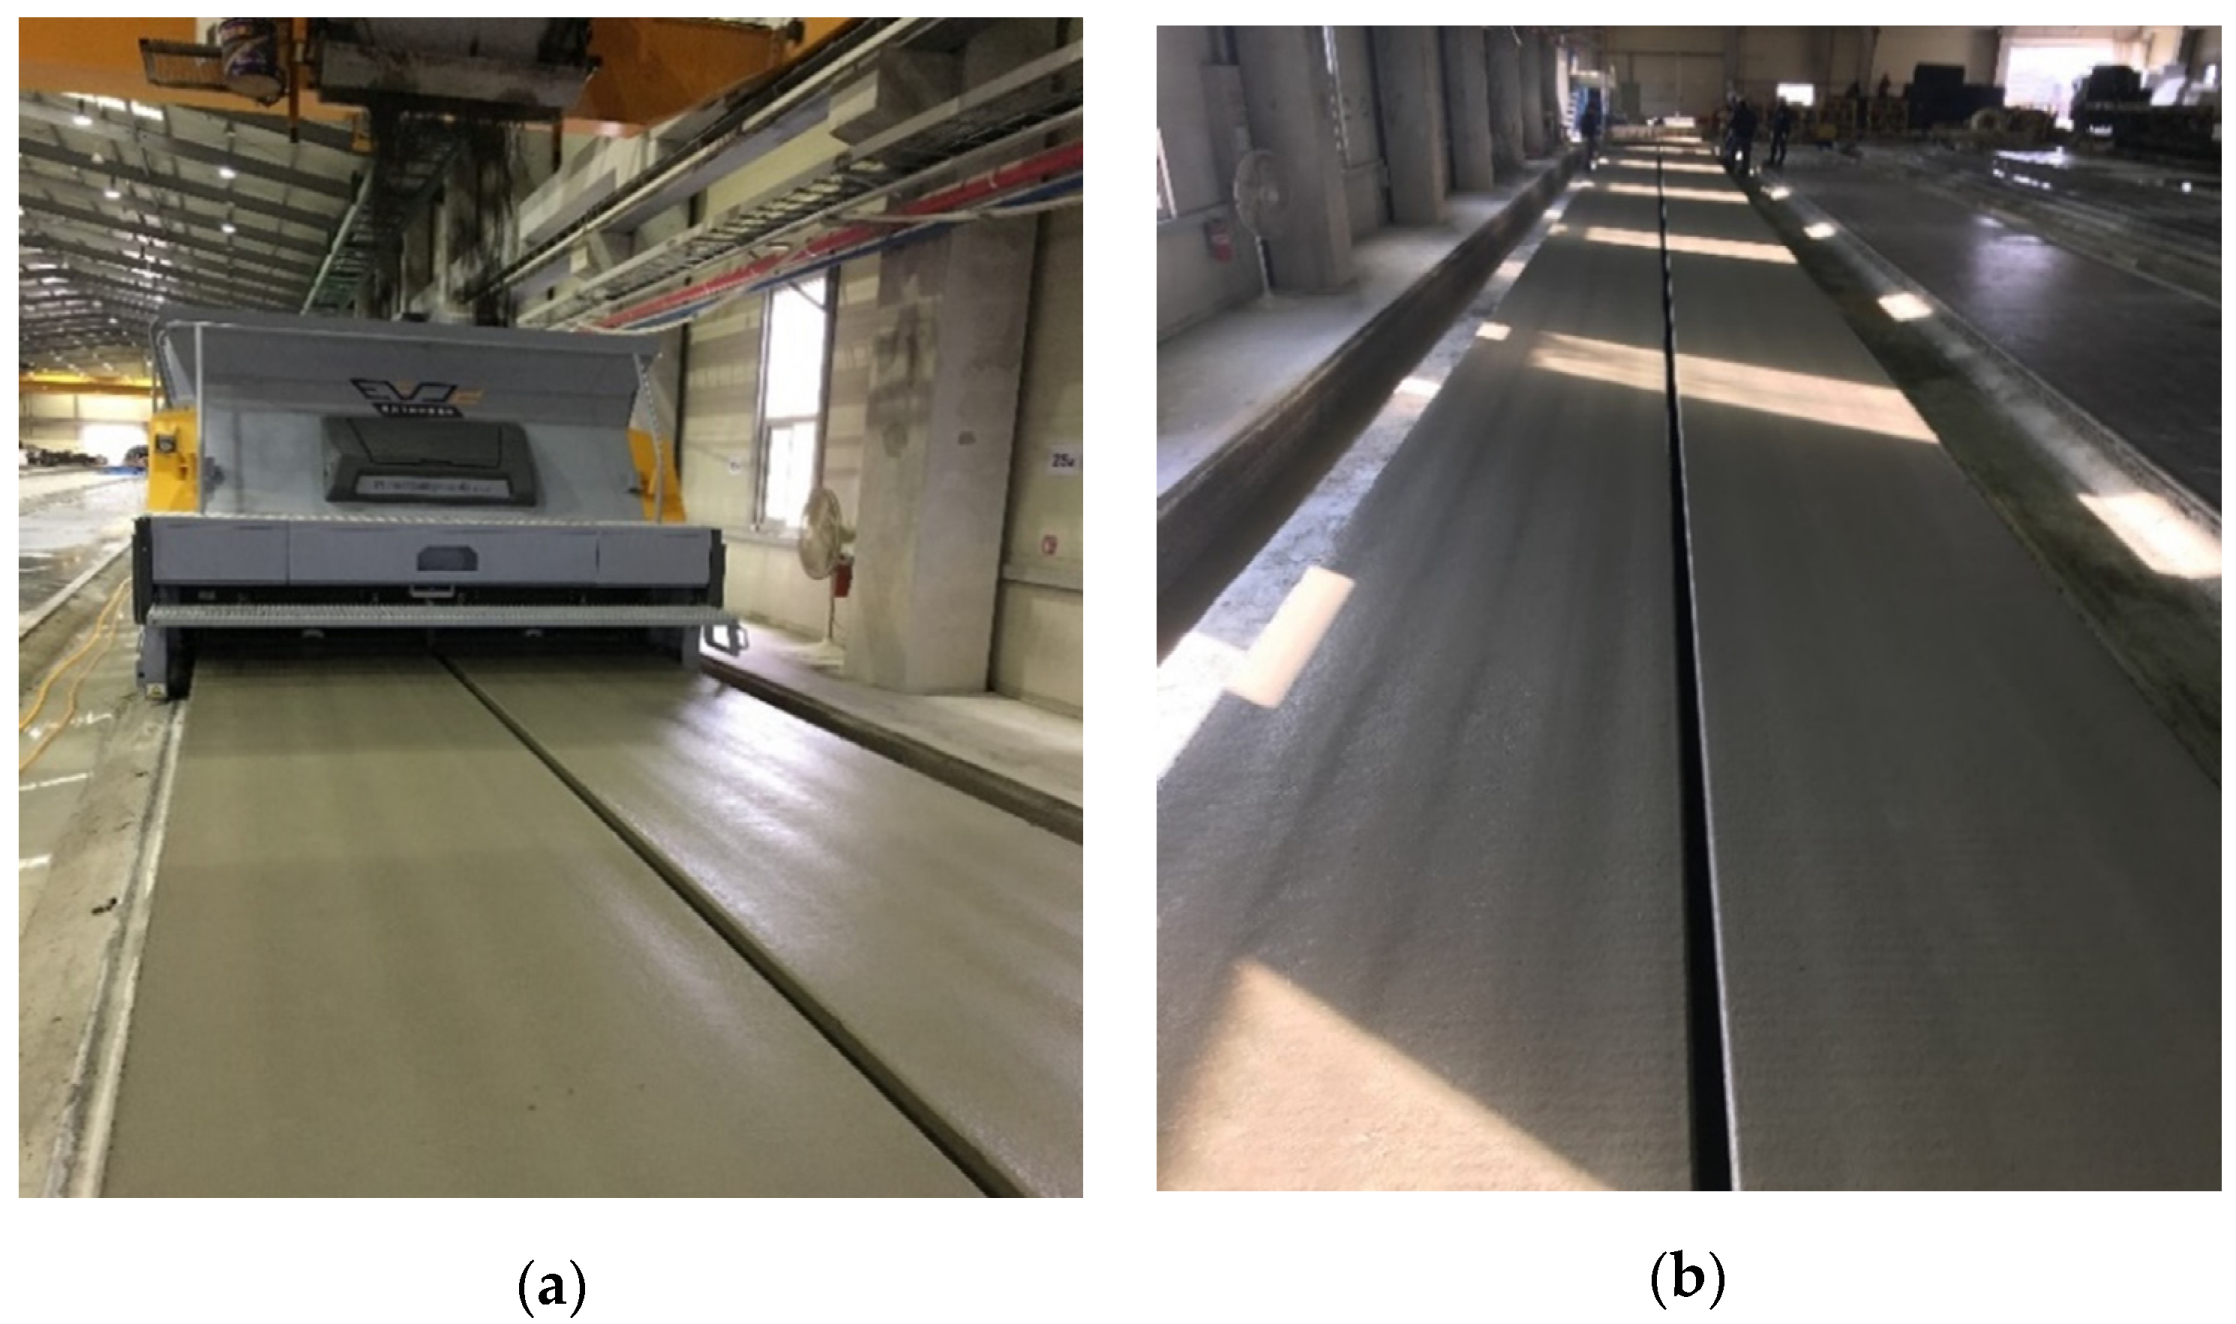
Figure 1 presents the manufacturing site of D, which manufactured the specimens used in this study. In the case of HCS, strands placed on a long-line bed of 90–180 m are jacked at once, and members are fabricated through extrusion with placing of high-strength, zero-slump concrete. This not only facilitates mass production, but also enhances overall quality of structures through the dense packing of concrete [
8].
HCS members, which are manufactured in factories and assembled on-site, have a short construction period and allow easy on-site management. They are widely used in structures requiring long-span floors such as distribution centers, discount stores and semiconductor factories. They are especially advantageous for long-span structures thanks to their reduced weight from the use of hollow cores [
9,
10]. However, high strength concrete with low slump is placed without molds, and the mix is extruded while compacting. As such, the placement of transverse reinforcement is almost impossible [
7], and structural evaluation is important at member ends where shear force is dominant because the introduction of prestress causes high stress concentration. In addition, the accuracy of the strength prediction for securing the structural safety of the prestressed concrete members are required.
Due to these effects, a study [
11,
12,
13,
14] has been conducted to reasonably predict the shear strength of prestressed concrete members. Laskar et al. [
11] proposed a shear strength prediction formula that reflects the influence of shear span-to-depth ratio (
a/
d) on the shear strength evaluation of prestressed concrete I-beams by comparing the experimental results with previous studies. Cladera et al. [
13] presented and validated a simplified mechanical model to make it easier for practitioners to use for shear design purposes. Hoogenboom [
14] proposed a practical method using finite element analysis to efficiently evaluate the section forces of HCS with openings.
Using members manufactured by D, this study conducted shear experiments with cross-sectional height and presence of topping concrete as variables to evaluate the structural performance of HCS. Qualitative requirements of shear performance were experimentally verified by comparing the experimental results to analytical results derived based on design codes and the findings of previous studies.
2. Shear Strength of HCS
As shown in Equation (1), the Korea Concrete Institute Model Code (KCI 2017) [
15] and American Concrete Institute Standard (ACI 318-19) [
16] specify that the design shear strength of a prestressed concrete member must be equal to or greater than the factored shear strength.
Here, is the factored shear strength and is the nominal shear strength.
Depending on the two types of shear failure, the shear strength of an HCS member without transverse reinforcement can be classified into flexural-shear strength (
) and web-shear strength (
), given by Equations (2) and (3), respectively. According to the Code, the smaller of the two values should be used.
Here, is the lightweight concrete factor, is the compressive strength of concrete, is the web width, is the distance from the compressive edge to the center of the tendon cross section, is the shear force of the cross section due to fixed load, is the factored shear force due to applied load, is the crack moment due to applied load, is the maximum factored moment due to applied load, is the compressive stress of concrete in consideration of stress loss of prestress at the cross-sectional centroid that is in resistance to applied load, and is the vertical component of jacking force where inclined tendons are used.
In the case of HCS, thin webs are the most vulnerable structures due to the hollow cores, and shear strength is likely to be determined based on web-shear strength. Since the calculation of effective cross section is important in evaluating shear strength, Precast/Prestressed Concrete Institute (PCI) [
17] recommends the use of web width in the calculation of design member force.
For HCS, the formation of web-shear cracks should be prevented in the transfer length section, where effective prestress is not fully exhibited. If the decrease in effective prestress is reflected at dangerous cross sections, web-shear strength decreases by about 30% according to Equation (3). Equation (3) is based on the study of Hawkins and Ghosh [
2], who found that using Equation (3) to derive the web-shear strength may overestimate the actual strength of HCS members with heights greater than 300 mm because the web-shear strength of HCS members exceeding 380 mm falls in the range of 58 to 85% [
8]. KCI 2017 and ACI 318-19 specify that web-shear strength should be halved for thick HCS members exceeding 315 mm in height and not meeting the minimum requirement for transverse reinforcement.
To ensure the continuity considering the floor diaphragm of slabs, topping concrete is placed on HCS, and the slabs are used in the form of composite cross-sections. As described by PCI, the web-shear strength of HCS members can be obtained by substituting topping concrete with a transformed section. Since topping concrete generally has a lower compressive strength than that of the concrete used in HCS members, the elastic modulus of concrete () is used when calculating web-shear strength based on a transformed section.
3. Experimental Program
3.1. Materials
To evaluate the shear performance of HCS, the concrete used for specimens had a specified compressive strength of 45 MPa, as shown in
Table 1. The specified compressive strength of topping concrete was set at 24 MPa. Crushed gravel and crushed sand were used as coarse aggregates and fine aggregates in the concrete. The maximum size values of coarse aggregates for HCS and topping concrete were 19 mm and 25 mm, respectively, while that of fine aggregates was 5 mm.
To examine the dynamic characteristics of concrete in relation to the concrete mix, a concrete cylinder with size of
100 × 200 mm was fabricated. Curing was carried out under the same conditions for all specimens. The concrete compressive strength experiment was conducted according to days taken for specimen failure; the results are presented in
Figure 2 and
Table 2. The concrete compressive strength of HCS shown in
Table 2 was obtained from 55 × 55 mm cube samples extracted from specimens. The compressive strength values of HCS and of topping concrete averaged 48.2–48.7 MPa and 27.0–28.1 MPa respectively, which exceed the design strength. The compressive strength measured from the concrete cylinder of HCS averaged 46.8 MPa, which differs from that of the cube samples by 1.4 to 1.9 MPa.
To introduce prestress, the specimens were fabricated from strands (SWPC 7BL). The strands had a yield strength of 1581 MPa and tension of 1860 MPa; those with diameters () of 12.7 mm and 9.5 mm were placed in the upper and lower parts to ensure the proper cross-sectional properties.
3.2. Specimens
To evaluate shear performance in relation to cross-sectional height and presence of topping concrete in HCS, specimens were fabricated according to the data in
Table 2. In the specimen names, S and CS indicate HCS with or without topping concrete, respectively. The numbers 265, 320, and 400 represent the heights of HCS without taking into account the topping concrete.
As shown in
Table 2 and
Figure 3 and
Figure 4, the specimens have cross-sections of 1200 × 265 (320, 400) mm, lengths of 3000 (3400) mm, and pure spans of 1700 (2100) mm. In the case of S series, the shear span-to-depth ratio (
a/d) was designed to be in the range of 2.14–2.61, depending on the effective depth for shear failure to occur. For CS series, the range was 1.50–1.94 due to the influence of topping concrete.
As shown in
Figure 3 and
Figure 4, HCS was designed to reflect the preferred reinforcement characteristics in the field, according to the height of the cross section. S265 (CS265) used tendons as strands regardless of the presence of topping concrete, placing 6-
12.7 and 2-
9.5 at the bottom, and 4-
9.5 at the top. For S320 (CS320), 8-
12.7 was applied to the bottom of the cross-section, and 2-
9.5 to the top. For S400 (CS400), 10-
12.7 was placed at the bottom, and 3-
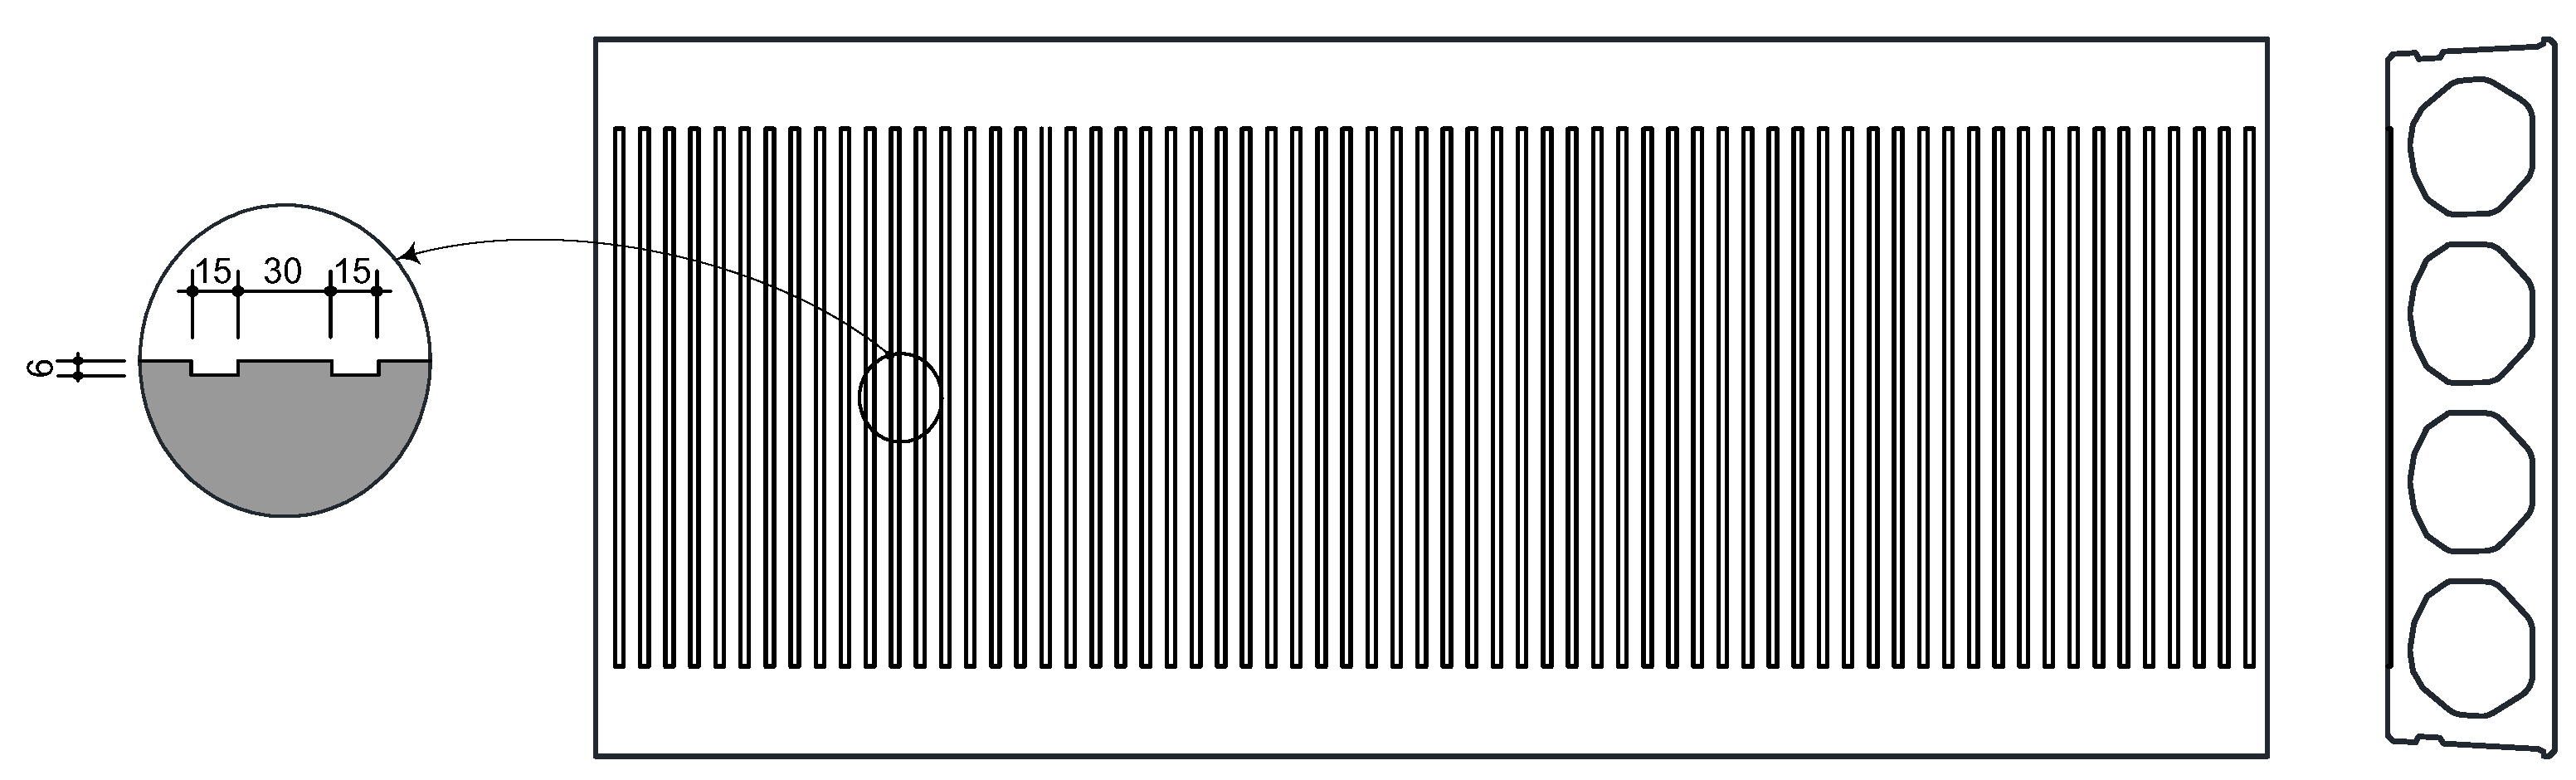
9.5 at the top. All specimens were subject to a tendon tensile strength of 65% as jacking force. Transverse reinforcement was not taken into account. As shown in
Figure 5, a coarse finish with a height of 6 mm was applied to the top surface of specimens to ensure integrated behavior with consideration of topping concrete.
3.3. Loading and Measurement Methods
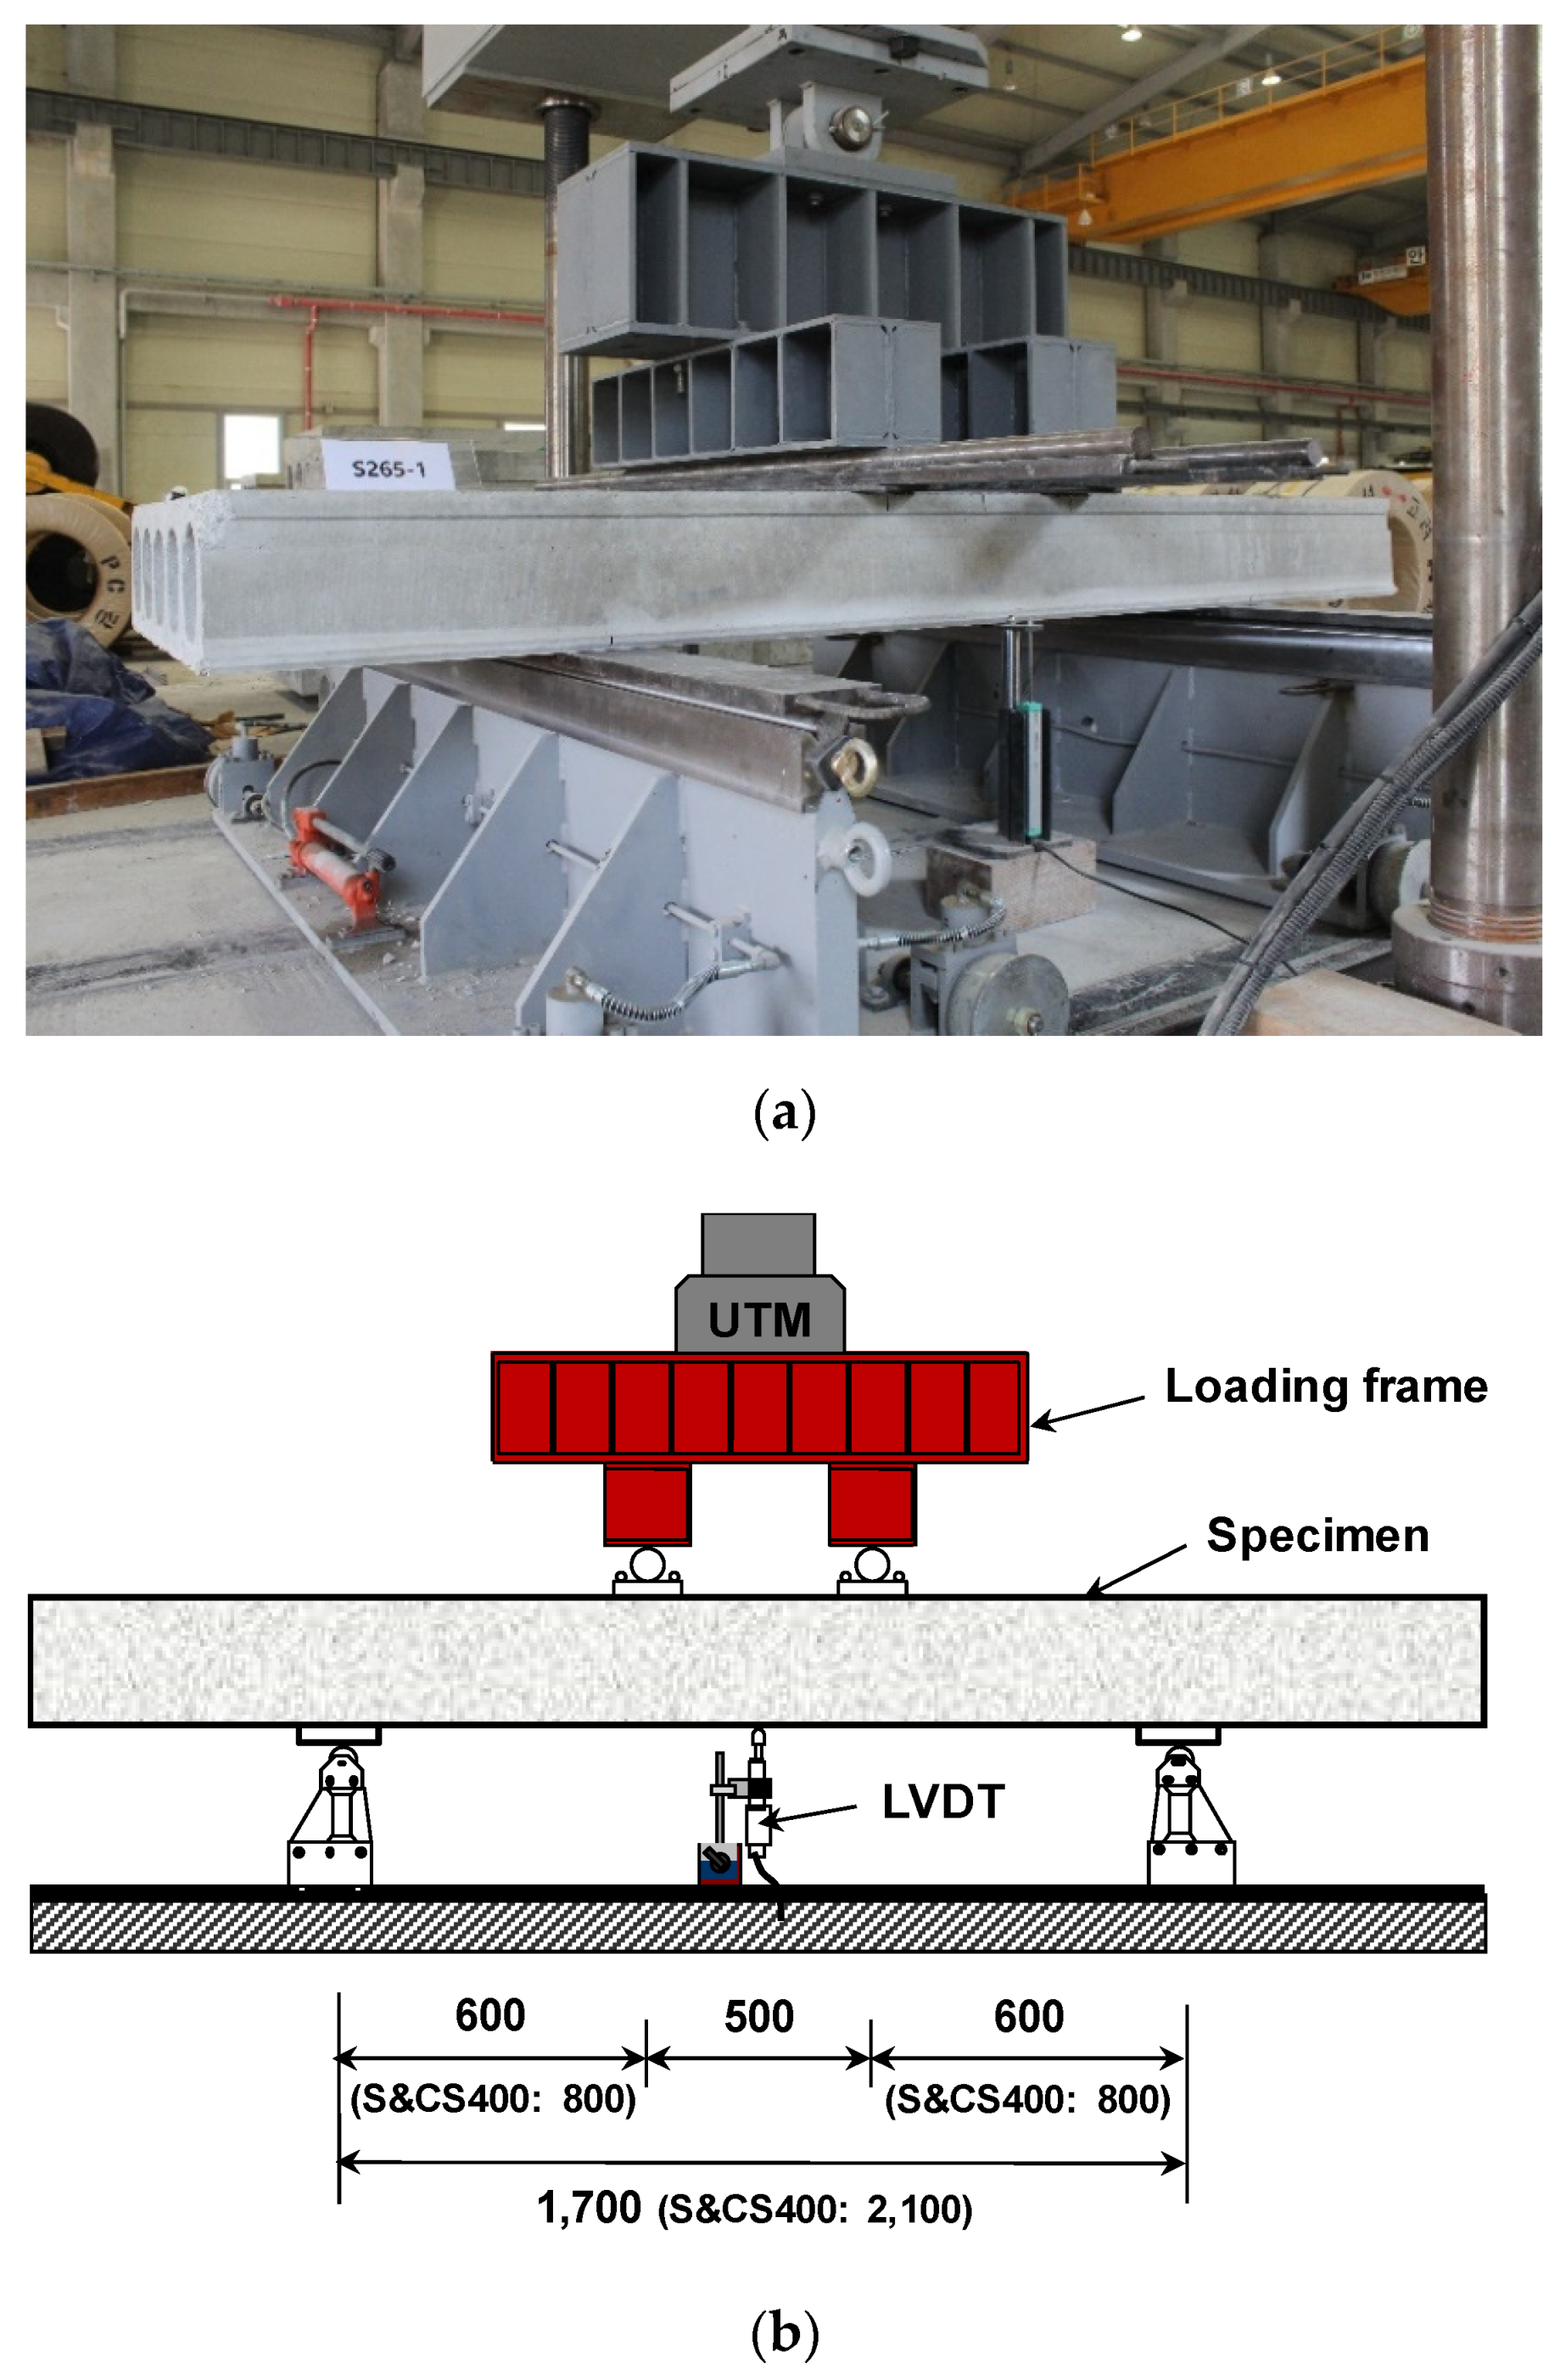
As shown in
Figure 6, a four-point loading test was conducted using simply supported beams. A universal testing machine (UTM) with a load capacity of 2000 kN was used. The displacement control method (1.0 mm/min) was employed to apply a continuous load, and the experiment was carried out until stress decreased to 85% of peak load. The deflection of specimens was measured by installing a linear variable differential transducer at the bottom middle, where the most deformation occurs.
4. Experimental Results and Discussion
4.1. Shear Force-Deflection Relationship
The shear force-deflection relationships of HCS are shown in
Figure 7 and
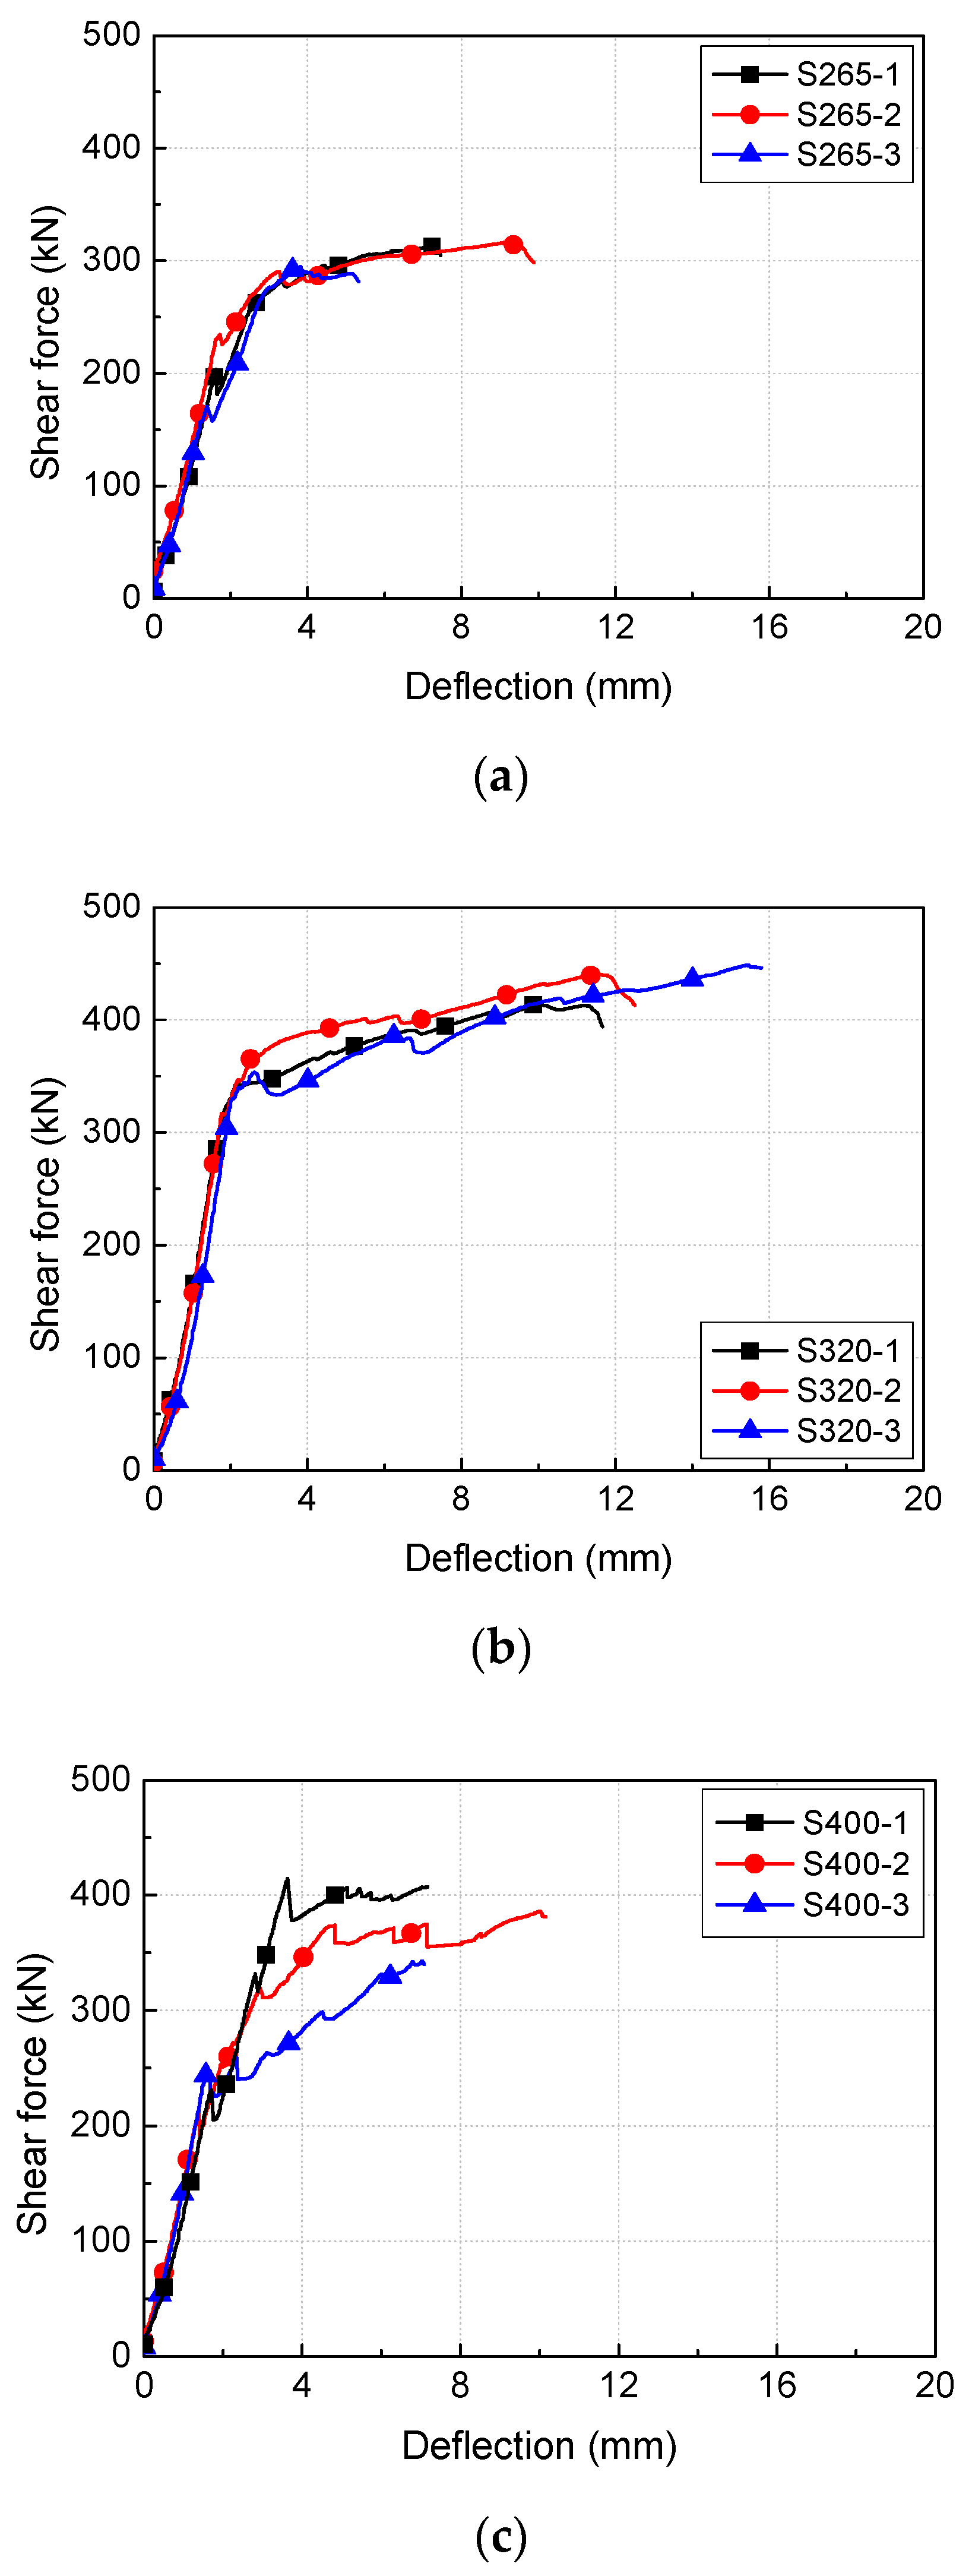
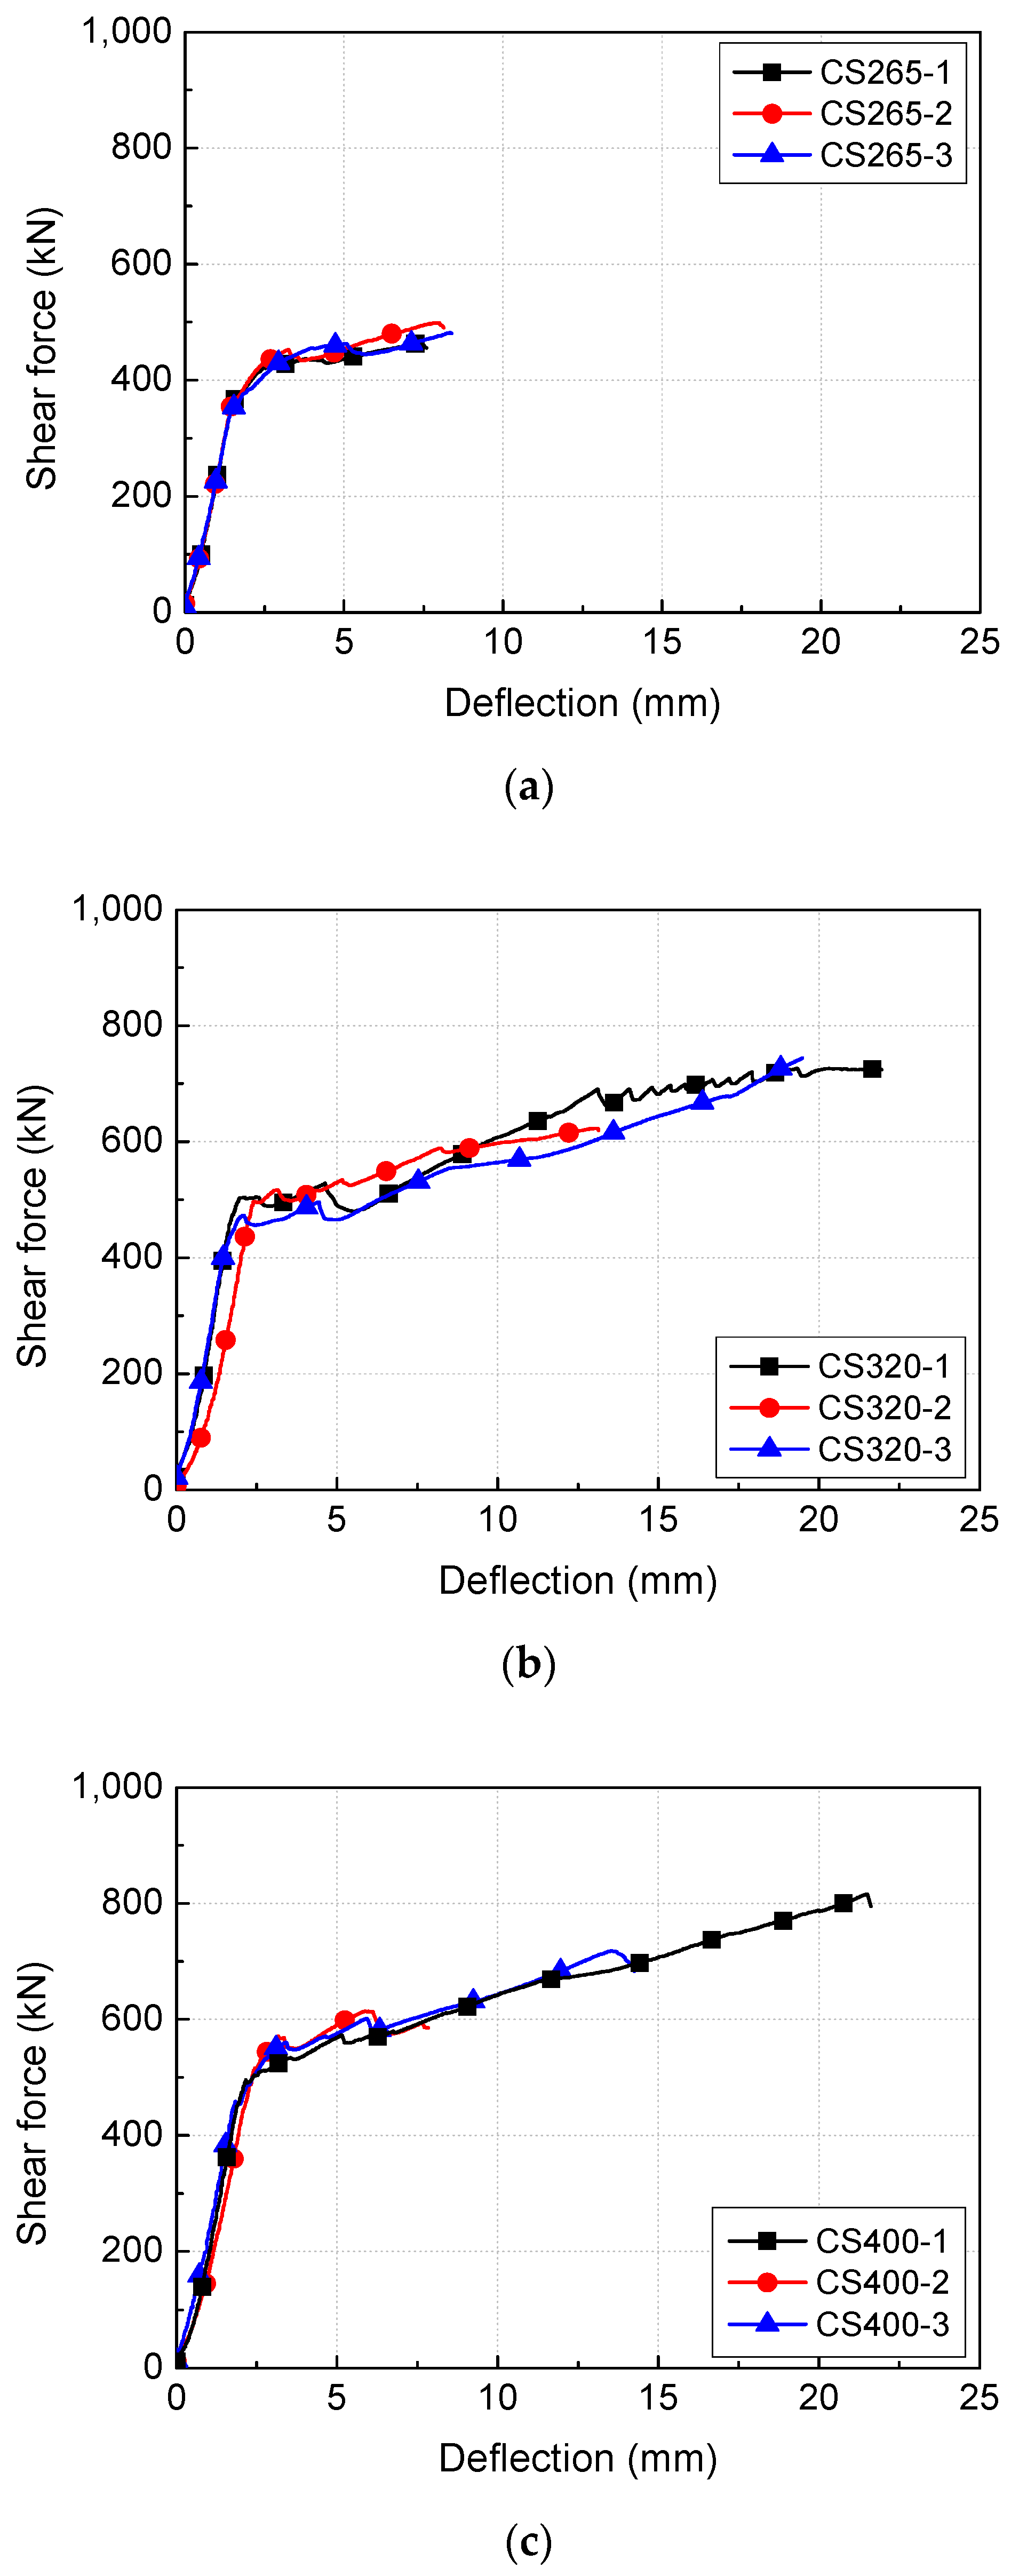
Figure 8. Shear force is expressed using the load measured from the hydraulic load cell of the universal testing machine. Deflection is derived from the displacement measured using the LVDT installed at the bottom middle of the loading points of the specimens. Regardless of cross-sectional height or presence of topping concrete, the behavioral characteristics observed in all specimens were linear up to the formation of diagonal cracks. Even after diagonal cracks occurred, the specimens exhibited linear behavior with increasing load. Due to the influence of web-shear cracks, stress decreased after reaching peak stress.
As shown in
Figure 7 and
Table 3, S265 of S series experienced diagonal cracks on average at 202.2 kN, and deflection on average at 1.58 mm. The peak shear force of S265 averaged 308. 1 kN, and the corresponding deflection was 6.74 mm. S320 and S400 experienced diagonal cracks on average at 322.9 kN and 231.1 kN, and deflection at 1.88 mm and 1.59 mm, respectively. The peak shear forces of S320 and S400 were 434.1 kN and 403.4 kN, respectively, with corresponding deflection values of 12.25 mm and 11.16 mm.
As shown in
Figure 8 and
Table 3, CS265 of CS series experienced flexural cracks on average at 356.8 kN, and deflection on average at 1.50 mm. The peak shear force of CS265 averaged 481.8 kN, and the corresponding deflection was 7.88 mm. CS320 and CS400 experienced diagonal cracks on average at 491.2 kN and 488.7 kN, and deflection at 2.17 mm and 2.15 mm, respectively. The peak shear forces of CS320 and CS400 were 697.9 kN and 715.9 kN, respectively, with corresponding deflection values of 17.28 mm and 13.72 mm.
As shown in
Table 3, compared to S265, S320 had average shear force increases of 58.9% and 40.9% during crack formation and peak stress with increasing effective depth, and average deflection increases of 19.0% and 81.8% respectively. Similarly, CS320 and CS265 had average increases in shear force of 37.7% and 44.9%, and average increases in deflection of 44.7% and 119.3%, respectively. In general, HCS with topping concrete had an average increase in shear force of 52.1–111.5% during crack formation and 56.4–77.5% during peak stress with decreasing shear span-to-depth ratio. With the exception of the comparison between S265 and CF265 during crack formation, the deflection at crack formation and peak stress increased by an average of 15.4–35.2% and 16.9–41.1%, respectively. These results indicate that an increase in effective depth significantly increases shear resistance in the case of the CS series, even for non-overlapping experimental sections.
4.2. Cracking Pattern
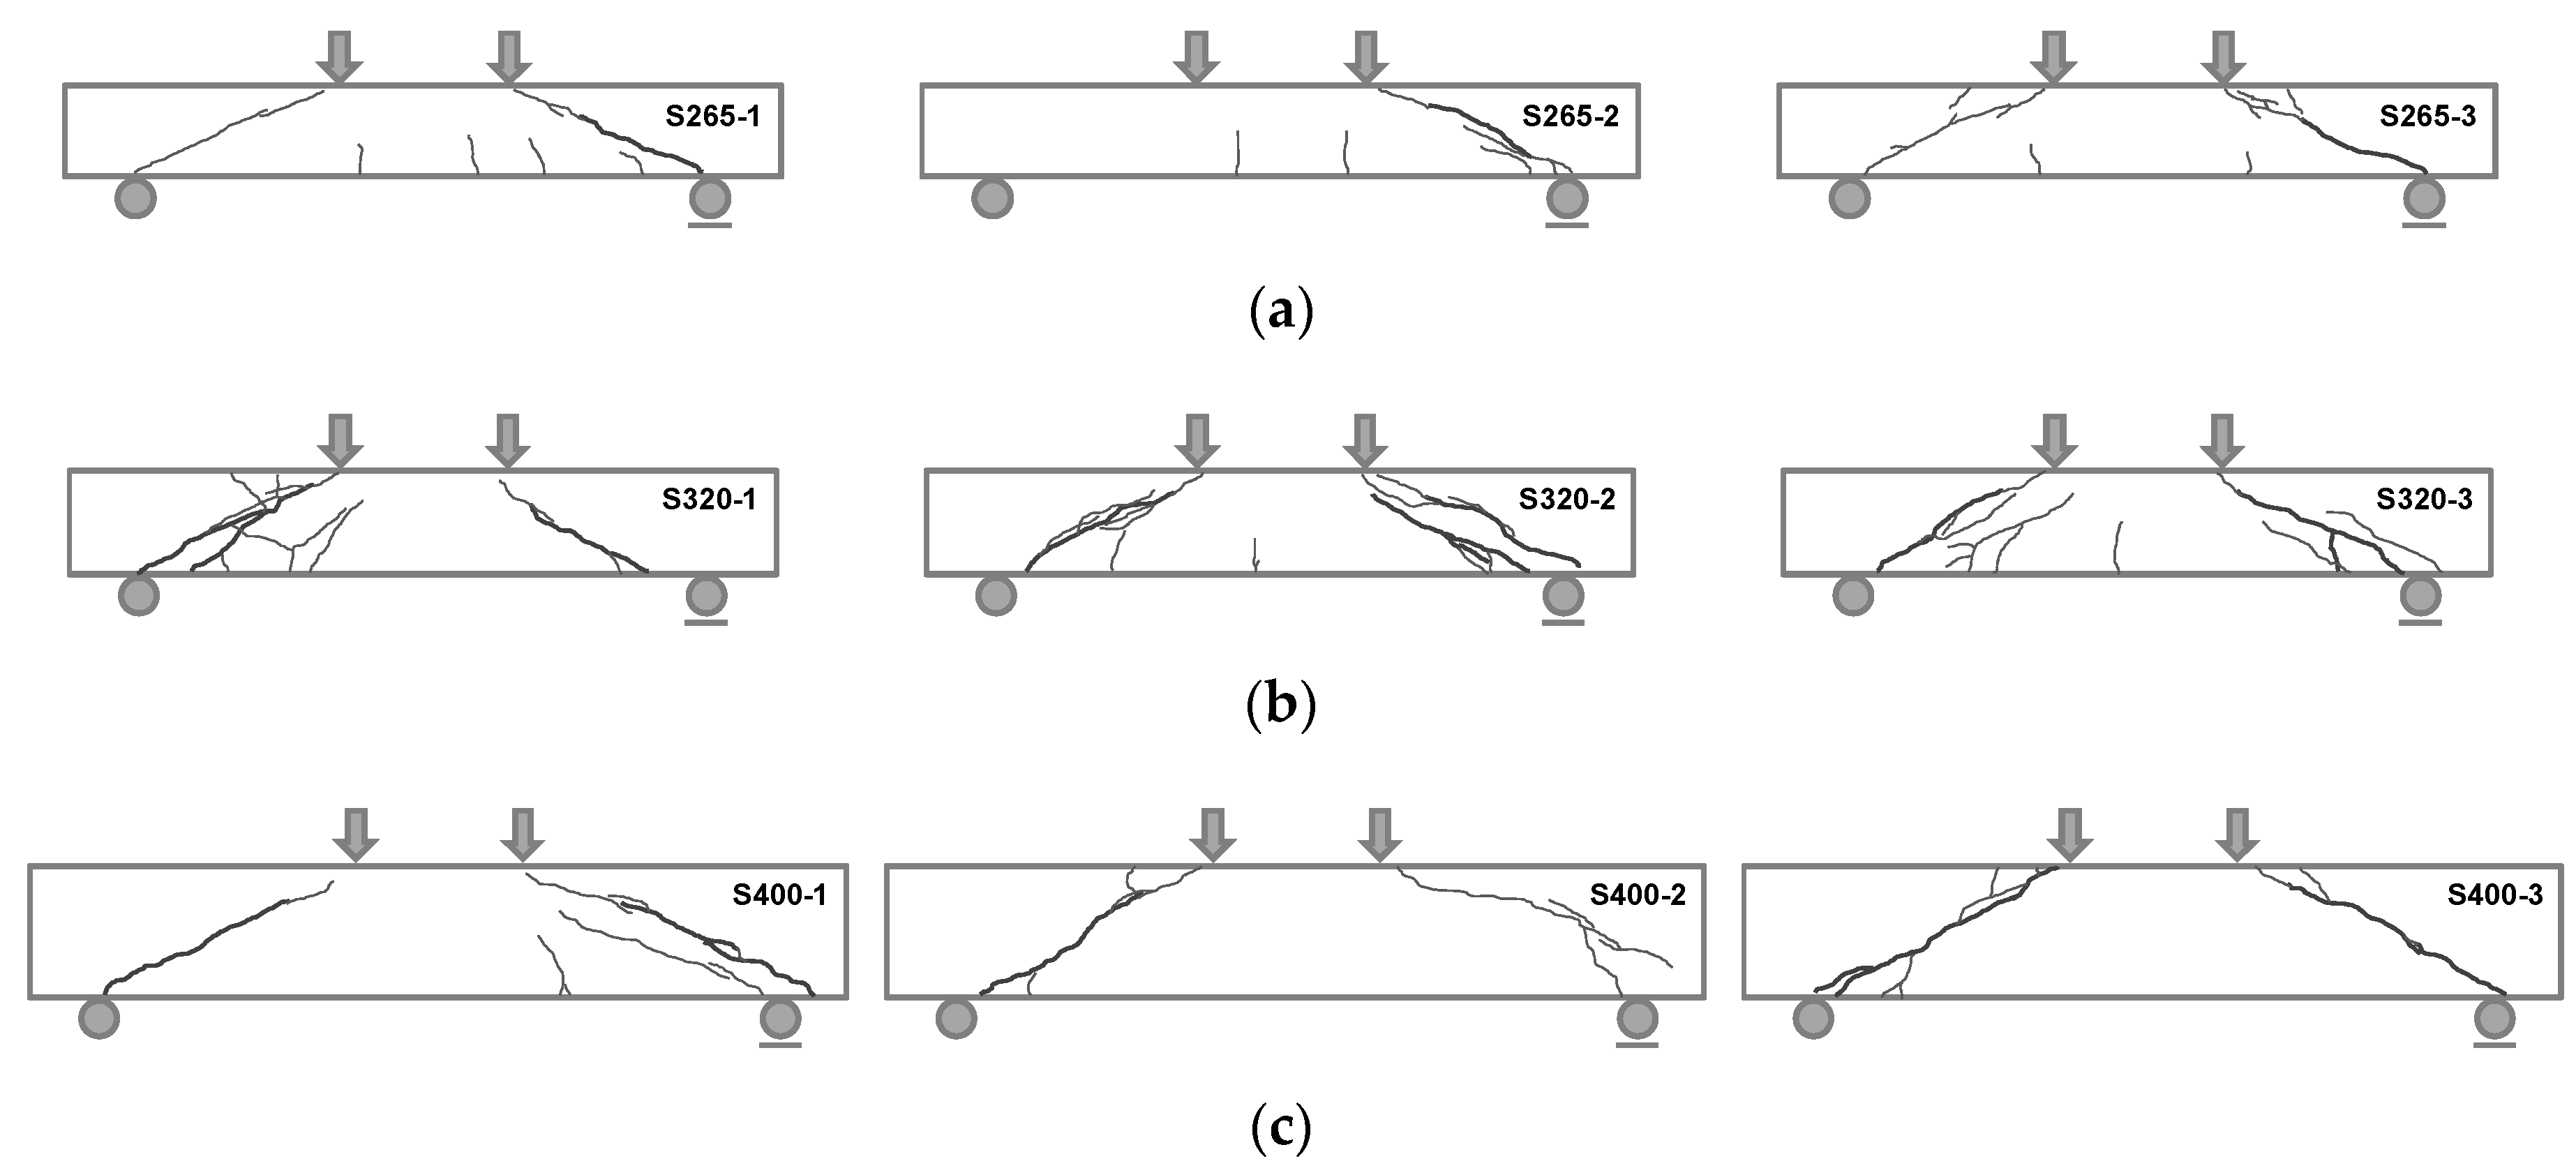
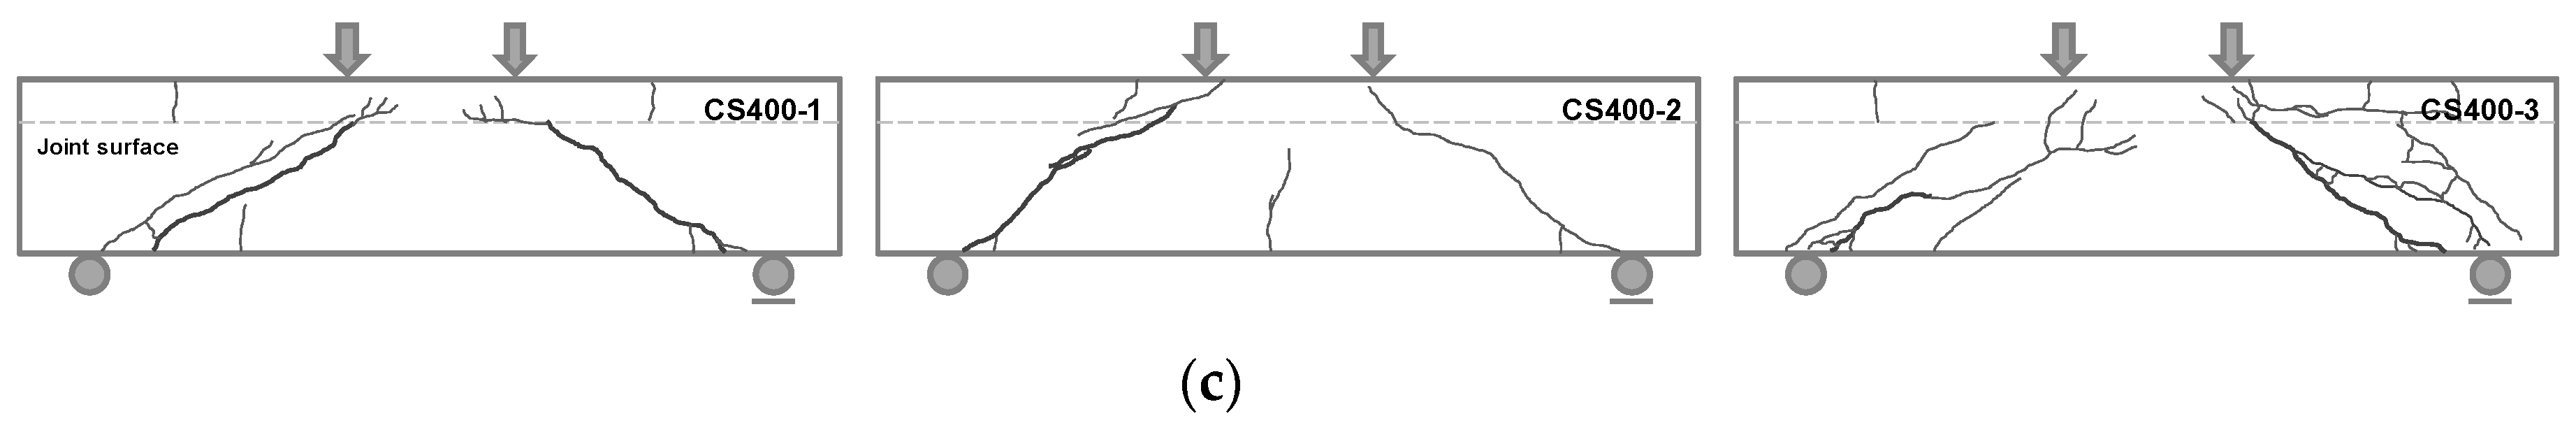
Cracking patterns at peak load for S and CS series are shown in
Figure 9 and
Figure 10, respectively. As shown in
Figure 9, regardless of cross-sectional height, S series experienced inclined cracks in experimental sections during initial loading, and the flexural cracking load was observed in the pure flexural sections between loading points of the specimen because some specimens had lower flexural cracking loads than web-shear cracking load. The cracks formed in experimental sections grew significantly with increasing load, and ultimately, most specimens showed shear failure under the influence of web-shear cracking after flexural yielding and before reaching the peak stress of flexural.
As shown in
Figure 10, CS320 and CS400 of CS series experienced diagonal cracks in experimental sections during initial loading, and exhibited flexural cracks in pure flexural sections between loading points with increasing load. On the other hand, CS265 experienced flexural cracks for the first time in pure flexural sections between loading points, followed by diagonal cracks with increasing load. Due to the influence of topping concrete, there was not much difference in shear strength or load during the formation of flexural cracks.
With the exception of S265-2, S series specimens showed a decrease in stress after the formation of diagonal cracks. Diagonal cracks formed on the opposite sides of experimental sections during peak stress, which in turn caused a decrease in stress. Following the formation of diagonal cracks, CS series exhibited linear behavior of a constant gradient with increasing load, and experienced a decrease in stress with the formation of web-shear cracks in webs after reaching peak stress.
4.3. Shear Strength
To evaluate the shear strength of HCS in relation to cross-sectional height and presence of topping concrete, the experimental results were compared to the analytical results based on KCI 2017 [
15] and ACI 318-19 [
16], as shown in
Table 3. In the experiment, shear strength was calculated using the hydraulic load cell of the universal testing machine (UTM). For the analytical results based on KCI 2017 and ACI 318-19, shear strength was the smaller of the two values among flexural-shear strength (
) and web-shear strength (
). As recommended by PCI [
18], in calculating shear strength, only the web width of HCS was considered for HCS. For more precise analysis of shear strength of HCS with topping concrete, the actual width of topping concrete was measured, and the results are shown in
Table 3. The influence of topping concrete was calculated by applying the transformed section method with consideration of the elastic modulus of concrete.
For S series, the shear strength of S265 averaged 308.1 kN in the experiment, and 212.7 kN in the analysis. The average ratio of analytical to experimental shear strength was 1.45. S320 and S400 had average experimental shear strengths of 434.1 kN and 403.4 kN, and analytical shear strengths of 257.6 kN and 352.3 kN, respectively. The average ratios of analytical to experimental shear strength were 1.69 and 1.14, respectively. As for CS series, CS265 had an average experimental shear strength of 481.8 kN and an analytical shear strength of 260.3 kN, resulting in an average ratio of 1.85. CS320 and CS400 had average experimental shear strengths of 697.9 kN and 715.9 kN, and analytical shear strengths of 320.5 kN and 413.2 kN, respectively. The average ratios of analytical to experimental shear strength were 2.18 and 1.73, respectively.
Comparing shear strength values to analytical results based on KCI 2017 and ACI 318-19, as shown in
Table 3, the average ratio of analytical to experimental shear strength was 1.14–1.69 for S series, and 1.73–2.18 for CS series. That is, shear strength conditions were satisfied regardless of cross-sectional height or presence of topping concrete. In addition, the analytical results based on KCI 2017 and ACI 318-19 had a tendency to provide predictions on the safe side, and CS series had a ratio 29–52% higher than that of the S series. As such, further research is needed to develop prediction equations that allow more rational calculation of shear strength of HCS members with topping concrete.
4.4. Analysis of Key Influence Factors On the Web-Shear Capacity
As mentioned in
Section 2, due to the vulnerable structure resulting from prestress and hollow cores, shear strength of HCS is likely to be determined by web-shear strength rather than flexural-shear strength. For a more objective evaluation of the effects of web-shear strength, a comparative analysis was performed with experimental results from previous studies as key influence factors [
6,
18,
19,
20,
21,
22,
23]. 164 sets of experimental data were retrieved from previous studies, and a summary is provided in
Table 4.
Figure 11 compares the experimental results with the results of previous studies; shear strength was nondimensionalized (
) for more objective comparison of key influence factors. From
Figure 11a,b, with increasing compressive strength and shear span-to-depth ratio, we can see a proportionate increase in both experimental results and previous study results. The variable shown in
Figure 11c, which shows the effect of compressive stress with consideration of stress loss of prestress at the cross-sectional centroid, showed a more prominent increase compared to other variables, and had the greatest influence on web-shear strength. This is also indicated in previous studies of prestressed concrete beams under shear and torsional loading [
24]. In
Figure 11d, which shows member height as a variable, both experimental results and results from previous studies decreased in similar ways. However, compared to the web-shear strength (
) recommended in the design codes, the results were consistent with those of previous studies. As reported by Palmer and Schultz [
5], HCS members were not significantly affected by size.
5. Conclusions
To evaluate the shear performance of HCS, this study conducted shear experiments with cross-sectional height and presence of topping concrete as variables. Comparing the experimental results to the analytical results based on the design codes and previous studies, the following conclusions were derived.
Regardless of the presence of topping concrete, HCS exhibited linear shear behavior of a constant gradient, and experienced typical web shear failure with decreased stress due to diagonal cracks formed in webs during peak stress.
Such tendencies were observed in the comparison of S and CS series. The effective depths of S and CS series increase with the increase in cross-sectional height and inclusion of topping concrete, and the resulting decrease in shear span-to-depth ratio significantly enhances shear resistance. S and CS series having the same experimental sections showed increases in shear force and deflection with increasing cross-sectional height.
Comparing shear strength values to analytical results based on KCI 2017 and ACI 318-19, the average ratios of analytical to experimental shear strength were 1.14–1.69 for S series and 1.73–2.18 for CS series. That is, shear strength conditions were satisfied regardless of cross-sectional height or presence of topping concrete. In particular, CS series had ratios 29–52% higher than those of the S series. Prediction equations that allow more rational calculation of shear strength of HCS with topping concrete should be developed.
The experimental results of HCS were found to be similar to the results of previous studies. Among the key influence factors, web-shear strength was most influenced by compressive strength of concrete due to prestress at the cross-sectional centroid. Web-shear strength was partly influenced by concrete compressive strength and shear span-to-depth ratio, but the extent of that influence was insignificant compared to the key influence factors.
Author Contributions
Conceptualization, Y.-J.L. and K.-H.K.; methodology, Y.-J.L.; validation, H.-G.K. and M.-J.K.; formal analysis, Y.-J.L.; investigation, D.-H.K.; data curation, H.-G.K. and M.-J.K.; writing—Original draft preparation, Y.-J.L.; writing—Review and editing, H.-G.K., M.-J.K. and K.-H.K.; supervision, K.-H.K.; project administration, K.-H.K. All authors have read and agreed to the published version of the manuscript.
Funding
The research was supported by the International Science and Business Belt Program through the Ministry of Science and ICT (2015-DD-RD-0068-05) and this work was supported by the Priority Research Centers Program through the National Research Foundation of Korea (NRF) funded by the Ministry of Education (2019R1A6A1A03032988). This research was supported by Basic Science Research Program through the National Research Foundation of Korea (NRF) funded by the Ministry of Education (2018R1A2B3001656).
Acknowledgments
The authors would like to give sincere thanks to Duksan GS Corporation for supporting this work.
Conflicts of Interest
The authors declare no conflict of interest.
References
- Becker, R.J.; Buettner, D.R. Shear tests of extruded hollow-core slabs. PCI J. 1985, 30, 40–54. [Google Scholar] [CrossRef]
- Hawkins, N.M.; Ghosh, S.K. Shear strength of hollow-core slabs. PCI J. 2006, 51, 110–114. [Google Scholar]
- Mones, R.M.; Breña, S.F. Hollow-core slabs with cast-in-place concrete toppings: A study of interfacial shear strength. PCI J. 2013, 58, 124–141. [Google Scholar] [CrossRef]
- Pajari, M. Web shear failure in prestressed hollow core slabs. J. Struct. Eng. 2009, 42, 83–104. [Google Scholar]
- Palmer, K.D.; Schultz, A.E. Factors affecting web-shear capacity of deep hollow-core units. PCI J. 2010, 55, 123–146. [Google Scholar] [CrossRef]
- Palmer, K.D.; Schultz, A.E. Experimental investigation of the web-shear strength of deep hollow-core units. PCI J. 2011, 56, 83–104. [Google Scholar] [CrossRef]
- Im, J.H.; Park, M.K.; Lee, D.H.; Seo, S.Y.; Kim, K.S. Evaluation of horizontal shear strength of prestressed hollow-core slabs with cast-in-place topping concrete. J. Korea Concr. Inst. 2014, 26, 741–749. (In Korean) [Google Scholar] [CrossRef] [Green Version]
- Moon, J.H. Structural Performance for the Extruded Hollow Core Slabs with Prestressed Concretes; Hansung PCC & Hannam University Research Report: Daejeon, Korea, 2017. (In Korean) [Google Scholar]
- Lee, Y.J.; Kim, H.K.; Kim, M.J.; Lee, J.S.; Kim, K.H. Evaluation of structural performance for prestressed concrete hollow core slabs. J. Korea Concr. Inst. 2019, 31, 505–512. (In Korean) [Google Scholar] [CrossRef]
- Jang, H.J.; Ryu, J.H.; Kim, S.M.; Ju, Y.K.; Kim, S.D. An evaluation on the flexural capacity of void slabs with prestressed half PC. J. Archit. Inst. Korea 2012, 28, 11–18. (In Korean) [Google Scholar]
- Laskar, A.; Hsu, T.T.; Mo, Y.L. Shear strengths of prestressed concrete beams part 1: Experiments and shear design equations. ACI Struct. J. 2010, 107, 330–339. [Google Scholar]
- Sigrist, V.; Bentz, E.; Ruiz, M.F.; Foster, S.; Muttoni, A. Background to the fib model code 2010 shear provisions—Part I: Beams and slabs. Struct. Concr. 2013, 14, 195–203. [Google Scholar] [CrossRef]
- Cladera, A.; Marí, A.; Bairán, J.M.; Ribas, C.; Oller, E.; Duarte, N. The compression chord capacity model for the shear design and assessment of reinforced and prestressed concrete beams. Struct. Concr. 2016, 17, 1017–1032. [Google Scholar] [CrossRef] [Green Version]
- Hoogenboom, P.C.J. Analysis of hollow-core slab floors. Heron 2005, 50, 173–185. [Google Scholar]
- Korea Concrete Institute. KCI Model Code 2017; Kimoondang Publishing Company: Seoul, Korea, 2017; p. 637. (In Korean) [Google Scholar]
- ACI Committee 318. Building Code Requirements for Structural Concrete (ACI 318-19) and Commentary (ACI 318R-19); American Concrete Institute (ACI): Farmington Hills, MI, USA, 2019; p. 623. [Google Scholar]
- Precast/Prestressed Concrete Institute. PCI Manual for the Design of Hollow Core Slabs, 2nd ed.; PCI Hollow Core Slab Producers Committee: Chicago, IL, USA, 1988. [Google Scholar]
- Pajari, M. Resistance of Prestressed Hollow Core Slabs against Web Shear Failure; Technical Research Centre of Finland (VTT): Espoo, Finland, 2005. [Google Scholar]
- Walraven, J.C.; Mercx, W.P.M. The bearing capacity of prestressed hollow-core slabs. Heron 1983, 28, 1–46. [Google Scholar]
- TNO Building and Constructions Research. TNO Report: Standard Shear Tests on Prestressed Hollow Core Slabs according to EN 1168; TNO Building and Constructions Research: Hague, The Netherlands, 2005. [Google Scholar]
- Bertagnoli, G.; Mancini, G. Failure analysis of hollow-core slabs tested in shear. Struct. Concr. 2009, 10, 139–152. [Google Scholar] [CrossRef]
- Celal, M.S. Shear Behavior of Precast/Prestressed Hollow-Core Slabs. Master’s Thesis, University of Manitoba, Winnipeg, MB, Canada, 2011. [Google Scholar]
- Park, M.K.; Lee, D.H.; Han, S.J.; Kim, K.S. Web-shear capacity of thick precast prestressed hollow-core slab units produced by extrusion method. Int. J. Concr. Struct. Mater. 2019, 13, 19–32. [Google Scholar] [CrossRef]
- Karayannis, C.G.; Chalioris, C.E. Strength of prestressed concrete beams in torsion. Struct. Eng. Mech. 2000, 10, 165–180. [Google Scholar] [CrossRef]
© 2020 by the authors. Licensee MDPI, Basel, Switzerland. This article is an open access article distributed under the terms and conditions of the Creative Commons Attribution (CC BY) license (http://creativecommons.org/licenses/by/4.0/).


