Review

Laryngeal Image Processing of Vocal Folds Motion

by
Gustavo Andrade-Miranda
1,*,
Yannis Stylianou
2,
Dimitar D. Deliyski
3,
Juan Ignacio Godino-Llorente
4 and
Nathalie Henrich Bernardoni
5,*
1
Computer Science Department, University of Cuenca, 0101168 Cuenca, Ecuador
2
University of Crete, 70013 Heraklion, Greece
3
Departament of Communicative Sciences and Disordes, Michigan State University, East Lansing, MI 48824, USA
4
Universidad Politécnica de Madrid, Ctra. Valencia, km 7, 28031 Madrid, Spain
5
Université Grenoble Alpes, CNRS, Grenoble INP, GIPSA-lab, 38000 Grenoble, France
*
Authors to whom correspondence should be addressed.
Appl. Sci. 2020, 10(5), 1556; https://doi.org/10.3390/app10051556
Submission received: 26 December 2019 / Revised: 10 February 2020 / Accepted: 19 February 2020 / Published: 25 February 2020
(This article belongs to the Special Issue Computer-aided Biomedical Imaging 2020: Advances and Prospects)

Abstract

:
This review provides a comprehensive compilation, from a digital image processing point of view of the most important techniques currently developed to characterize and quantify the vibration behaviour of the vocal folds, along with a detailed description of the laryngeal image modalities currently used in the clinic. The review presents an overview of the most significant glottal-gap segmentation and facilitative playbacks techniques used in the literature for the mentioned purpose, and shows the drawbacks and challenges that still remain unsolved to develop robust vocal folds vibration function analysis tools based on digital image processing.

1. Introduction

Voice is the main support of communication in mankind, through which feelings, emotions and culture are transmitted. Therefore, voice is crucial to the quality of anyone’s daily life, especially of professional voice users. However, because of the voice misuse or overuse, changes in laryngeal structures may lead to voice disorders. In a cure-and-care approach, clinical voice assessment is required to diagnose the dysfunction and to plan appropriate treatment strategies [1]. According to the American Speech-Language-Hearing Association [2], a recommended protocol for instrumental assessment of voice has to include laryngeal endoscopic imaging, acoustics, and aerodynamic assessments (Figure 1). However, only the laryngoscopy allows the etiology determination of an organic or functional voice disorder. Hence, visual inspection of the vocal folds vibratory characteristics is essential for diagnosis. Advanced assessment makes use of high-speed cameras. On such data, image processing is the most promising approach to investigate vocal folds vibration and laryngeal dynamics in speech and singing [3,4,5]. Among the image-processing tasks, the most recurrent tasks are glottal segmentation and synthesizing laryngeal videos in a family of representations named Facilitative Playbacks (FP). They are essential operations for accurate characterization of vocal folds vibrations. This process leads to identify different phonation features, i.e., periodicity and amplitude of vocal folds vibration, Mucosal Wave (MW), glottal closure, closed-state, symmetry of vibration, presence of non-vibrating portions of vocal folds, etc. Clinicians and voice scientists use the obtained information to support their clinical diagnostics about the presence or absence of a disease and also to follow the dynamics of anatomical features of interest in a more intuitive way, revealing contents, which are often hidden to human eyes [6,7,8].
Reviews on laryngeal imaging research and clinical implications already exist in the literature of the past twenty years [4,8,11,12,13,14,15,16,17,18,19,20]. However, to our knowledge, there are no reviews devoted to analyzing the different glottal-gap segmentation and FP techniques. This paper is intended as a comprehensive state-of-the-art review on the particular issues of glottal-gap segmentation approaches and FP restricted to two widely available types of image modalities: Laryngeal High-Speed Videoendoscopy (HSV) and Laryngeal Videostroboscopy (VS) [21].
This paper is organized into six sections. Section 2 introduces the different image modalities in laryngeal imaging. Section 3 addresses the glottal gap segmentation problem and presents the literature devoted to synthesizing vocal folds dynamics (FP). Section 4 highlights the challenges in glottal segmentation, and FP techniques. Section 5 introduces the several clinical and voice research works that make use of glottal-gap segmentation and FP approaches. We conclude with a discussion, pointing to future research directions and open problems related to glottal-gap segmentation and FP representation.

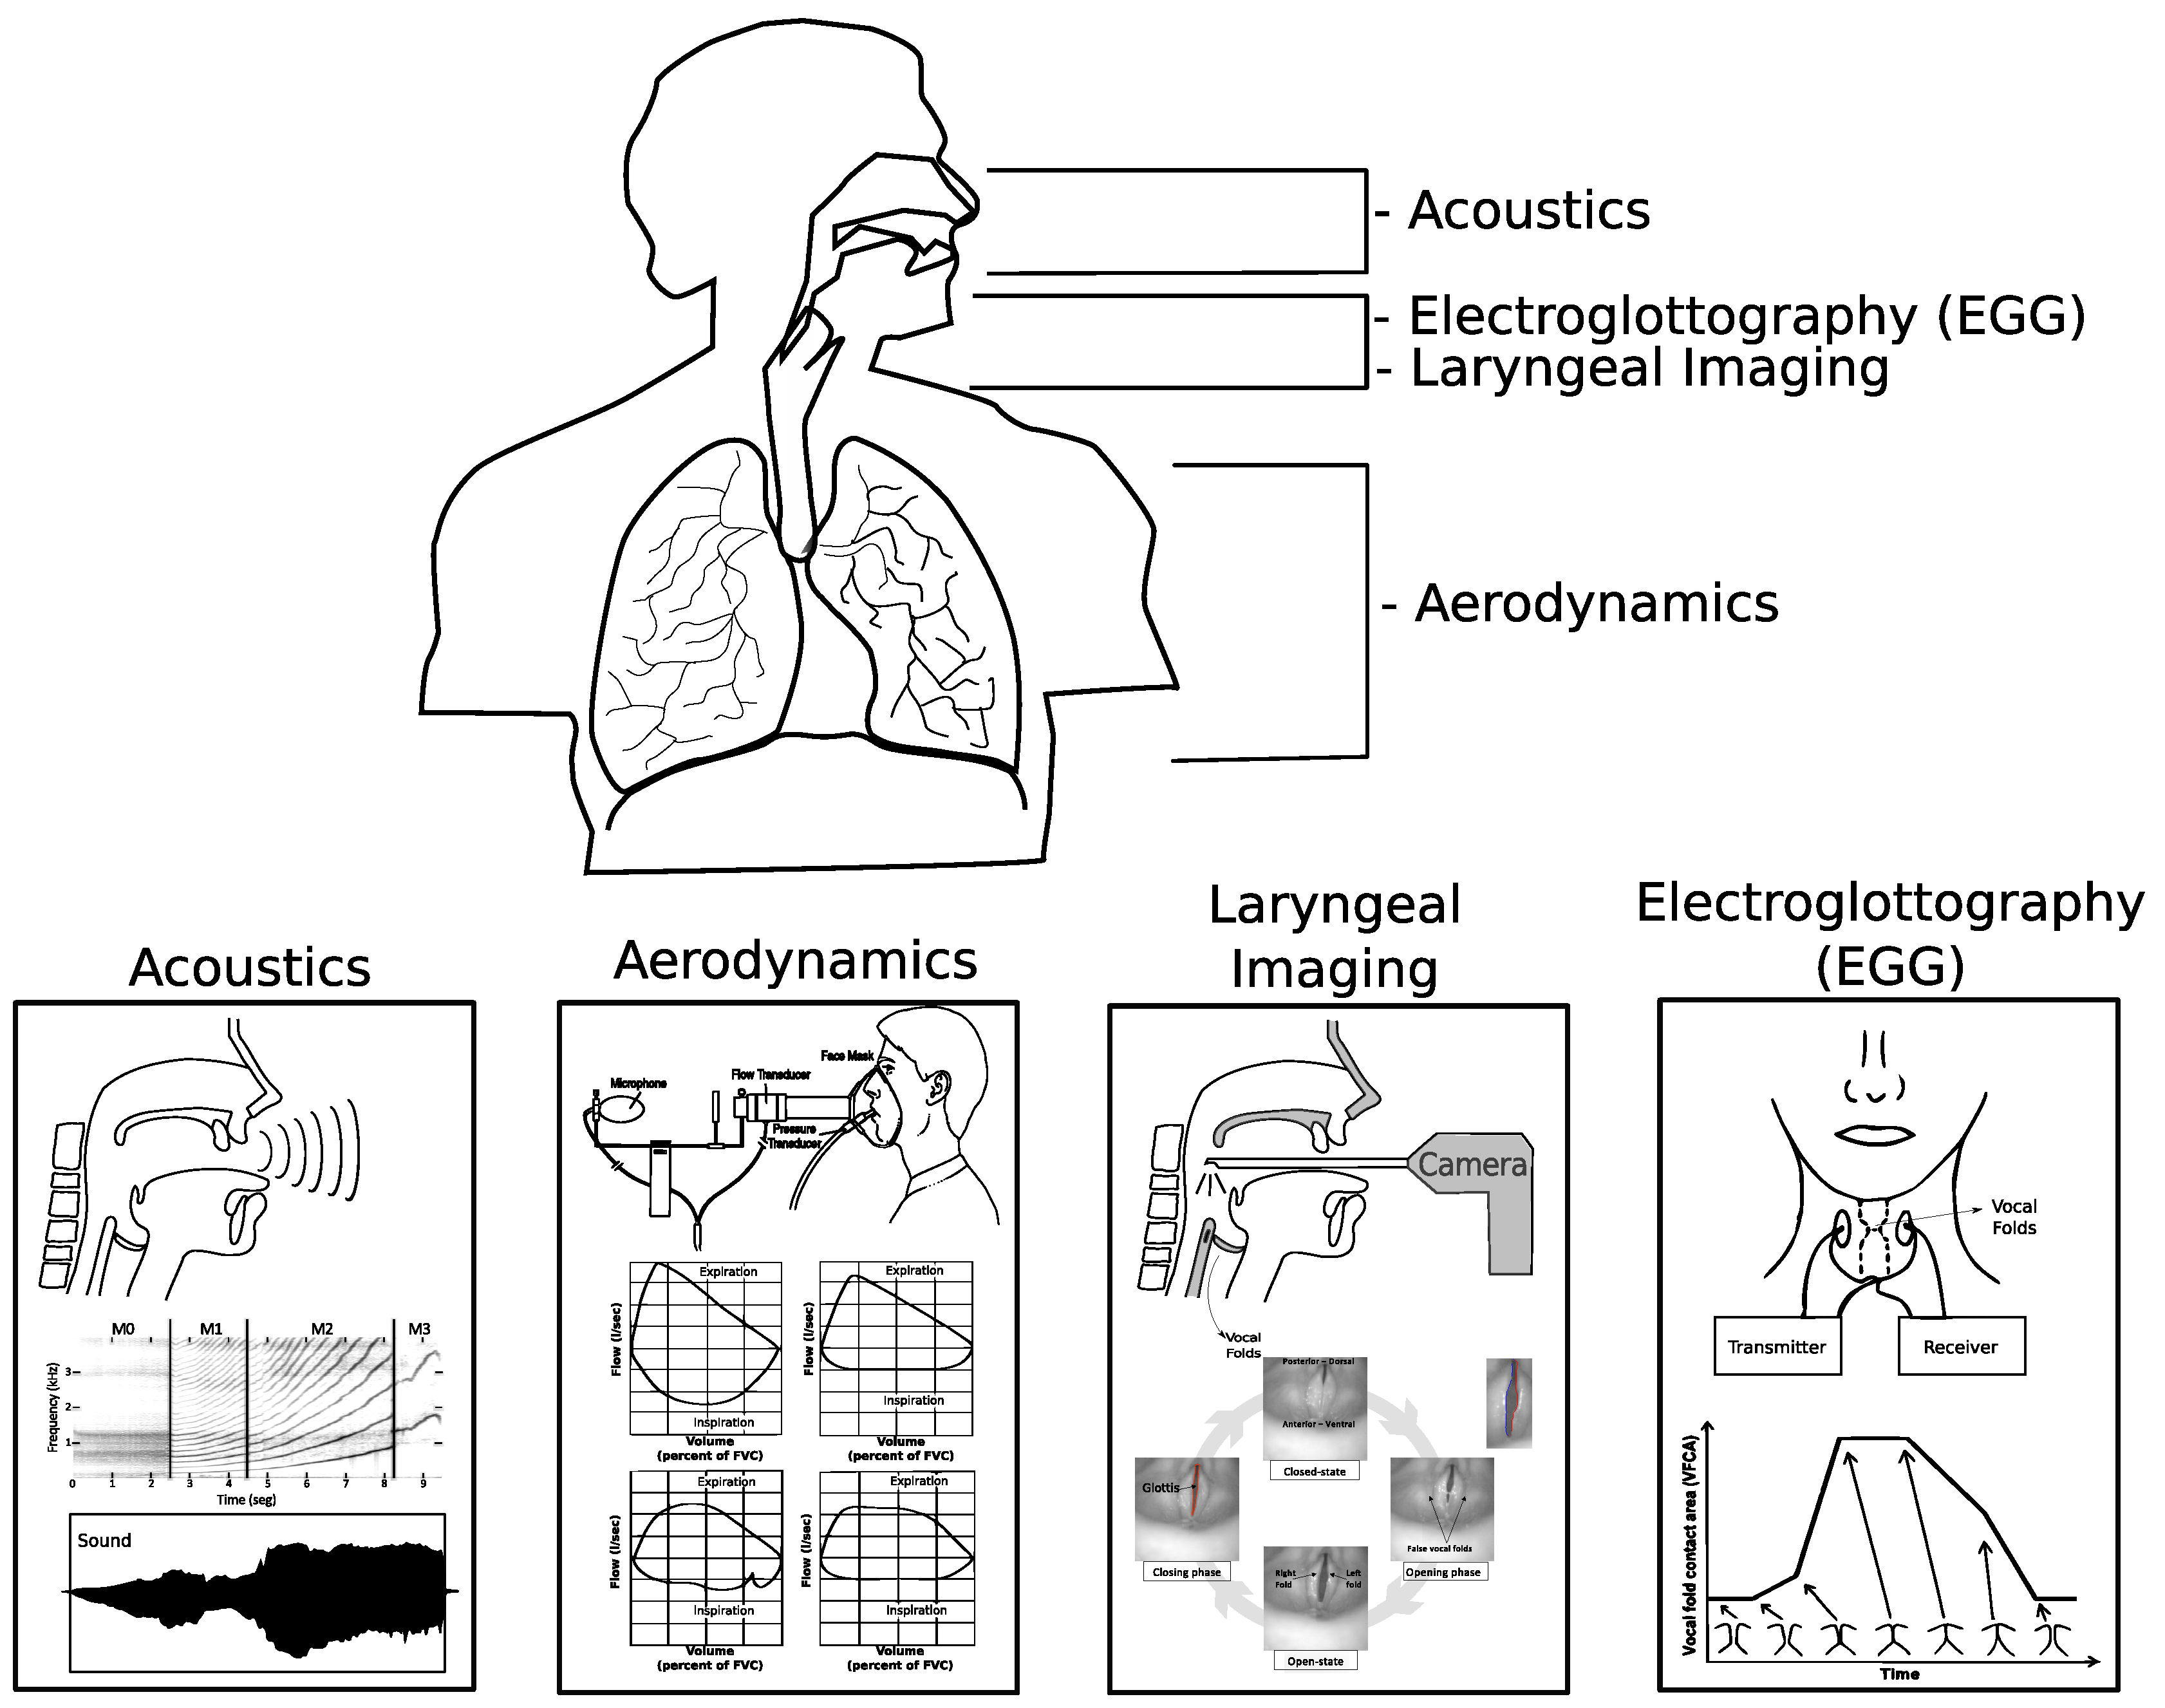
2. Laryngeal Image Modalities

Current laryngeal image modalities include Laryngeal VS, Videokymography (VKG), High-Speed Digital Kymograghy (DKG) and Laryngeal HSV. However, there are new modalities that emerge for analyzing the vocal folds dynamics [22] and also devices for 3D visualization of the vibration of vocal folds superior margins [23,24,25,26]. This paper is focused on two laryngeal image modalities: VS and HSV.

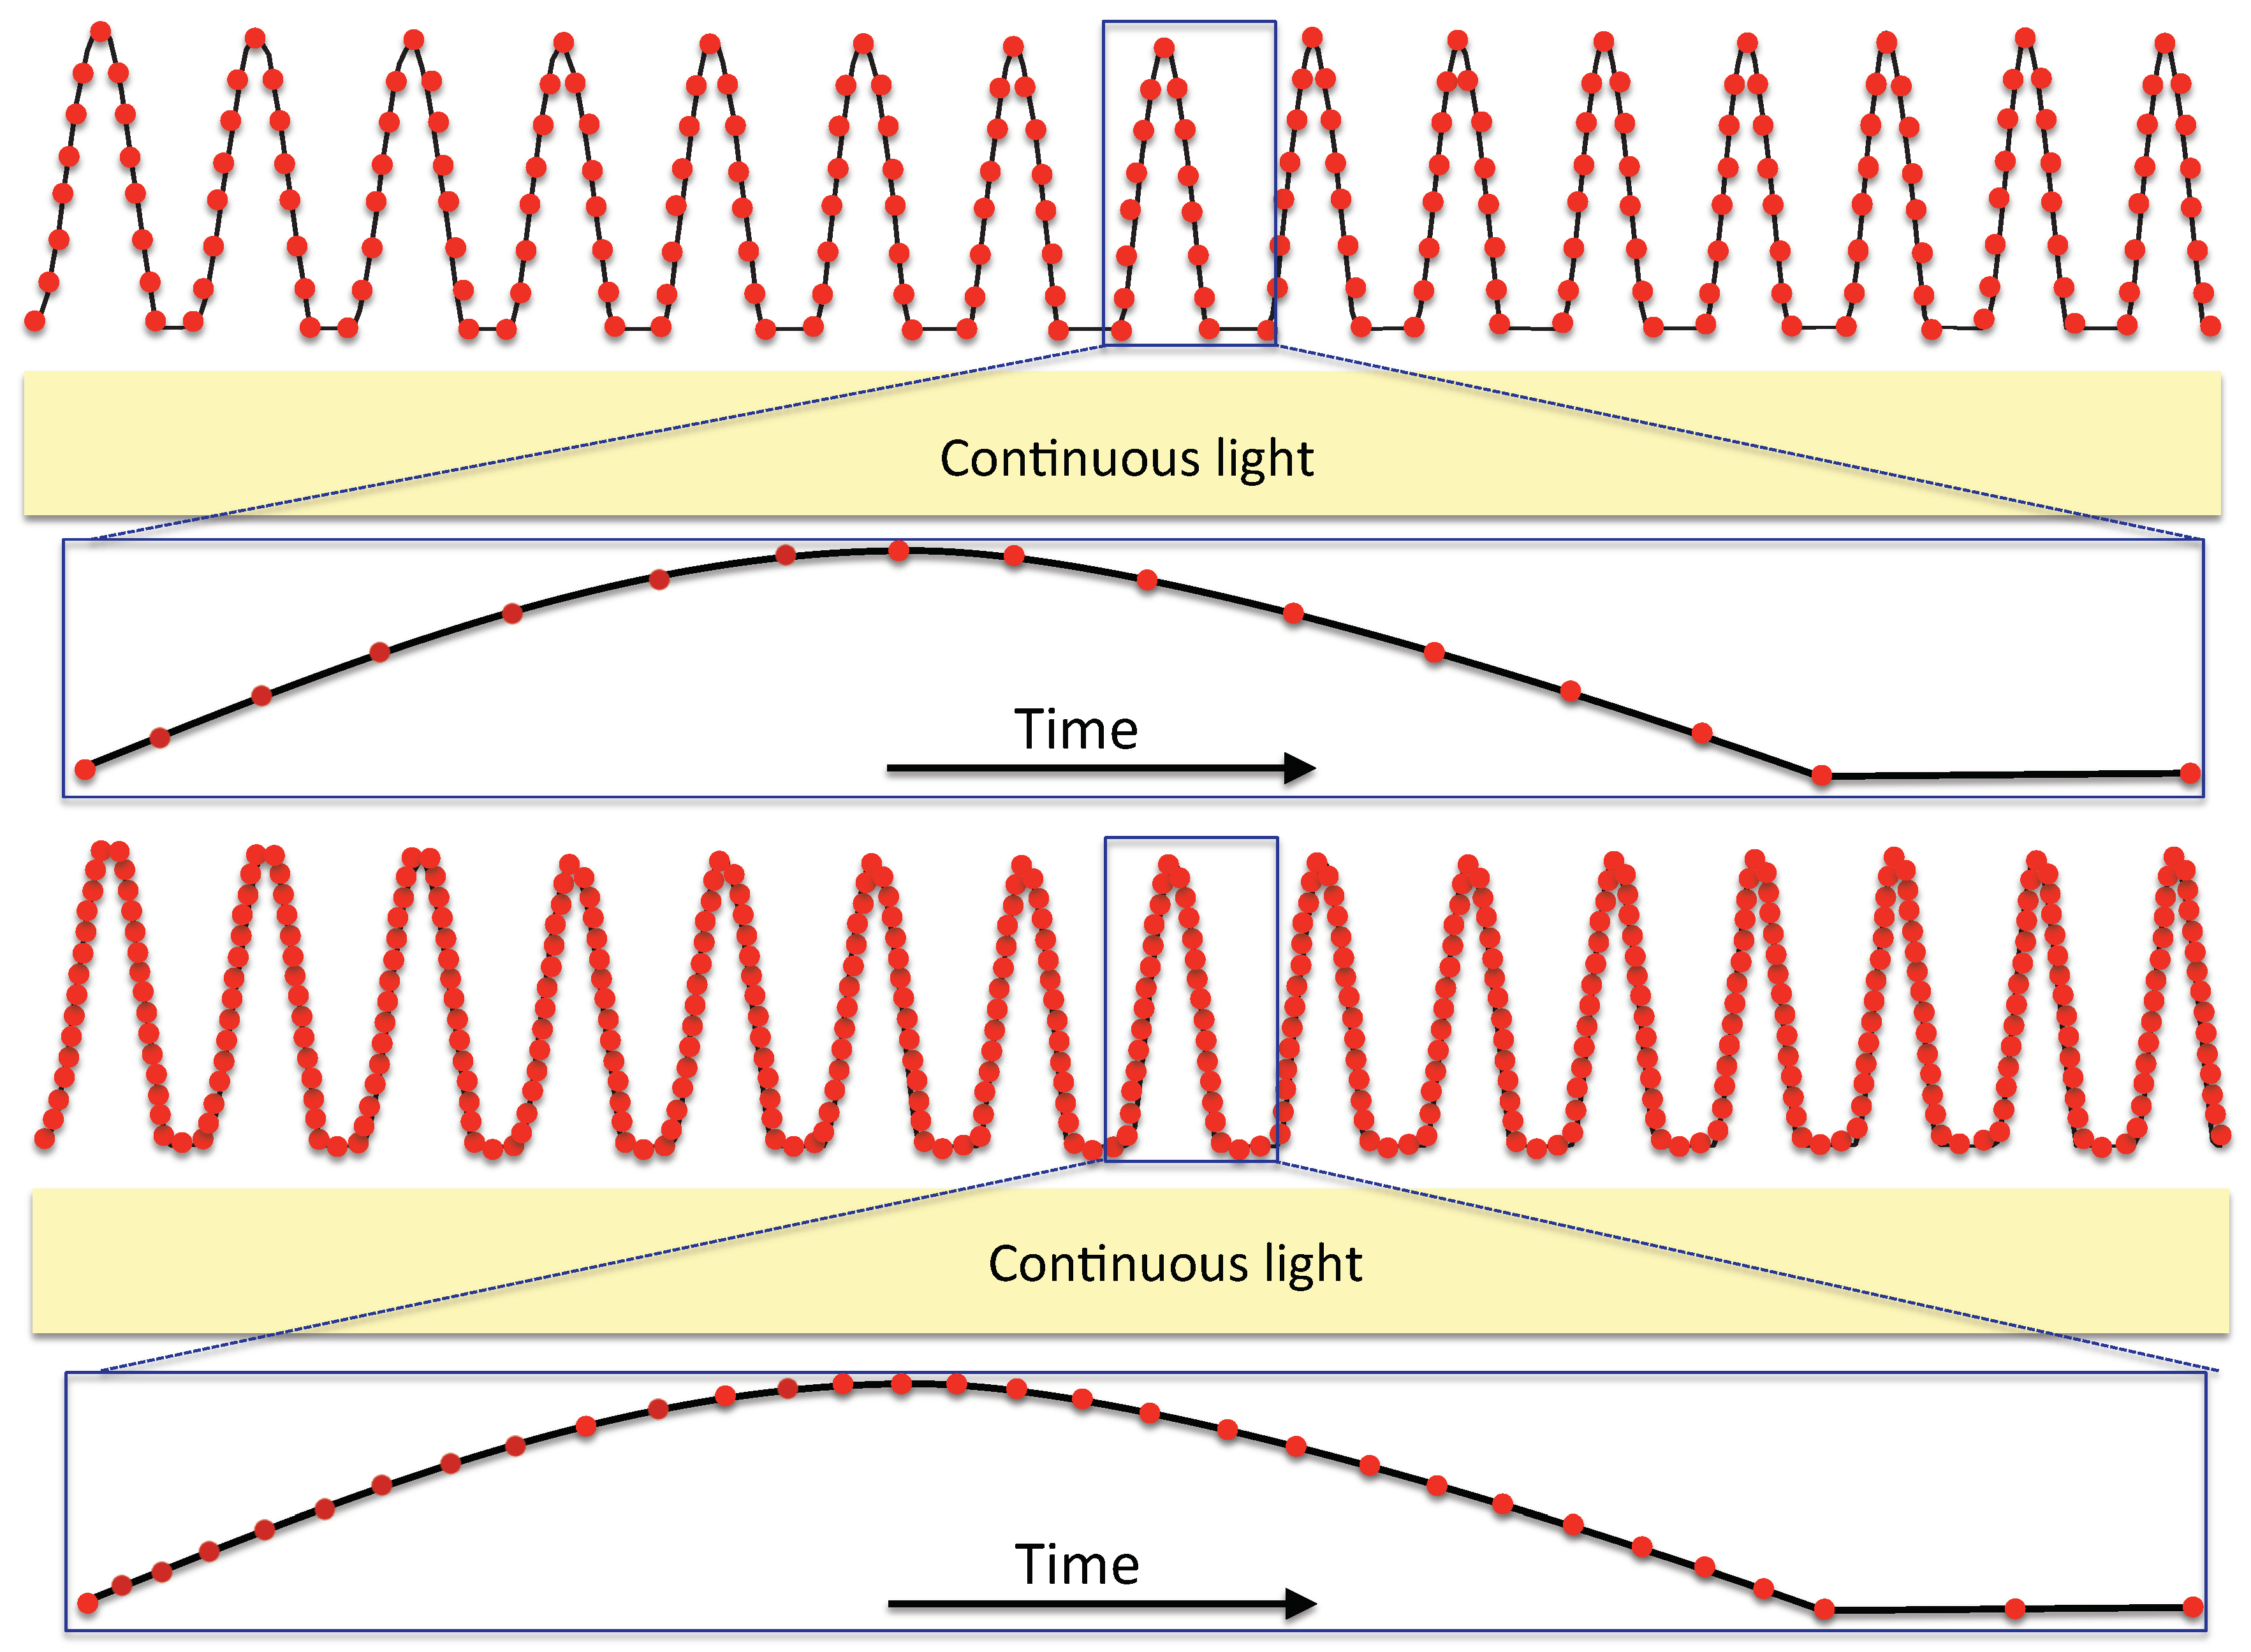
2.1. Laryngeal Videostroboscopy

During phonation, the vocal folds vibrate at a rate faster than can be perceived by the human eye. Therefore, the use of techniques to create an apparent slow-motion view of the periodic vibratory cycles has been necessary. The process to record an VS involves the use of a video camera attached to a rigid (transoral) or flexible (transnasal) endoscope where the illumination is provided by a strobe light that flashes at a rate that is synchronized with the patient’s fundamental frequency during sustained vowel production. Therefore, VS is an estimated version of the vibration of the vocal folds that is acquired by sampling its motion.
Figure 2 illustrates the complete procedure to record a VS. (1) and (3) represent the endoscope used to capture the vocal folds motion: rigid (90°) and flexible, respectively; (2) represents the vocal folds; (4) is the real vibratory pattern of the vocal folds; (5) is the stroboscopic light; and (6) is the estimated slow motion version of the vocal folds vibration. Some of the advantages and limitations of Laryngeal Videostroboscopy are mentioned [18] below:

2.1.1. Advantages

  • It can be used with Distal Chip Laryngoscopy (DCL) and Flexible Fiberoptic Laryngoscopy (FOL) [28] during articulated speech and singing. DCL is identical to FOL regarding diagnostic accuracy, but DCL is superior to FOL in image quality and interrater reliability. Despite flexible endoscope optics have lower quality than a rigid endoscope, it is possible to obtain an image quality comparable to the rigid laryngoscope using DCL [29,30].
  • It can be coupled with high-definition cameras, providing a higher spatial resolution of the vocal fold structures involved in phonatory vibration (e.g., mucosa, superficial vasculature, etc.) [18]. The High-Definition Digital Stroboscopy System by KayPENTAX Model 9310HD, for example, records interlaced video frames with a spatial resolution of 1920 × 1080 full-HD letting real-time viewing of exam video in uncompressed HD. 4K video format with a spatial resolution of 3840 × 2160 pixels has been tested in VS. Despite the fact that its clinical implementation is feasible, its usefulness must be proven [31].

2.1.2. Limitations

  • It does not provide a real view of the vocal folds’ vibratory pattern, so it is restricted to stable and periodic vocal folds vibrations. Therefore, VS is incapable of revealing vocal fold vibratory patterns in patients with severe dysphonia [32]. In addition, VS limits scientific and diagnostic knowledge of the vocal function during voice onset and voice offset.
  • It is more sensitive to camera rotation, side movement of the laryngoscope and patient movements which produce the vocal folds delocation [33,34].

2.2. Laryngeal High-Speed Videoendoscopy

HSV has revolutionized laryngeal imaging, increasing the understanding of glottal dynamics during the phonation process [17]. HSV is the only technique able to acquire the true intra-cycle vibratory behavior, allowing the study of cycle-to-cycle glottal variations. In HSV, images are sampled constantly due to the use of a continuous light source. No information is lost between frames. Lastly, image sequences can be slown down to frame rates that can be perceived by the human eye.
Nowadays, due to the fast-growth of high-speed technology, it is possible to find cameras that can reach frame rates over 20,000 Frames per Second (fps), recording in color with high spatial resolution and excellent image quality for long-duration recording times. With respect to the minimum frame rate requirements of HSV for clinical voice assessment, frame rates of 8000 fps are recommended with a minimum requirement of 4000 fps [35,36]. For HSV recordings at rates below 4000 fps for women and 3200 fps for men, the videos have to be interpreted with caution.
Figure 3 illustrates the principle of sampling in HSV for two different frame rates. It can be observed that every single cycle is sampled, in contrast to VS where the samples are taken from different cycles (see Figure 2). Some of the advantages and limitations of HSV are detailed below [4,14,27]:

2.2.1. Advantages

  • It captures the true intra-cycle vibratory behavior of the vocal folds, providing a more reliable and accurate objective quantification of vocal-fold vibrations. Therefore, it is possible to study aperiodic movements of vocal folds observed in some voice disorders [4,37].
  • The combination of HSV with acoustics and other physiological signals may provide complementary, high-precision measures that can improve the clinical practice [38,39].
  • It is used to examine the basic physiology of different singing styles, such as extremely high-pitched singing, throat singing, or different pop and rock styles [40], and to study the oscillatory characteristics of the vocal folds across classical soprano and tenors singers [41,42].
  • It is useful to get insights into tissue vibratory characteristics, influence of aerodynamical forces and muscular tension, vocal length, phonatory breaks, laryngeal spams, vocal folds contact and evaluation of normal laryngeal functioning in situation of rapid pitch change such as onset and offset of voicing or glides [5,43].

2.2.2. Limitations

  • Due to the huge amount of data acquired, storing and visualization are great problems. For instance, 10 s recording data at speed of 10,000 fps would require 2 h and 46 min to view the whole recording at a speed of 10 fps [4,27].
  • It is not possible to provide real-time audiovisual feedback due to the high temporal resolution of HSV. However, it is possible to align HSV with acoustics and EGG signals to provide more precise measures that can improve clinical diagnosis.
Figure 4 illustrates the procedure used to study the vocal folds motion based on laryngeal image processing techniques. Glottal gap segmentation and the FP (third and fourth row in Figure 4), have been extensively used in HSV and VS to simplify the visualization of the vocal folds dynamics and to provide objective parameters to accurately identify the presence of organic voice disorders [44,45], classify functional voice disorders [46,47], vibratory patterns [48,49], discriminate early stage of malignant and precancerous vocal folds lesions [50], among others [7,39]. Despite the progress achieved to describe the vocal folds dynamics using laryngeal image-processing, the task is still challenging and poses a difficult computer vision problem.

3. Glottal Gap Segmentation and Facilitative Playbacks

Laryngeal imaging techniques have been used to study the complex interaction of vocal folds structures [51,52], tissue mechanics [6], muscle contraction [53], voice treatment effects in Parkinson’s diseases [54] or to objectively characterize voice disorders [7,39]. Therefore, Section 3.1 introduces the two most widespread image-processing methods used for glottal gap segmentation and FP representation. Numerous works are described in Section 3.2, using a single or a combination of image-processing methods for image enhancement, Region of Interest (ROI) detection, and glottal gap delimitation, respectively. Lastly, Section 3.3 presents the literature related to the FP representations.

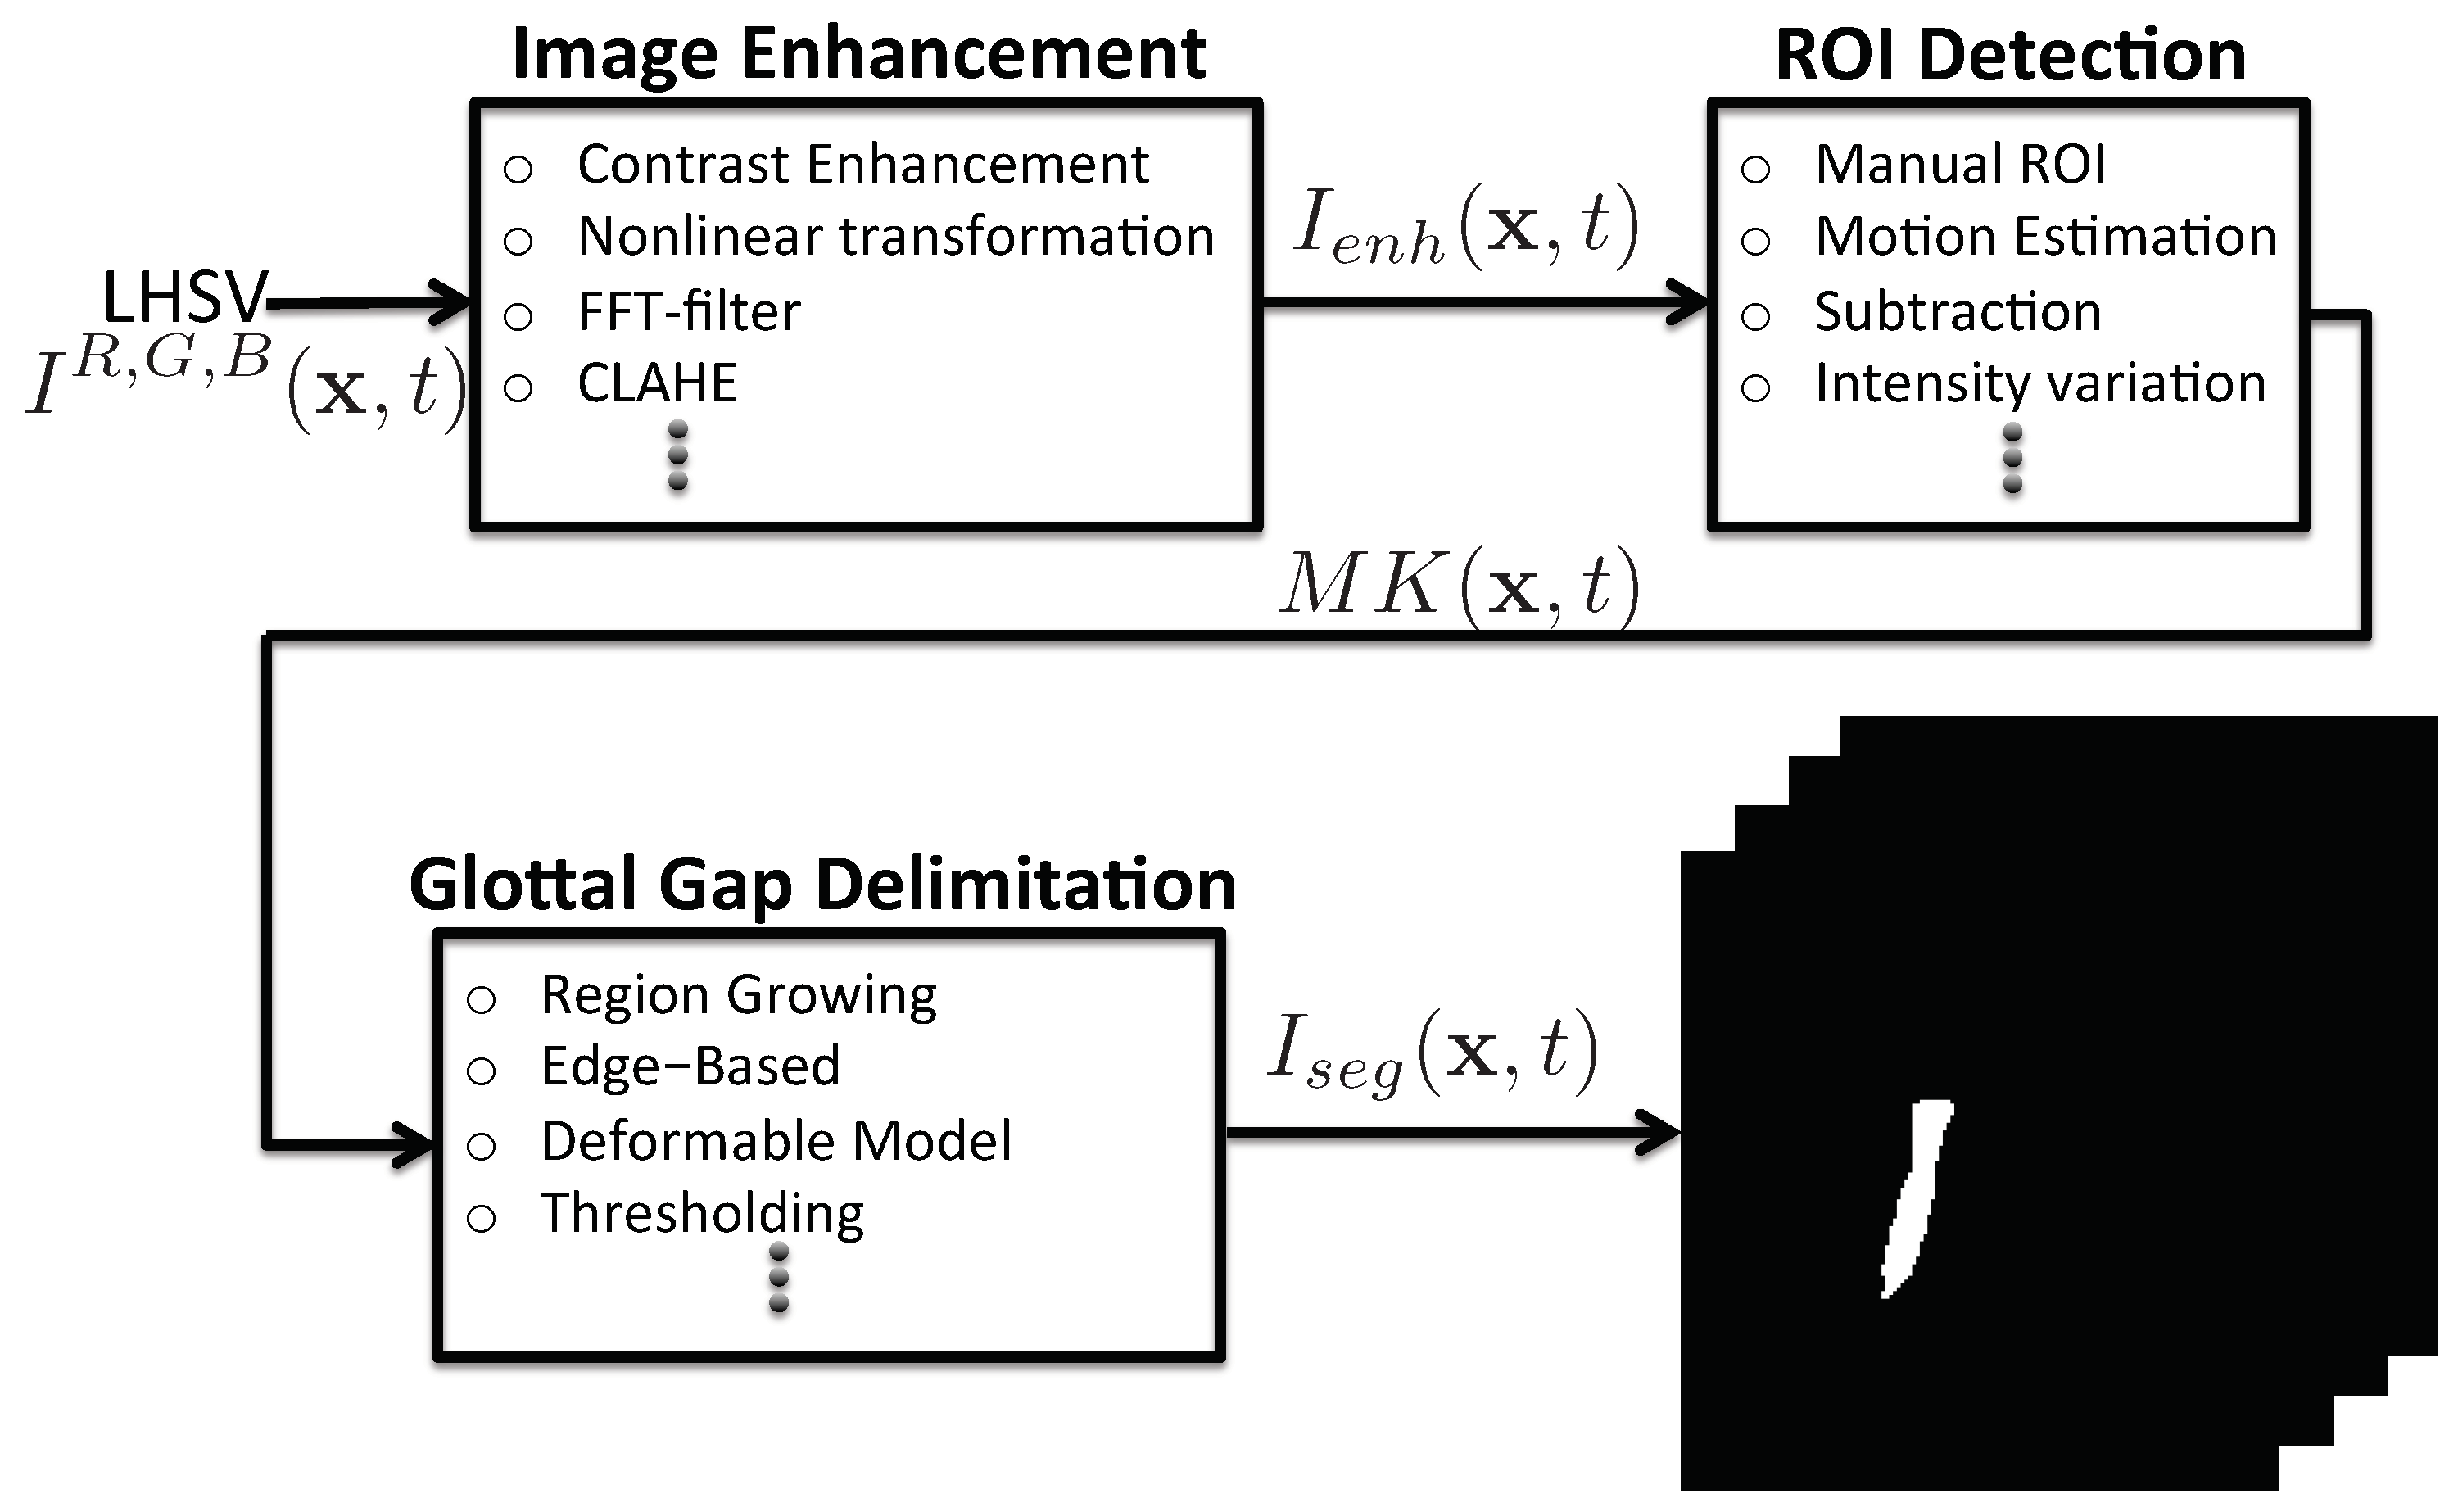
3.1. Image-Processing Methods

The image-processing methods refer to a set of operations on an image, in order to get an enhanced image or to extract some useful information from it. It is a type of signal processing in which input is an image and output may be image or characteristics/features associated with that image. Let us denote a laryngeal image sequence as I ( x , t ) , where x = ( x , y ) R 2 represents the position of the pixels and t represents the time instants of the sequence. Hence, a single frame at instant t k , k = { 1 , 2 , , N } , is denoted as I ( x , t k ) . Therefore, the intensity of a given pixel x i j = ( x i , y j ) , i = { 1 , 2 , , n } and j = { 1 , 2 , , m } , at time t k can be defined as I ( x i j , t k ) R , which represents a pixel in gray-scale. For a color image sequence, the components can be represented by superscripts. For instance, in the RGB space, the image sequence is denoted as I R , G , B ( x , t ) , where R, G, and B are the three components of the space. For single images that do not belong to an image sequence, the notation is simplified to I ( x ) or I ( x , y ) for gray-scale images and I R , G , B ( x ) or I R , G , B ( x , y ) for images in the RGB space. Figure 5 summarizes graphically the notation for a gray-scale laryngeal image sequence.
Two of the most common tasks in image-processing are: image segmentation and motion estimation. The first one subdivides an image into its constituent regions or objects and the level of detail of each subdivision depends on the problem being solved [55]. The image segmentation methods can be classified, roughly speaking, into the following categories: thresholding [56], edge-based [57], region-based [58], classification-based [59], graph-based [60,61] and deformable models [62]. Meanwhile, the motion estimation algorithms precisely and faithfully model the motion in the scene which is typically represented using motion vectors, also known as vector displacements. The motion estimation techniques can be grouped into pixel based methods (direct) and feature based methods (indirect). The direct methods derive motion vectors for each pixel in the scene and can be categorized in Phase Correlation [63,64], Block Matching [65,66], Pel-Recursive [67,68], and Optical Flow (OF) [69]. On the other hand, the indirect methods use features matching between frames to compute the motion vectors [70].

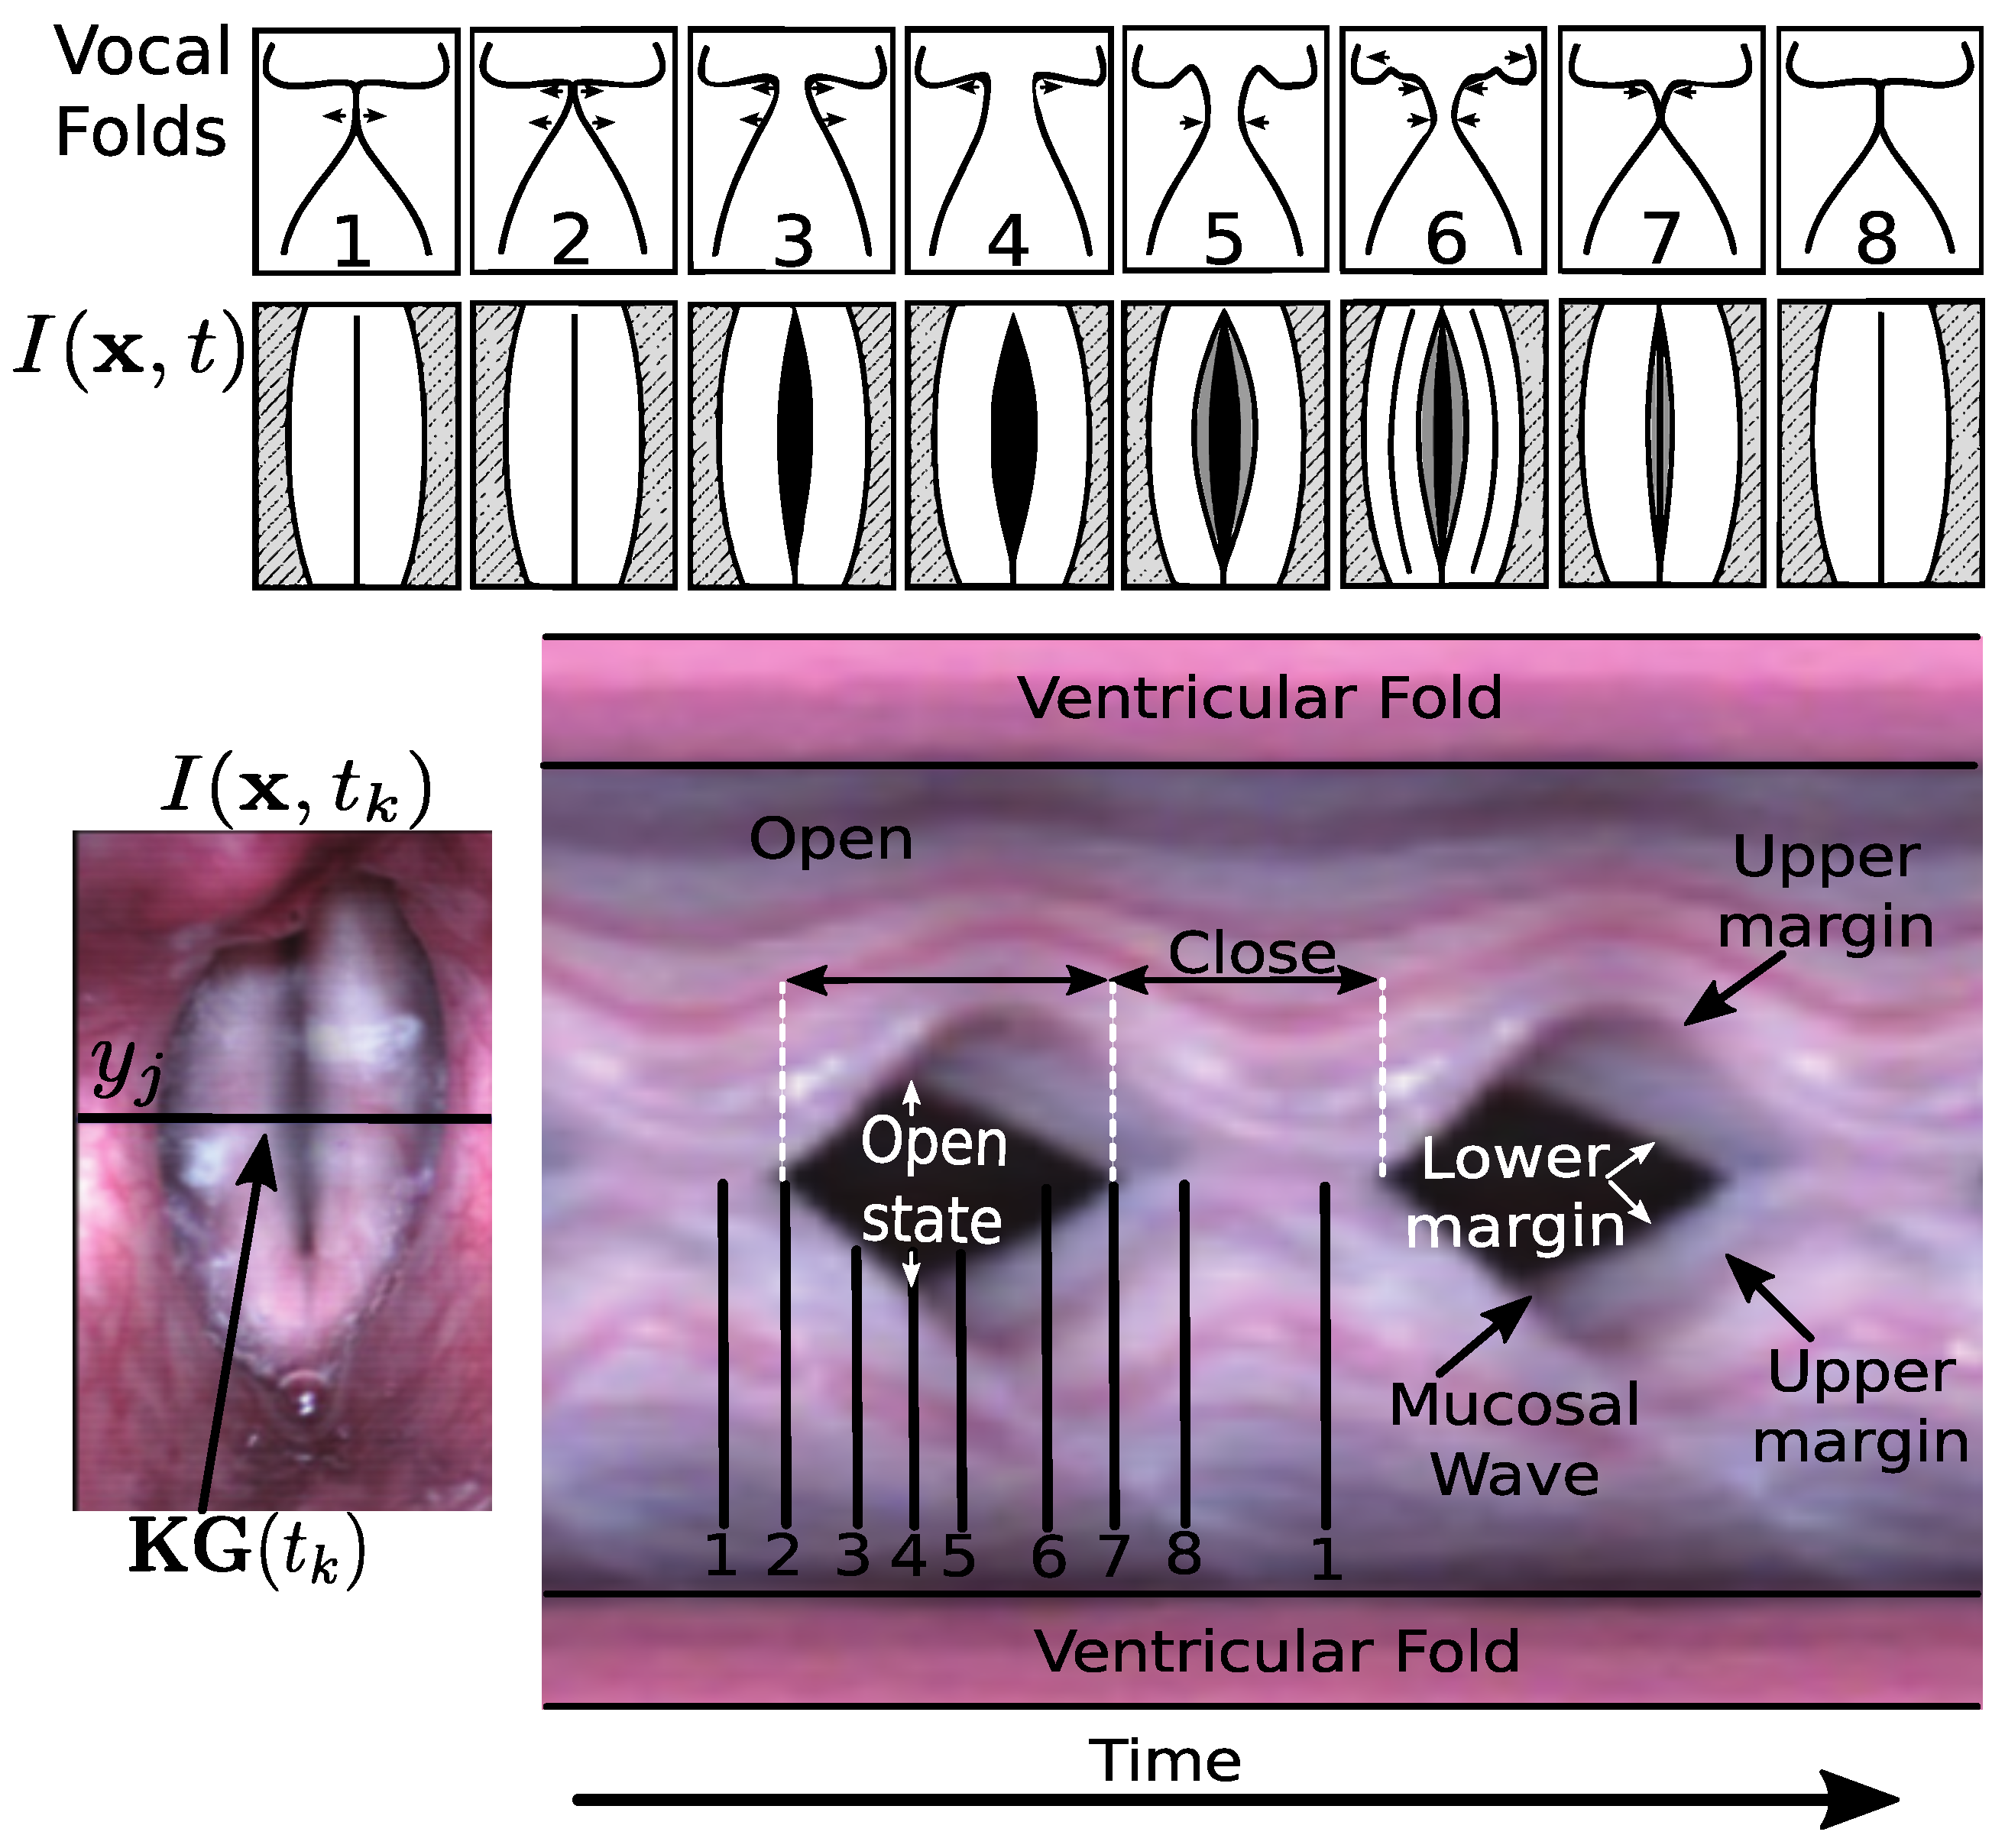
3.2. Glottal Gap Segmentation Techniques

The literature reports different techniques for the glottis segmentation task depending on the user intervention. They can be grouped in semi-automatic and automatic approaches. The semi-automatic techniques let the user interact as many times as needed in order to solve any inconvenience that might appear during the segmentation process. On the contrary, the automatic techniques process all the data without any previous setting or any user intervention. From a clinical point of view, both methods present advantages and disadvantages but it is worth mentioning that semi-automatic methods are more time consuming for the clinicians, although their accuracy is expected to be better.
In semi-automatic segmentation, the users select an arbitrary set of images within the video sequence. These frames are representative cases of the glottal cycle, for instance, maximal glottal opening [71] or minimal glottal opening [72]. Later, the user selects one or multiple seed-points belonging to the glottal area [73,74]; the posterior and anterior commissures of vocal folds [71,75,76,77]; or a region of interest (ROI) that includes the glottal gap area [11,78]. Lastly, thresholding, region growing or active contours techniques are used to compute the glottis segmentation. A summary of the main semi-automatic algorithms contributions is presented in Table 1.
With regard to the automatic segmentation, only a few of the existing approaches are designed to be fully automatic [87,88,89,90]. However, in the last few years, the fully automatic glottal segmentation has become an active research field with growing interest [91,92,93,94,95,96]. Up to now, there is no standardized procedure to automatically segment the glottal gap from endoscopic high-speed sequences, in spite of the extensive literature devoted to solve such a problem. Roughly speaking the authors divide the problem into three main stages: image enhancement, identification of the ROI, and glottal gap delimitation (see Figure 6). A summary of the main automatic algorithms contributions is presented in Table 2.

3.2.1. Image Enhancement

Image enhancement refers to the manipulation or transformation of an image I R , G , B ( x , t ) , with the aim of increasing its usefulness or visual appearance. There are not general criteria behind the enhancement, and often the techniques used depend on the application [55]. In laryngeal images, the glottis has darker intensity levels than its surrounding tissues. However, they often have low contrast and heterogeneous profiles due to the illumination conditions. Modelling the histogram of HSV with a statistic distribution, such as Rayleigh as in [81], or finding the darkest region, produces errors due to the non-uniform contrast of the image, lighting conditions and artifacts due to the recording equipment. For this reason, it is required to simultaneously reduce the effect of the low contrast and to highlight the object of interest (i.e., the glottis). Thus, the use of image enhancing techniques is expected to improve the characteristics of the image for a further processing. The literature reports the use of different enhancing techniques as a prior step to glottis segmentation.
In [97], the authors combine an anisotropic diffusion with an FFT-based band pass filter in order to obtain a smoother image without losing edge information (second row of Figure 7). In [83] a Lagrange interpolation is combined with a Gaussian filter in order to smooth the images, reduce noise and eliminate unwanted details. In [85], the authors use a global thresholding to obtain a binary image to eliminate the worthless information. However, this strategy can not be generalized for noisy and poor quality HSV recordings.
Another alternative is to manipulate the histogram of the image. The most common histogram based processing techniques are the Histogram Equalization (HE), Adaptive Histogram Equalization (AHE), Contrast Limited Histogram Equalization (CLHE) and the Contrast Limited Adaptive Histogram Equalization (CLAHE). CLAHE is used in [90] providing more details in the glottal area while avoiding significant noise introduction (third row of Figure 7). CLAHE highlights the details over a small neighborhood preventing the over amplification of noise that can arise from adaptive histogram equalization AHE.
In [91] the intensity of HSV is model as the product of an illumination function by a reflectance function. The illumination is estimated by temporally averaging the intensity for each pixel location in the glottis and the reflectance is obtained by dividing the image intensity into the illumination function. The reflectance distribution has a bimodal structure which is used by the authors to threshold HSV.
One of the most widespread methods is based on point-wise intensity transformations. The point-wise transformation operates directly over the intensity values of an image, processing each pixel separately and independently. This transformation can be linear, piecewise linear, or nonlinear. Reference [99] establishes a methodology for pre-processing VS as a preliminary step for edge detection. The authors mention the drawbacks that exist in the acquisition due to the flashing effect at the recording instants, reducing the accuracy of the segmentation algorithm. The same procedure is used in [82] to highlight glottal area and to reduce influence of flashes in HSV.
Considering the increasing use of deep learning techniques in medical image processing, an implementation of a Convolutional Neuronal Network (CNN) to enhance the low-light HSV is proposed in [106]. The training data include dark frames created by adding Perlin noise to the HSV and data augmentation to increase the number of videos to train.
The quality of the laryngeal videos has a critical impact on an accurate diagnosis, examination, and identification of lesions or tissue changes [4]. Sequences with low quality are inadequate for quantitative analysis, reducing the amount of data available for research. Furthermore, current HSV technology requires special hardware and is particularly susceptible to image degrading factors. Figure 7 depicts some examples of the enhancement methods used in the state of art for the glottal gap segmentation.

3.2.2. Region of Interest

A ROI is a part of the image that encapsulates important features that can be used for further analysis. ROI detection has been studied for many years. Most algorithms use either feature-based or object-based approaches. Feature-based methods find pixels that share similar features to form the ROI. Meanwhile, object-based methods detect the ROI at a higher level than the pixel-by-pixel approach of feature-based systems using information such as target shape or structure. Figure 8 depicts some examples of ROI detection in six different HSV sequences using the algorithm presented originally in [107] and extended in [94].
The literature devoted to solving the glottal gap segmentation reports attempts to detect a ROI. However, most of the studies require user intervention [75,77,78,80,81,83,85] and, even more important, few works take into account the temporal information of the sequence. Some approaches assume that a previous frame segmentation is available. Then, the pixels values are set to 1 when the difference between the current frame and the previous one is larger than a fixed threshold [82]. A similar strategy has been implemented in [72], which apply an algorithm based on differences between consecutive frames. Other works [11,97,98] use motion estimation techniques to compute the ROI based on the fact that the region with the most salient motion features corresponds to the vocal folds.
In [90], an edge-based morphological approach is used to process some frames extracted from HSV, called keyframes. They search the object with the larger and nearly vertically oriented area by applying a Sobel filter. Lastly, a morphological closing operation is carried out over the gradient map to connect small related regions and the object with the largest area and vertical orientation is chosen. In [91,94] a criterion based on the time change of the spatial intensity profile is used to detect the ROI for a fixed set of frames. The squared area to be tracked is selected adaptively based on the variations of the image intensity and the inter-frame disparity for an appropriate set of frames. By taking advantage of the continuous light source used in HSV, the area with the largest variability in time is identified as the glottis region. However, this approach presents drawbacks in cases as phonation onset, offset and total or partial paralysis of the vocal folds.
In laryngeal images, the vocal folds, and so detected ROI, usually covers less than 25% of the entire image size. Therefore, the ROI detection permits to eliminate the non-relevant information and reduces the number of false detections, so it is an important step to be considered prior to the segmentation process.

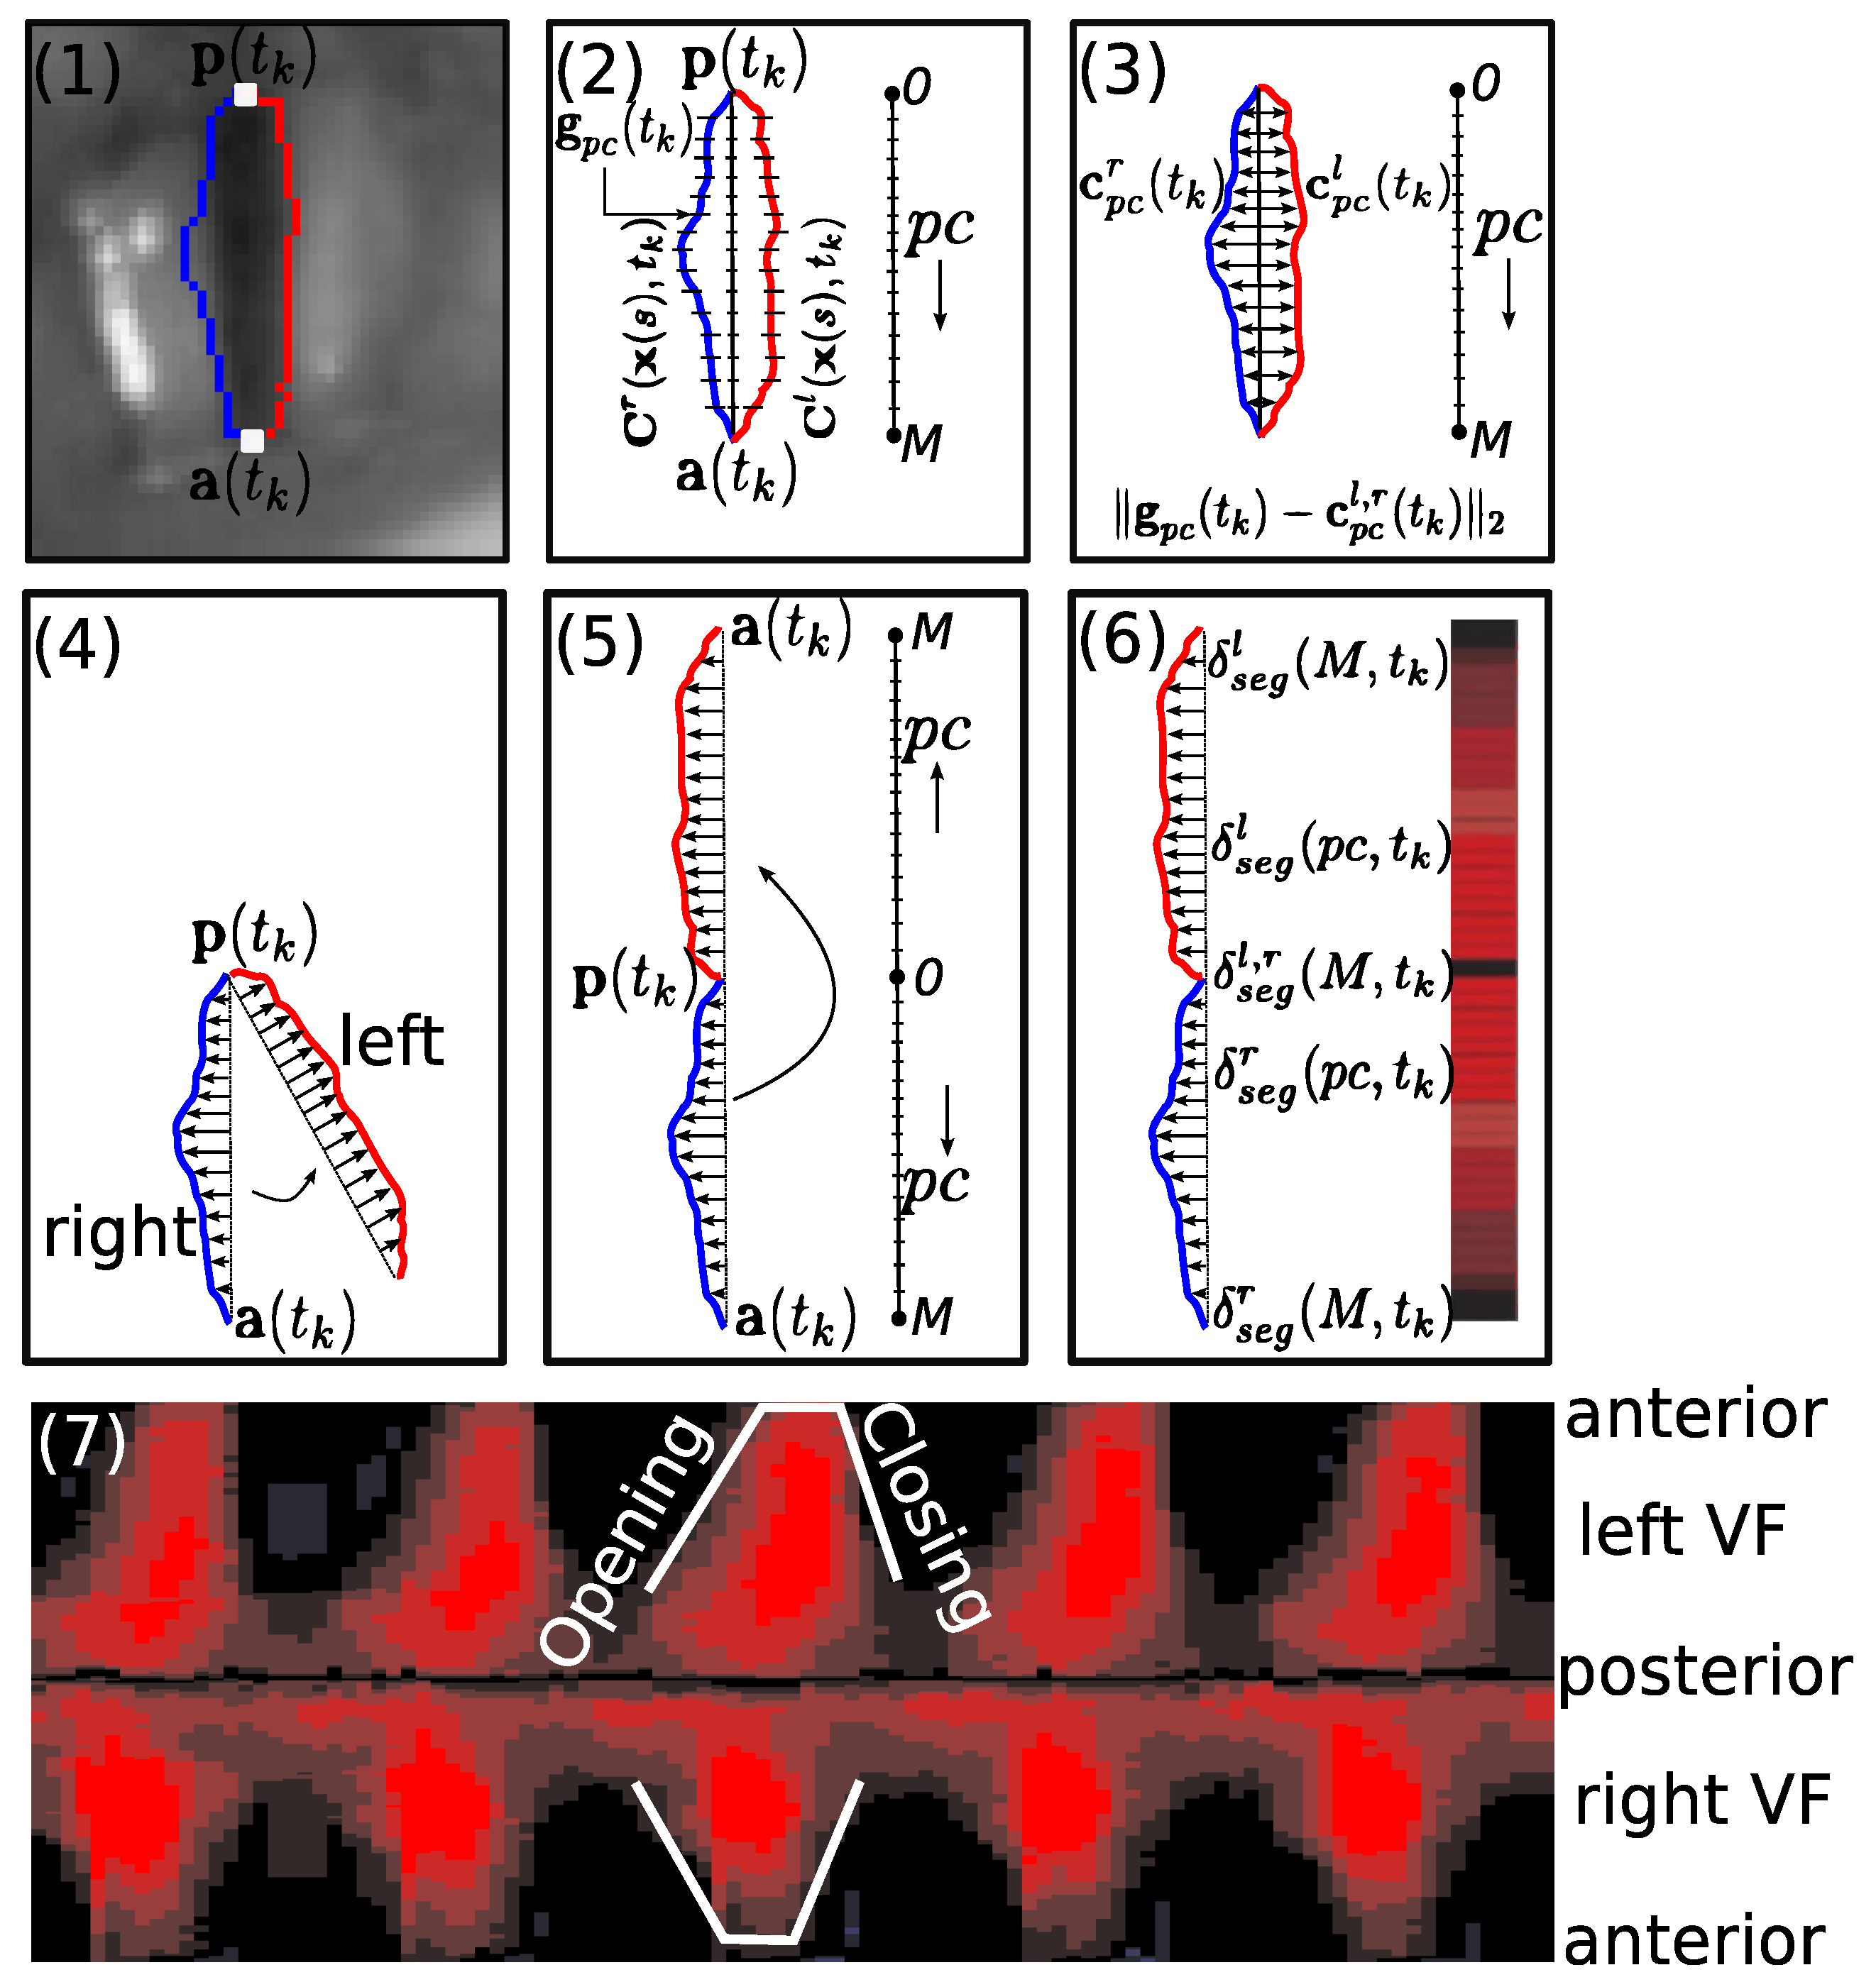
3.2.3. Glottal Gap Delimitation

The image segmentation methods can be classified, roughly speaking, into the following categories: thresholding, edge-based, region-based, classification-based, graph-based and deformable models. With respect to the glottal gap delimitation, the most common approaches are based on thresholding, region growing and deformable models (parametric and geometric).
The studies based on thresholding assume that the glottis has darker intensity levels than the vocal fold tissues [71,81]. However, the laryngeal images often have low contrast and heterogeneous profiles. Hence, selecting a global threshold results in an erroneous delimitation of the glottal gap, since the intensity distribution is not bimodal. The studies based on region growing require a solid criterion for the seed selection and relatively well-delimited edges in order to converge towards the glottal gap. Furthermore, the algorithms segment objects with inhomogeneous regions into multiple sub-regions, resulting in over-segmentation [73,74]. With respect to the deformable models, they have the advantage to couple appropriately to non-rigid and amorphous contours by an iterative minimization of an energy function. However, the initialization process is not a trivial task. Therefore, many authors use manual procedures to initialize the active contours [77,78,80].
There are other approaches that combine different image-processing techniques [75,86,89,91,94,97], use feature extraction and training [95], or make use of more recent paradigms such as Deep Neural Networks [96]. For instance, [89] present an automatic glottis segmentation approach using deformable shape models and region growing. The approach starts with an initial coarse segmentation by means of the Region Growing technique. The seed points are determined based on a simple linear relationship between the average gray level of the image and the optimal seed points obtained from the training examples. Lastly, the non-glottal regions are eliminated using the reliability score factor from the trained shape models.
In [86] the textures of the background (laryngeal structures) and foreground (glottal gap) are smoothing. Then, the glottis is detected based on the temporal intensity variation of laryngeal videos and segmented using a background subtraction method. In [95], a fully automatic method is used to segment the glottis using local color and shape information. The approach is divided into three modules: training, recognition and segmentation. In the training, 60 different glottis shapes are manually segmented, and a set of descriptors are computed. The recognition module is designed to recognize, delineate and determine the optimal starting glottis regions. The last module segments the glottis based on properties of the previous frame. Hence, the glottis is continuously tracked within vibration cycles of the video by a frame-by-frame-wise segmentation technique.
In [96] a Deep Neural Network is implemented to segment the glottal gap in VS. The glottis color structure and its neighboring color pattern are employed to create the features vectors. Then, these vectors are used to train the network and classify whether each pixel belongs to the glottal region or not.
One of the most extended methods to perform glottal gap segmentation is presented in [73]. The advantage of the method lies in its semi-automatic characteristic since the wrong detection of the glottal gap can be fixed during the segmentation process. An open-source version of this algorithm called “GlottalImageExplorer” is available in [108]. With a friendly interface, the tool lets the user enter three threshold points, which define the threshold progression for the seeded region growing, and the threshold progression is defined by the linear interpolation between the threshold points.

3.2.4. Assessment of Vocal Folds Segmentation

Assessing the glottal segmentation is not trivial due to the huge amount of frames to evaluate and the need to take into account the spatial-temporal information of the video sequences. The evaluation is even more complicated having in mind that there are neither standard metrics to evaluate the distinct algorithms nor public databases that could be used for benchmark and comparison purposes [109].
A simple way to evaluate the glottal segmentation is by visual inspection. However, it requires a frame by frame intensive evaluation over a large set of images, including the contribution of several experts to minimize the inter evaluation bias. The literature proposes subjective ways to evaluate the segmentation by grading the quality of the glottal gap delineation from 0 to 5 points [73,90,99]. A more complete evaluation combines segmentation quality, readability of the playbacks (GVG, PVG, GAW) and shape similarity between VFT and VKG [86].
The literature also refers to different objective evaluations to compare the segmented image against a Ground-Truth (GT). The degree of similarity between the human and machine-generated images determines the quality of the segmentation. Among the most extended metrics used to evaluate the glottal gap segmentation are: Dice Coefficient (DICE), Mean Square Error (MSE), Accuracy (ACC), Mean Area Error (MAE), object-level consistency error (OCE), Pratt, F-measure(F-M), True negative rate (TNR), Pixel Error Rate (PER), Overlapping ratio (OR), Rand Index (RI), Mutual Information (MI), Cohen Kappa coefficient (KAP), Intersection Over Union (IOU), Hausdorff distance (HAD) and Adjusted Rand Index (ARI) [74,86,88,90,93,94,95,96,100]. The main drawback of objective evaluation is to manually generating a ground-truth since it is a subjective and time-consuming task. Table 3 summarize the main studies carried out to objectively and subjectively assess the vocal fold segmentation.

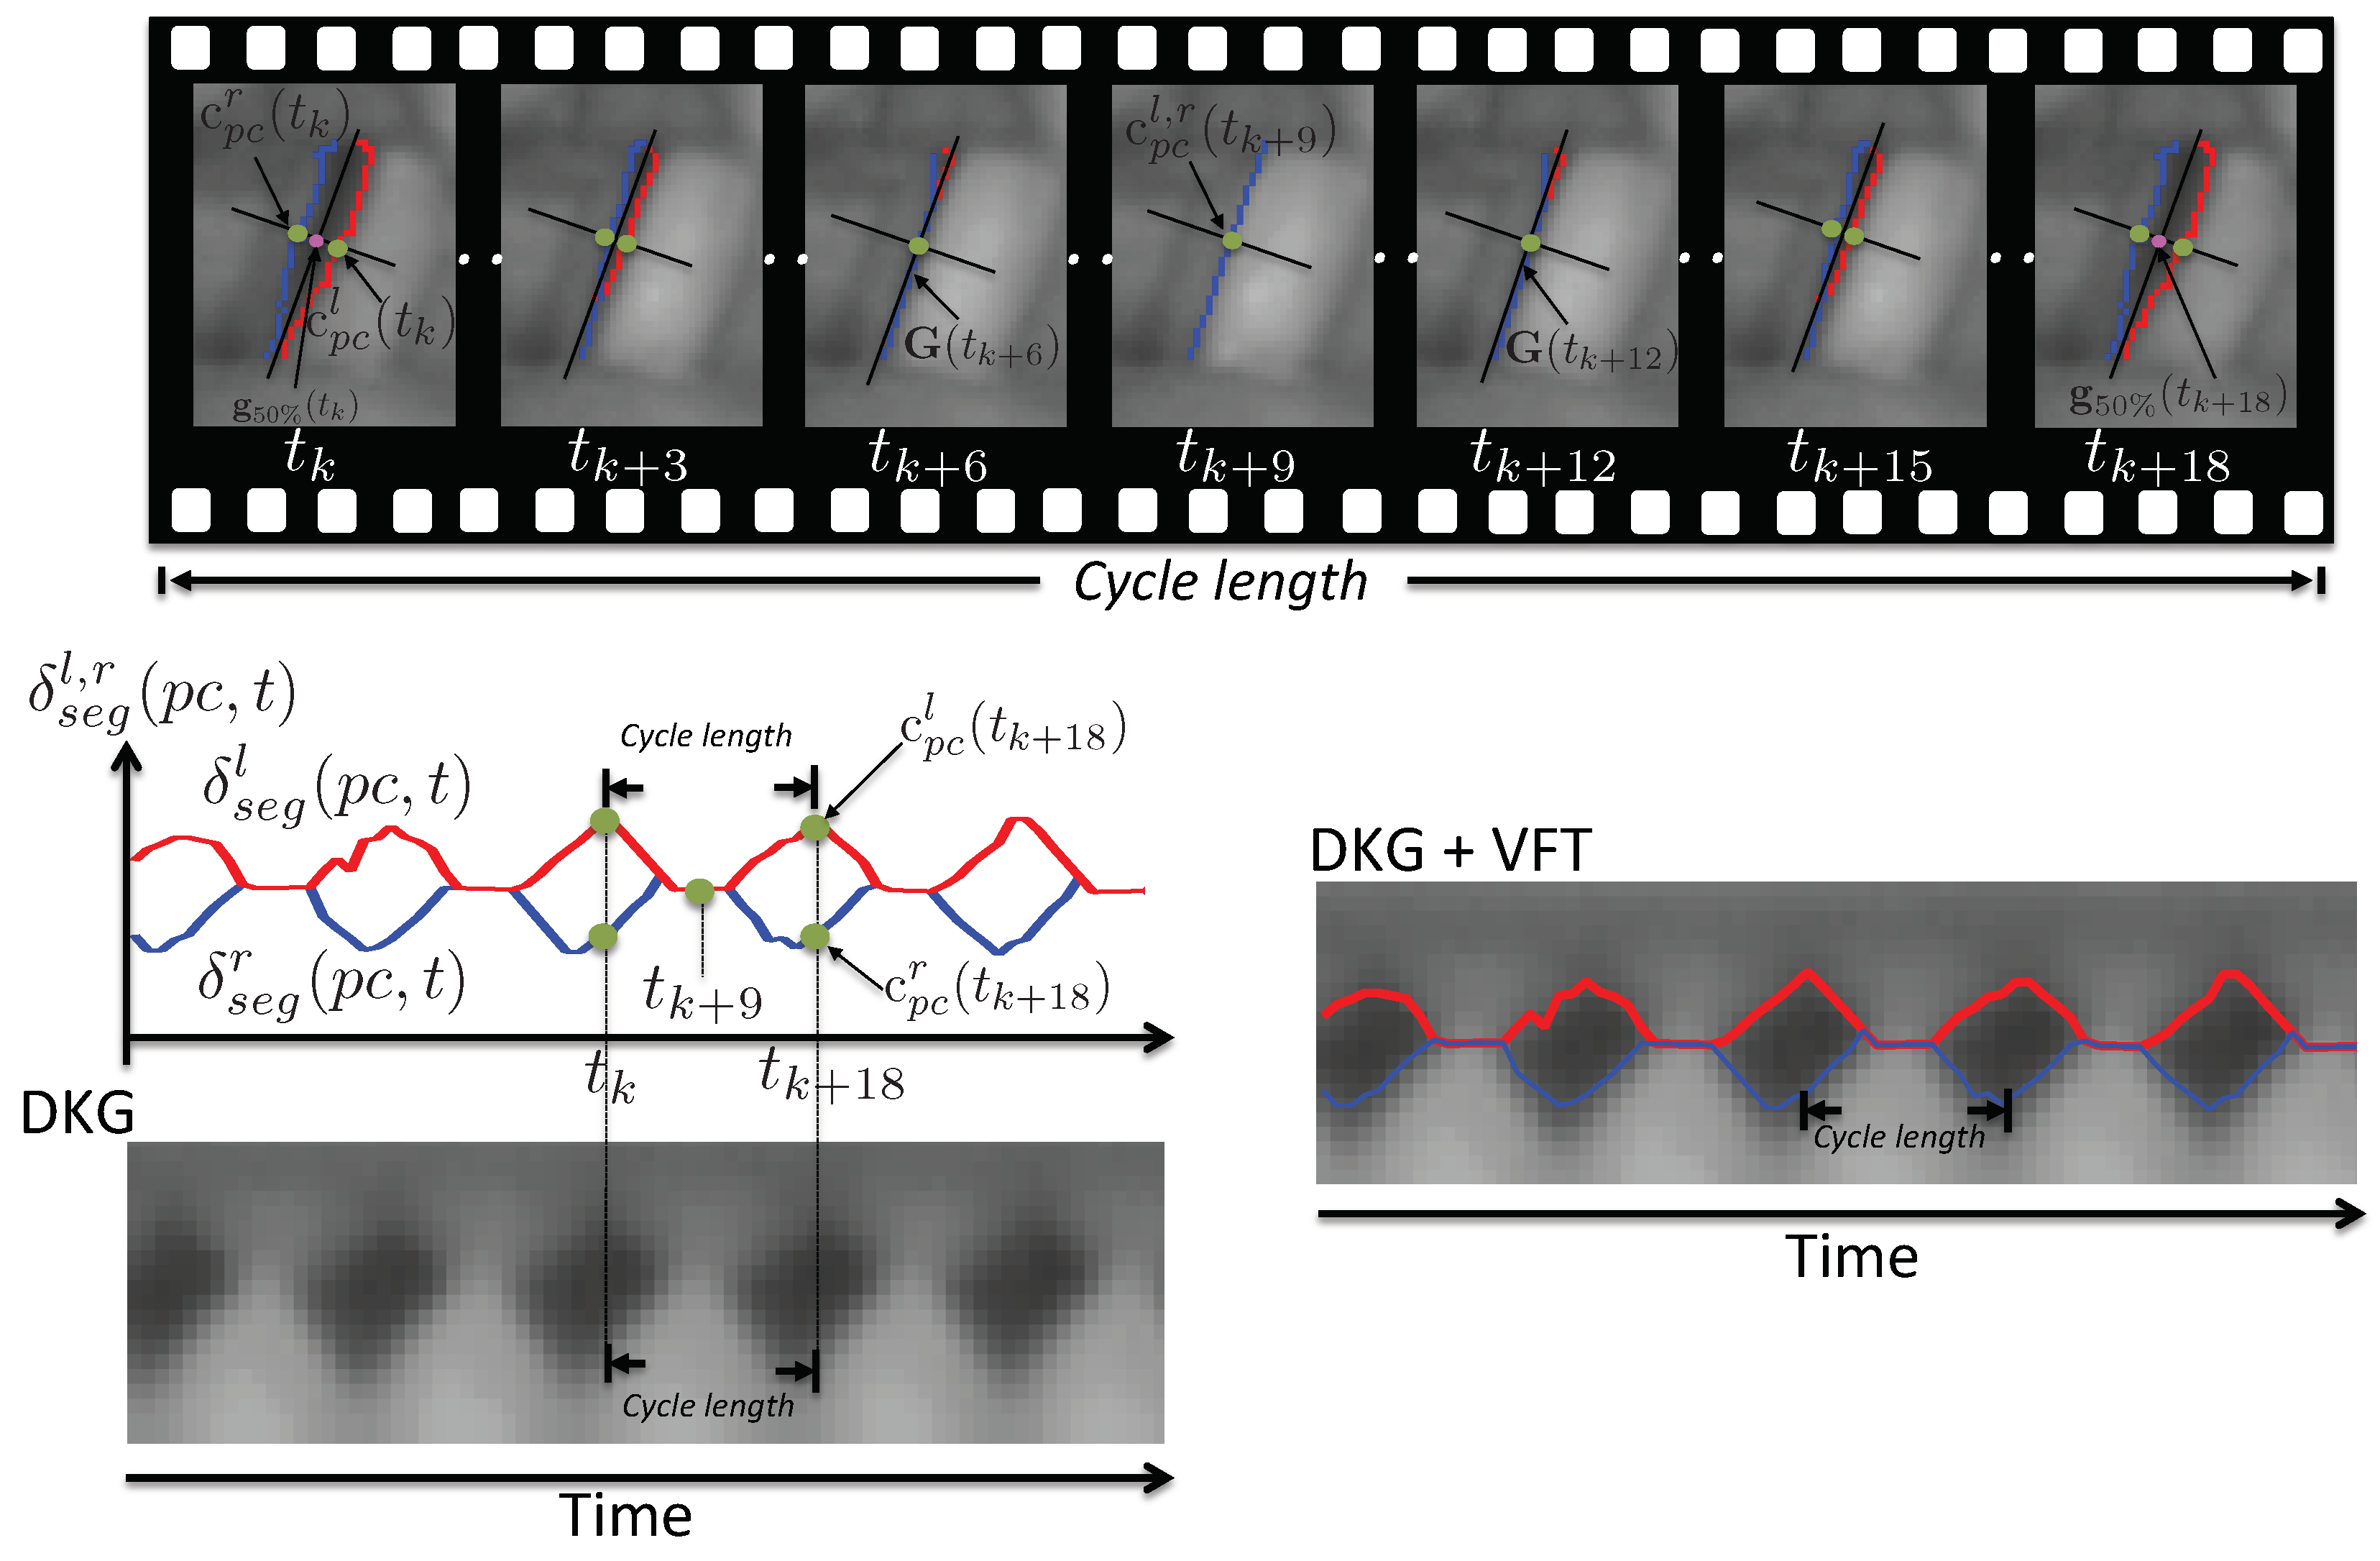
3.3. Facilitative Playbacks Representation

FP improve the quantification accuracy, facilitate the visual perception, and increase the reliability of visual rating while preserving the most relevant characteristics of glottal vibratory patterns [4]. Depending on the way they assess the glottal dynamics they can be grouped in local- or global-dynamics FP. Figure 9 illustrates eight FP from the same high-speed sequence.

3.3.1. Local-Dynamics Facilitative Playbacks

Local-dynamics FP analyzes the vocal folds behavior along one single line that is computed on a line perpendicular to the main glottal axis. In this category, the most used by clinicians and researchers are DKG, VKG and Vocal Folds Trajectories (VFT). They have been successfully applied to demonstrate the change of glottal dynamics in case of damaged tissues, such as lesions, scars, discoloration of the vocal folds and voice disorders [4,7,47,110,111,112,113].
VKG and DKG provide a clear visualization of the glottal cycle opening and closing phases, of the MW traveling across the vocal folds upper surface, and of the displacement of the upper and lower margins of the vocal folds [110,114,115]. Given a video sequence I ( x , t ) , let us denote a horizontal line at time t k and position y j as KG ( t k ) , where KG ( t k ) is the row vector [ I ( x n j , t k ) I ( x n 1 j , t k ) I ( x n 2 j , t k ) I ( x 1 j , t k ) ] . Then, the kymographic matrix I D K G ( x , y ) (or I D K G R , G , B ( x , y ) for color) is constructed with a set of N vectors { KG ( t k ) R n , k = 1 , , N } , where each KG ( t k ) is a column vector of I D K G ( x , y ) (see Equation (1)).
I D K G ( x , y ) = ( KG ( t 1 ) KG ( t 2 ) KG ( t N ) I ( x n j , t 1 ) I ( x n j , t 2 ) I ( x n j , t N ) I ( x n 1 j , t 1 ) I ( x n 1 j , t 2 ) I ( x n 1 j , t N ) I ( x 1 j , t 1 ) I ( x 1 j , t 2 ) I ( x 1 j , t N ) )
In order to interpret the kymographic vibratory pattern, Figure 10 depicts the schematic view of DKG compared with the traditional displays of the vocal folds oscillations. The first row shows eight phases of a glottal cycle in the frontal section, starting with vocal folds opening and ending with a complete vocal folds closure. The second row presents the same eight phases as viewed from above of the vocal folds using HSV. The third shows the DKG playback at a position y j . The kymographic image depicts two cycles of the vocal folds oscillation. The important features observed from the eight phases are: (1) lower margin of the vocal folds begins opening; (2) upper margin of the vocal folds starts to open; (3) lower and upper margins of the vocal folds are open; (4) lower margin of vocal folds is maximally open, upper margin of the vocal folds is still opens; (5) lower margin of the vocal folds closes and is visible; upper margin of glottis is maximally open; (6) lower and upper margins of the vocal folds close, MW propagates on the surface; (7) lower margin of the vocal folds is closed; and (8) upper margin of the vocal folds is closed. Besides the vocal folds, it is possible to observe the motion or none of the ventricular folds [116].
VFT ( δ s e g l , r ( p c , t ) ) synthesizes the HSV in a single image that describes the deflections of the vocal folds edges perpendicular to the glottal main axis [73]. Hence, the vocal folds edges ( C l , r ( t ) ) have to be computed in advance. Later on, a trajectory line, L ( t k ) ), at time t k that intersects perpendicularly with the glottal main axis ( G ( t k ) ) in a predefined point g p c ( t k ) is defined. The current position of g p c ( t k ) is updated at every frame to compensate for the relative movement of the endoscope, of the larynx, or of the vocal folds length changes via Equation (2).
g p c ( t k ) = p ( t k ) + ( p ( t k ) a ( t k ) ) ( p c ( % ) 100 % ) G ( t k )
Later, the intersection between the vocal folds edges C l , r ( t k ) and the trajectory line L ( t k ) is computed by Equation (3):
c p c l , r ( t k ) : c p c l , r ( t k ) L ( t k ) c p c l , r ( t k ) C l , r ( t k )
The vocal folds trajectory is obtained by Equation (4) as:
δ s e g l , r ( p c , t k ) = g p c ( t k ) c p c l , r ( t k ) 2 ; k = { 1 , 2 , , N }
where δ s e g l , r ( p c , t k ) are the deflections of the vocal folds edges at the point c p c l , r ( t k ) , and p c indicates the position of g p c ( t k ) in the glottal main axis. The VFT is illustrated in Figure 11 and expressed in vector notation at Equation (5).
δ s e g l , r ( p c , t ) = [ δ s e g l , r ( p c , t 1 ) δ s e g l , r ( p c , t 2 ) δ s e g l , r ( p c , t k ) δ s e g l , r ( p c , t N ) ]
There are other local FP that have been less explored in literature such as Mucosal Wave Kymography (MKG), Optical Flow Based Waveform (OFW) and Optical Flow Kymogram (OFKG). These FP compute motion vectors to assess the fine detail of MW including the propagation of the mucosal edges during the opening and closing glottal phases. They are computed based on motion estimation techniques where the motion field W ( x , t k ) at time t k is obtained using the intensity variation of consecutive frames ( t k and t k + 1 ). The matrix representation of a total motion field at time t k is depicted in Equation (6).
W ( x , t k ) = ( w ( x 11 , t k ) w ( x 12 , t k ) w ( x 1 n , t k ) w ( x 21 , t k ) w ( x 22 , t k ) w ( x 2 n , t k ) w ( x m 1 , t k ) w ( x m 2 , t k ) w ( x m n , t k ) )
where w ( x i j , t k ) = ( u ( x i j , t k ) , v ( x i j , t k ) ) is the vector displacement of x i j at time t k . The vector displacement w ( x i j , t k ) has two components: one in the x-axis direction ( u ( x i j , t k ) ) and another in the y-axis direction ( v ( x i j , t k ) ).
For instance, in OFKG, a row vector OFKG ( t k ) = [ u ( x n j , t k ) u ( x n 1 j , t k ) u ( x n 2 j , t k ) u ( x 1 j , t k ) ] is selected from a horizontal line at time t k and position y j . Then, the OFKG matrix I O F K G R , G , B ( x , y ) is constructed with a set of N vectors { OFKG ( t k ) R n , k = 1 , , N } , where each OFKG ( t k ) is a column vector of I O F K G R , G , B ( x , y ) :
I O F K G R , G , B ( x , y ) = ( OFKG ( t 1 ) OFKG ( t 2 ) OFKG ( t N ) u ( x n j , t 1 ) u ( x n j , t 2 ) u ( x n j , t N ) u ( x n 1 j , t 1 ) u ( x n 1 j , t 2 ) u ( x n 1 j , t N ) u ( x 1 j , t 1 ) u ( x 1 j , t 2 ) u ( x 1 j , t N ) )
The u ( x i j , t k ) vector is encoded using red and blue tonalities. For rightwise movements, the direction angle of displacement ranges from [ π / 2 , π / 2 ] and is coded with red intensities. On the other hand, the direction angle for leftwise displacements ranges from [ π / 2 , 3 π / 2 ] and is coded with blue tonalities.

3.3.2. Global-Dynamics Facilitative Playbacks

The global-dynamics FP analyse the vocal folds behaviour along the whole glottal length. Most of them are focused on vocal folds edge motion by means of glottal segmentation algorithms. The most widespread are: Glottal Area Waveform (GAW), Phonovibrogram (PVG) and Glottovibrogram (GVG).
GAW uses the glottal segmentation to compute a glottal gap area function along time from which several parameters can be estimated [8,39]. Let us consider I s e g ( x , t ) as a segmented HSV, having the same size of the original video I ( x , t ) . The segmented HSV is a set of binary images, where 1 is assigned to pixels belonging to the glottal gap area (foreground) and 0 is assigned to pixels belonging to the other laryngeal structures (background). Equation (8) computes I ( x , t k ) in time t k :
I s e g ( x , t k ) = { 1 pixels glottal gap 0 background
Therefore, the glottal gap area at t k is computed via Equation (9) as follows:
A o ( t k ) = i = 1 n j = 1 m I s e g ( x i j , t k ) ; k = { 1 , 2 , , N }
then GAW can be expressed in vector notation by Equation (10), where each of its elements represents the area of the glottal gap at a particular instant of time.
GAW ( t ) = [ A o ( t 1 ) A o ( t 2 ) A o ( t k ) A o ( t N ) ]
The GAW playback measures the glottal area function throughout the glottal cycle, being possible to compute some features as: opening and close phase of the vocal folds oscillations, maximum and minimum glottal areas, Open Quotient (OQ), closed quotient and speed quotient, among others. Figure 12 illustrates a GAW normalized within the interval [0,1]. The peaks represent the open-states of the vibratory cycles, meanwhile the valleys represent the closed-states of the vibratory cycles. The maximum and minimum amplitudes of the whole vibratory cycles can be computed by finding the maximum and minimum glottal area respectively. The period of the GAW playback is equivalent to the duration of the glottal cycles, and also to the sum of the opening and closing phase duration.
On the other hand, PVG and GVG FP are 2-D representations of the vocal folds vibratory pattern as a function of time, for which the movements of the vocal folds edges along the anterior-posterior axis are summarized into a time-varying line of the image. PVG, I p v g ( x , y ) , is a further development of spatiotemporal plots of vocal folds vibrations presented in [117] and of the glottal shape representation proposed by [118]. PVG is a 2-D diagram introduced in [119] where a set of segmented contours of the moving vocal folds are unambiguously transformed into a set of geometric objects that represents the entire HSV sequence. Let us consider that the video sequence I s e g ( x , t ) was computed in advance by any segmentation algorithm. Then, the set of frames with the maximal glottal gap area are identified and named as keyframes I k e y ( x , t ) (Equation (11)).
I k e y ( x , t ) = arg max k = 1 N I ( x , t k )
For each keyframe, I k e y ( x , t ) , a linear regression line is computed to identify the main orientation of the glottal gap area. The regression line intersects with C l , r ( t k ) at the points p ( t k ) and a ( t k ) . Such points are used to split the vocal folds edges into the left C l ( t k ) and right folds C r ( t k ) .
Since the vocal folds contours were computed independently, it is necessary to derive a continuous representation of the vocal folds vibrations that links the posterior and anterior point of all images within the HSV sequence. For doing this, it is assumed that the positions of the posterior and anterior glottal points do not change dramatically for all the intermediate images between the occurrences of two consecutive keyframes within a single oscillatory cycle. Therefore, such points are computed approximately by linear interpolation via Equation (12) where t O and t O + 1 indicate two consecutive open-states.
p ( t k ) = p ( t O ) + p ( t O + 1 ) p ( t O ) t O + 1 t O · ( t k t O ) ; t O < t k < t O + 1 a ( t k ) = a ( t O ) + a ( t O + 1 ) a ( t O ) t O + 1 t O · ( t k t O ) ; t O < t k < t O + 1
By connecting the vocal folds edges C l , r ( t k ) to the approximated position of p ( t k ) and a ( t k ) , a continuous representation of the vocal folds edges is obtained also in the parts that are undetected from the segmentation methods. Later, the glottal main axis G ( t k ) and the vocal folds edges C l , r ( t k ) are equidistantly sampled with p c [ 0 , M ], where M corresponds to total percentage length of G ( t k ) ( 100 % ). Then for each image the deflections of the vocal folds edges δ s e g l , r ( p c , t k ) are obtained p c [ 0 , M ] and t [ 1 , N ] . δ s e g l , r ( p c , t k ) is positive, if the left/right fold contour is correctly located on the ipsilateral side of the glottal main axis. Contrariwise, if the vocal fold edges cross laterally, the glottal main axis, δ s e g l , r ( p c , t k ) becomes negative. Furthermore, the vocal folds are splitted longitudinally and the left vocal fold is turned 180° around the posterior commissure p ( t k ) . Lastly, all the computed δ s e g l , r ( p c , t k ) are stored in a matrix I P V G ( x , y ) R ( 2 M + 1 ) × N (Equation (13)).
I P V G ( x , y ) = ( δ s e g l ( M , t 1 ) δ s e g l ( M , t 2 ) δ s e g l ( M , t N ) δ s e g l ( M 1 , t 1 ) δ s e g l ( M 1 , t 2 ) δ s e g l ( M 1 , t N ) δ s e g l ( 1 , t 1 ) δ s e g l ( 1 , t 2 ) δ s e g l ( 1 , t N ) δ s e g l , r ( 0 , t 1 ) δ s e g l , r ( 0 , t 2 ) δ s e g l , r ( 0 , t N ) δ s e g r ( 1 , t 1 ) δ s e g r ( 1 , t 2 ) δ s e g r ( 1 , t N ) δ s e g r ( M , t 1 ) δ s e g r ( M , t 2 ) δ s e g r ( M , t N ) )
In order to visualize I P V G ( x , y ) , each element is represented by color tonalities: red represents positive deflections and blue represents negative deflections. PVG allows to distinguish left- and right-fold movements, and is thus more sensitive to the accuracy of glottal main-axis [90]. The complete procedure to compute PVG is illustrated in Figure 13 where five glottal cycles are depicted.
The GVG playback was proposed in order to solve the difficulties to interpret the PVG and its strong dependence on the detection of the glottal main axis [90,120]. The GVG synthesize the HSV in one single image and its computation uses a similar approach than the PVG formulation. However, unlike it, GVG computes the distance between the vocal folds edges themselves. Firstly, the vocal folds edges C l , r ( t ) are equidistantly sampled with p c ∈ [ 0 , M ]. Then, the deflections among the vocal folds edges are computed by Equation (14), where δ G V G ( p c , t k ) represents the distance between the left c p c l ( t k ) and right c p c r ( t k ) fold at position p c and time t k :
δ G V G ( p c , t k ) = c p c l ( t k ) c p c r ( t k ) 2 ; k and p c
Lastly, all the distances are stored in a matrix I G V G (Equation (15)) and normalized within the interval [ 0 , 1 ], with 0 corresponding to zero distance and 1 corresponding to maximal distance. For visualization purposes the matrix is coded with a grayscale map.
I G V G ( x , y ) = ( δ G V G ( 0 , t 1 ) δ G V G ( 0 , t 2 ) δ G V G ( 0 , t N ) δ G V G ( 1 , t 1 ) δ G V G ( 1 , t 2 ) δ G V G ( 1 , t N ) δ G V G ( M , t 1 ) δ G V G ( M , t 2 ) δ G V G ( M , t N ) )
The GVG depicts a well-shaped form of the vocal folds vibration even when detection errors occur during the segmentation or glottal main axis detection, providing a more intuitive representation of vocal folds dynamics (see Figure 14). However, GVG is not suitable to analyze symmetry between the vocal folds.
There exist other global-dynamics FP that depend on vocal folds contour segmentation. The authors in [118] concatenate the vocal folds deflections δ s e g l , r ( p c , t k ) in order to obtain a 3D representation of the entire vocal folds dynamics. The representation is simple to implement but difficult to interpret. In [80] a playback named Vibration Profiles (VP) is introduced, where not only the edges but also the whole vocal folds were segmented. They computed the deflections between the medial axis in each vocal fold and the edges of each fold. The representation obtained keep relation with PVG playback, but attempts to preserve information of MW propagation. Empirical Orthogonal Eigenfunctions Analysis (EOF) is another playback that is based on the glottal edges computation. The authors extract independent spatio-temporal structures from the vocal-fold displacements analysis using empirical orthogonal functions. The technique appears to be an appropriate tool to extract principal glottal vibration modes from high-speed recordings. In [121], a Singular Value Descomposition (SVD) analysis of vocal folds edges was implemented to capture the spatial and temporal behavior of the vibrations over time and space respectively. The first spatial eigenfold captures the average shape of the vocal folds, the second spatial eigenfold captures the closing pattern of the folds, and the third spatial eigenfold captures the motion in the longitudinal direction of the folds. On the other hand, the first temporal eigenfold captures the amplitude differences between the left and the right folds, and the second temporal eigenfold captures the sample difference in phase between the left and right folds. The separation of spatial and temporal eigenfolds offers a compact visualization but does not allow localization of vibratory features in space and time.
There are also representations that use information from other FP to compute new ones. For instance, the authors in [122] computed the Hilbert transformation of GAW to create an analytic phase plot that depicts the effects of jitter and shimmer as well as harmonic distortion in terms of perturbation and periodicity. Nevertheless, analyzing GAW signals does not differentiate between left and right vocal fold vibration and consequently, asymmetries remain unconsidered. Alternatively, reference [123] use phase space reconstruction and correlation dimension over the glottal area time series (GAW) to investigate the dynamic characteristics of the vocal folds. In [124], PVG and GAW were combined to construct a 3D representation named Phonovibrographic Wavegram (PVG-wavegram). This playback let visualize the intra- and inter-cycle characteristics of vocal fold vibrations within a single three-dimensional scalar volume field for long phonation sequences. One of the latest FP proposed in the literature is Glottocorrelogram (GCG). This representation allows to visualize the correlation coefficients obtained from the glottovibrogram presenting phase and frequency variations among the vocal folds edges.
Only a few FP do not depend on a segmentation approach. Reference [125] proposed a method for extracting spatial features based on pixel-wise Fourier analysis of a time-varying brightness curve for each pixel across images. They named this FP Laryngotopography (LGT). LGT let to display spatial information related to natural frequencies of a portion of a larynx, amplitude of vibration, and propagation speed of MW. In [126] Principal Component Analysis (PCA) was applied to the pixel intensity of the high-speed sequence, and the first two PCA coefficients were visualized. The Glottaltopogram (GTG) method reveals the overall spatial synchronization pattern of the vocal folds vibrations for the entire laryngeal area, rather than focusing on a specific location or frequency. Despite full spatial resolution is maintained, the time information is not preserved.
Since the purpose of HSV analysis is to characterize the motion of the vocal folds by identifying their movements from one frame to the followings, the authors in [127] used Optical Flow (OF) computation to track the vocal folds solely based on its motion, with no need of additional segmentation techniques. OF aims at understanding and interpreting the dynamical behavior of moving objects a low-level by the estimation of a displacement vector for each pixel in the image, creating a dense motion field W ( x , t k ) (Equation (6)) [69]. The direction of the motion field is expected to be inwards in the closing phase and outwards during the glottal opening. The authors implemented two global FP from W ( x , t k ) named as Optical Flow Glottovibrogram (OFGVG) and Optical Flow Kymogram (OFKG). OFGVG is derived from GVG and represents the velocity of glottal movement per cycle. It is obtained by averaging each row of the u ( x ) component of the flow, and represents it as a column vector. The OFGVG complements the spatio-temporal information provided by the common techniques (GVG, PVG) by adding velocity information for each displacement of the vocal folds. On the other hand, GOFW is a 1D representation that is based on GAW, but here the total magnitude of the velocity is computed over a ROI for each instant of time. GOFW represents the change of velocity along time at the same instant in which it is quantified the total velocity variation. Both FP have the same limitation existing in GVG and GAW, since they are not suitable to analyze symmetry between the vocal folds.
A summary of the main studies carried out to synthesize the vocal folds vibratory patterns is presented in Table 4.

4. Challenges in Glottal Gap Segmentation and Facilitative Playbacks

Automatic methods for glottal gap segmentation and for the representation of FP are still being investigated. From a pure image processing perspective, the task of tracking vocal folds edges during an entire video sequence appears to be a standard tracking task. Thus, naively, it may seem that once the glottal area in a frame is delineated, it can easily be identified in successive frames, or that the glottal gap can be obtained intuitively by subtracting successive frames. However, glottal-gap segmentation is not easy due to many different factors: limited spatial resolution, contrast inadequacies during acquisition (see Figure 15a), camera rotation (see Figure 15b), side movement of the laryngoscope, movements of the patient, brightness changes (see Figure 15c), depth differences between videos and demanding cases as hourglass closure, irregular closure, vocal hemorrhage (see Figure 15d), nodules (see Figure 15e), polyps, cysts, scars, mucus, specular reflection, and vocal folds occlusion (see Figure 15f) among others. In addition, there are no official guidelines for laryngeal imaging footage analysis; the literature is limited by the relatively low or nonexistent correlations among measures of irregularity in vocal folds vibration and acoustic parameters; and the lack of normative values of the parameters and intervals, which are needed to determine the severity of pathological voice production.
Since the pattern of vocal folds vibration is difficult to evaluate by simply observing the successive video frames, the researchers have introduced the concept of FP to easily and better visualize the features of vocal folds dynamics. The purpose of FP is to synthesize the time-varying data in a few static images, or in an unidimensional temporal which permits to visualize hidden features.
Despite the great advances that have been reached condensing the data coming from laryngeal imaging, many of the FP in the literature present some drawbacks that restrict their applicability. For instance, the motion analysis is focused only on those points belonging to the glottal contours. Additionally, some FP rely on the computation of the glottal main axis, which strongly depends on the geometry of the detected glottal gap and can be difficult to identify accurately in the presence of a posterior glottal chink [73,80,90,119,124]. Other FP do not preserve spatial information about vocal folds vibration, limiting their applicability for interpreting vibratory features such as asymmetry [3,123,128,129]. Furthermore, there are FP that restrict the information about the dynamics of the vocal folds along one single line [4,114,127,130]. Lastly, there are FP less intuitive to interpret [125,126], reason that probably explains why they have not been widely used.
The current challenge is to provide new methods for data visualization to overcome the drawbacks of existing ones, providing simultaneously features that would integrate time dynamics, such as: velocity, acceleration, instants of maximum and minimum velocity, vocal folds displacements during phonation and motion analysis of MW propagation. These methods should include not only those points belonging to the glottal edges but also those regions that originated such movements. All these issues make the glottal segmentation and FP challenging tasks. A successful image processing approach will have to overcome these issues in a robust way in order to maintain a high level in the quality and accuracy in clinical diagnosis.

5. Voice Research and Clinical Applications

In voice research, several works make use of glottal segmentation and FP to investigate the correlation between vocal folds vibratory patterns, speaker voice quality, voice onset and offset. For instance, the authors in [3,131,132] make use of glottal segmentation to obtain the afforementioned GAW, which identifies new quantitative measures to evaluate the regularity of vocal folds vibration during phonation. In [133], GAW has been used to compute the Voice Onset Time (VOT) which is a clinical indicator for correct laryngeal functionality. The authors in [134] computed 20 parameters from the acoustic signal and GAW. The aim was to identify mathematical dependencies between parameters and suggest which parameters may best describe the properties of the GAW and corresponding acoustical signal. Subsequent works [7,39,48,71,135,136] pointed out the advantages of studying the vocal folds vibration function to detect asymmetries, transients, breaks, opening phase events, closing phase events and irregularities.
The literature also reports a combined use of laryngeal image processing of the vocal folds motion with biomechanical models (so-called Lumped Mass Models (LMMs)) to investigate the parameter effects such as applied subglottal air pressure, vibrating masses, tissue stiffness and elongation characteristics with respect to the dynamic vocal folds behavior. In [6,137,138], the Two Spring-Coupled Masses Models (2MMs) proposed in [139] was combined with glottal segmentation to describe the vocal folds oscillations as a function of time. The authors found physiological parameters such as vocal folds tensions and vocal folds masses. In [140], an automatic optimization procedure was developed to fit a multi-mass model [141] to the observed vocal folds oscillations obtained via segmentation, with the aim of inferring an approximation of the stiffness and mass distribution along the entire vocal folds. In [142], a numerical 2MMs was adapted to the VFT playback by varying model masses, stiffness and subglottal pressure. The obtained model was used to quantify gender and age-related differences. Most recent work makes use of a recurrent neural network to train a 2MMs using VFT to estimate laryngeal pressure [143]. The authors claim that the methodology proposed is transferable to estimate other laryngeal parameters that will aid in diagnosis and treatment selection in voice disorders.
The image-processing of vocal folds motion has been used to highlight the importance of visualizing MW propagation for an accurate diagnosis and optimal treatment of voice disorders. In [144,145] the MW was detected and quantified by combining glottal segmentation with physiological knowledge of mucosal lateral movements. An important conclusion was the finding that 2000 fps is insufficient to assess features of MW when the frequency of vocal fold vibration is high. The authors in [146] discussed the benefits, the disadvantages, and the clinical applicability of different MW measurement techniques. They found the necessity of additional research to broaden the use of laryngeal image-processing to accurately and objectively diagnose voice disorders. The authors in [147] analyzed the OQ from glottal-gap segmentation and Electroglottography (EGG). They observe that the measure of the OQ from three parts of the glottis helps to diagnose and localize glottal vocal-fold lesions. They also found that OQ varies depending on the type of organic dysphonia. In [148,149] MW analysis is used for the diagnosis of different vocal fold lesions and for evaluating the success of treatment procedures, hydration effects, or mucosal healing after phonosurgery. Besides human vocal folds, mucosal waves were documented on the vocal folds of many mammals and also in birds [150,151,152,153]. They observed that the fundamental frequencies of many mammals are similar to those seen in humans, and consists of flow-induced self-sustaining oscillations of laryngeal tissues. Further, the appearance of MW was shown to be a crucial component of the myoelastic-aerodynamic theory of phonation, explaining the mechanisms of the self-sustained vocal fold oscillations.
Different singing styles have been analyzed using laryngeal image processing. For instance: the mechanism of the bass type of Mongolian throat singing (called Kargyraa) was studied using FP [154]. They found that both true vocal folds and false vocal folds vibrate during singing; they also observed that the vibration of the false folds adds subharmonics to the acoustic content. In [155] the characteristics of rock singing, also known as distorted singing, were investigated. The authors found some modulations of the vocal folds vibrations by means of periodic or aperiodic motion in the supraglottic mucosa which presumably adds special expressivity to loud and high tones in rock singing. The authors in [156] proposed FP to visualize glottal dynamics during singing sequences consisting in vowels sung at different pitches, different loudness, and exploring the four laryngeal mechanisms. They found additional information on the temporal dynamics of glottal vibratory movements during glottal closing and opening phases. The Laodan and Qingyi role in Peking Opera was studied in [157]. They used image-processing to evaluate glottal changes, relative length of the glottis fissure and relative maximum mucosal amplitude. To understand the vibration of the vocal folds of human voice production at very the high soprano range, several acoustic and glottal parameters are extracted from laryngeal videos [158,159]. The studies reveal three regions of pitch jumps or instabilities in the high soprano range, above the M1–M2 transition or primo passaggio. They also found that the whole length of the membranous part of the vocal folds took part in the oscillatory process and even at these highest pitches a total closure of the vocal folds was observed.
There are also studies devoted to describe properties of laryngeal oscillation patterns with regard to vocal registers and their transitions [41,42,160,161]. In [160] the vocal fold oscillatory patterns during transitions from modal to falsetto register and from modal register to stage voice above the passaggio in professional tenor opera soloists were analyzed using PVG and DKG. They found that the transitions are associated with large modifications of the supraglottic cavities and with retraction of the epiglottis. Therefore, they suggest the use of flexible transnasal high-speed laryngoscopy in order to improve the visibility of vocal folds. In [42] variations of vocal fold vibration patterns were found in the first and the second passaggio. They observed four distinct patterns emerged: smooth transitions with either increasing or decreasing durations of glottal closure, abrupt register transitions, and intermediate loss of vocal fold contact. In addition, laryngeal configuration and vocal fold behavior during different voice quality have been explored in different studies [162,163]. The results suggests that the voice qualities were produced by independently manipulating the adduction of the arytenoid cartilages and the thickening of the vocal folds.
The glottal segmentation and FP have been used to diagnose functional voice disorders [44,47,164,165,166]. For instance, the authors in [46] presented a computer-aided method for automatically and objectively classifying individuals with normal and abnormal vocal folds vibration patterns. First, a set of image processing techniques were employed to visualize vocal folds dynamics. Later, numerical features were derived, capturing the dynamic behavior and the symmetry of the vocal folds oscillation. Lastly, a support vector machine was applied to classify between normal and pathological vibrations. The results indicate that an objective analysis of abnormal vocal folds vibration can be achieved with considerably high accuracy. The laryngeal imaging techniques have been used to detect early-stage vocal folds cancer. The authors in [50] report a procedure to discriminate between malignant and precancerous lesions by measuring the characteristics of vocal folds dynamics by means of a computerized analysis of laryngeal videos. They found that vocal folds dynamics are significantly affected by the presence of precancerous lesions.
Recently, laryngeal image processing of vocal folds motion have been used to visualize the 3D superior vocal fold vibrations from laryngeal recordings [23,24,167,168,169]. The authors proved that healthy phonation does not depend on symmetric oscillation patterns since great asymmetric vertical dynamics were observed. They concluded that a good evaluation of vocal folds vibrations has to include a 3D visualization of the vibratory function.

6. Discussions and Future Directions

The study of vocal folds vibratory behavior reveals pathophysiological evidence and explains voice dysfunction. Since the last decade, a great number of papers have been published in the field of laryngeal imaging, focusing on glottal gap segmentation and FP representation in different image modalities.
There are some open challenges which should be covered in future research, such as, the lack of unified benchmarks and guidelines to evaluate glottal segmentation and FP. The studies in the literature have been performed using their own private datasets. It is not straightforward to evaluate and numerically compare different studies without shared public databases used for benchmark and comparison purposes. The studies to date are solely based on their reported results since they use different datasets, various evaluation methods, and multiple performance metrics. For numerical comparison of the studies, it is necessary to build benchmark datasets and to establish a set of guidelines. Additionally, the datasets should be clinically validated. They should comprise samples coming from a large number of patients, and annotated by different specialists to remove subjective variations in the annotations. Such an effort would make possible the numerical comparison of the results obtained by different studies and the identification of distinguishing features. In view of these limitations, and in other to partially circumvent these problems, [86] proposes a set of guidelines to measure the accuracy and efficiency of the segmentation algorithms. The guidelines are divided in three groups according to their nature: analytical, subjective, and objective.
Another problem is related to the accurate and precise detection of the glottal gap along the video sequence. Most of the methods in the literature only take local intensity information without any prior knowledge about the object to be segmented and the temporal information of the laryngeal sequence. Furthermore, the task of identifying the glottal gap is carried out by semi-automatic methods. In this context, and with the exponential growth of computer power and the constant improvement of image processing algorithms, automatic segmentation has achieved a great progress. However, many of the techniques found in the literature still have weaknesses that make them impractical in a clinical environment, in which automatization and reliability are fundamental. Up to now, there is no standardized procedure to automatically segment glottal gap from HSV and VS, in spite of the extensive literature devoted to solving such as problem. The common approach to solve the glottal segmentation, roughly speaking, divides the problem into three main stages: image enhancement, identification of ROI, and glottal gap delimitation.
The laryngeal imaging techniques in combination with image processing are the most promising approach to investigate vocal folds vibration and laryngeal dynamics. Therefore, researchers have introduced objective parameters that can be used by clinicians to accurately identify the presence of organic voice disorders [44], classify functional voice disorders [46], vibratory patterns [48], discriminate early stage of malignant and precancerous vocal folds lesions [50], among others [7,39]. However, despite the progress achieved to describe the vocal folds dynamics, its use in the clinical routine is limited due to several restrictive factors: there are no official guidelines for footage analysis; the literature is limited by the relatively low or nonexistent correlations among measures of irregularity in vocal folds vibration and acoustic parameters; and there is a lack of normative values of parameters and intervals, which are needed to determine the severity of pathological voice production.
In order to improve the laryngeal diagnosis, the concept of FP has been introduced by voice researchers. These representations synthesize the time-varying data to visualize hidden features that are not easily observed from the laryngeal sequences. However, many of the FP presented in the literature have some drawbacks that restrict their applicability since they rely on glottal-area segmentation (GAW, GVG, PVG, PVG-wavegram, VFT, VP, EFA and HTA). Additionally, most of the FP consider only those points belonging to the glottal contours and neglect the MW contribution. Others, such as GVG, PVG, PVG-wavegram, VFT and VP rely on the computation of glottal main axis, which strongly depends on the geometry of the detected glottal area. FP such as GAW, HTA, NDA and PGAW are based on glottal area waveform computation, so they do not preserve spatial information about vocal folds vibration. On the other hand, FP such as OFW, OFKG, DKG and MKG restrict the information along one single line. The challenge is to provide representations to overcome the drawbacks of existing ones, providing simultaneously features that would integrate the time dynamics, such as velocity, acceleration, instants of maximum and minimum velocity, vocal folds displacements during phonation and motion analysis of the MW.
To the best of our knowledge, only few works study the MW propagation [46,144,146,170]. Future studies have to analyze in more detail the objective detection and quantification of MW propagation since its existence and magnitude provides valuable information about the coupling between the mucosa and the subjacent vocal folds muscle. Additionally, it is widely demonstrated that MW activity is a useful indicator of the quality of voice production and the presence of voice disorders. One possible solution to address these shortcomings, it could be created kinematics models that simulate the MW based on physical models and FP, similar that the one presented in [170]. In this way, it will be possible to explore the variations of the MW under different constraints. Besides, it can be exploited the potential of 3D visualization of vocal folds to understand the propagation of mucosal wave using motion estimation techniques as 3D feature tracking or dense 3D motion field [171,172].
Further development should explore other techniques such as registration [64], Haar wavelets [173], Haar-like features [174], local binary patterns (LBP) [175], Histogram of Oriented Gradient (HOG) [176] or supervised machine-learning to characterize the kinematics of the vocal folds. The image registration is one of the fundamental tasks within image processing, which let to find an optimal geometric transformation between two corresponding images. Therefore, it will be possible to model the deformation of the vocal folds for each particular laryngeal mechanism using geometric transformations. The HOG well captures local shape characteristics of the targeted object based on directions and magnitudes of image derivatives. Then it could be used to model the wavelike motion of the vocal folds during different vocal tasks. Besides, HOG could be combined with Haar wavelets, Haar-like features and local binary patterns (LBP) to create a new feature descriptor to classify different vocal folds vibratory patterns [177]. On the other hand, supervised machine-learning techniques, especially deep learning [178], is part of state-of-the-art systems in various disciplines, particularly in computer vision and image processing. In addition, it has been used to make critical decisions in medical diagnosis. It would be possible to train a neural network to extract 3D structure of vocal folds; to segment the glottal gap; to compensate camera rotations and translations; to enhance the quality of laryngeal imaging; to synthesize video information; to classify different vibratory patterns; to generate synthetic datasets; to track different glottal structures (e.g., arytenoids, epiglottis); image data augmentation to increase video frame rate; among others.
Lastly, it might be helpful to show how the FP and the objective parameters provide complementary information, as well as combining them to put additional information to the context. In addition, a systematic comparison with other glottal-activity signals such as Electroglottography (EGG) would be very interesting to provide a more complete assessment of vocal folds vibration.

Author Contributions

Conceptualization, G.A.-M., N.H.B., J.I.G.-L.; investigation, G.A.-M., N.H.B., J.I.G.-L., D.D.D., Y.S.; resources, N.H.B., J.I.G.-L.; writing—original draft preparation, G.A.-M.; writing—review and editing, G.A.-M., D.D.D., Y.S.; supervision, N.H.B., J.I.G.-L. All authors contributed to the conceptualization and the methodology of this article. All authors have read and agreed to the published version of the manuscript.

Funding

This work was supported by the Ministry of Economy and Competitiveness of Spain under grant DPI2017-83405-R1.

Conflicts of Interest

The authors declare no conflict of interest.

References

  1. Henrich, N. La Voix Humaine: Vibrations, Résonances, Interactions Pneumo-Phono-Résonantielles; Accreditation to supervise research; Université Grenoble Alpes: Grenoble, France, 2015. [Google Scholar]
  2. Patel, R.R.; Awan, S.N.; Barkmeier-Kraemer, J.; Courey, M.; Deliyski, D.; Eadie, T.; Paul, D.; Švec, J.G.; Hillman, R. Recommended Protocols for Instrumental Assessment of Voice: American Speech-Language-Hearing Association Expert Panel to Develop a Protocol for Instrumental Assessment of Vocal Function. Am. J. Speech Lang. Pathol. 2018, 27, 887–905. [Google Scholar] [CrossRef]
  3. Yan, Y.; Damrose, E.; Bless, D. Functional analysis of voice using simultaneous high-speed imaging and acoustic recordings. J. Voice 2007, 21, 604–616. [Google Scholar] [CrossRef] [PubMed]
  4. Deliyski, D.; Petrushev, P.; Bonilha, H.; Gerlach, T.; Martin-Harris, B.; Hillman, R. Clinical Implementation of Laryngeal High-Speed Videoendoscopy: Challenges and Evolution. Folia Phoniatr. Logop. 2008, 60, 33–44. [Google Scholar] [CrossRef] [PubMed]
  5. Zacharias, S.; Deliyski, D.; Gerlach, T. Utility of Laryngeal High-speed Videoendoscopy in Clinical Voice Assessment. J. Voice 2018, 32 2, 216–220. [Google Scholar] [CrossRef]
  6. Tao, C.; Zhang, Y.; Jiang, J. Extracting Physiologically Relevant Parameters of Vocal Folds From High-Speed Video Image Series. IEEE Trans. Biomed. Eng. 2007, 54, 794–801. [Google Scholar] [PubMed]
  7. Lohscheller, J.; Švec, J.; Döllinger, M. Vocal fold vibration amplitude, open quotient, speed quotient and their variability along glottal length: Kymographic data from normal subjects. Logoped. Phoniatr. Vocol. 2013, 38, 182–192. [Google Scholar] [CrossRef] [PubMed]
  8. Woo, P. Objective Measures of Laryngeal Imaging: What Have We Learned Since Dr. Paul Moore. J. Voice 2014, 28, 69–81. [Google Scholar] [CrossRef] [PubMed]
  9. Rammage, L. Disorders of voice. In The Cambridge Handbook of Communication Disorders; Cummings, L., Ed.; Cambridge University Press: Cambridge, UK, 2013; Chapter 25; pp. 457–483. [Google Scholar]
  10. Dejonckere, P.H. Assessment of Voice and Respiratory Function. In Surgery of Larynx and Trachea; Remacle, M., Eckel, H.E., Eds.; Springer: Berlin/Heidelberg, Germany, 2010; Chapter 2; pp. 11–26. [Google Scholar]
  11. Larsson, H.; Stellan, H.; Lindestad, P.A.; Hammarberg, B. Vocal Fold Vibrations: High-Speed Imaging, Kymography, and Acoustic Analysis: A Preliminary Report. Laryngoscope 2000, 110, 2117–2122. [Google Scholar] [CrossRef]
  12. Yumoto, E. Aerodynamics, voice quality, and laryngeal image analysis of normal and pathologic voices. Curr. Opin. Otolaryngol. Head Neck Surg. 2004, 12, 166–173. [Google Scholar] [CrossRef]
  13. Heman-Ackah, Y.D. Diagnostic tools in laryngology. Curr. Opin. Otolaryngol. Head Neck Surg. 2004, 12, 549–552. [Google Scholar] [CrossRef]
  14. Hertegȧrd, S. What have we learned about laryngeal physiology from high-speed digital videoendoscopy? Curr. Opin. Otolaryngol. Head Neck Surg. 2005, 13, 152–156. [Google Scholar] [CrossRef] [PubMed]
  15. Verikas, A.; Uloza, V.; Bacauskiene, M.; Gelzinis, A.; Kelertas, E. Advances in laryngeal imaging. Eur. Arch. Oto-Rhino-Laryngol. 2009, 266, 1509–1520. [Google Scholar] [CrossRef] [PubMed]
  16. Deliyski, D.; Hillman, R. State of the Art Laryngeal Imaging: Research and Clinical Implications. Curr. Opin. Otolaryngol. Head Neck Surg. 2010, 18, 147–152. [Google Scholar] [CrossRef] [PubMed]
  17. Mehta, D.D.; Hillman, R.E. The Evolution of Methods for Imaging Vocal Fold Phonatory Function. SIG 5 Perspect. Speech Sci. Orofac. Disord. 2012, 22, 5–13. [Google Scholar] [CrossRef] [Green Version]
  18. Mehta, D.; Hillman, R. Current role of stroboscopy in laryngeal imaging. Curr. Opin. Otolaryngol. Head Neck Surg. 2012, 20, 429–436. [Google Scholar] [CrossRef] [PubMed] [Green Version]
  19. Kendall, K.A. High-speed digital imaging of the larynx: Recent advances. Curr. Opin. Otolaryngol. Head Neck Surg. 2012, 20, 466–471. [Google Scholar] [CrossRef] [PubMed]
  20. Hawkshaw, M.J.; Sataloff, J.B.; Sataloff, R.T. New Concepts in Vocal Fold Imaging: A Review. J. Voice 2013, 27, 738–743. [Google Scholar] [CrossRef]
  21. Deliyski, D.; Hillman, R.; Mehta, D. Laryngeal High-Speed Videoendoscopy: Rationale and Recommendation for Accurate and Consistent Terminology. J. Speech Lang. Hear. Res. 2015, 58, 1488–1492. [Google Scholar] [CrossRef]
  22. Bailly, L.; Cochereau, T.; Orgéas, L.; Henrich Bernardoni, N.; Rolland du Roscoat, S.; McLeer-Florin, A.; Robert, Y.; Laval, X.; Laurencin, T.; Chaffanjon, P.; et al. 3D multiscale imaging of human vocal folds using synchrotron X-ray microtomography in phase retrieval mode. Sci. Rep. 2018, 8, 14003. [Google Scholar] [CrossRef]
  23. Semmler, M.; Kniesburges, S.; Parchent, J.; Jakubaß, B.; Zimmermann, M.; Bohr, C.; Schützenberger, A.; Döllinger, M. Endoscopic Laser-Based 3D Imaging for Functional Voice Diagnostics. Appl. Sci. 2017, 7, 600. [Google Scholar] [CrossRef] [Green Version]
  24. Semmler, M.; Döllinger, M.; Patel, R.R.; Ziethe, A.; Schützenberger, A. Clinical relevance of endoscopic three-dimensional imaging for quantitative assessment of phonation. Laryngoscope 2018, 128, 2367–2374. [Google Scholar] [CrossRef] [PubMed]
  25. Deliyski, D.D.; Shishkov, M.; Mehta, D.D.; Ghasemzadeh, H.; Bouma, B.; Zañartu, M.; de Alarcon, A.; Hillman, R.E. Laser-Calibrated System for Transnasal Fiberoptic Laryngeal High-Speed Videoendoscopy. J. Voice 2019. [Google Scholar] [CrossRef] [PubMed]
  26. Ghasemzadeh, H.; Deliyski, D.D.; Ford, D.S.; Kobler, J.B.; Hillman, R.E.; Mehta, D.D. Method for Vertical Calibration of Laser-Projection Transnasal Fiberoptic High-Speed Videoendoscopy. J. Voice 2019. [Google Scholar] [CrossRef] [PubMed]
  27. Kendall, K.; Leonard, R. Laryngeal High-speed Videoendoscopy, In Laryngeal Evaluation: Indirect Laryngoscopy to High-Speed Digital Imaging; Thieme: New York, NY, USA, 2010; Chapter 28; pp. 245–270. [Google Scholar]
  28. Kawaida, M.; Fukuda, H.; Kohno, N. Electronic Videoendoscopic Laryngostroboscopy. ORL J. Otorhinolaryngol. Relat. Spec. 2004, 66, 267–274. [Google Scholar] [CrossRef]
  29. Eller, R.; Ginsburg, M.; Lurie, D.; Heman-Ackah, Y.; Lyons, K.; Sataloff, R. Flexible Laryngoscopy: A Comparison of Fiber Optic and Distal Chip Technologies. Part 1: Vocal Fold Masses. J. Voice 2008, 22, 746–750. [Google Scholar] [CrossRef] [Green Version]
  30. Eller, R.; Ginsburg, M.; Lurie, D.; Heman-Ackah, Y.; Lyons, K.; Sataloff, R. Flexible Laryngoscopy: A Comparison of Fiber Optic and Distal Chip Technologies-Part 2: Laryngopharyngeal Reflux. J. Voice 2009, 23, 389–395. [Google Scholar] [CrossRef] [Green Version]
  31. Woo, P. 4K Video-Laryngoscopy and Video-Stroboscopy: Preliminary Findings. Ann. Otol. Rhinol. Laryngol. 2016, 125, 77–81. [Google Scholar] [CrossRef]
  32. Patel, R.; Dailey, S.; Bless, D. Comparison of High-Speed Digital Imaging with Stroboscopy for Laryngeal Imaging of Glottal Disorders. Ann. Otol. Rhinol. Laryngol. 2008, 117, 413–424. [Google Scholar] [CrossRef]
  33. Kendall, K.; Leonard, R. Introduction to Videostroboscopy. In Laryngeal Evaluation: Indirect Laryngoscopy to High-Speed Digital Imaging; Thieme: New York, NY, USA, 2010; Chapter 10; pp. 92–100. [Google Scholar]
  34. Kendall, K.; Leonard, R. The Science of Stroboscopic Imaging. In Laryngeal Evaluation: Indirect Laryngoscopy to High-Speed Digital Imaging; Thieme: New York, NY, USA, 2010; Chapter 11; pp. 101–109. [Google Scholar]
  35. Deliyski, D.; Powell, M.E.; Zacharias, S.R.; Gerlach, T.T.; de Alarcon, A. Experimental investigation on minimum frame rate requirements of high-speed videoendoscopy for clinical voice assessment. Biomed. Signal Process. Control 2015, 17, 21–28. [Google Scholar] [CrossRef] [Green Version]
  36. Schlegel, P.; Semmler, M.; Kunduk, M.; Döllinger, M.; Bohr, C.; Schützenberger, A. Influence of Analyzed Sequence Length on Parameters in Laryngeal High-Speed Videoendoscopy. Appl. Sci. 2018, 8, 2666. [Google Scholar] [CrossRef] [Green Version]
  37. Hertegȧrd, S.; Larsson, H.; Wittenberg, T. High-speed imaging: Applications and development. Logoped. Phoniatr. Vocol. 2003, 28, 133–139. [Google Scholar] [CrossRef] [PubMed]
  38. Qin, X.; Wang, S.; Wan, M. Improving Reliability and Accuracy of Vibration Parameters of Vocal Folds Based on High-Speed Video and Electroglottography. IEEE Trans. Biomed. Eng. 2009, 56, 1744–1754. [Google Scholar] [PubMed]
  39. Herbst, C.; Lohscheller, J.; Švec, J.; Henrich, N.; Weissengruber, G.; Fitch, W. Glottal opening and closing events investigated by electroglottography and super-high-speed video recordings. J. Exp. Biol. 2014, 217, 955–963. [Google Scholar] [CrossRef] [PubMed] [Green Version]
  40. Leppävuori, M.; Andrade-Miranda, G.; Henrich Bernardoni, N.; Laukkanen, A.M.; Geneid, A. Characterizing vocal-fold dynamics in singing vocal modes from Complete Vocal Technique using high-speed laryngeal imaging and electroglottographic analysis. In Proceedings of the Pan-European Voice Conference, Copenhagen, Denmark, 27–30 August 2019. [Google Scholar]
  41. Echternach, M.; Burk, F.; Köberlein, M.; Herbst, C.T.; Döllinger, M.; Burdumy, M.; Richter, B. Oscillatory Characteristics of the Vocal Folds Across the Tenor Passaggio. J. Voice 2017, 31, 381.e5–381.e14. [Google Scholar] [CrossRef]
  42. Echternach, M.; Burk, F.; Köberlein, M.; Selamtzis, A.; Döllinger, M.; Burdumy, M.; Richter, B.; Herbst, C.T. Laryngeal evidence for the first and second passaggio in professionally trained sopranos. PLoS ONE 2017, 12, e0175865. [Google Scholar] [CrossRef]
  43. Díaz-Cádiz, M.E.; Peterson, S.D.; Galindo, G.E.; Espinoza, V.M.; Motie-Shirazi, M.; Erath, B.D.; Zañartu, M. Estimating Vocal Fold Contact Pressure from Raw Laryngeal High-Speed Videoendoscopy Using a Hertz Contact Model. Appl. Sci. 2019, 9. [Google Scholar] [CrossRef] [Green Version]
  44. Bohr, C.; Kräck, A.; Dubrovskiy, D.; Eysholdt, U.; Švec, J.; Psychogios, G.; Ziethe, A.; Döllinger, M. Spatiotemporal Analysis of High-Speed Videolaryngoscopic Imaging of Organic Pathologies in Males. J. Speech Lang. Hear. Res. 2014, 57, 1148–1161. [Google Scholar] [CrossRef]
  45. Wang, J.S.; Olszewski, E.; Devine, E.E.; Hoffman, M.R.; Zhang, Y.; Shao, J.; Jiang, J.J. Extension and Application of High-Speed Digital Imaging Analysis Via Spatiotemporal Correlation and Eigenmode Analysis of Vocal Fold Vibration Before and After Polyp Excision. Ann. Otol. Rhinol. & Laryngol. 2016, 125, 660–666. [Google Scholar] [CrossRef]
  46. Voigt, D.; Döllinger, M.; Braunschweig, T.; Yang, A.; Eysholdt, U.; Lohscheller, J. Classification of functional voice disorders based on phonovibrograms. Artif. Intell. Med. 2010, 49, 51–59. [Google Scholar] [CrossRef]
  47. Phadke, K.V.; Vydrová, J.; Domagalská, R.; G, Š.J. Evaluation of clinical value of videokymography for diagnosis and treatment of voice disorders. Eur. Arch. Oto-Rhino-Laryngol. 2017, 274, 3941–3949. [Google Scholar] [CrossRef]
  48. Lohscheller, J.; Eysholdt, U. Phonovibrogram visualization of entire vocal fold dynamics. Laryngoscope 2008, 118, 753–758. [Google Scholar] [CrossRef] [PubMed]
  49. Wang, S.G.; Park, H.J.; Lee, B.J.; Lee, S.M.; Ko, B.; Lee, S.M.; Park, Y.M. A new videokymography system for evaluation of the vibration pattern of entire vocal folds. Auris Nasus Larynx 2016, 43, 315–321. [Google Scholar] [CrossRef]
  50. Unger, J.; Lohscheller, J.; Reiter, M.; Eder, K.; Betz, C.; Schuster, M. A Noninvasive Procedure for Early-Stage Discrimination of Malignant and Precancerous Vocal Fold Lesions Based on Laryngeal Dynamics Analysis. Cancer Res. 2015, 75, 31–39. [Google Scholar] [CrossRef] [Green Version]
  51. Roubeau, B.; Henrich, N.; Castellengo, M. Laryngeal Vibratory Mechanisms: The Notion of Vocal Register Revisited. J. Voice 2009, 23, 425–438. [Google Scholar] [CrossRef] [PubMed]
  52. Cveticanin, L. Review on Mathematical and Mechanical Models of the Vocal Cord. J. Appl. Math. 2012, 2012, 928591. [Google Scholar] [CrossRef]
  53. Ishikawa, C.C.; Pinheiro, T.G.; Hachiya, A.; Montagnoli, A.N.; Tsuji, D.H. Impact of Cricothyroid Muscle Contraction on Vocal Fold Vibration: Experimental Study with High-Speed Videoendoscopy. J. Voice 2017, 31, 300–306. [Google Scholar] [CrossRef]
  54. Zhang, Y.; Jiang, J.; Rahn, D.A. Studying vocal fold vibrations in Parkinson’s disease with a nonlinear model. Chaos Interdiscip. J. Nonlinear Sci. 2005, 15, 033903. [Google Scholar] [CrossRef]
  55. Gonzalez, R.C.; Woods, R.E. Image Segmentation, 3rd ed.; Prentice-Hall, Inc.: Upper Saddle River, NJ, USA, 2006; Chapter 10. [Google Scholar]
  56. Sezgin, M.; Sankur, B. Survey over image thresholding techniques and quantitative performance evaluation. J. Electron. Imaging 2004, 13, 146–168. [Google Scholar]
  57. Park, J.M.; Murphey, Y.L. Edge Detection in Grayscale, Color, and Range Images. In Wiley Encyclopedia of Computer Science and Engineering; American Cancer Society: Atlanta, GA, USA, 2008; pp. 1–16. [Google Scholar] [CrossRef]
  58. Hanbury, A. Image Segmentation by Region Based and Watershed Algorithms. In Wiley Encyclopedia of Computer Science and Engineering; American Cancer Society: Atlanta, GA, USA, 2009; pp. 1543–1552. [Google Scholar] [CrossRef] [Green Version]
  59. Duda, R.O.; Hart, P.E.; Stork, D.G. Pattern Classification, 2nd ed.; Wiley-Interscience: New York, NY, USA, 2000. [Google Scholar]
  60. Boykov, Y.; Veksler, O.; Zabih, R. Fast approximate energy minimization via graph cuts. IEEE Trans. Pattern Anal. Mach. Intell. 2001, 23, 1222–1239. [Google Scholar] [CrossRef] [Green Version]
  61. Boykov, Y.; Kolmogorov, V. An Experimental Comparison of Min-Cut/Max-Flow Algorithms for Energy Minimization in Vision. IEEE Trans. Pattern Anal. Mach. Intell. 2004, 26, 1124–1137. [Google Scholar] [CrossRef] [Green Version]
  62. Xu, C.; Pham, D.L.; Prince, J.L. Image segmentation using deformable models. In Handbook of Medical Imaging. Volume 2. Medical Image Processing and Analysis; Spie Press Book: Bellingham, WA, USA, 2000; Volume 2, pp. 175–272. [Google Scholar]
  63. Reddy, B.S.; Chatterji, B.N. An FFT-based technique for translation, rotation, and scale-invariant image registration. IEEE Trans. Image Process. 1996, 5, 1266–1271. [Google Scholar] [CrossRef] [PubMed] [Green Version]
  64. Zitová, B.; Flusser, J. Image registration methods: A survey. Image Vis. Comput. 2003, 21, 977–1000. [Google Scholar] [CrossRef] [Green Version]
  65. Zhu, C.; Lin, X.; Chau, L.P. Hexagon-based search pattern for fast block motion estimation. IEEE Trans. Circuits Syst. Video Technol. 2002, 12, 349–355. [Google Scholar] [CrossRef] [Green Version]
  66. Changsoo, J.; Hyung-Min, P. Optimized hierarchical block matching for fast and accurate image registration. Signal Process. Image Commun. 2013, 28, 779–791. [Google Scholar]
  67. Biemond, J.; Looijenga, L.; Boekee, D.; Plompen, R. A pel-recursive Wiener-based displacement estimation algorithm. Signal Process. 1987, 13, 399–412. [Google Scholar] [CrossRef]
  68. Efstratiadis, S.N.; Katsaggelos, A.K. A model-based pel-recursive motion estimation algorithm. In Proceedings of the IEEE International Conference on Acoustics, Speech, and Signal Processing (ICASSP), Albuquerque, NM, USA, 3–6 April 1990; Volume 4, pp. 1973–1976. [Google Scholar]
  69. Fortun, D.; Bouthemy, P.; Kervrann, C. Optical flow modeling and computation: A survey. Comput. Vis. Image Underst. 2015, 134, 1–21. [Google Scholar] [CrossRef] [Green Version]
  70. Liu, C.; Yuen, J.; Torralba, A. SIFT Flow: Dense Correspondence Across Scenes and Its Applications. IEEE Trans. Pattern Anal. Mach. Intell. 2011, 33, 978–994. [Google Scholar] [CrossRef] [PubMed] [Green Version]
  71. Mehta, D.; Deliyski, D.; Quatieri, T.; Hillman, R. Automated measurement of vocal fold vibratory asymmetry from high-speed videoendoscopy recordings. J. Speech Lang. Hear. Res. 2013, 54, 47–54. [Google Scholar] [CrossRef]
  72. Blanco, M.; Chen, X.; Yan, Y. A Restricted, Adaptive Threshold Segmentation Approach for Processing High-Speed Image Sequences of the Glottis. Engineering 2013, 5, 357–362. [Google Scholar] [CrossRef] [Green Version]
  73. Lohscheller, J.; Toy, H.; Rosanowski, F.; Eysholdt, U.; Dollinger, M. Clinically evaluated procedure for the reconstruction of vocal fold vibrations from endoscopic digital high-speed videos. Med Image Anal. 2007, 11, 400–413. [Google Scholar] [CrossRef]
  74. Pinheiro, A.; Dajer, M.E.; Hachiya, A.; Montagnoli, A.N.; Tsuji, D. Graphical Evaluation of Vocal Fold Vibratory Patterns by High-Speed Videolaryngoscopy. J. Voice 2014, 28, 106–111. [Google Scholar] [CrossRef] [PubMed]
  75. Chen, J.; Gunturk, B.K.; Kunduk, M. Glottis segmentation using dynamic programming. In Proceedings of the Medical Imaging 2013: Image Processing, Lake Buena Vista, FL, USA, 10–12 February 2013; Volume 8669, p. 86693L. [Google Scholar]
  76. Booth, J.R.; Childers, D.G. Automated Analysis of Ultra High-Speed Laryngeal Films. IEEE Trans. Biomed. Eng. 1979, 26, 185–192. [Google Scholar] [CrossRef] [PubMed]
  77. Moukalled, H.J.; Deliyski, D.D.; Schwarz, R.R.; Wang, S. Segmentation of laryngeal high-speed videondoscopy in temporal domain using paired active contours. In Proceedings of the 6th International Workshop, Models and Analysis of Vocal Emissions for Biomedical Applications (MAVEBA), Firenze, Italy, 14–16 December 2009; pp. 137–140. [Google Scholar]
  78. Marendic, B.; Galatsanos, N.; Bless, D. A new active contour algorithm for tracking vibrating vocal fold. In Proceedings of the IEEE International Conference on Image Processing (ICIP), Thessaloniki, Greece, 7–10 October 2001; pp. 397–400. [Google Scholar]
  79. Wittenberg, T.; Moser, M.; Tigges, M.; Eysholdt, U. Recording, processing, and analysis of digital high-speed sequences in glottography. Mach. Vis. Appl. 1995, 8, 399–404. [Google Scholar] [CrossRef]
  80. Palm, C.; Lehmann, T.; Bredno, J.; Neuschaefer-Rube, C.; Klajman, S.; Spitzer, K. Automated analysis of stroboscopic image sequences by vibration profile. In Proceedings of the 5th International Workshop on Advances in Quantitative Laryngology, Voice and Speech Research, Groningen, The Netherlands, 27–28 April 2001. [Google Scholar]
  81. Yan, Y.; Chen, X.; Bless, D. Automatic tracing of vocal-fold motion from high-speed digital images. IEEE Trans. Biomed. Eng. 2006, 53, 1394–1400. [Google Scholar] [CrossRef]
  82. Skalski, A.; Zielinki, T.; Deliyski, D. Analysis of vocal folds movement in high speed videoendoscopy based on level set segmentation and image registration. In Proceedings of the International Conference on Signals and Electronic Systems (ICSES), Kraków, Poland, 14–17 September 2008; pp. 223–226. [Google Scholar]
  83. Zhang, Y.; Bieging, E.; Tsui, H.; Jiang, J.J. Efficient and Effective Extraction of Vocal Fold Vibratory Patterns from High-Speed Digital Imaging. J. Voice 2010, 24, 21–29. [Google Scholar] [CrossRef] [Green Version]
  84. Elidan, G.; Elidan, J. Vocal folds analysis using global energy tracking. J. Voice 2012, 26, 760–768. [Google Scholar] [CrossRef]
  85. Yan, Y.; Du, G.; Zhu, C.; Marriott, G. Snake based automatic tracing of vocal-fold motion from high-speed digital images. In Proceedings of the IEEE International Conference on Acoustics, Speech and Signal Processing (ICASSP), Kyoto, Japan, 25–30 March 2012; pp. 593–596. [Google Scholar]
  86. Andrade-Miranda, G.; Godino-Llorente, J. Glottal Gap tracking by a continuous background modeling using inpainting. Med Biol. Eng. Comput. 2017, 55, 2123–2141. [Google Scholar] [CrossRef]
  87. Demeyer, J.; Dubuisson, T.; Gosselin, B.; Remacle, M. Glottis segmentation with a high-speed glottography: A fully automatic method. In Proceedings of the 3rd Advanced Voice Function Assessment International Workshop, Madrid, Spain, 18–20 May 2009. [Google Scholar]
  88. Osma-Ruiz, V.; Godino-Llorente, J.I.; Sáenz-Lechón, N.; Fraile, R. Segmentation of the glottal space from laryngeal images using the watershed transform. Comput. Med Imaging Graph. 2008, 32, 193–201. [Google Scholar] [CrossRef] [Green Version]
  89. Cerrolaza, J.J.; Osma, V.; Villanueva, A.; Godino, J.I.; Cabeza, R. Full-AutoMatic Glottis Segmentation with active shape Models. In Proceedings of the 7th international workshop, Models and Analysis of Vocal Emissions for Biomedical Applications (MAVEBA), Florence, Italy, 25–27 August 2011; Volume 9, pp. 35–38. [Google Scholar]
  90. Karakozoglou, S.Z.; Henrich, N.; D’Alessandro, C.; Stylianou, Y. Automatic glottal segmentation using local-based active contours and application to glottovibrography. Speech Commun. 2012, 54, 641–654. [Google Scholar] [CrossRef]
  91. Ko, T.; Ciloglu, T. Automatic segmentation of high speed video images of vocal folds. J. Appl. Math. 2014, 2014, 16. [Google Scholar]
  92. Schenk, F.; Urschler, M.; Aigner, C.; Roesner, I.; Aichinger, P.; Bischof, H. Automatic glottis segmentation from laryngeal high-speed videos using 3D active contours. In Proceedings of the Medical Image Understanding and Analysis (MIUA), Egham, UK, 9–11 July 2014; pp. 111–116. [Google Scholar]
  93. Schenk, F.; Aichinger, P.; Roesner, I.; Urschler, M. Automatic high-speed video glottis segmentation using salient regions and 3D geodesic active contours. Ann. BMVA 2015, 2015, 1–15. [Google Scholar]
  94. Andrade-Miranda, G.; Godino-Llorente, J.I.; Moro-Velázquez, L.; Gómez-García, J.A. An automatic method to detect and track the glottal gap from high speed videoendoscopic images. BioMed. Eng. OnLine 2015, 14, 100. [Google Scholar] [CrossRef] [PubMed] [Green Version]
  95. Gloger, O.; Lehnert, B.; Schrade, A.; Volzke, H. Fully Automated Glottis Segmentation in Endoscopic Videos Using Local Color and Shape Features of Glottal Regions. IEEE Trans. Biomed. Eng. 2015, 62, 795–806. [Google Scholar] [CrossRef] [PubMed]
  96. Rao MV, A.; Krishnamurthy, R.; Gopikishore, P.; Priyadharshini, V.; Ghosh, P.K. Automatic Glottis Localization and Segmentation in Stroboscopic Videos Using Deep Neural Network. In Proceedings of the 19th Annual Conference of the International Speech Communication Association (INTERSPEECH), Hyderabad, India, 2–6 September 2018; pp. 3007–3011. [Google Scholar] [CrossRef] [Green Version]
  97. Mendez, A.; Alaoui, E.I.; García, B.; Ibn-Elhaj, E.; Ruiz, I. Glottal space segmentation from motion estimation and gabor filtering. In Proceedings of the Engineering in Medicine and Biology Society, EMBC 2009, Minneapolis, MN, USA, 2–6 September 2009; pp. 1–4. [Google Scholar]
  98. Alaoui, E.I.; Mendez, A.; Ibn-Elhaj, E.; Garcia, B. Keyframes detection and analysis in vocal folds recordings using hierarchical motion techniques and texture information. In Proceedings of the 16th IEEE International Conference on Image Processing (ICIP), Cairo, Egypt, 7–10 November 2009; pp. 653–656. [Google Scholar]
  99. Aghlmandi, D.; Faez, K. Automatic Segmentation of Glottal Space from Video Images Based on Mathematical Morphology and the hough Transform. Int. J. Electr. Comput. Eng. (IJECE) 2012, 2, 223–230. [Google Scholar] [CrossRef]
  100. Andrade-Miranda, G.; Sáenz-Lechón, N.; Osma-Ruiz, V.; Godino-Llorente, J.I. A New Approach for the Glottis Segmentation using snakes. In Proceedings of the International Conference on Bio-inspired Systems and Signal Processing (BIOSIGNALS), Barcelona, Spain, 11–14 February 2013. [Google Scholar]
  101. Chen, X.; Marriott, E.; Yan, Y. Motion saliency based automatic delineation of glottis contour in high-speed digital images. In Proceedings of the 12th IEEE Conference on Industrial Electronics and Applications (ICIEA), Siem Reap, Cambodia, 18–20 June 2017. [Google Scholar]
  102. Türkmen, H.I.; Albayrak, A.; Karsligil, M.E.; Kocak, I. Superpixel-based segmentation of glottal area from videolaryngoscopy images. J. Electron. Imaging 2017, 26, 61608. [Google Scholar]
  103. Naghibolhosseini, M.; Deliyski, D.; Zacharias, S.; Alarcon, A.; Orlikoff, R.F. Temporal Segmentation for Laryngeal High-Speed Videoendoscopy in Connected Speech. J. Voice 2018, 32, 256.e1–256.e12. [Google Scholar] [CrossRef]
  104. Kopczynski, B.; Strumillo, P.; Just, M.; Niebudek-Bogusz, E. Acoustic Based Method for Automatic Segmentation of Images of Objects in Periodic Motion: Detection of vocal folds edges case study. In Proceedings of the 2018 Eighth International Conference on Image Processing Theory, Tools and Applications (IPTA), Xi’an, China, 7–10 November 2018; pp. 1–6. [Google Scholar]
  105. Hamad, A.; Haney, M.; Lever, T.E.; Bunyak, F. Automated Segmentation of the Vocal Folds in Laryngeal Endoscopy Videos Using Deep Convolutional Regression Networks. In Proceedings of the IEEE Conference on Computer Vision and Pattern Recognition (CVPR) Workshops, Long Beach, CA, USA, 16–20 June 2019. [Google Scholar]
  106. Gómez, P.; Semmler, M.; Schützenberger, A.; Bohr, C.; Döllinger, M. Low-light image enhancement of high-speed endoscopic videos using a convolutional neural network. Med Biol. Eng. Comput. 2019, 57, 1451–1463. [Google Scholar] [CrossRef]
  107. Andrade-Miranda, G.; Godino-Llorente, J.I. ROI detection in high speed laryngeal images. In Proceedings of the 11th International Symposium on Biomedical Imaging (ISBI), Beijing, China, 29 April–2 May 2014; pp. 477–480. [Google Scholar]
  108. Birkholz, P. GlottalImageExplorer—An open source tool for glottis segmentation in endoscopic high-speed videos of the vocal folds. In Proceedings of the Studientexte zur Sprachkommunikation: Elektronische Sprachsignalverarbeitung, Leipzig, Germany, 2–4 March 2016. [Google Scholar]
  109. Andrade-Miranda, G. Analyzing of the Vocal Fold Dynamics Using Laryngeal Videos. Ph.D. Thesis, Universidad Politécnica de Madrid, Calle Ramiro de Maeztu, Madrid, Spain, 2017. [Google Scholar]
  110. Švec, J.G.; Šram, F.; Schutte, H.K. Videokymography in Voice Disorders: What to Look For? Ann. Otol. Rhinol. Laryngol. 2007, 116, 172–180. [Google Scholar] [CrossRef]
  111. Švec, J.G.; Schutte, H.K. Kymographic imaging of laryngeal vibrations. Curr. Opin. Otolaryngol. Head Neck Surg. 2012, 20, 458–465. [Google Scholar] [CrossRef]
  112. Kim, G.H.; Lee, Y.W.; Bae, I.H.; Park, H.J.; Wang, S.G.; Kwon, S.B. Usefulness of Two-Dimensional Digital Kymography in Patients with Vocal Fold Scarring. J. Voice 2018, 33, 906–914. [Google Scholar] [CrossRef]
  113. Powell, M.E.; Deliyski, D.D.; Zeitels, S.M.; Burns, J.A.; Hillman, R.E.; Gerlach, T.T.; Mehta, D.D. Efficacy of Videostroboscopy and High-Speed Videoendoscopy to Obtain Functional Outcomes From Perioperative Ratings in Patients With Vocal Fold Mass Lesions. J. Voice 2019. [Google Scholar] [CrossRef] [PubMed]
  114. Švec, J.G.; Schutte, H.K. Videokymography: High-speed line scanning of vocal fold vibration. J. Voice 1996, 10, 201–205. [Google Scholar] [CrossRef]
  115. Schutte, H.K.; Švec, J.G.; Sram, F. First results of clinical application of Videokymography. Laryngoscope 1998, 108, 1206–1210. [Google Scholar] [CrossRef] [PubMed]
  116. Švec, J.G.; Šram, F. Kymographic imaging of the vocal folds oscillations. In Proceedings of the 7th International Conference on Spoken Language Processing, Denver, CO, USA, 16–20 September 2002; Volume 2, pp. 957–960. [Google Scholar]
  117. Neubauer, J.; Mergell, P.; Eysholdt, U.; Herzel, H. Spatio-temporal analysis of irregular vocal fold oscillations: Biphonation due to desynchronization of spatial modes. J. Acoust. Soc. Am. 2001, 110, 3179–3192. [Google Scholar] [CrossRef] [PubMed] [Green Version]
  118. Westphal, L.; Childers, D. Representation of glottal shape data for signal processing. IEEE Trans. Acoust. Speech, Signal Process. 1983, 31, 766–769. [Google Scholar] [CrossRef]
  119. Lohscheller, J.; Eysholdt, U. Phonovibrography: Mapping high-speed movies of vocal fold vibrations into 2-D diagrams for visualizing and analyzing the underlying laryngeal dynamics. IEEE Trans. Med Imaging 2008, 27, 300–309. [Google Scholar] [CrossRef]
  120. Döllinger, M.; Lohscheller, J.; Švec, J.; McWhorter, A.; Kunduk, M. Support Vector Machine Classification of Vocal Fold Vibrations Based on Phonovibrogram Features. In Advances in Vibration Analysis Research; InTech: London, UK, 2011; Chapter 22; pp. 435–456. [Google Scholar]
  121. Li, L.; Galatsanos, N.P.; Bless, D. Eigenfolds: A new approach for analysis of vibrating vocal folds. In Proceedings of the 3rd International Symposium on Biomedical Imaging (ISBI), Washington, DC, USA, 7–10 June 2002. [Google Scholar]
  122. Yan, Y.; Ahmad, K.; Kunduk, M.; Bless, D. Analysis of Vocal-fold Vibrations from High-Speed Laryngeal Images Using a Hilbert Transform-Based Methodology. J. Voice 2005, 19, 161–175. [Google Scholar] [CrossRef]
  123. Zhang, Y.; Jiang, J.J.; Tao, C.; Bieging, E.; MacCallum, J.K. Quantifying the complexity of excised larynx vibrations from high-speed imaging using spatiotemporal and nonlinear dynamic analyses. Chaos Interdiscip. J. Nonlinear Sci. 2007, 17, 1–10. [Google Scholar] [CrossRef]
  124. Unger, J.; Meyer, T.; Herbst, C.; Fitch, W.; Döllinger, M.; Lohscheller, J. Phonovibrographic wavegrams: Visualizing vocal fold kinematics. J. Acoust. Soc. Am. 2013, 133, 1055–1064. [Google Scholar] [CrossRef]
  125. Sakakibara, K.I.; Imagawa, H.; Kimura, M.; Yokonishi, H.; Tayama, N. Modal analysis of vocal fold vibrations using laryngotopography. In Proceedings of the 11th Annual Conference of the International Speech Communication Association (INTERSPEECH), Makuhari, Japan, 26–30 September 2010; pp. 917–920. [Google Scholar]
  126. Chen, G.; Kreiman, J.; Alwan, A. The glottaltopogram: A method of analyzing high-speed images of the vocal folds. Comput. Speech Lang. 2014, 28, 1156–1169. [Google Scholar] [CrossRef]
  127. Andrade-Miranda, G.; Henrich, N.; Godino-llorente, J.I. Synthesizing the motion of the vocal folds using optical flow based techniques. Biomed. Signal Process. Control 2017, 34, 25–35. [Google Scholar] [CrossRef]
  128. Timcke, R.; Von Leden, H.; Moore, P. Laryngeal vibrations: Measurements of the glottic wave. I. The normal vibratory cycle. Arch. Otolaryngol. 1958, 68, 1–19. [Google Scholar] [CrossRef] [PubMed]
  129. Herbst, C.; Unger, J.; Herzel, H.; Švec, J.; Lohscheller, J. Phasegram Analysis of Vocal Fold Vibration Documented With Laryngeal High-speed Video Endoscopy. J. Voice 2016, 30, 771.e1–771.e15. [Google Scholar] [CrossRef] [PubMed]
  130. Ammar, H. Optical flow based waveform for the assessment of the vocal fold vibrations. Australas. Phys. Eng. Sci. Med. 2018, 42, 91–119. [Google Scholar] [CrossRef]
  131. Ahmad, k.; Yan, Y.; Bless, D. Vocal fold vibratory characteristics in normal female speakers from high-speed digital imaging. J. Voice 2012, 26, 239–253. [Google Scholar] [CrossRef]
  132. Patel, R.R.; Forrest, K.; Hedges, D. Relationship Between Acoustic Voice Onset and Offset and Selected Instances of Oscillatory Onset and Offset in Young Healthy Men and Women. J. Voice 2017, 31, 389.e9–389.e17. [Google Scholar] [CrossRef] [Green Version]
  133. Petermann, S.; Kniesburges, S.; Ziethe, A.; Schützenberger, A.; Döllinger, M. Evaluation of Analytical Modeling Functions for the Phonation Onset Process. Comput. Math. Methods Med. 2016, 2016, 10. [Google Scholar] [CrossRef] [Green Version]
  134. Schlegel, P.; Stingl, M.; Kunduk, M.; Kniesburges, S.; Bohr, C.; Döllinger, M. Dependencies and Ill-designed Parameters Within High-speed Videoendoscopy and Acoustic Signal Analysis. J. Voice 2018, 33, 811-e1. [Google Scholar] [CrossRef]
  135. Wurzbacher, T.; Schwarz, R.; Döllinger, M.; Hoppe, U.; Eysholdt, U.; Lohscheller, J. Model-based classification of nonstationary vocal fold vibrations. Model-based classification of nonstationary vocal fold vibrations. J. Acoust. Soc. Am. 2006, 120, 1012–1027. [Google Scholar] [CrossRef]
  136. Tsutsumi, M.; Isotani, S.; Pimenta, R.; Dajer, M.; Hachiya, A.; Tsuji, H.; Tayama, N.; Yokonishi, H.; Imagawa, H.; Yamauchi, A.; et al. High-speed Videolaryngoscopy: Quantitative Parameters of Glottal Area Waveforms and High-speed Kymography in Healthy Individuals. J. Voice 2017, 31, 282–290. [Google Scholar] [CrossRef]
  137. Döllinger, M.; Hoppe, U.; Hettlich, F.; Lohscheller, J.; Schuberth, S.; Eysholdt, U. Vibration parameter extraction from endoscopic image series of the vocal folds. IEEE Trans. Biomed. Eng. 2002, 49, 773–781. [Google Scholar] [CrossRef] [PubMed]
  138. Pinheiro, A.P.; Stewart, D.E.; Maciel, C.D.; Pereira, J.C.; Oliveira, S. Analysis of nonlinear dynamics of vocal folds using high-speed video observation and biomechanical modeling. Digit. Signal Process. 2012, 22, 304–313. [Google Scholar] [CrossRef]
  139. Ishizaka, K.; Flanagan, J.L. Synthesis of Voiced Sounds From a Two-Mass Model of the Vocal Cords. Bell Labs Tech. J. 1972, 51, 1233–1268. [Google Scholar] [CrossRef]
  140. Schwarz, R.; Döllinger, M.; Wurzbacher, T.; Eysholdt, U.; Lohscheller, J. Spatio-temporal quantification of vocal fold vibrations using high-speed videoendoscopy and a biomechanical model. J. Acoust. Soc. Am. 2008, 123, 2717–2732. [Google Scholar] [CrossRef] [PubMed]
  141. Wong, D.; Ito, M.; Cox, N.; Titze, I.R. Observation of perturbations in a lumped-element model of the vocal folds with application to some pathological cases. J. Acoust. Soc. Am. 1991, 89, 383–394. [Google Scholar] [CrossRef] [PubMed]
  142. Döllinger, M.; Gómez, P.; Patel, R.R.; Alexiou, C.; Bohr, C.; Schützenberger, A. Biomechanical simulation of vocal fold dynamics in adults based on laryngeal high-speed videoendoscopy. PLoS ONE 2017, 12, e0187486. [Google Scholar] [CrossRef] [PubMed] [Green Version]
  143. Gómez, P.; Schützenberger, A.; Semmler, M.; Döllinger, M. Laryngeal Pressure Estimation With a Recurrent Neural Network. IEEE J. Transl. Eng. Health Med. 2019, 7, 1–11. [Google Scholar] [CrossRef]
  144. Shaw, H.S.; Deliyski, D.D. Mucosal Wave: A Normophonic Study Across Visualization Techniques. J. Voice 2008, 22, 23–33. [Google Scholar] [CrossRef]
  145. Voigt, D.; Döllinger, M.; Eysholdt, U.; Yang, A.; Gürlen, E.; Lohscheller, J. Objective detection and quantification of mucosal wave propagation. J. Acoust. Soc. Am. 2010, 128, EL347–EL353. [Google Scholar] [CrossRef]
  146. Krausert, C.R.; Olszewski, A.E.; Taylor, L.N.; McMurray, J.S.; Dailey, S.H.; Jiang, J.J. Mucosal Wave Measurement and Visualization Techniques. J. Voice 2011, 25, 395–405. [Google Scholar] [CrossRef] [Green Version]
  147. Krasnodebska, P.; Szkielkowska, A.; Miaśkiewicz, B.; Wlodarczyk, E.; Domeracka-Kolodziej, A.; Skarżyński, H. Objective measurement of mucosal wave parameters in diagnosing benign lesions of the vocal folds. Logoped. Phoniatr. Vocol. 2018, 1–6. [Google Scholar] [CrossRef] [PubMed]
  148. Kaneko, M.; Shiromoto, O.; Fujiu-Kurachi, M.; Kishimoto, Y.; Tateya, I.; Hirano, S. Optimal Duration for Voice Rest After Vocal Fold Surgery: Randomized Controlled Clinical Study. J. Voice 2017, 31, 97–103. [Google Scholar] [CrossRef] [PubMed]
  149. Li, L.; Zhang, Y.; Maytag, A.L.; Jiang, J.J. Quantitative Study for the Surface Dehydration of Vocal Folds Based on High-Speed Imaging. J. Voice 2015, 29, 403–409. [Google Scholar] [CrossRef] [PubMed]
  150. Regner, M.F.; Robitaille, M.J.; Jiang, J.J. Interspecies comparison of mucosal wave properties using high-speed digital imaging. Laryngoscope 2010, 120, 1188–1194. [Google Scholar] [CrossRef] [PubMed]
  151. Herbst, C.T.; Švec, J.G.; Lohscheller, J.; Frey, R.; Gumpenberger, M.; Stoeger, A.S.; Fitch, W.T. Complex vibratory patterns in an elephant larynx. J. Exp. Biol. 2013, 216, 4054–4064. [Google Scholar] [CrossRef] [PubMed] [Green Version]
  152. Elemans, C.P.H.; Rasmussen, J.H.; Herbst, C.T.; Düring, D.N.; Zollinger, S.A.; Brumm, H.; Srivastava, K.H.; Svane, N.; Ding, M.; Larsen, O.N.; et al. Universal mechanisms of sound production and control in birds and mammals. Nat. Commun. 2015, 6, 8978. [Google Scholar] [CrossRef] [PubMed] [Green Version]
  153. Herbst, C.T. Biophysics of Vocal Production in Mammals. In Vertebrate Sound Production and Acoustic Communication; Springer International Publishing: Cham, Switzerland, 2016; pp. 159–189. [Google Scholar]
  154. Lindestad, P.A.; Södersten, M.; Merker, B.; Granqvist, S. Voice Source Characteristics in Mongolian “Throat Singing” Studied with High-Speed Imaging Technique, Acoustic Spectra, and Inverse Filtering. J. Voice 2001, 15, 78–85. [Google Scholar] [CrossRef]
  155. Borch, D.Z.; Sundberg, J.; Lindestad, P.A.; Thalén, M. Vocal fold vibration and voice source aperiodicity in ‘dist’ tones: A study of a timbral ornament in rock singing. Logoped. Phoniatr. Vocol. 2004, 29, 147–153. [Google Scholar] [CrossRef]
  156. Andrade-Miranda, G.; Bernardoni, N.H.; Godino-Llorente, J.I. A new technique for assessing glottal dynamics in speech and singing by means of optical-flow computation. In Proceedings of the 16th Annual Conference of the International Speech Communication Association (INTERSPEECH), Dresden, Germany, 6–10 September 2015; pp. 2182–2186. [Google Scholar]
  157. Gelin, L.; Haiqing, L.; Qian, H.; Zhen, J. Distinct Acoustic Features and Glottal Changes Define Two Modes of Singing in Peking Opera. J. Voice 2018, 33, 583-e9. [Google Scholar]
  158. Garnier, M.; Henrich, N.; Crevier-Buchman, L.; Vincent, C.; Smith, J.; Wolfe, J. Glottal behavior in the high soprano range and the transition to the whistle register. J. Acoust. Soc. Am. 2012, 131, 951–962. [Google Scholar] [CrossRef] [Green Version]
  159. Echternach, M.; Döllinger, M.; Sundberg, J.; Traser, L.; Richter, B. Vocal fold vibrations at high soprano fundamental frequencies. J. Acoust. Soc. Am. 2013, 133, EL82–EL87. [Google Scholar] [CrossRef] [PubMed] [Green Version]
  160. Echternach, M.; Dippold, S.; Richter, B. High-speed imaging using rigid laryngoscopy for the analysis of register transitions in professional operatic tenors. Logoped. Phoniatr. Vocol. 2014, 41, 1–8. [Google Scholar] [CrossRef] [PubMed]
  161. Echternach, M.; Högerle, C.; Köberlein, M.; Schlegel, P.; Döllinger, M.; Richter, B.; Kainz, M.A. The Effect of Nasalance on Vocal Fold Oscillation Patterns During the Male Passaggio. J. Voice 2019. [Google Scholar] [CrossRef] [PubMed]
  162. Herbst, C.T.; Ternström, S.; Švec, J.G. Investigation of four distinct glottal configurations in classical singing—A pilot study. J. Acoust. Soc. Am. 2009, 125, EL104–EL109. [Google Scholar] [CrossRef] [PubMed] [Green Version]
  163. Herbst, C.T.; Hess, M.; Müller, F.; Švec, J.G.; Sundberg, J. Glottal Adduction and Subglottal Pressure in Singing. J. Voice 2015, 29, 391–402. [Google Scholar] [CrossRef] [PubMed]
  164. Braunschweig, T.; Flaschka, J.; Schelhorn-Neise, P.; Döllinger, M. High-speed video analysis of the phonation onset, with an application to the diagnosis of functional dysphonias. Med. Eng. Phys. 2008, 30, 59–66. [Google Scholar] [CrossRef] [PubMed]
  165. Volgger, V.; Felicio, A.; Lohscheller, J.; Englhard, A.S.; Al-Muzaini, H.; Betz, C.S.; Schuster, M.E. Evaluation of the combined use of narrow band imaging and high-speed imaging to discriminate laryngeal lesions. Lasers Surg. Med. 2017, 49, 609–618. [Google Scholar] [CrossRef]
  166. Kim, G.H.; Wang, S.G.; Lee, B.J.; Park, H.J.; Kim, Y.C.; Kim, H.S.; Sohn, K.T.; Kwon, S.B. Real-time dual visualization of two different modalities for the evaluation of vocal fold vibration–Laryngeal videoendoscopy and 2D scanning videokymography: Preliminary report. Auris Nasus Larynx 2017, 44, 174–181. [Google Scholar] [CrossRef]
  167. Sommer, D.E.; Tokuda, I.T.; Peterson, S.D.; Sakakibara, K.I.; Imagawa, H.; Yamauchi, A.; Nito, T.; Yamasoba, T. Estimation of inferior-superior vocal fold kinematics from high-speed stereo endoscopic data in vivo. J. Acoust. Soc. Am. 2014, 136, 3290–3300. [Google Scholar] [CrossRef]
  168. Luegmair, G.; Mehta, D.D.; Kobler, J.B.; Döllinger, M. Three-Dimensional Optical Reconstruction of Vocal Fold Kinematics Using High-Speed Video with a Laser Projection System. IEEE Trans. Med Imaging 2015, 34, 2572–2582. [Google Scholar] [CrossRef] [Green Version]
  169. Semmler, M.; Kniesburges, S.; Birk, V.; Ziethe, A.; Patel, R.; Döllinger, M. 3D Reconstruction of Human Laryngeal Dynamics Based on Endoscopic High-Speed Recordings. IEEE Trans. Med Imaging 2016, 35, 1615–1624. [Google Scholar] [CrossRef] [PubMed]
  170. Kumar, S.P.; Švec, J.G. Kinematic model for simulating mucosal wave phenomena on vocal folds. Biomed. Signal Process. Control 2019, 49, 328–337. [Google Scholar] [CrossRef]
  171. Salzmann, M.; Hartley, R.; Fua, P. Convex Optimization for Deformable Surface 3-D Tracking. In Proceedings of the 2007 IEEE 11th International Conference on Computer Vision, Rio de Janeiro, Brazil, 14–20 October 2007; pp. 1–8. [Google Scholar] [CrossRef]
  172. Wedel, A.; Cremers, D. Stereo Scene Flow for 3D Motion Analysis, 1st ed.; Springer Publishing Company, Incorporated: Berlin/Heidelberg, Germany, 2011. [Google Scholar]
  173. Munder, S.; Gavrila, D.M. An Experimental Study on Pedestrian Classification. IEEE Trans. Pattern Anal. Mach. Intell. 2006, 28, 1863–1868. [Google Scholar] [CrossRef] [PubMed]
  174. Viola, P.; Jones, M. Rapid object detection using a boosted cascade of simple features. In Proceedings of the 2001 IEEE Computer Society Conference on Computer Vision and Pattern Recognition, CVPR 2001, Kauai, HI, USA, 8–14 December 2001; Volume 1, p. I. [Google Scholar] [CrossRef]
  175. Ojala, T.; Pietikäinen, M.; Harwood, D. A comparative study of texture measures with classification based on featured distributions. Pattern Recognit. 1996, 29, 51–59. [Google Scholar] [CrossRef]
  176. Dalal, N.; Triggs, B. Histograms of oriented gradients for human detection. In Proceedings of the 2005 IEEE Computer Society Conference on Computer Vision and Pattern Recognition (CVPR’05), San Diego, CA, USA, 20–25 June 2005; Volume 1, pp. 886–893. [Google Scholar] [CrossRef] [Green Version]
  177. Liang, C.W.; Juang, C.F. Moving object classification using local shape and HOG features in wavelet-transformed space with hierarchical SVM classifiers. Appl. Soft Comput. 2015, 28, 483–497. [Google Scholar] [CrossRef]
  178. Goodfellow, I.; Bengio, Y.; Courville, A. Deep Learning; MIT Press: Cambridge, MA, USA, 2016. [Google Scholar]
Figure 1. Sketch of different methods used for objective voice assessment. (Acoustics) Recording of the audio signal with a sonogram of an ascending vocal glissando. (Aerodynamics) Voice assessment using an air-rate meter, adapted from [9,10]. (Laryngeal Imaging) Recording of the vocal folds oscillations via a rigid endoscope. (Electroglottography) Noninvasive measurement of vocal folds contact area by electrodes applied on the surface of the neck during phonation.
Applsci 10 01556 g001
Figure 2. Illustration of the stroboscopic sampling. Adapted from [27]. (1) and (3) are the rigid and flexible endoscope, respectively; (2) are the vocal folds; (4) represents the real vibratory pattern; (5) illustrates the strobe light; (6) is the estimated version of the vibratory pattern.
Applsci 10 01556 g002
Figure 3. Illustrations of the Laryngeal High-Speed Videoendoscopy (HSV) sampling effect for two different frame rates. Adapted from [27].
Applsci 10 01556 g003
Figure 4. Graphical illustration of the procedure followed to extract glottal features from vocal folds motion during phonation. First row shows the coronal view of the vocal folds; second row represents the top view of the vocal folds obtained from the Laryngeal Videostroboscopy (VS)or HSV recording; third row depicts the glottal segmentation; and fourth row illustrates the glottal area waveform (GAW) playback.
Applsci 10 01556 g004
Figure 5. Laryngeal image sequence with its respective notation. (Left side) laryngeal image sequence I ( x , t ) ; (right side) single image I ( x , y ) .
Applsci 10 01556 g005
Figure 6. Graphic Representation of the three common steps followed to segment the glottal gap.
Applsci 10 01556 g006
Figure 7. Visual comparison between three different enhancement methods. (a) original images extracted from three different videos; (b) enhancement method based on anisotropic with FFT-filter [97]; (c) enhancement method based on Contrast Limited Adaptive Histogram Equalization (CLAHE) [90]; (d) enhancement method based on nonlinear transformation [82].
Applsci 10 01556 g007
Figure 8. Automatic ROI detection of six different HSV computed based on [94,107]. The image in (f) illustrates a minor problem in the detection of the ROI in the posterior commissure.
Applsci 10 01556 g008
Figure 9. Eight Facilitative Playbacks (FP) proposed in the literature. Vocal Folds Trajectories (VFT), High-Speed Digital Kymograghy (DKG), Glottal Area Waveform (GAW), Glottal Optical Flow Waveform (GOFW), High-Speed Digital Kymograghy (DKG), Glottovibrogram (GVG), Mucosal Wave Kymography (MKG), Optical Flow Kymogram (OFKG), Phonovibrogram (PVG), Glottaltopogram (GTG), illustrated on the same highspeed sequence.
Applsci 10 01556 g009
Figure 10. Schematical drawing of the successive phases of a glottal cycle in three views. First row: frontal section of the vocal folds. Second row: laryngoscopy (top view of the vocal folds). Third row: DKG at the line y j . Adapted from [116].
Applsci 10 01556 g010
Figure 11. Illustration of the VFT playback. First row: the image sequence of one glottal cycle. Second row: vocal folds trajectories, DKG and DKG+VFT playbacks of five glottal cycles.
Applsci 10 01556 g011
Figure 12. Illustration of the GAW playback. First row: six images of a particular glottal cycle length. Second row: GAW playback normalized within the interval [0,1] where 0 represents the minimum area and 1 the maximum area.
Applsci 10 01556 g012
Figure 13. Schematic representation of the PVG playback. (1) Segmentation; (2) Resampling of the extracted vocal folds edges; (3) Computation of vocal folds deflections δ s e g l , r ( p c , t k ) ; (4) Splitting of the glottal axis; (5) Virtual turning of the left fold; (6) Color coding of the vocal fold deflections; (7) I P V G ( x , y ) representing a HSV with five glottal cycles. Adapted from [48].
Applsci 10 01556 g013
Figure 14. Schematic representation of the GVG playback. (1) Segmentation; (2) Resampling of the extracted vocal folds edges; (3) Computation of vocal fold deflections δ G V G ( p c , t k ) ; (4) I G V G ( x , y ) representing an HSV with five glottal cycles.
Applsci 10 01556 g014
Figure 15. Illustration of potential difficulties while processing laryngeal images during phonation. (a) Contrast. (b) Orientation. (c) Overexposure. (d) Hemorrhage. (e) Nodule. (f) Oclussion.
Applsci 10 01556 g015
Table 1. Summary of the main semi-automatic studies carried out to segment the glottal gap. First column corresponds to the authors. Second, year of publication. Third, enhancement technique. Fourth, Region of Interest (ROI) detection. Fifth, segmentation algorithm. Sixth, laryngeal image modalities.
AuthorYearEnhancementROIGlottal Gap
Delimitation
Modalities
Booth and Childers [76]1979--Subtraction and
adaptive window
HSV
Wittenberg et al. [79]1995--Region GrowingHSV
Larsson et al. [11]2000Contrast
enhancement
Motion Estimation
and manual ROI
Edge-BasedHSV
Palm et al. [80]2001-Manual ROIParametric and
Deformable Shape
SV
Marendic et al. [78]2001-Manual ROIParametric ModelsHSV
Yan et al. [81]2006-Manual ROIThresholding
Region Growing
HSV
Lohscheller et al. [73]2007-Seed pointsRegion GrowingSV
HSV
Skalski et al. [82]2008Nonlinear
transformation
SubtractionGeometric ModelsHSV
Moukalled et al. [77]2009Histogram
Thresholding
Manual p ( t ) , a ( t )
commissure
Parametric ModelsHSV
Zhang et al. [83]2010Lagrange
interpolation
Manual ROIDifferentiation
Edge-Based
HSV
Elidan and Elidan [84]2012--Parametric ModelsSV
Yan et al. [85]2012-Manual ROIParametric ModelsHSV
Mehta et al. [71]2013-Manual p ( t ) , a ( t )
commissure
ThresholdingHSV
Blanco et al. [72]2013-SubtractionThresholdingHSV
Chen et al. [75]2013Reflection
removal
Manual p ( t ) , a ( t )
commissure
Simplified Dynamic
Programming
HSV
Pinheiro et al. [74]2014-Seed pointsRegion GrowingHSV
Andrade-Miranda et al. [86]2017Specularity
removal
Total intensity
variation
Background
modeling
HSV
Table 2. Summary of the main automatic studies carried out to segment the glottal gap. First column corresponds to the authors. Second, year of publication. Third, enhancement technique. Fourth, ROI detection. Fifth, segmentation algorithm. Sixth, laryngeal image modalities.
AuthorYearEnhancementROIGlottal Gap
Delimitation
Modalities
Osma-Ruiz et al. [88]2008--WatershedSV
Mendez et al. [97]2009Anisotropic
FFT-filter
Motion EstimationMotion EstimationSV
Alaoui et al. [98]2009-Motion EstimationMotion EstimationSV
Cerrolaza et al. [89]2011--Deformable
Shape Models
SV
Aghlmandi and Faez [99]2012Nonlinear
transformation
-Morphological
Operators
HSV
Karakozoglou et al. [90]2012CLAHEMorphological
ROI
Geometric ModelsHSV
Andrade-Miranda et al. [100]2013Anisotropic
Thresholding
-Parametric ModelsSV
Ko and Ciloglu [91]2014Reflectance
modeling
Intensity
variation
Gaussin
Mixture Models
HSV
Andrade-Miranda et al. [94]2015Nonlinear
transformation
Total intensity
variation
Watershed and
Geometric Models
HSV
Gloger et al. [95]2015--Training
clasification
SV
HSV
Schenk et al. [93]2015Color contrast
stretching
Salient regionGeometric ModelsHSV
Chen et al. [101]Chen2017--Saliency
network
HSV
Türkmen et al. [102]2017Contrast
enhancement
-Superpixel-Based
algorithm
HSV
Naghibolhosseini et al. [103]2018--Gradient-based
algorithm
HSV
Rao MV et al. [96]2018--Deep Neural
Network
SV
Kopczynski et al. [104]2018--Adaptive thresholding
GVG Spectrum
HSV
Hamad et al. [105]2019--Deep Neural
Network
SV
Table 3. Summary of the main methods to objectively and subjectively assess the vocal fold segmentation. First column corresponds to the authors. Second, metrics and baseline methods used for the comparison. Third, subjective assessment methods.
AuthorObjective AssessmentSubjective Assessment
MetricsBaseline
Lohscheller et al. [73]Tracking
points
GT5 point-scale
Osma-Ruiz et al. [88]PrattGT-
Cerrolaza et al. [89]PERGT-
Karakozoglou et al. [90]PERGT5 point-scale
Andrade-Miranda et al. [100]PrattGT-
Ko and Ciloglu [91]MSEGT, [81]-
Pinheiro et al. [74]GAW differenceGT-
Andrade-Miranda et al. [94]Pratt
OCE
GT5 point-scale
Glover et al. [95]DICE
MAE
GT-
Schenk et al. [92]DICE[73]-
Turkmen et al. [102]F-M, TNR, DICE
MI, RI, OR
Active contours
Region Growing
-
Andrade-Miranda et al. [86]ARI, DICE,
KAP, Pratt
GT, [73]
[94]
5 point-scale
playback-based
Rao MV et al. [96]DICEGT-
Hamad et al. [105]IOU, RI, ACC
DICE, HAD
GT-
Table 4. Summary of the main studies that synthesise the vocal folds dynamics in FP.
AuthorYearPlaybackDynamics
Timcke et al.1958Glottal Area Waveform (GAW)Global
Westphal and Childers1983Glottal shape Data Representation (GSD)Global
Švec and Schutte1996Videokymography (VKG)Local
Palm et al.2001Vibration Profiles (VP)Global
Neubauer et al.2001Empirical Orthogonal Eigenfunctions Analysis (EOF)Global
Li et al.2002Eigenfolds Analysis (EFA)Global
Yan et al.2005Hilbert Transform Analysis (HTA)Global
Zhang et al.2007Two-Dimension Spatiotemporal Series Analysis (2D-STSA)Global
Lohscheller et al.2007Vocal Folds Trajectories (VFT)Local
Deliyski et al.2008Mucosal Wave Kymography (MKG)Local
Lohscheller and Eysholdt2008Phonovibrogram (PVG)Global
Sakakibara et al.2010Laryngotopography (LGT)Global
Karakozoglou et al.2012Glottovibrogram (GVG)Global
Unger et al.2013Phonovibrographic Wavegram (PVG-wavegram)Global
Ikuma et al.2013Waveform Decomposition Analysis (WDA)Global
Chen et al.2014Glottaltopogram (GTG)Global
Herbst et al.2016Phasegram Analysis (PGAW)Global
Andrade-Miranda et al.2017Glottal Optical Flow Waveform (GOFW)Global
Andrade-Miranda et al.2017Optical Flow Kymogram (OFKG)Local
Andrade-Miranda et al.2017Optical Flow Glottovibrogram (OFGVG)Global
Kopczynski et al.2018Glottocorrelogram (GCG)Global
Ammar2018Optical Flow Based Waveform (OFW)Local

