Article

Growing Biofuel Feedstocks in Copper-Contaminated Soils of a Former Superfund Site

1
Department of Civil, Environmental and Ocean Engineering, Stevens Institute of Technology, Hoboken, NJ 07030, USA
2
Department of Biological Sciences, Michigan Technological University, Houghton, MI 49931, USA
*
Author to whom correspondence should be addressed.
Appl. Sci. 2020, 10(4), 1499; https://doi.org/10.3390/app10041499
Submission received: 21 January 2020 / Revised: 18 February 2020 / Accepted: 19 February 2020 / Published: 22 February 2020

Abstract

:
Copper mining in the Upper Peninsula of Michigan in the mid-19th century generated millions of tons of mining waste, called stamp sand, which was deposited into various offshoots of Lake Superior. The toxic stamp sand converted the area into barren, fallow land. Without a vegetative cover, stamp sand has been eroding into the lakes, adversely affecting aquatic life. Our objective was to perform a greenhouse study, to grow cold-tolerant oilseed crops camelina (Camelina sativa) and field pennycress (Thlaspi arvense) on stamp sand, for the dual purpose of biofuel production and providing a vegetative cover, thereby decreasing erosion. Camelina and field pennycress were grown on stamp sands in columns, using compost to supply nutrients. A greenhouse study in wooden panels was also done to evaluate the effectiveness of camelina in reducing erosion. Results show that camelina significantly reduced erosion and can also be used commercially for generating biodiesel. A 25-fold reduction in Cu content in the surface run-off was observed in the panels with camelina compared to those of the control. Stamp sand-grown camelina seeds contained 20% and 22.7% oil and protein respectively, and their fatty acid composition was similar to previous studies performed on uncontaminated soils.

Graphical Abstract

1. Introduction

Mining activities during the mid-19th and early 20th centuries in the Upper Peninsula of Michigan have led to widespread copper (Cu) contamination of the environment [1,2]. Several million metric tons of mine tailings, known as stamp sand, were produced by crushing native rocks containing Cu by a process called stamping [1,2]. From 1868 to 1968, about 200 million metric tons of stamp sand were deposited into the Torch Lake, which is a part of the Keweenaw waterway, connected by Portage Lake to Lake Superior. Eventually, the contaminated sediments from the lake were dredged and discarded by the mining companies on the lake shores, which converted these areas into barren, waste lands [2].
High incidences of tumors were reported in Torch Lake fishes, which led to a fish consumption advisory by the Michigan Department of Public Health (MDPH) in 1983 [3,4]. The United States Environmental Protection Agency (USEPA) applied a hazard ranking system to the Torch Lake site [5], and fourteen areas in Houghton County, Michigan were classified as the Torch Lake Superfund site [6]. The USEPA developed a remediation plan for the Torch Lake Superfund site, which included growing a vegetative cap on stamp sand surrounding the Torch Lake to prevent erosion [7]. However, the vegetative cover failed in many areas because of Cu toxicity, low water holding capacity, and nutrient deficiency of the stamp stand. Lack of vegetative cover has resulted in the continued erosion of stamp sand into the lake, which adversely affects the aquatic communities.
In order to restore the Torch Lake site, we examined the feasibility of growing cold-tolerant, native oilseed crops, camelina (Camelina sativa), and field pennycress (Thlaspi arvense) on stamp sand. Our goal is to develop an inexpensive and sustainable method to establish a vegetative cover on the Torch Lake shores, to reduce stamp sand erosion and contaminant transport into the Torch Lake. The added benefit of using oilseed crops would be the production of biodiesel. In an earlier paper, we reported a lab incubation study, where we determined that the addition of compost to stamp sand improved its potential to support plant growth [8]. Our results showed that compost amendment resulted in a significant increase in the nitrogen (N), phosphorus (P), and organic matter (OM) content of stamp sand. Here, we report a greenhouse study carried out in two phases. In phase I, a six-month long column experiment was conducted to investigate the impact of plant cover on the fate and geochemical partitioning of Cu. Stamp sand was amended with compost at four different rates, and camelina and field pennycress pants were grown in columns for 6 months. On the basis of phase I results, a phase II study was conducted for six months using larger wooden panels to measure copper loss by leaching and surface runoff. A panel containing stamp sand, planted with camelina was compared to that of an unplanted panel. In addition to measuring Cu uptake and loss, yield and quality of oil extracted from camelina seeds grown in stamp sand was measured. The objectives of the study are:
  • To evaluate the effect of compost and plant cover on the fate and geochemical partitioning of Cu.
  • To measure the effect of compost and plant cover on erosion of stamp sand.
  • To assess the quality of the oil extracted from the seeds of camelina grown on contaminated stamp sand.

2. Materials and Methods

2.1. Soil Sampling, Preparation, and Characterization

Stamp sand was collected from the soil surface (0–15 cm depth) in 19 kg Poly Vinyl Chloride (PVC) buckets from Hubbell/Tamarack site near Torch Lake, Upper Peninsula of Michigan. About 450 kg of stamp sand were collected in 24 buckets to be used for greenhouse column and panel studies. Air-dried and sieved (2 mm) soil was used for the determination of pH, electrical conductivity (EC), soil moisture, and OM content using standard protocols [9]. Plant-available P was extracted by Mehlich III solution [10]. Total Cu, Fe, Al, and P were determined by acid digestion according to USEPA Method 3050B [11]. The acid digests were analyzed in Inductively Coupled Plasma—Mass Spectroscopy (ICP-MS). The soil texture analysis was conducted using the pipette method [12].

2.2. Study Design and Soil Amendments—Phase I Column Studies

The stamp sand was sieved through a 2.0 mm sieve. Compost was obtained from a local nursery in Clifton, NJ, USA. Compost was added at rates of 0,25 (2.5%), 50 (5%), 100 (10%), and 200 g (20%) per kg of stamp sand. A total of 33 columns were used for the 6-month long greenhouse study. The columns were 40 cm in length and 15 cm in diameter, made from PVC pipes. In each column, 3.5 kg of stamp sand were used. The lower 6 inches of the columns were filled with uncontaminated play sand. The stamp sand was mixed thoroughly with different rates of compost. The amended stamp sands were placed on the top of play sand. The stamp sand in the columns was maintained at 75% water holding capacity and equilibrated for 10 days in the greenhouse. After 10 days, 20 seeds of camelina or field pennycress were sown in each of the columns. The plants were irrigated as required. Each column was connected to a 1 L bottle to collect leachate. The greenhouse was maintained at 25 °C during the experiment, with 16 h light/8 h dark cycle.
The soil samples were collected every 30 days and analyzed for Cu and in ICP-MS. The leachates were collected and analyzed every 30 days for dissolved Cu. The crops were harvested at maturity (after the formation of seeds). Plant, soil, and leachate samples were also collected before harvesting of the plants at the end of the 6-month experiment. The plant samples (excluding seeds) were washed and dried in an oven at 65 °C for 3 days. Plants were separated into roots, stems, leaves, pods, and seeds, and the dry matter yields were recorded. The oven dried plant samples, soil samples, and leachates were analyzed for Cu in ICP-MS by USEPA Method 3050B [11].

2.3. Study Design and Soil Amendments—Phase II Panel Study

A greenhouse panel study was conducted in two large wooden panels measuring 122 cm (length) × 91 cm (width) × 31 cm (depth). The panels had an internal slope of 10 degrees and were connected to a PVC pipe at the bottom of the panel. The PVC pipe was connected to a 30 L tote to collect the surface runoff. Three openings along the bottom of the panel were fitted with Nalgene tubing to collect leachate in a 30 L tote. The compost was first air-dried, then added at a rate of 100 g/kg (10% of stamp sand) to the wooden panels
The stamp sand and compost were sieved through a 2.0 mm sieve. The lower 13 cm of a panel was filled with 10 bags (22.7 kg each) of uncontaminated play sand. The stamp sand was mixed thoroughly with compost. The amended stamp sand was poured uniformly onto the top of play sand in the panels. The amended soil was equilibrated for a month, maintaining 75% water holding capacity. Then, seeds of camelina were sown in one panel and the other panel was left bare to act as a control. The plants were irrigated as needed and maintained in the greenhouse at 25 °C during the experiment, with 16 h light/8 h dark cycle for 6 months.
The surface runoff and leachates were collected by simulating a rainfall event every two months. For collecting surface runoff, the panels were sprayed with water by keeping two shower heads over the panel, ensuring uniform distribution simulating rainfall. The time duration of each rainfall simulation event, pressure, and discharge of water was kept constant for all the three rainfall simulation events. Seeds were harvested from camelina at maturity and weighed. The surface runoff and leachates were analyzed for dissolved Cu, turbidity, and Total Suspended Solids (TSS).
Camelina plants were harvested at maturity after the formation of seeds. The soil, runoff and leachate samples were collected before harvesting the plants. The plants were separated into roots, shoots, pods, and seeds. The plant samples were washed and dried in an oven at 65 °C for 3 days. The dry matter yield of each plant part was recorded separately. The oven dried plant samples, soil samples, surface runoff, and leachates were analyzed for Cu in ICP-MS by USEPA Method 3050B [11].

2.4. Organic Matter, Carbon, and Nitrogen Analysis

The OM content was measured in the samples by loss on ignition method [13]. Total C and total N were measured in samples using a Perkin Elmer 2400 CHN analyzer [14].

2.5. Oil Content and Quality Analysis

The oil, protein, and moisture content of camelina seeds was analyzed by Nuclear Magnetic Resonance Spectrometry (NMR), a non-destructive technology, by the seed laboratory of the International Seed Testing Association (ISTA) of Oregon State University, Corvallis, Oregon. After the NMR analysis, the seeds were used for analyzing the complete fatty acid profile by SGS North America Inc., Agricultural Services, St. Rose, Louisiana.

2.6. Statistical Analysis

The data were statistically analyzed using the statistical software JMP version 10 [15]. Means were compared by Tukey Kramer-HSD test (α = 0.05) to test for significant difference among different levels of compost and plant cover.

3. Results and Discussion

3.1. Properties of Stamp Sand and Compost

The properties of the stamp sand and compost are shown in Table 1. The stamp sand was slightly alkaline (8.2) in nature, whereas the compost had a near neutral pH (6.9). The stamp sand had an electrical conductivity (EC) of 83 µS/cm, whereas compost had an EC of 1840 µS/cm. Stamp sands had an OM content of 0.5% whereas compost had OM content of 84%.
The stamp sand is sandy in texture with 95% sand, and 2.5% each of silt and clay. The Cu concentrations in stamp sand and compost were 719 and 54 mg/kg, respectively. The concentrations of total iron (Fe) and aluminum (Al) in stamp sand were 6200 and 2300 mg/kg, respectively. Stamp sand had total and plant available P contents of 800 and 0.7 mg/kg, respectively. Total and plant available P in compost was 2090 and 1009 mg/kg, respectively. The N content in stamp sand and compost was 1.81 and 388 g/kg, respectively. The remediation work done by USEPA on the Torch Lake superfund site in 2005 [7] may have increased the total P content of the stamp sand. However, as evidenced from the Mehlich 3 results (Table 1), a very small fraction of that total P is plant available (less than 0.1%); the rest of the P in stamp sand is in bound forms and not available to plants.
Our data show that stamp sand is lacking in N, P, and OM. Previous studies have reported that the application of compost can be beneficial for the improvement of soil quality in sandy soils [16]. However, an added impairment in stamp sand was the presence of high concentration of Cu. Camelina is known to be a hardy oilseed crop that can be grown on marginal land unsuitable for cultivation. Camelina is resistant to drought, cold, and pests [17] and can adapt to a variety of environments. Although not known to be metal tolerant, field pennycress is cold-tolerant and is used as a winter cover to reduce soil erosion and nutrients leaching [18,19]. There are few studies related to the heavy metal tolerance of these two species when grown in conjunction with beneficial soil amendments such as compost. Heavy metal toxicity has been reported extensively for several oilseed crops including other Brassicaceae family plants to which both camelina and field pennycress belong. Heavy metals, such as Cu, are known to limit seed germination in Indian mustard and result in decreased growth and metabolism and oxidative damage [20]. Soil amendments such as compost, biochar, biosolids, and manure, which contain a high amount of OM can help increase nutrient content of the soil in addition to decreasing plant availability of metals and help in revegetation of contaminated sites [21]. Walker et al. [22] reported a decreased uptake of Cu by Indian mustard in soils treated with compost.

3.2. Phase I: Greenhouse Column Study

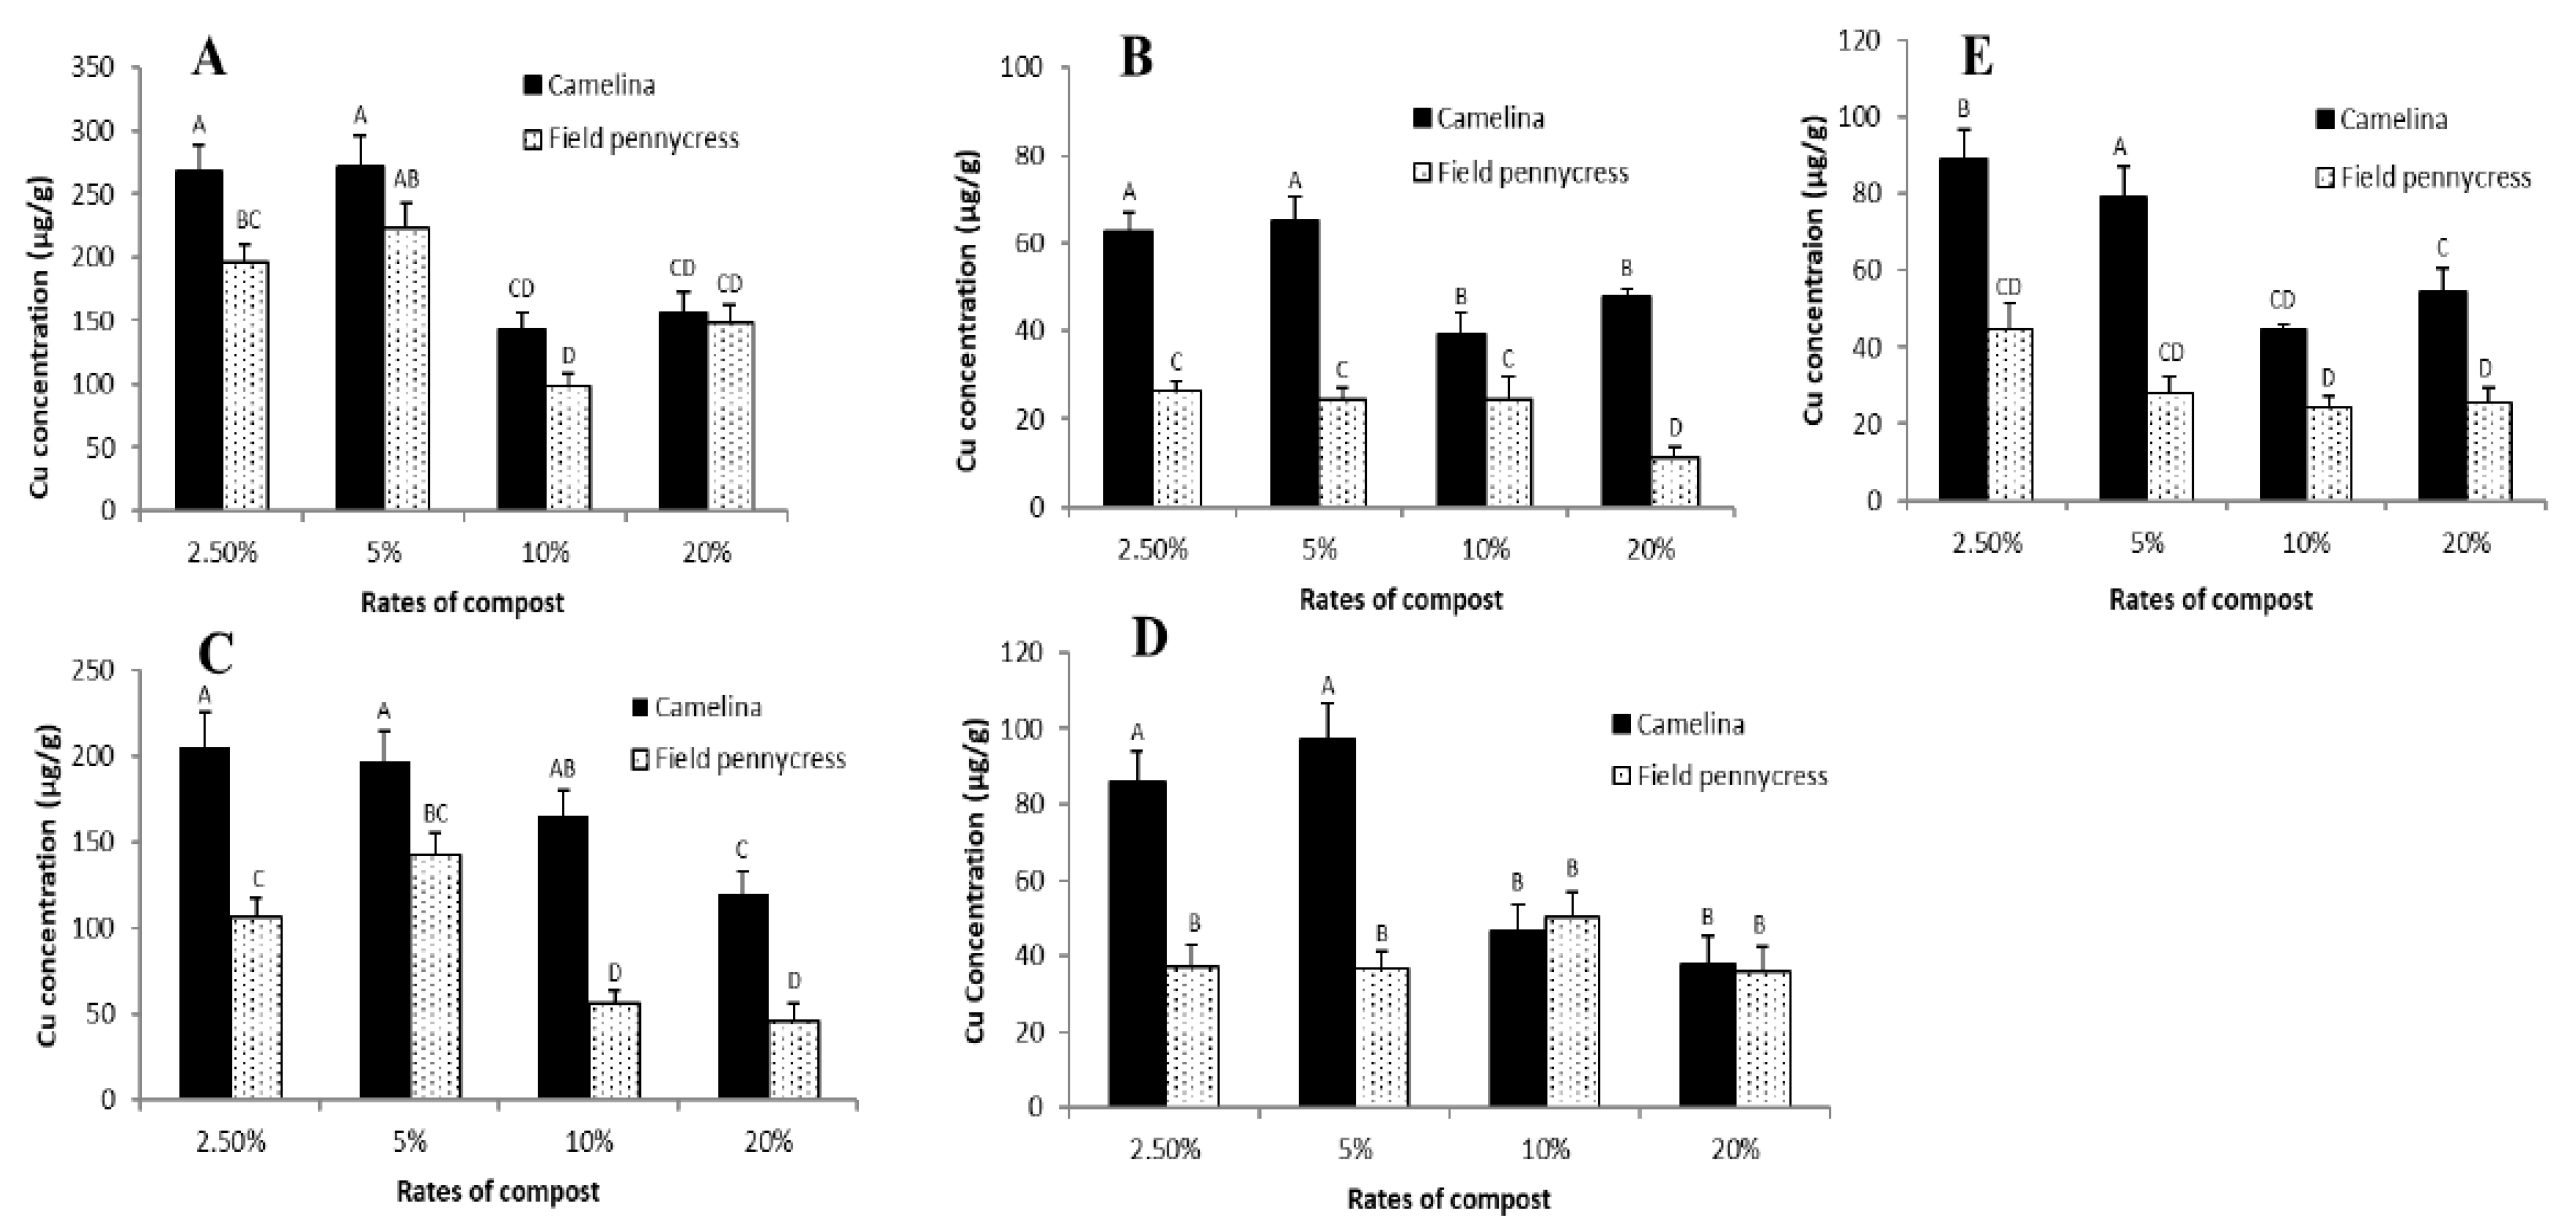
3.2.1. Cu Distribution in Plants (Camelina and Field Pennycress)

Cu concentration (µg/g) in roots of camelina and field pennycress (Figure 1A) was significantly higher at low rates of compost (2.5% and 5%) as compared to those of the higher rates (10% and 20%). In the case of camelina, Cu concentration in roots was higher than that of field pennycress at all rates of compost and significantly higher at the compost rate of 2.5%.
Similarly, Cu concentrations (µg/g) in stems of camelina (Figure 1B) were significantly higher at low rates of compost (2.5% and 5%) compared to those of the higher rates (10% and 20%). In case of field pennycress, Cu concentrations in stems (Figure 1B) were similar at compost rates of 2.5%, 5%, and 10% but were significantly higher than at the maximum compost rate (20%). In stems of camelina, Cu concentration was significantly higher than in stems of field pennycress at all rates of compost.
Cu concentrations (µg/g) in leaves of camelina (Figure 1C) were similarly higher at low rates of compost (2.5% and 5%) than high rates of compost (10% and 20%). Cu concentration in leaves of camelina at the maximum compost rate was significantly less than in camelina leaves at other rates of compost (2.5%, 5%, and 10%). In the case of field pennycress, Cu concentrations in leaves (Figure 1C) at low compost rates (2.5% and 5%) were significantly higher than in leaves at high compost rates (10% and 20%). In leaves of camelina, Cu concentration was significantly higher than in leaves of field pennycress at all rates of compost.
Cu concentrations (µg/g) in pods of camelina (Figure 1D) were significantly higher in low rates of compost (2.5% and 5%) than high rates of compost (10% and 20%). In the case of field pennycress, Cu concentrations in pods (Figure 1D) were almost same at compost rates of 2.5%, 5%, and 20% but Cu concentration was higher at the compost rate of 10%. In pods of camelina, Cu concentration was significantly higher than in pods of field pennycress at low rates of compost (2.5% and 5%).
Cu concentrations (µg/g) in seeds of camelina (Figure 1E) were significantly higher at lower rates of compost (2.5% and 5%) than at higher rates of compost (10% and 20%). Cu concentration in seeds of camelina at the lowest rate of compost was significantly higher than at other compost rates. In the case of field pennycress, Cu concentrations in seeds (Figure 1E) were almost the same at compost rates of 5%, 10%, and 20% but Cu concentration was higher in compost rate of 2.5%. In seeds of camelina, Cu concentration was significantly higher than in seeds of field pennycress at all rates of compost except 10%. Overall, Cu concentration was highest in roots, closely followed by leaves in camelina and field pennycress. Pods, seeds and stem in camelina and field pennycress contained very low levels of Cu. Overall, metal uptake in both plants declined with increasing compost rates, which is similar to previous reports [21].

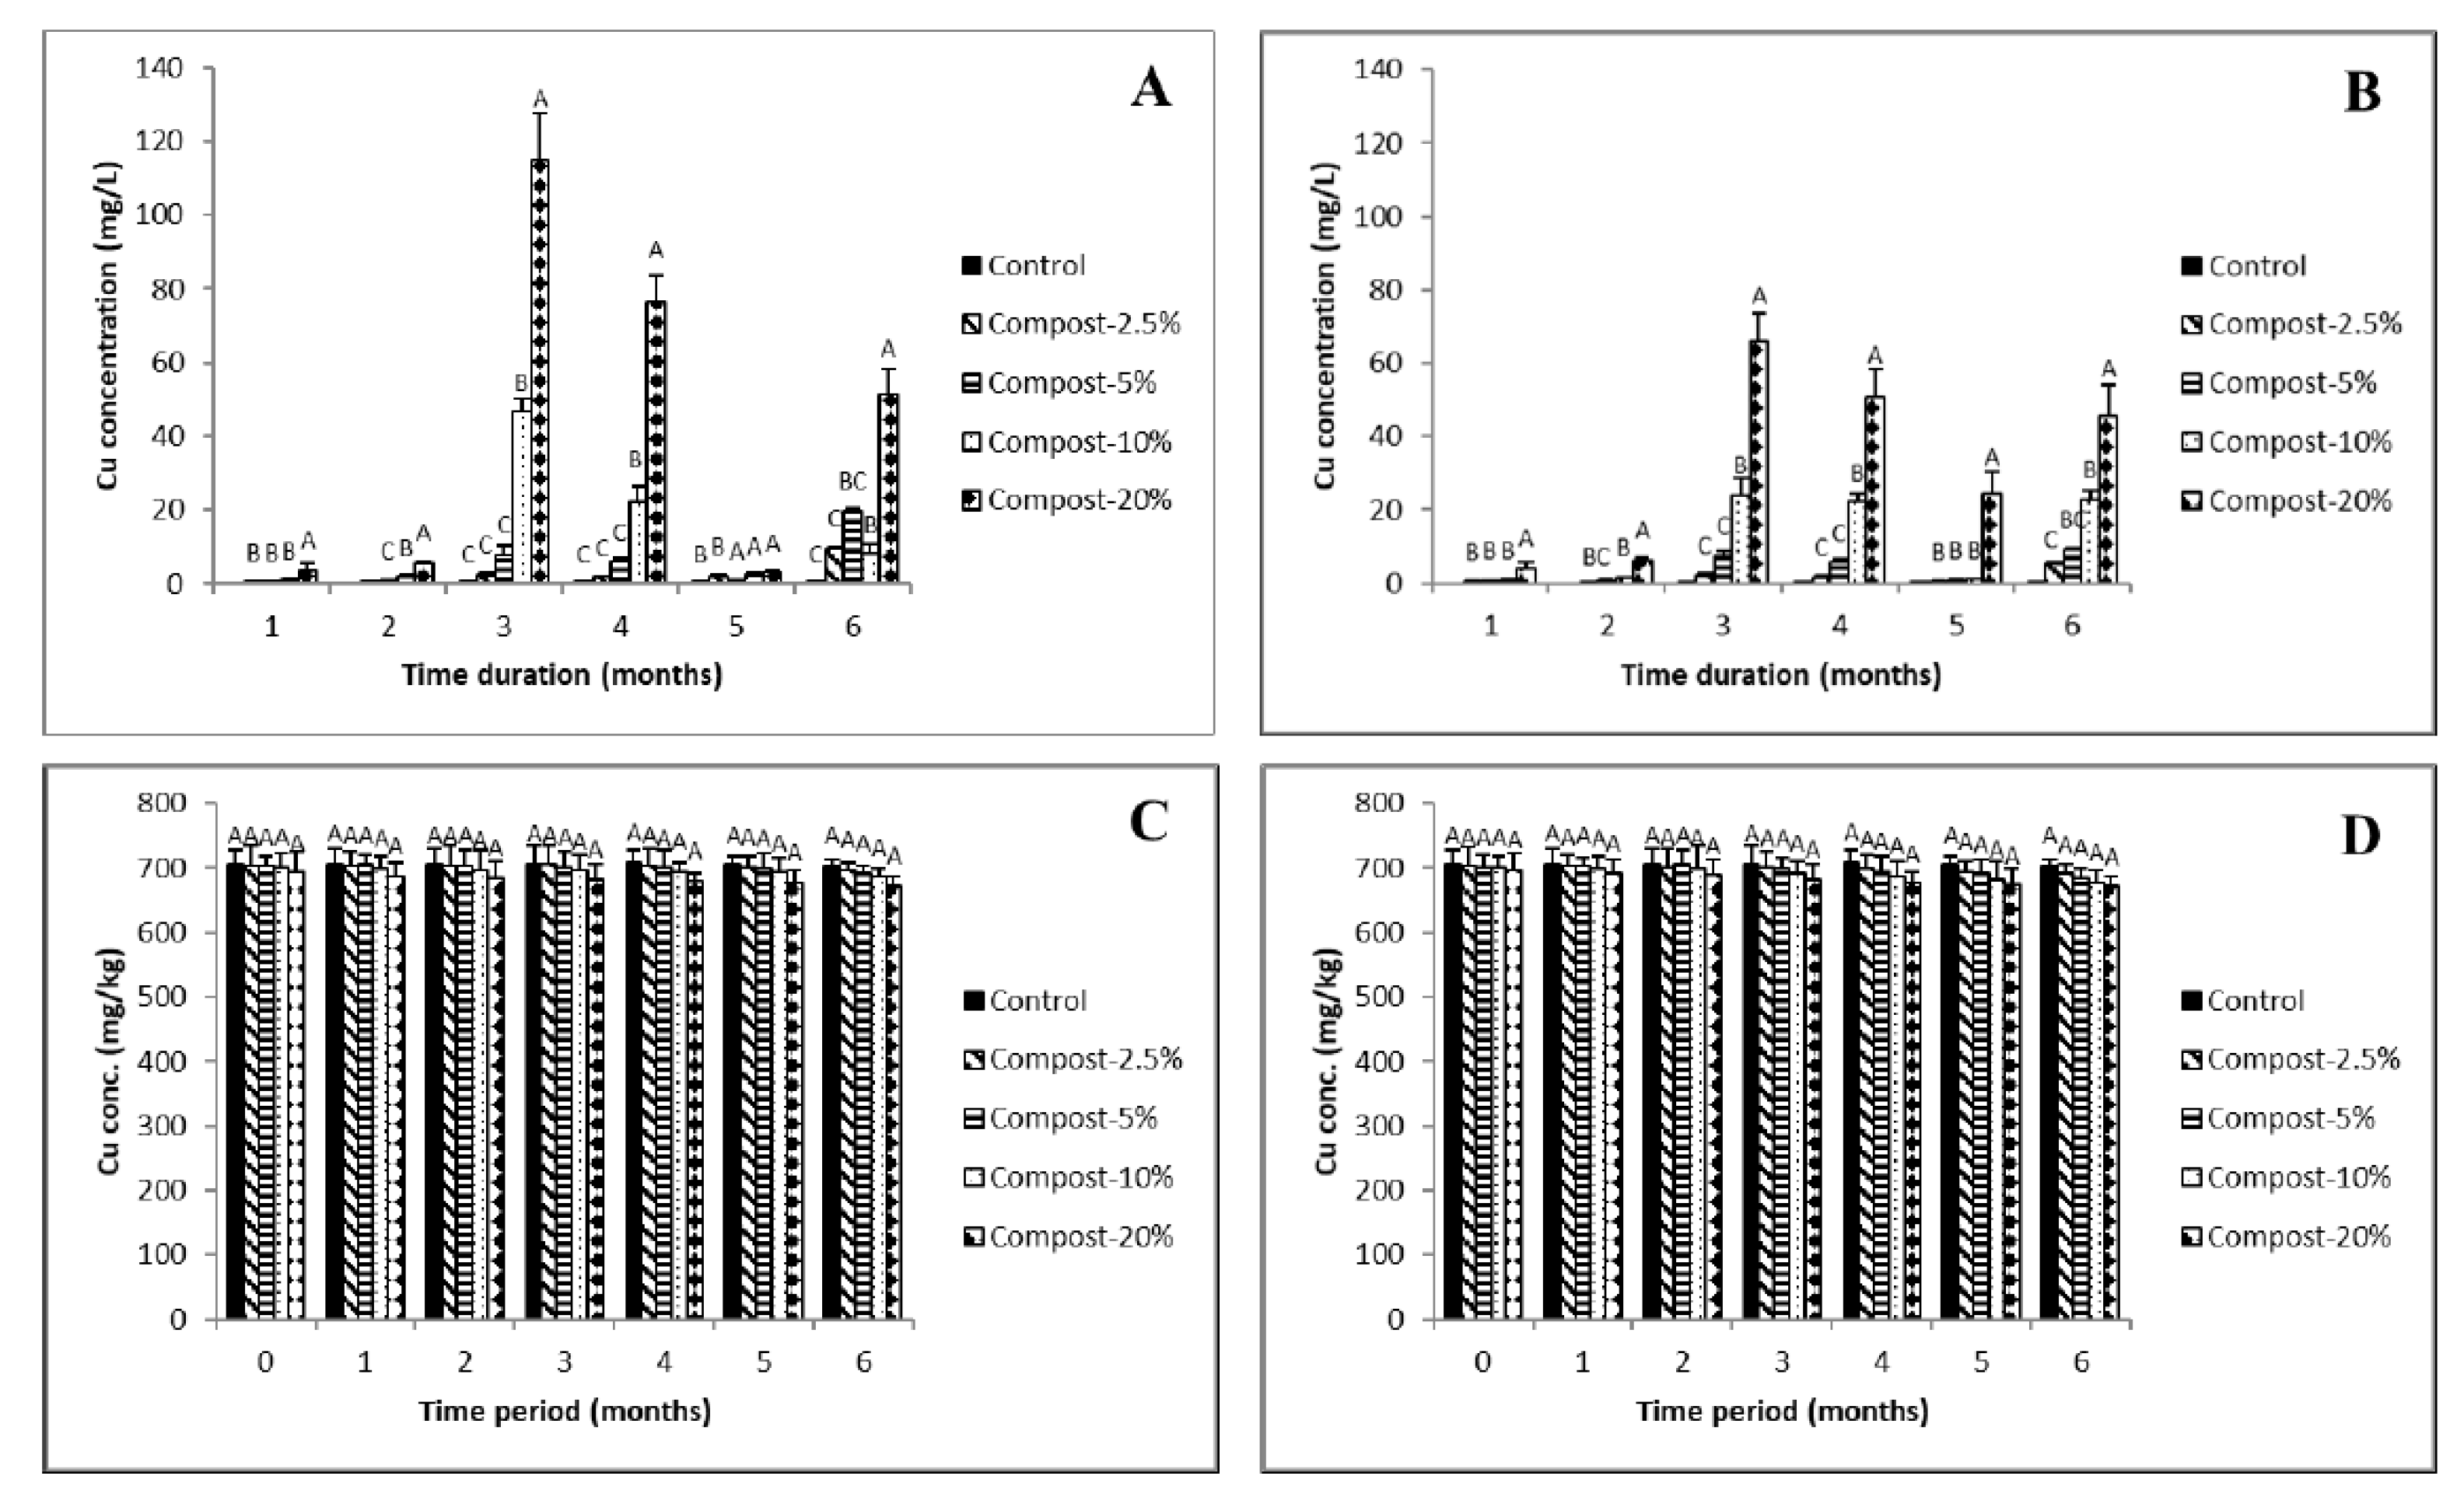
3.2.2. Cu Distribution in Leachates and Soil

In columns planted with camelina, dissolved Cu concentration (mg/L) was maximum and significantly higher in the leachates from columns amended with 20% compost, followed by 10%, 5%, 2.5% compost, and control (Figure 2A). Concentration of Cu in the leachates from columns planted with camelina in the first two months was small but increased subsequently and became highest in the third month and decreased thereafter. The highest Cu concentration in leachate was 115 mg/L in columns planted with camelina, amended at 20% compost, in the third month (Figure 2A). In field pennycress columns, dissolved Cu concentration (mg/L) followed a similar trend, with highest leaching in columns containing 20% compost, followed by those of 10%, 5%, 2.5% compost, and control (Figure 2B). Furthermore, Cu concentration in leachates from columns of field pennycress in the first two months was quite small but increased subsequently and became highest in the third month and decreased thereafter. The highest Cu concentration in leachate was 66 mg/L from columns amended with 20% compost, planted with field pennycress in the third month (Figure 2B). Cu concentration (mg/kg) in soil in all the columns (control, camelina and field pennycress; Figure 2 C,D) did not differ significantly during the study period.

3.2.3. Plant Growth in the Greenhouse Column Study

The total plant biomass of camelina increased with increasing compost rates with significant yield increases in columns with compost rates of 10% and 20%. The dry weight of roots increased with the increase in compost rate (except that of 10%) but the increase was not statistically significant across different compost rates (Table 2). The dry weight of stems increased with increasing compost rates, and the increase was significant at compost rates of 10% and 20%. For leaves, the dry weight of increased with increasing compost rates and the increase was significant at the maximum compost rate of 20%. The dry weight of pods and seeds did not show any specific trend with increasing compost rates, but the maximum and significant increase was observed in camelina plants at the compost rate of 10%.
The total plant biomass of field pennycress increased with increasing compost rates, with significant yield increases in columns with compost rates of 10% and 20%. In roots and leaves, the dry weight increased significantly with increase in compost rate in columns with compost rates of 10% and 20% (Table 2). The dry weight of the stems, pods, and seeds also increased with increasing compost rates, but the increase was significant only in columns with the maximum compost rate of 20%.

3.2.4. Mass Balance of Cu in Greenhouse Column Study

As shown in Table 3, there was no increase in Cu content in pods and seeds of camelina grown with increasing compost rates. However, the total Cu content in camelina plants increased with the increasing compost rate. Stem and leaves showed increasing Cu content with increase in the compost rate (Table 3). In the case of field pennycress, the overall Cu content (µg) in roots, stems, and leaves increased with the increase in compost rate (except a decrease in stem and leaves, at 10% compost rate). In seeds, Cu content increased at 10% and 20% compost rates.
In both camelina and field pennycress, leaves had the highest Cu content, followed by stems, roots, pods, and seeds (Table 3). Seeds had the least amount of Cu in both camelina and field pennycress. Total plant Cu content in all treatments combined was 1.30 mg and 1.31 mg, respectively. Cu content (mg) in leachates increased with increasing compost rate in both camelina and field pennycress planted columns (Table 3). However, the total amount of Cu leached was small. The total amount of Cu in leachates in all compost rates combined was 203 mg and 165 mg, respectively. As shown in Table 3, the majority of the Cu remained in the stamp sand, although small amounts of Cu loss occurred in the leachate.
Several studies have demonstrated that compost generated from biomass can be successfully used to improve soil nutrient levels and water holding capacity. Composts may bind heavy metals in soil by changing the pH and providing more sorption sites for binding heavy metals [23]. There are also reports of composts mobilizing metals, due to the presence of dissolved OM that can form soluble complexes with metals [24]. Increase in microbial population, due to increased nutrients and carbon, due to compost amendment and plant growth, may result in the degradation of OM, resulting in the mobilization of metals. Previous reports have shown that the amendment of soils with organic compost having high dissolved organic carbon (DOC) resulted in increased metal leaching [25]. Beesley et al. [25] showed that while biochar and green waste compost added to acidic soil increased the mobilization of Cu, the leaching of Cu gradually decreased with age. However, if the pH of the soil mixture increased with the addition of the amendment, the leaching of heavy metals decreased [25]. Our results show that Cu concentration in leachate increased with increasing compost levels in both camelina and field pennycress planted columns (Table 3). Uptake by camelina and field pennycress plants were low, most of which remained in the leaves, with a negligible amount of Cu in the seeds. However, most of the Cu remained in the stamp sand. For the six-month experimental period, out of the total Cu in the stamp sand, 8% and 6.7% Cu leached out of the camelina and field pennycress columns, respectively, at the 20% compost amendment rate, whereas at the 10% rate, the corresponding amounts were 2.6% and 2.3%, respectively (Table 3). The total percentage of Cu taken up by camelina and field pennycress were 0.04% of the total Cu at 20% compost rate and 0.02% at the compost 10% rate.

3.3. Phase II: Greenhouse Panel Study

On basis of the results of the column study, a greenhouse panel study was designed to obtain a better understanding of the effectiveness of plant cover in preventing erosion of stamp sand. In this phase, we chose the 10% compost amendment rate, as this rate was the most effective in enhancing plant growth, while not causing any substantial Cu mobilization, as observed by the leaching and uptake results (Table 3). Camelina was chosen as the cover plant.

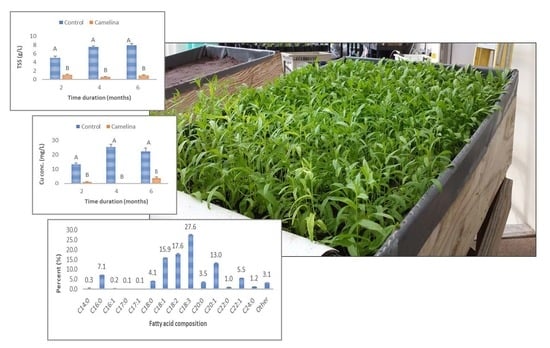
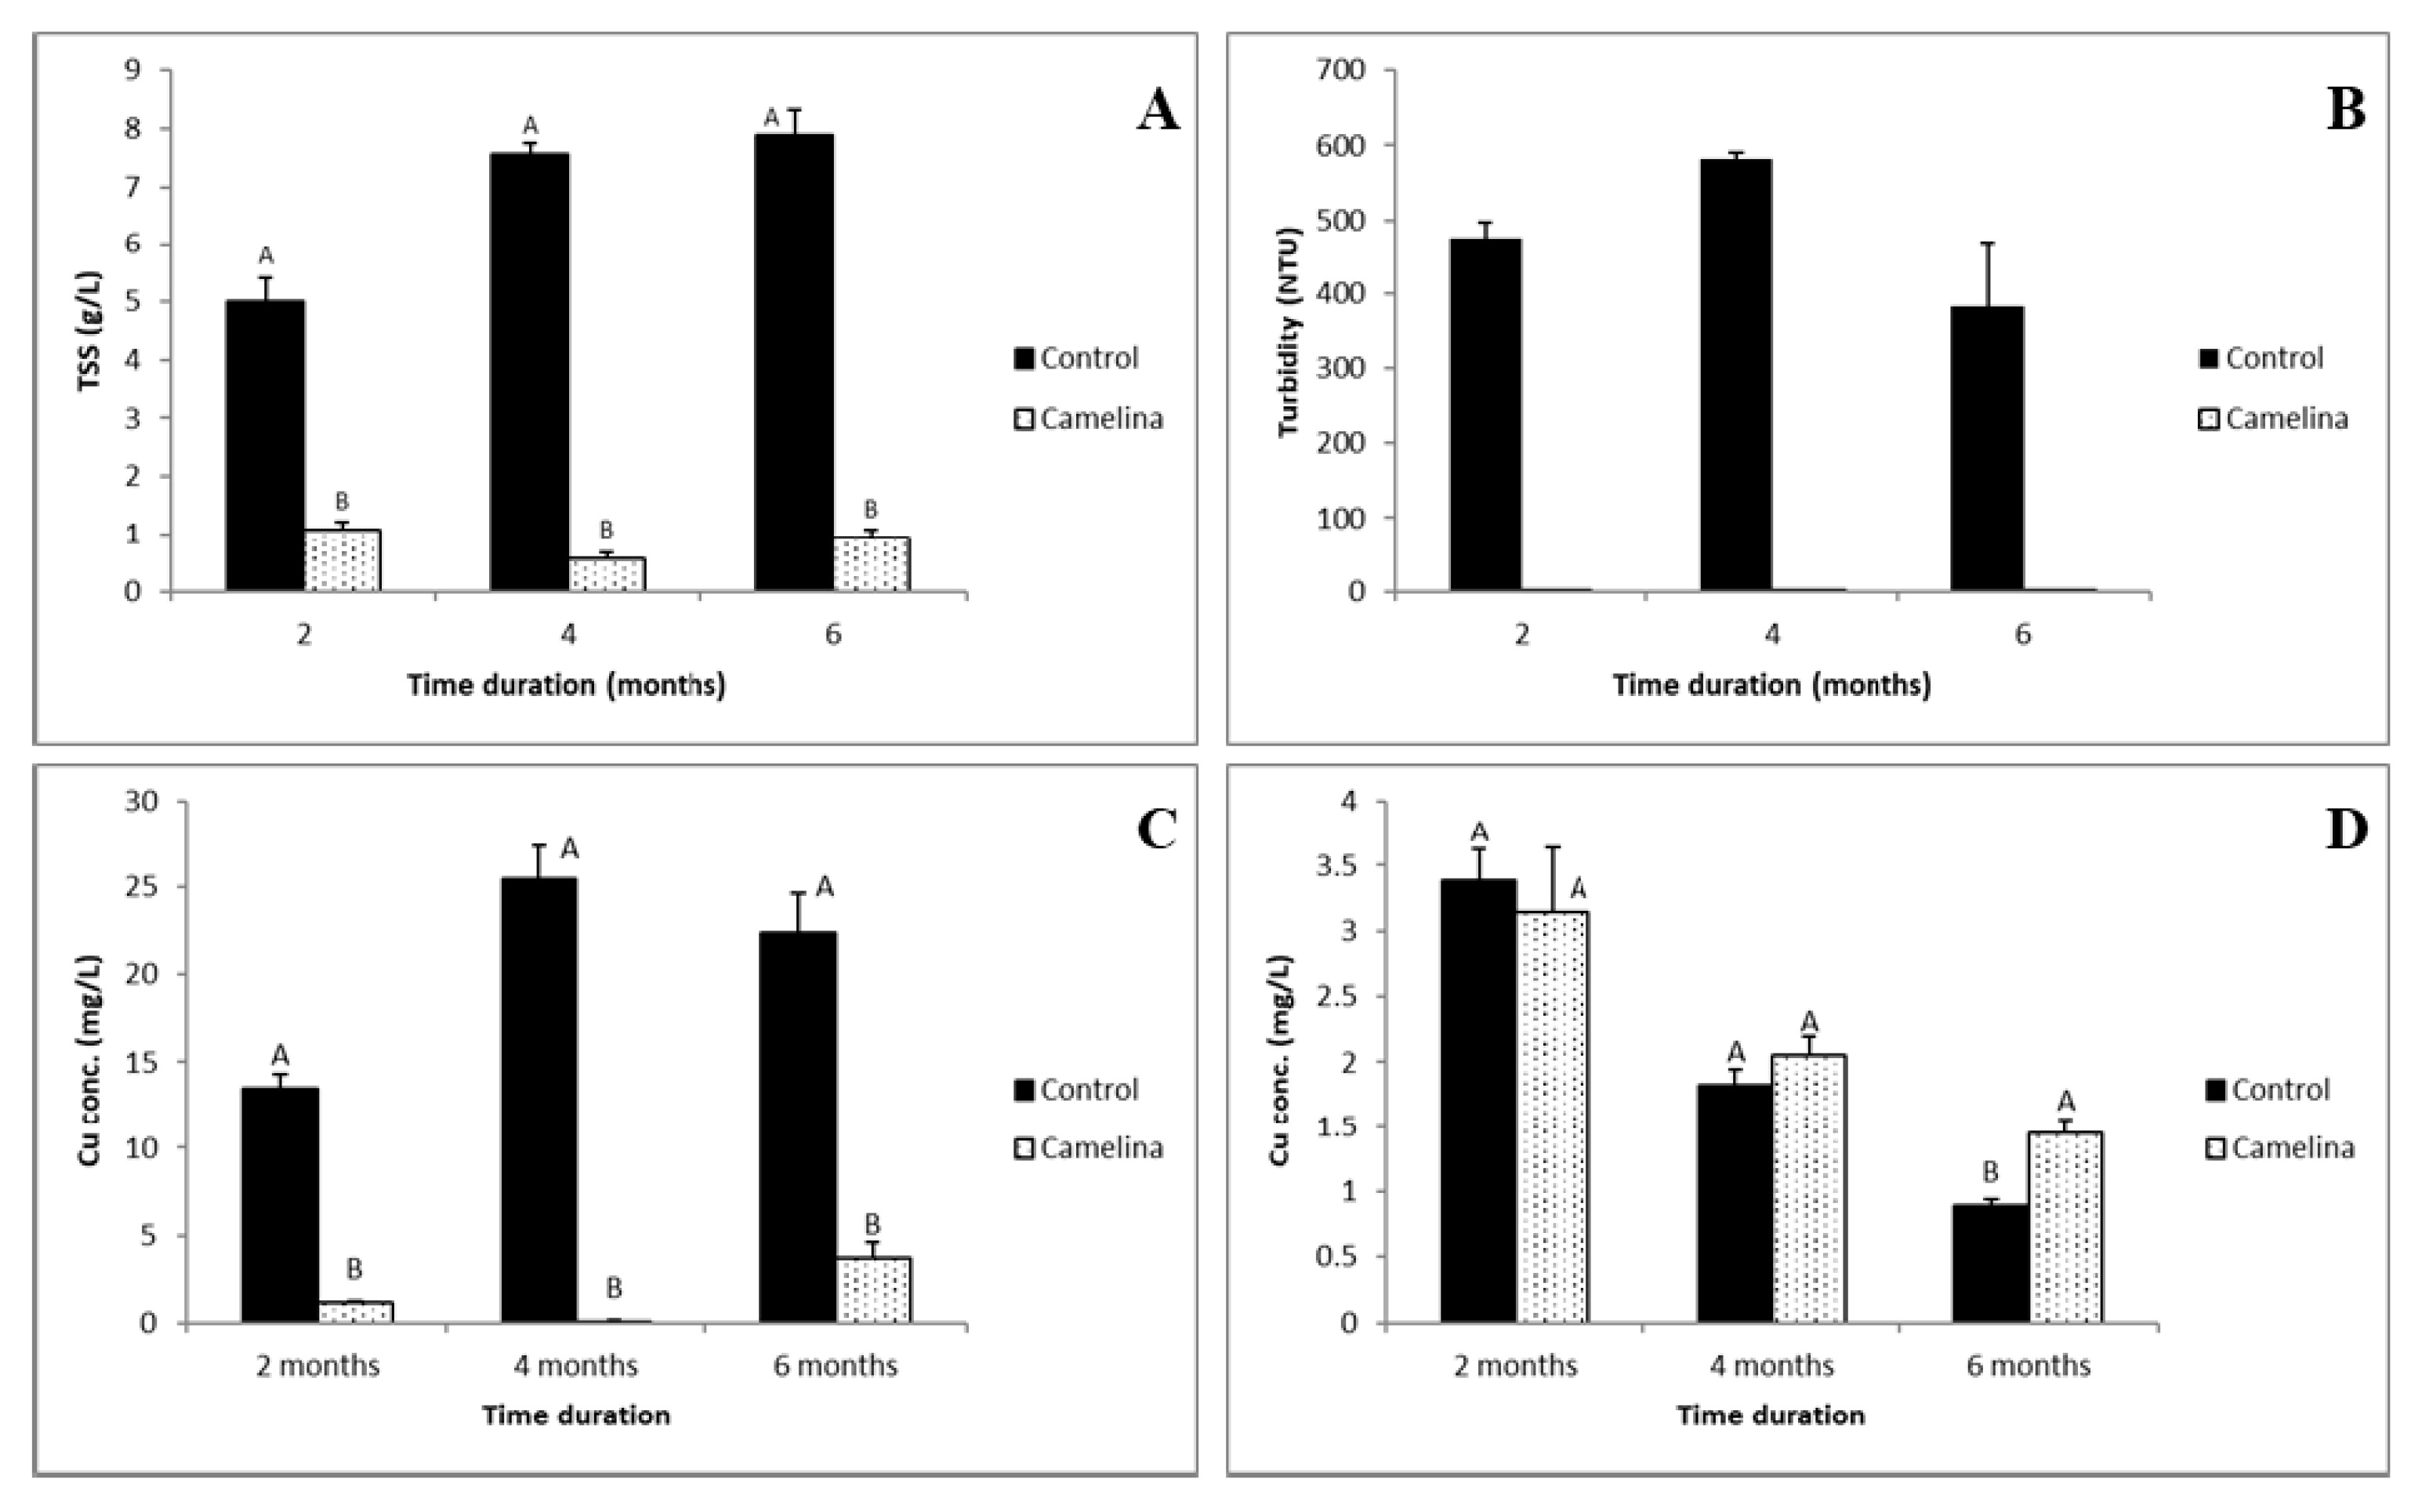
3.3.1. Total Suspended Solids (TSS) and Turbidity in Surface Runoff

Total suspended solids (TSS; g/L) were significantly higher in the three surface runoff samples collected at two-month intervals in the control panel with no plants as compared to the panel with camelina (Figure 3A). Turbidity in the surface runoff samples also followed the same trend as in case of TSS with turbidity values at least four times higher in control than camelina panel (Figure 3B). This indicates the effectiveness of a sustained plant cover in reducing stamp sand erosion.

3.3.2. Cu in Surface Runoff and Leachate

Total Cu concentration (mg/L) in surface runoff in the control panel was significantly higher than in the panel with camelina plants (Figure 3C). In samples taken four months after sowing camelina, Cu concentration in the surface runoff was in excess of twenty-five times higher than that of the camelina panel. The high concentration of total Cu in surface runoff, as compared to dissolved Cu, was due to stamp sand erosion in surface runoff in the control panel. Total Cu concentration (mg/L) in leachates in the control panel was not significantly different from the camelina panel after two and four months of camelina sowing (Figure 3D). However, in the leachate samples taken after six months, the Cu concentration in the control panel was significantly lower than the camelina panel.
Soil erosion, leaching [26], and deep ploughing [27] are the three main processes that lead to the redistribution of Cu in the soil. Plants influence chemical conditions in the soil, as root growth increases soil OM especially around rhizosphere. This in turn stimulates the growth of microorganisms [28]. Various researchers have found that plants can alter the chemical mobility of metals in the rhizosphere [29,30,31]. Roots also release soluble organic compounds (root exudates) into the rhizosphere, which can form complexes with Cu and can increase Cu uptake [32,33,34]. Once in the roots, Cu can be stored in the root cell walls [35], or can be transported to the aerial parts of the plant [30]. Root exudates can mobilize metals, which not only leads to increased uptake, but can also result in increased leaching [28,36,37]. This is likely to be the reason for the leaching of Cu in the control panel to be similar to that of the panel planted with camelina, although plant cover significantly lowered both TSS and turbidity in the leachate.

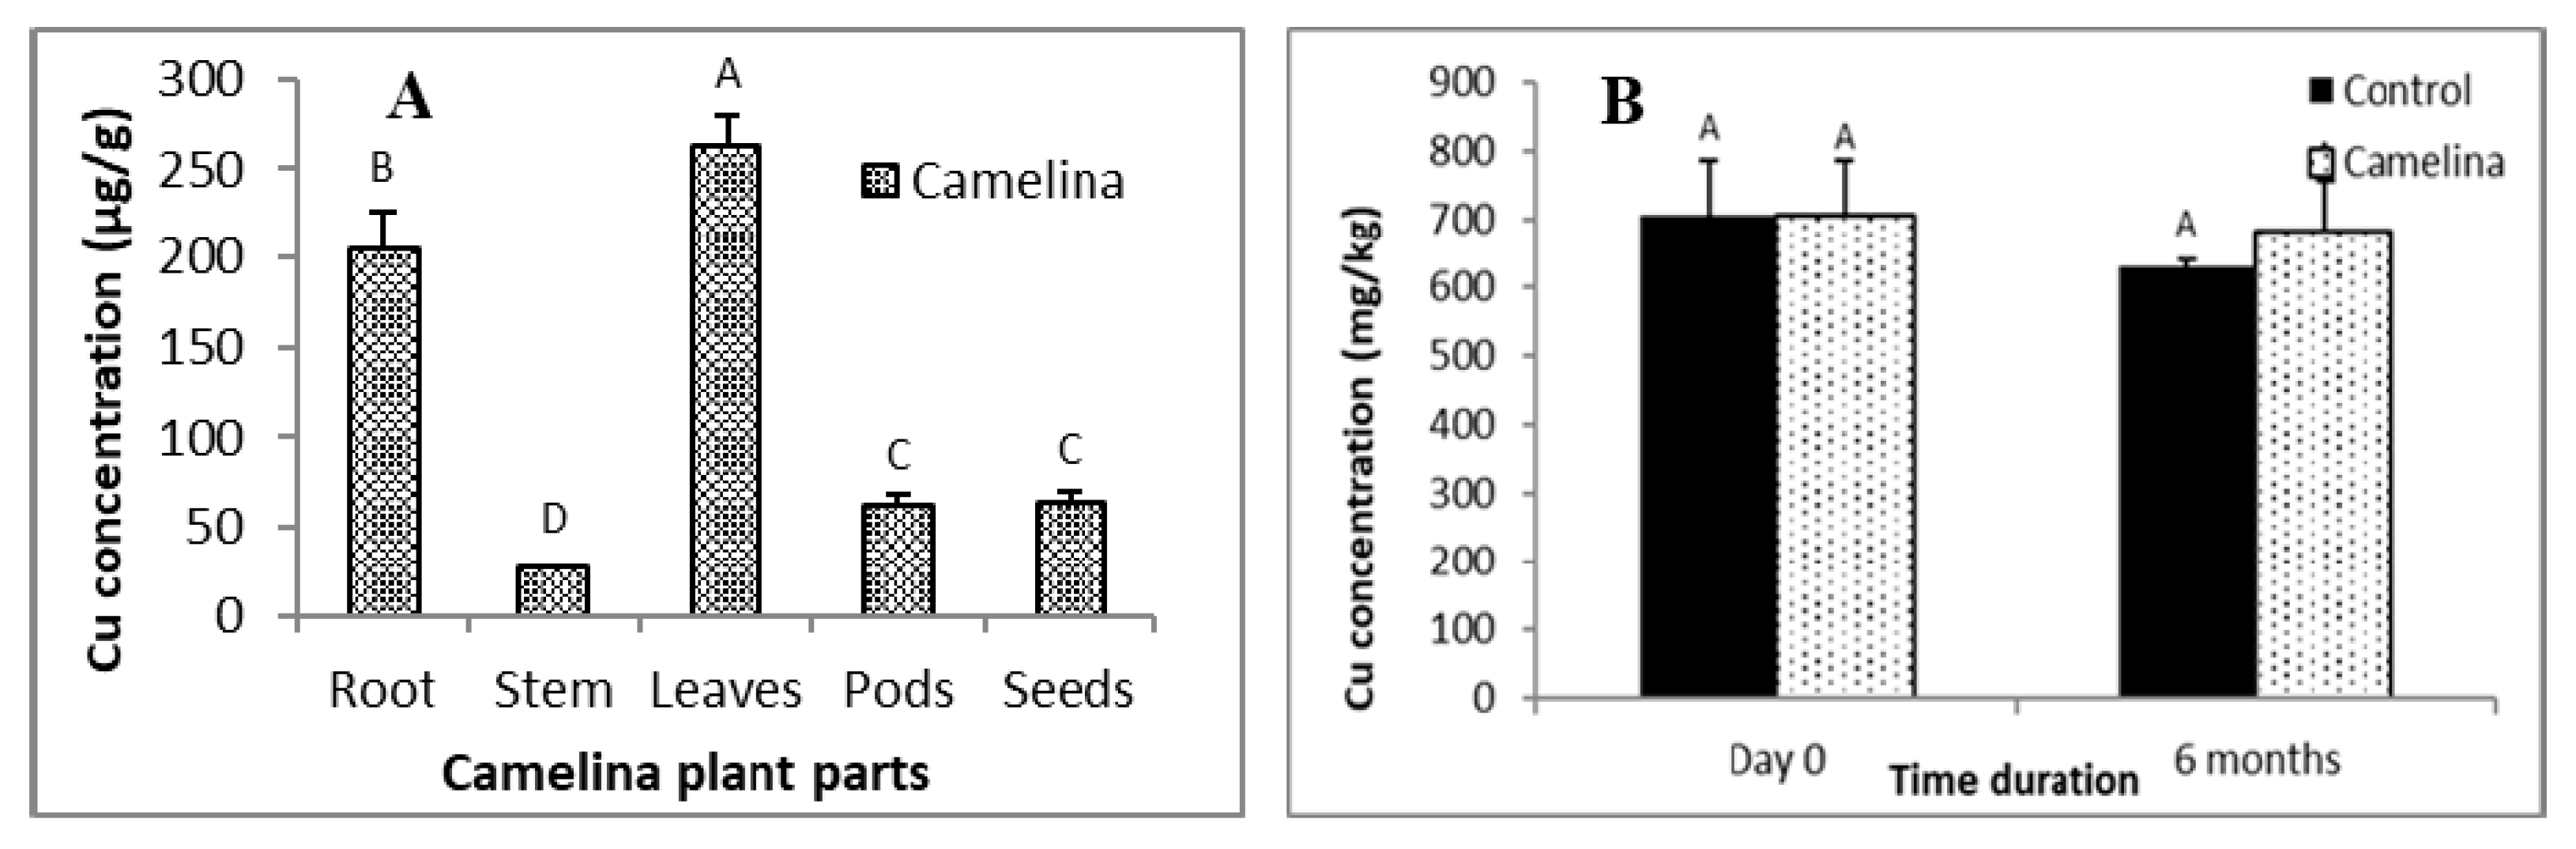
3.3.3. Cu in Camelina Plants

The highest Cu concentration (µg/g) in camelina plant parts (Figure 4A) was found in leaves (263 µg/g) followed by roots (205 µg/g), seeds (65 µg/g), pods (62 µg/kg), and stem (27 µg/g). The Cu concentration in leaves and roots was about four and three times higher than those of seeds and statistically significant from other plant parts (stem, pods, seeds).
Songa et al. [38] reported that Cu concentrations in shoots of Silene vulgaris and Elsholtzia splendens were 262 mg/kg and 215 mg/kg, respectively when grown on Cu contaminated soil. While overall Cu uptake by camelina plants was low, Cu concentrations in shoots were substantially higher than the toxicity threshold of 20–30 mg/kg [30]. While camelina did not exhibit any potential as a candidate for phytoextraction of Cu, our results show that it can be used for the phytostabilization of Cu contaminated soils.

3.3.4. Cu in Stamp Sands

At the end of the field simulation study, Cu concentration (mg/kg) in stamp sand of the control panel was slightly lower than the initial Cu concentration at the beginning of the study (Figure 4B). The Cu concentration at the end of the study in the control panel was also lower than that of the camelina panel. However, these differences were not statistically significant.

3.3.5. Mass Balance of Cu in Panel Study

The total uptake of Cu by camelina plants in the panel was 9.2 mg (Table 4). In the control and camelina panels, 90 mg and 84 mg of Cu leached respectively, during all three leaching events combined. The total Cu in all surface runoff combined in control and camelina panels was 1786 mg and 123 mg, respectively. This result shows that a plant cover lowered the loss of Cu in surface runoff, which is otherwise high in unplanted stamp sand. However, similar to our observation in the column experiment, the majority of Cu was still held in the stamp sands in both control (76,565 mg) and camelina (78,545 mg) panels. During the six-month experimental period, uptake by camelina accounted for 0.01% of the total Cu. Leaching from the unplanted panel was 0.12%, whereas from the panel planted with camelina was 0.11%. The total Cu lost in runoff in the panel planted with camelina was 0.16%, whereas in the unplanted panel, the Cu loss by runoff was much higher, at 2.53%.

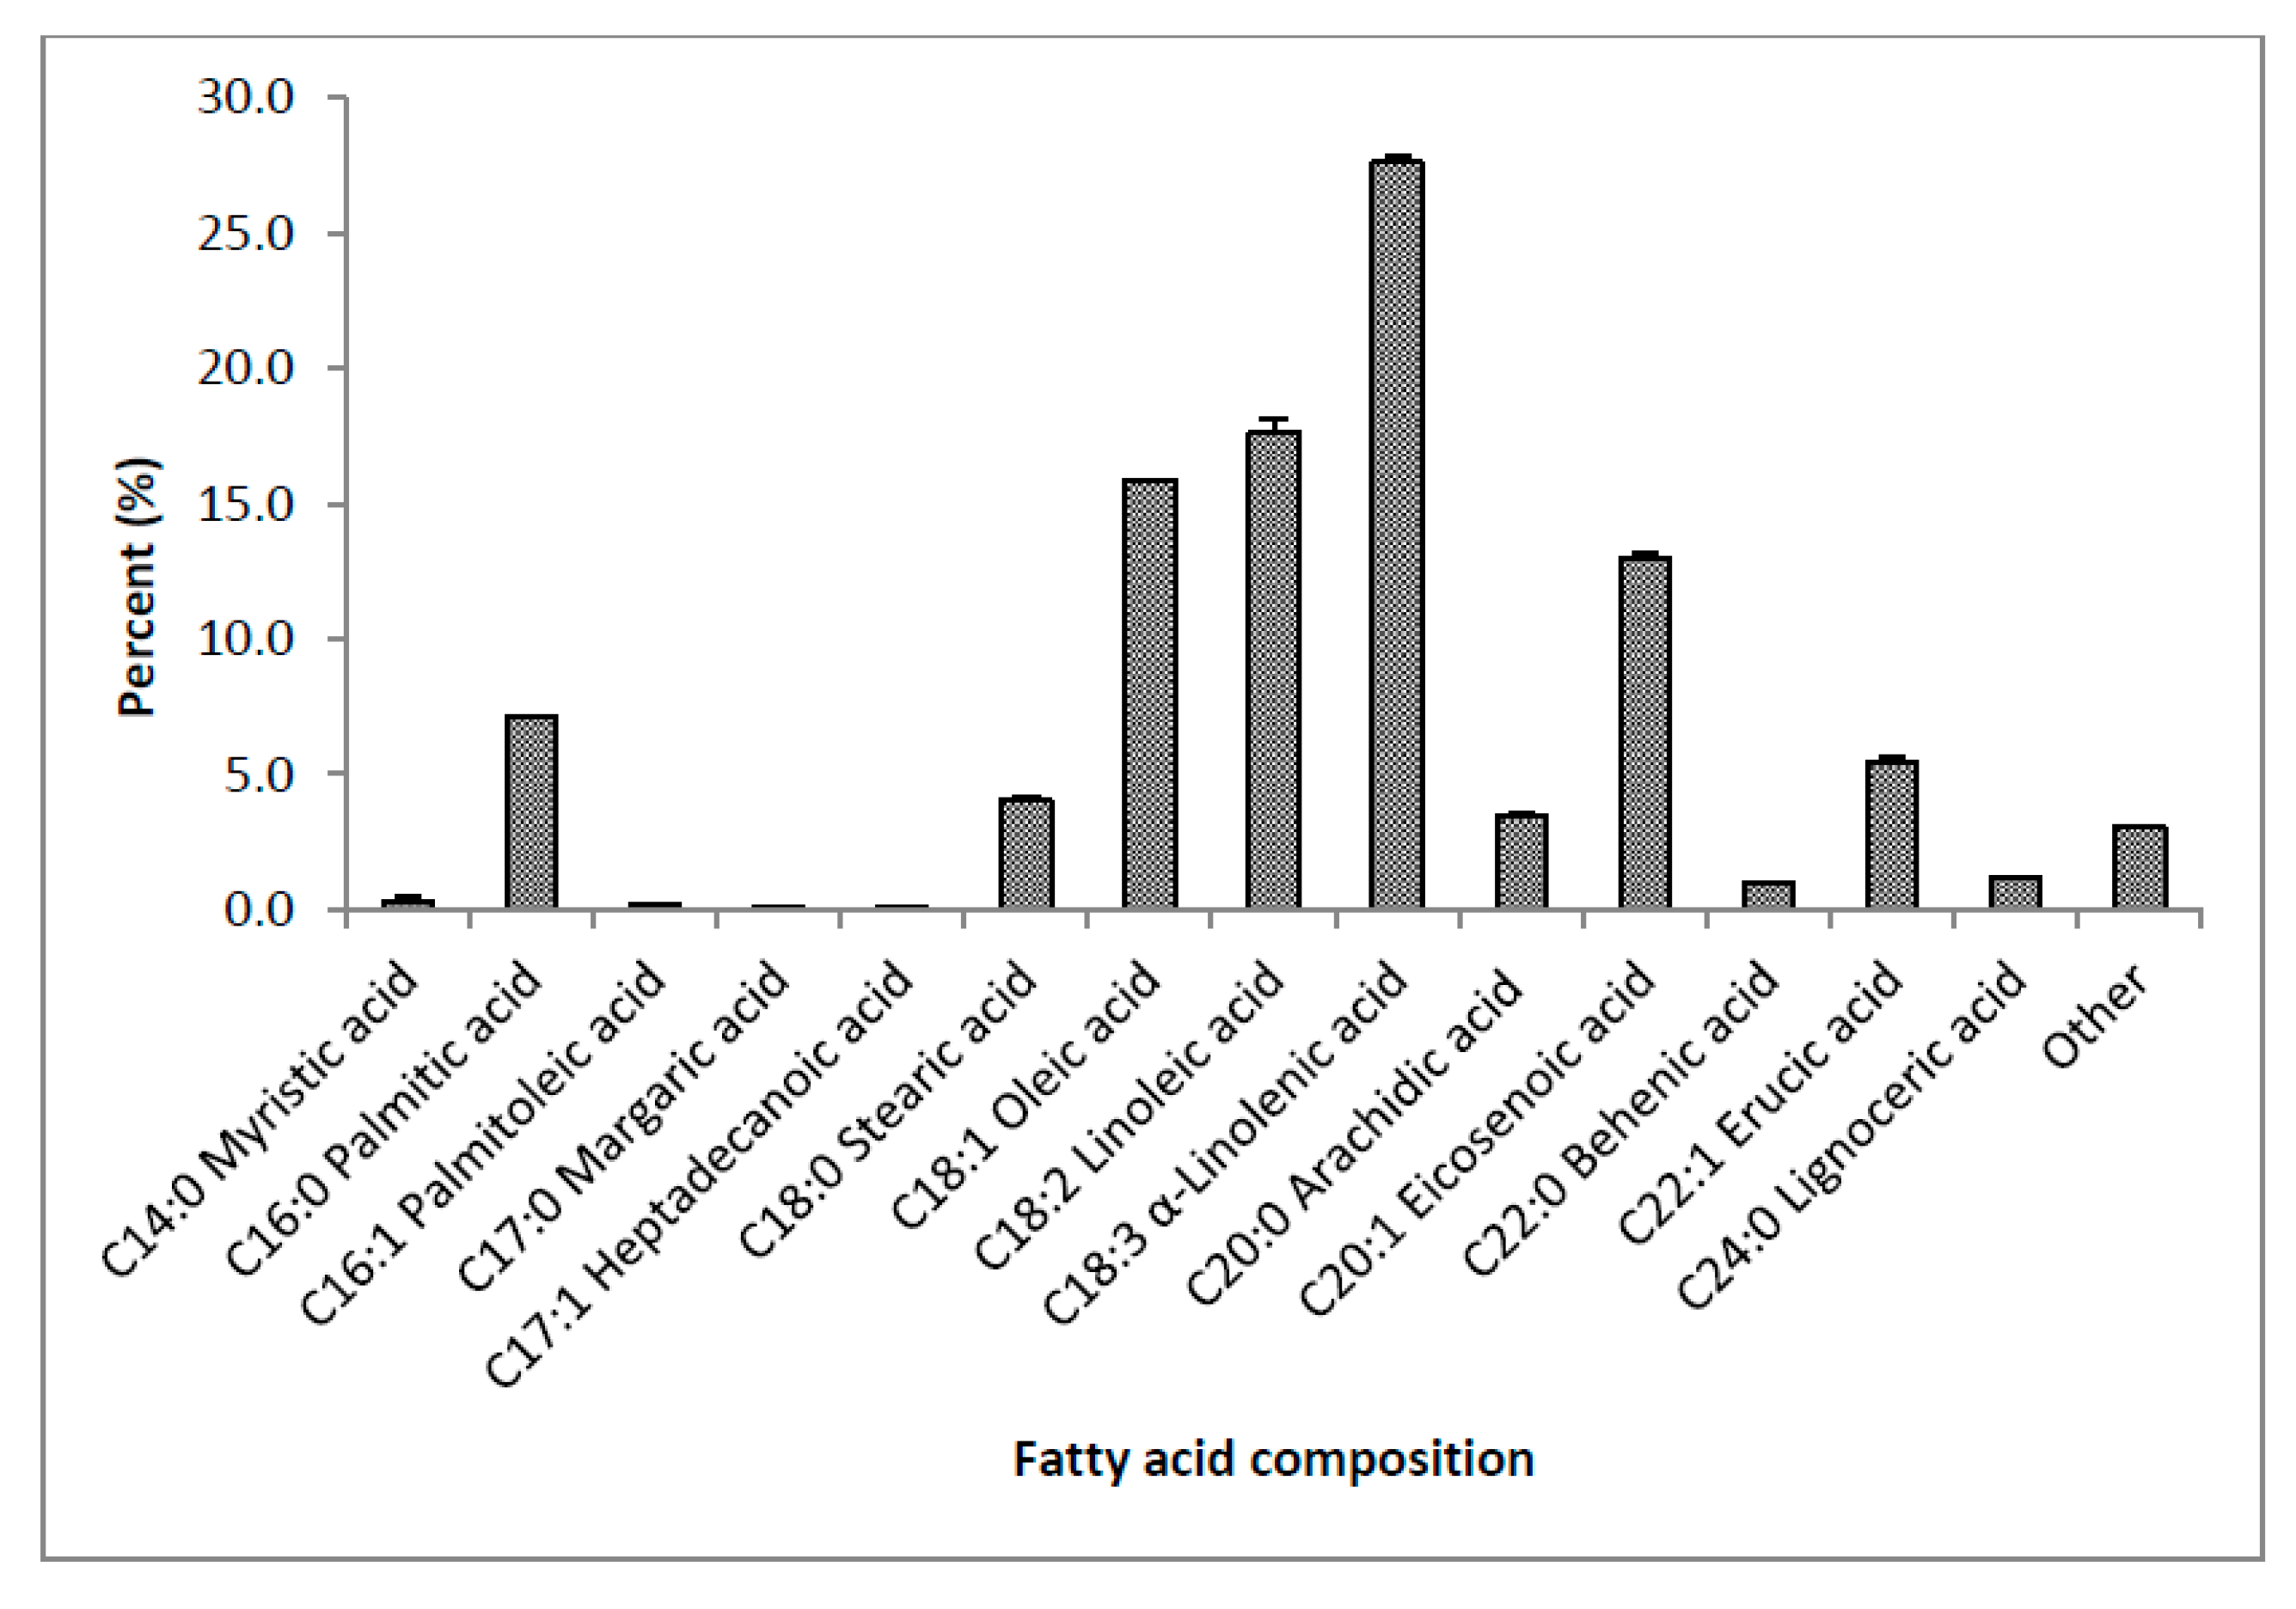
3.3.6. Oil Content and Quality of Camelina Seeds

The oil, protein, and moisture contents of camelina seeds was 20 (±0.25), 22.7 (±0.58), and 6.83% (±0.07), respectively. Moser and Vaughn [39] reported the oil content of camelina seeds in their study as 30.5%. Previous studies by Budin et al. [40], Leonard [41], and Sawyer [42] also found the oil content of camelina to be in that range. The oil content of rapeseed, soybean, and sunflower was reported to be in the range 40–44%, 18–22%, and 39–49% [43]. Peiretti and Meineri [44] reported the protein content of the seed as 24.5% and was similar to the values 23.5–30.1% reported by Marquard and Kuhlmann [45]. The protein content of the plant is one of the qualitative parameters that indicate the nutritional value of the crop. The unsaturated fatty acid composition in the camelina seeds consists of high percentage of α-linolenic acid (32–40%), which makes it suitable for ruminants when it is used as meal [46].
The fatty acid composition of camelina seeds in our study (Figure 5) showed a high content of unsaturated fatty acids such as oleic acid (C18:1; 15.9%), linoleic acid (C18:2; 17.6%), α-linolenic acid (C18:3; 27.6%), eicosenoic acid (C20:1; 13%), and erucic acid (C22:1; 5.5%) comprising a total of 79.6% of the total fatty acids. The saturated fatty acids comprised of palmitic acid (C16:0; 7.1%), stearic acid (C18:0; 4.1%), arachidic acid (C20:0; 3.5%), behenic acid (C22:0; 1%), and lignoceric acid (C24:0; 1.2%).
Fatty acid composition in camelina is highly variable, due to differences in plant cultivars, geographical regions, and different growing conditions [47,48]. The reported content of various fatty acids in camelina are palmitic acid (5–6%), stearic acid (1.5–3.5%), arachidic acid (1–2%), oleic acid (14–19%), linoleic acid (13–24%), and α-linolenic acid (27–40%) [49]. Moser and Vaughn [39] found that oil obtained from camelina seeds contained a high percentage of polyunsaturated fatty acids (54.3%), with high content of α-linolenic (32.6%) and linoleic acid (19.6%). Kagale et al. [46] and Huber et al. [50] also observed that α-linolenic acid comprised between 32% and 40% of the fatty acid composition of camelina oil. Other fatty acids in contents above 10% include linoleic, oleic, and eicosenoic acids.
When plants were grown in environments with high metal content, cellular modifications in the content and composition of fatty acids occur [51,52,53]. Park et al. [54] observed that there was a decrease in the unsaturated fatty acid amount under Cd, Co, Zn, Pb stress in camelina. Beniwal et al. [55] reported similar changes in fatty acid composition in Indian mustard on treatment with Cd. As Cd concentration increased, there was a decline in unsaturated fatty acid content in the seeds, along with an increase in saturated fatty acids.
Oil content and fatty acid composition are the two determining characteristics for suitability of the oil to be used to generate biodiesel on an industrial scale [56]. In our study, the oil content was lower (20%) when compared to previous studies [39,40,41,42] which reported the camelina oil content to be about 30%. However, the fatty acid composition remains consistent with previous reports, with no major change in the percentage of unsaturated fatty acids.

4. Conclusions

The use of marginal lands for generating biofuel is being increasingly explored in recent years. Mine soils are marginal, due to their sandy texture, lack of nutrients and elevated heavy metal content. Studies on growing cool-season grasses such as switchgrass has been reported in reclaimed surface mining sites. However, there are only a handful of studies on the use of short-rotation oil seed crops that can perform the dual role of providing a vegetative cover and generate income in the form of biofuel. Camelina and field pennycress are cold-tolerant and have the potential to be used as winter cover to reduce soil erosion and metal leaching on the shores of Torch Lake. In our Phase I column study, we found that 10% compost amendment to stamp sand was optimum in promoting plant growth without substantially increasing Cu leaching from stamp sand. There was very little uptake of Cu by camelina and field pennycress. Cu concentration in camelina and field pennycress was highest in leaves, but lowest in seeds and pods. Cu concentration in the leachates was low. The turbidity measurements in the leachates could not be used as a proxy for estimating stamp sand erosion. Hence, we performed a Phase II panel study, where the measurement of turbidity and total suspended solids in the surface runoff was used to measure stamp sand erosion. In the greenhouse panel study, camelina grown on contaminated stamp sands amended with compost significantly reduced stamp sand erosion in the surface runoff, as compared to the control panel with no plants. Cu concentration also decreased significantly in surface runoff from the camelina panel, as compared to control. There was a negligible amount of Cu in the camelina seeds.
Camelina seeds contained 20 and 22.7% oil and protein, respectively. The fatty acid composition of camelina seeds did not differ from the previous studies performed on uncontaminated agricultural soils. Our study shows that camelina grown on contaminated stamp sand amended with compost not only significantly reduced stamp sand erosion but also can also be used commercially for generating biodiesel. Further field-scale studies are necessary to elucidate this phytomanagement strategy. If successful, this model would be applicable to other marginal lands for their restoration/ stabilization and production of biofuel, providing economic and environmental benefits.

Author Contributions

Conceptualization, D.S. and R.D.; methodology, V.S. and D.S.; investigation and analysis: V.S.; writing—original draft preparation, V.S.; writing—review and editing, R.D. and D.S.; supervision and project administration: D.S. All authors have read and agreed to the published version of the manuscript.

Funding

This research did not receive any specific grant from funding agencies in the public, commercial, or not-for-profit sectors.

Acknowledgments

The authors thank Ramana Reddy and Jeffrey Kiiskila for their help in the collection of stamp sands. The authors also thank Emily Geiger for her help in the greenhouse panel study at MTU. Thanks are also due toward USDA-NRCS for providing the seeds of camelina and field pennycress for the greenhouse column and panel studies.

Conflicts of Interest

The authors declare no conflict of interest.

References

  1. Cusack, C.C.; Mihelcic, J.R. Sediment Toxicity from Copper in the Torch Lake (MI) Great Lakes Area of Concern. J. Great Lakes Res. 1999, 25, 735–743. [Google Scholar] [CrossRef]
  2. Weston Solutions, Inc. Summary Report for the Torch Lake Area Assessment: Torch Lake NPL Site and Surrounding Areas Keweenaw Peninsula, Michigan; Prepared for US EPA; Document No.: 274-2A-ABDT; Weston Solutions, Inc.: Weston, PA, USA, 2007. [Google Scholar]
  3. Michigan Department of Community Health (MDCH). Issued a Fish Consumption Advisory on Sauger and Walleye in for Torch Lake, Houghton County based on Fish Tumors of unknown Origin; MDCH: Lansing, MI, USA, 1983.
  4. Michigan Department of Natural Resources (MDNR). MDNR Remediation Plan for Torch Lake AOC. Surface Water Quality Division, GLEAS; MDNR: Lansing, MI, USA, 1987.
  5. United States Environmental Protection Agency (USEPA). Torch Lake, Remedial Investigation/Feasibility Study, Houghton County, Michigan, Final Work Plan; US EPA Contract 68-W8-0093; Donohue & Associates, Inc.: Chicago, IL, USA, 1989.
  6. United States Environmental Protection Agency (USEPA). Comprehensive Environmental Response, Compensation, and Liability Act National Priorities List; USEPA: Washington, DC, USA, 1986.
  7. Michigan Department of Environmental Quality (MDEQ). Biennial Remedial Action Plan Update for the Torch Lake Area of Concern, Lansing, MI; MDEQ: Lansing, MI, USA, 2007.
  8. Sidhu, V.; Sarkar, D.; Datta, R. Effects of biosolids and compost amendment on chemistry of soils contaminated with copper from mining activities. Environ. Monit. Assess. 2016, 188, 176. [Google Scholar] [CrossRef] [PubMed]
  9. Sparks, D.L. Methods of Soil Analysis: Part 3. Chemical Methods; Soil Science Society of America: Madison, WI, USA, 1996. [Google Scholar]
  10. Mehlich, A. Mehlich 3 soil test extractant: A modification of Mehlich 2. Comm. Soil Sci. Plant Anal. 1984, 15, 1409–1416. [Google Scholar] [CrossRef]
  11. United States Environmental Protection Agency (USEPA). Test Methods for Evaluating Solid Waste. SW 846, Office of Solid Waste and Emergency Response, 3rd ed.; USEPA: Washington, DC, USA, 1996.
  12. Gee, G.W.; Bauder, J.W. Physical and Mineralogical Methods. Agronomy Monograph No. 9. In Methods of Soil Analysis, Part 1. Particle-size Analysis; Klute, A., Ed.; American Society of Agronomy/Soil Science Society America: Madison, WI, USA, 1986; pp. 383–411. [Google Scholar]
  13. Schulte, E.E.; Hopkins, B.G. Estimation of soil organic matter by weight-loss-on-ignition. In Soil Organic Matter: Analysis and Interpretation; Magdoff, F.R., Tabatabai, M.A., Hanlon, E.A., Jr., Eds.; SSSA Spec. Publ.: Madison, WI, USA, 1996. [Google Scholar]
  14. Nelson, D.W.; Sommers, L.E. Total carbon, organic carbon and organic matter. In Methods of Soil Analysis, Part 2, Agronomy; Page, A.L., Miller, R.H., Keeney, D.R., Eds.; Wiley: Hoboken, NJ, USA, 1982; pp. 539–579. [Google Scholar]
  15. SAS Institute Inc. JMP® Version 10; SAS Institute Inc.: Cary, NC, USA, 2012. [Google Scholar]
  16. Mylavarapu, R.S.; Zinati, G.M. Improvement of soil properties using compost for optimum parsley production in sandy soils. Sci. Hortic. 2009, 120, 426–430. [Google Scholar] [CrossRef]
  17. Kim, H.-S.; Oh, J.-M.; Luan, S.; Carlson, J.E.; Ahn, S.-J. Cold stress causes rapid but differential changes in properties of plasma membrane H+-ATPase of camelina and rapeseed. J. Plant Physiol. 2013, 170, 828–837. [Google Scholar] [CrossRef]
  18. Eberle, C.A.; Thom, M.D.; Nemec, K.; Forcella, F.; Lundgren, J.G.; Gesch, R.W.; Riedell, W.E.; Papiernik, S.K.; Wagner, A.; Peterson, D.H.; et al. Using pennycress, camelina, and canola cash cover crops to provision pollinators. Ind. Crop. Prod. 2015, 75, 20–25. [Google Scholar] [CrossRef]
  19. Groeneveld, J.H.; Klein, A. Pennycress-corn double-cropping increases ground beetle diversity. Biomass Bioenergy 2015, 77, 16–25. [Google Scholar] [CrossRef]
  20. Feigl, G.; Kumar, D.; Lehotai, N.; Tugyi, N.; Molnár, Á.; Ördög, A.; Szepesi, Á.; Gémes, K.; Laskay, G.; Erdei, L.; et al. Physiological and morphological responses of the root system of Indian mustard (Brassica juncea L. Czern.) and rapeseed (Brassica napus L.) to copper stress. Ecotoxicol. Environ. Saf. 2013, 94, 179–189. [Google Scholar] [CrossRef] [Green Version]
  21. Tordoff, G.M.; Baker, A.; Willis, A.J. Current approaches to the revegetation and reclamation of metalliferous mine wastes. Chemosphere 2000, 41, 219–228. [Google Scholar] [CrossRef]
  22. Walker, D.J.; Clemente, R.; Roig, A.; Bernal, M.P. The effects of soil amendments on heavy metal bioavailability in two contaminated Mediterranean soils. Environ. Pollut. 2003, 122, 303–312. [Google Scholar] [CrossRef]
  23. Venegas, A.; Rigol, A.; Vidal, M. Effect of ageing on the availability of heavy metals in soils amended with compost and biochar: Evaluation of changes in soil and amendment properties. Environ. Sci. Pollut. Res. 2016, 23, 20619–20627. [Google Scholar] [CrossRef] [Green Version]
  24. Khokhotva, O.; Waara, S. The influence of dissolved organic carbon on sorption of heavy metals on urea-treated pine bark. J. Hazard. Mater. 2010, 173, 689–696. [Google Scholar] [CrossRef] [PubMed]
  25. Beesley, L.; Moreno-Jiménez, E.; Gomez-Eyles, J.L. Effects of biochar and greenwaste compost amendments on mobility, bioavailability and toxicity of inorganic and organic contaminants in a multi-element polluted soil. Environ. Pollut. 2010, 158, 2282–2287. [Google Scholar] [CrossRef] [PubMed]
  26. Yingming, L.; Corey, R. Redistribution of Sludge-Borne Cadmium, Copper, and Zinc in a Cultivated Plot. J. Environ. Qual. 1993, 22, 1–8. [Google Scholar] [CrossRef]
  27. Flores Velez, L.M.; Ducaroir, J.; Jaunet, A.M.; Robert, M. Study of the distribution of copper in an acid sandy vineyard soil by three different methods. Eur. J. Soil Sci. 1996, 47, 523–532. [Google Scholar] [CrossRef]
  28. Schulin, R.; Geiger, G.; Furrer, G. Heavy metal retention by soil organic matter under changing environmental conditions. In Biogeodynamics of Pollutants in Soils and Sediments: Risk Assessment of Delayed and Nonlinear Responses; Salomons, W., Stigliani, W.M., Eds.; Springer: Berlin, Germany, 1995; pp. 53–85. [Google Scholar]
  29. Hinsinger, P. How do plant roots acquire mineral nutrients chemical processes involved in the rhizosphere? Adv. Agron. 1998, 64, 225–265. [Google Scholar]
  30. Marschner, H. Mineral Nutrition of Higher Plants, 2nd ed.; Academic Press: London, UK, 1995. [Google Scholar]
  31. McLaughlin, M.J.; Smolders, E.; Merckx, R. Soil-root interface physicochemical processes. In Chemistry and Ecosystem Health; Special Publication No. 52; Soil Science Society America: Madison, WI, USA, 1998; pp. 233–277. [Google Scholar]
  32. Mench, M.; Martin, E. Mobilization of cadmium and other metals from two soils by root exudates of Zea mays L., Nicotiana tabacum L. and Nicotiana rustica L. Plant Soil 1991, 132, 187–196. [Google Scholar] [CrossRef]
  33. Mench, M.; Morel, J.L.; Guckert, A. Action des meÂtaux [Cd(II), Cu(II), Pb(II), Zn(II)] sur la production d’exsudats racinaires solubles chez le maõÈs (Zea mays L.). Agronomy 1988, 8, 237–241. [Google Scholar] [CrossRef]
  34. Treeby, M.; Marschner, H.; RoÈ mheld, V. Mobilization of iron and other micronutrient cations from a calcareous soil by plant-borne, microbial, and synthetic metal chelators. Plant Soil 1989, 114, 217–226. [Google Scholar] [CrossRef]
  35. Cathala, N.; Salsac, L. Absorption du cuivre par les racines demaõÈs (Zea mays L.) et de tournesol (Helianthus annuus L.). Plant Soil 1975, 42, 65–83. [Google Scholar] [CrossRef]
  36. Songa, J.; Zhaob, F.; Luoa, Y.; McGrathb, S.; Zhang, H. Copper uptake by Elsholtzia splendens and Silene vulgaris and assessment of copper phytoavailability in contaminated soils. Environ. Poll. 2004, 128, 307–315. [Google Scholar] [CrossRef] [PubMed]
  37. Alexander, M. Introduction to Soil Microbiology, 2nd ed.; John Wiley & Sons, Inc.: New York, NY, USA, 1977. [Google Scholar]
  38. Maywald, F.; Weigel, H.J. Biochemistry and molecular biology of heavy metal accumulation in higher plants. Landbauforsch. Volkerode 1997, 47, 103–126. [Google Scholar]
  39. Moser, B.R.; Vaughn, S.F. Evaluation of alkyl esters from Camelina sativa oil as biodiesel and as blend components in ultra-low-sulfur diesel fuel. Biores. Technol. 2010, 101, 646–653. [Google Scholar] [CrossRef] [PubMed]
  40. Budin, J.T.; Breene, W.M.; Putnam, D.H. Some compositional properties of Camelina (Camelina sativa L. Crantz) seeds and oils. J. Am. Oil Chem. Soc. 1995, 72, 309–315. [Google Scholar] [CrossRef]
  41. Leonard, E.C. Camelina oil: A-linolenic source. Inform 1998, 9, 830–838. [Google Scholar]
  42. Sawyer, K. Is there room for camelina? Biodiesel Mag. 2008, 5, 83–87. [Google Scholar]
  43. Oil World Annual. 2009. Available online: http://www.oilworld.biz/annual (accessed on 5 January 2013).
  44. Peiretti, P.G.; Meineri, G. Fatty acids, chemical composition and organic matter digestibility of seeds and vegetative parts of false flax (Camelina sativa L.) after different lengths of growth. Anim. Feed Sci. Technol. 2007, 133, 341–350. [Google Scholar] [CrossRef]
  45. Marquard, V.R.; Kuhlmann, H. Untersuchungen ¨uber ertragslleistung und samenqualit¨at von leindotter (Camelina sativa Crtz.). Fette Seifen Anstrichm. 1986, 88, 245–249. [Google Scholar] [CrossRef]
  46. Kagale, S.; Koh, C.; Nixon, J.; Bollina, V.; Clarke, W.E.; Tuteja, R.; Spillane, C.; Robinson, S.J.; Links, M.G.; Clarke, C.; et al. The emerging biofuel crop Camelina sativa retains a highly undifferentiated hexaploidy genome structure. Nat. Commun. 2014, 5, 3706. [Google Scholar] [CrossRef]
  47. Abramovic, H.; Abram, V. Physico–chemical properties, composition and oxidative stability of Camelina sativa oil. Food Technol. Biotechnol. 2005, 43, 63–70. [Google Scholar]
  48. Zubr, J. Qualitative variation of Camelina sativa seed from different locations. Ind. Crop. Prod. 2003, 17, 161–169. [Google Scholar] [CrossRef]
  49. Murphy, E.J. Camelina (Camelina sativa). In Industrial Oil Crops; Mckeon, T.A., Hayes, T.A., Weselake, R.J., Eds.; AOCS press: London, UK, 2016; pp. 207–230. [Google Scholar]
  50. Huber, G.W.; Iborra, S.; Huber, W. Synthesis of Transportation Fuels from Biomass:  Chemistry, Catalysts, and Engineering. Chem. Rev. 2006, 106, 4044–4098. [Google Scholar] [CrossRef] [PubMed] [Green Version]
  51. Devi, S.R.; Prasad, M. Membrane lipid alterations in heavy metal exposed plants. In Heavy Metal Stress in Plants; Prasad, M.N.V., Hagemeyer, J., Eds.; Springer: Heidelberg, Germany, 1999; pp. 99–116. [Google Scholar]
  52. Jemal, F.; Zarrouk, M.; Ghorbal, M.H. Effect of cadmium on lipid composition of pepper. Biochem. Soc. Trans. 2000, 28, 907–910. [Google Scholar] [CrossRef] [PubMed]
  53. Bidar, G.; Verdin, A.; Garcon, G.; Pruvot, C.; Laruelle, F.; Grandmougin- Ferjani, A.; Douay, F.; Shirali, P. Changes in fatty acid composition and content of two plants (Lolium perenne and Trifolium repens) grown during 6 and 18 months in a metal (Pb, Cd, Zn) contaminated field. Water Air Soil Pollut. 2008, 192, 281–291. [Google Scholar] [CrossRef]
  54. Park, W.; Feng, Y.; Kim, H.; Suh, M.C.; Ahn, S.J. Changes in fatty acid content and composition between wild type and CsHMA3 overexpressing Camelina sativa under heavy-metal stress. Plant Cell Rep. 2015, 34, 1489–1498. [Google Scholar] [CrossRef]
  55. Beniwal, V.; Aggarwal, H.; Kumar, A.; Chhokar, V. Lipid content and fatty acid change in the developing silique wall of mustard (Brassica juncea L.). Biocatal. Agri. Biotech. 2015, 4, 122–125. [Google Scholar] [CrossRef]
  56. Rodrıguez-Rodrıguez, M.F.; Sanchez-Garcia, A.; Salas, J.J.; Garces, R.; Martınez-Force, E. Characterization of the morphological changes and fatty acid profile of developing Camelina sativa seeds. Ind. Crop Prod. 2013, 50, 673–679. [Google Scholar] [CrossRef]
Figure 1. Total Cu (mg/kg) in roots (A), stem (B), leaves (C), pods (D), and seeds (E) of camelina and field pennycress as affected by different rates of compost during the study period. Data are reported as mean ± S.D (n = 3). Means are compared by Tukey Kramer-HSD test (α = 0.05). The treatment levels that are not connected by the same letter are significantly different from each other.
Applsci 10 01499 g001
Figure 2. Top panel: Total Cu (mg/L) in leachates of camelina (A) and field pennycress (B) and soil as affected by different rates of compost during the study period. Bottom panel: Total Cu (mg/kg) in soil in camelina (C) and field pennycress (D) during the study period. Data are reported as mean ± S.D (n = 3). Means are compared by Tukey Kramer-HSD test (α = 0.05). The treatment levels that are not connected by the same letter are significantly different from each other.
Applsci 10 01499 g002
Figure 3. Top panel: Total Suspended Solids (TSS) (A) and turbidity (NTU) (B) in surface runoff in control and camelina panels. Bottom panel: Total Cu (mg/L) in runoff (C) and leachate (D) in control (no plant) and camelina panels during the study period. Data are reported as mean (n = 3) ± S.D. Means are compared by Tukey Kramer-HSD test (α = 0.05). The treatment levels that are not connected by the same letter are significantly different from each other.
Applsci 10 01499 g003
Figure 4. Cu (µg/g) in different parts of camelina plants during the study period (A). Cu (mg/kg) in stamp sand in control (no plant) and camelina panels during the study period (B). Data are reported as mean ± S.D (n = 3). Means are compared by Tukey Kramer-HSD test (α = 0.05). The treatment levels that are not connected by the same letter are significantly different from each other.
Applsci 10 01499 g004
Figure 5. Fatty acid composition (wt. % of extracted oil) of camelina seeds. Data are expressed as mean (n = 2) ± standard deviation.
Applsci 10 01499 g005
Table 1. Physicochemical properties of soil and compost.
PropertiesStamp Sand Compost
pH8.2 6.9
Electrical Conductivity (μS/cm)83 1840
Organic matter (%)0.5 84
Sand (%)95 NA
Silt (%)2.5 NA
Clay (%)2.5 NA
Cu (mg/kg)719 54
Fe (mg/kg)6200 BDL
Al (mg/kg)2300 BDL
Plant Available P (mg/kg)0.70 1009
Total P (mg/kg)800 2090
Total N (g/kg)1.81 388
where NA= Not Available; BDL = Below Detection Limit.
Table 2. Plant yield (oven dried; g) of camelina and field pennycress in the column study.
Plant SpeciesRoots Stem Leaves Pods Seeds Total Biomass
Camelina
Compost–2.5%0.08c0.96c 0.47c 0.12d 0.09c 1.72e
Compost–5%0.14c0.97c 0.58c 0.05d 0.04bc 1.78e
Compost–10%0.12c2.10b 0.85c 0.51b 0.37bc 3.96cd
Compost–20%0.44bc3.53a 2.86b 0.18cd 0.19bc 7.21b
Field Pennycress
Compost–2.5%0.11c0.50c0.68c0.24cd0.21bc1.74e
Compost–5%0.11c0.81c1.31c0.35bc0.30bc2.89de
Compost–10%0.78ab0.81c2.76b0.53b0.65b 5.53c
Compost–20%1.03ab2.26b8.05a1.40a1.30a 14.0a
Data are reported as mean (n = 3). Means are compared by Tukey Kramer-HSD test (α = 0.05). The treatment levels that are not connected by the same letter are significantly different from each other.
Table 3. Mass balance of Cu for the greenhouse column study.
Roots (mg)Stem (mg)Leaves (mg)Pods (mg)Seeds (mg)Total Plant Uptake (mg)Total Cu (Leachates; mg)Total Cu (Soil; mg)
Control (No plant)------0.051757
Camelina
Compost–2.5%0.020.060.010.010.010.118.691733
Compost–5%0.040.060.120.010.0030.2320.01709
Compost–10%0.020.080.140.020.020.2843.31671
Compost–20%0.070.170.340.010.010.601311550
Field Pennycress
Compost–2.5%0.020.010.070.040.010.155.781719
Compost–5%0.030.020.190.040.010.2914.41697
Compost–10%0.080.020.160.050.020.3337.41654
Compost–20%0.150.030.370.040.030.621061570
Table 4. Mass balance of Cu (mg) in the greenhouse panel study.
RootsStemLeavesPodsSeedsTotal plant uptakeLeachatesSurface RunoffSoil
Control (No plant)------90178676,565
Camelina2.481.903.840.340.639.28412378,545

