Article

Smart Nanocomposites for Nanosecond Signal Control: The Nano4waves Approach

1
UCLouvain, IMCN Institute, MOST Division, 1 place Louis Pasteur, 1348 Louvain-la-Neuve, Belgium
2
UCLouvain, ICTEAM Institute, ELEN Division, 3 place du Levant, 1348 Louvain-la-Neuve, Belgium
3
Faculty of Mechanical and Industrial Engineering, Bahir Dar Institute of Technology, Bahir Dar University, Bahir Dar, P.O. Box 1935, Ethiopia
4
UCLouvain, IMCN Institute, BSMA Division, 1 place Croix du Sud, 1348 Louvain-la-Neuve, Belgium
*
Author to whom correspondence should be addressed.
Appl. Sci. 2020, 10(3), 1102; https://doi.org/10.3390/app10031102
Submission received: 8 January 2020 / Revised: 21 January 2020 / Accepted: 24 January 2020 / Published: 6 February 2020
(This article belongs to the Special Issue State of the Art of Nanosciences in Belgium)

Abstract

:

Featured Application

The widespread issue of electromagnetic (EM) pollution demands ever more efficient solutions for the protection of people and equipment. Our approach provides simple and efficient methods for the fabrication of compact shielding materials preventing electromagnetic interference, in particular structures offering broadband microwave absorption improved over previously described solutions.

Abstract

The NANO4WAVES project has demonstrated the potential of a clever organization of nanoscale inclusions in polymer matrices or inks, e.g., carbon nanotubes, graphene, metallic nanoparticles, for controlling the electromagnetic propagation at wavelengths ranging from micrometers up to tenths of centimeters, with a particular focus on broadband absorption. This paper illustrates the versatility of our approach, encompassing the synthesis of various nano-objects, their dispersion and organization at the macroscopic level, and their state-of-the-art characterization for the realization of efficient novel microwave absorbers.

1. Introduction

As stated in ref. [1], artificial or composite materials dedicated to the control of wireless propagation of signals (popularized over the last decade under the term “metamaterials” in the scientific community) are multi-functional materials tailored to display electromagnetic (EM) properties not found in nature, through a nonconventional modification of their macroscopic effective permittivity and/or permeability, sometimes reaching negative values [2]. Superlensing beyond the diffraction limit [3], invisible cloaking of objects [4,5], left-handed propagation reducing the size of devices to one tenth of their operating wavelength [6], frequency selective surface (FSS) [7,8] or electromagnetic bandgap (EBG) structures [9,10,11,12] are some of the outstanding developments in progress over various frequency ranges, going from GHz to optics.
The NANO4WAVES project has made a strong contribution in this area by demonstrating the potential of a clever hierarchical organization of nanoscale inclusions in composite materials for controlling nanosecond signals, with a dramatic impact on the electromagnetic propagation at wavelengths ranging from millimeters up to tenths of centimeters.
The project has combined two major ideas:
First, we have taken advantage of synergies at the nanoscale between carbonaceous and magnetic metal (oxides) nanoparticles, in order to generate unusual combinations of effective material properties (resonant or not), in particular tuned permittivity ε, conductivity σ and magnetic permeability μ, thanks to the interaction between waves and particles with size lower than the skin depth.
Second, this synergy has been magnified through a clever hierarchical organization, from the nano to the millimeter scale, of these nano-inclusions in a polymer hosting matrix or printable ink providing extensive possibilities of structuration, conforming and molding.
Experimentally, we have developed cutting-edge chemical functionalization of nanoparticles. The performance of these systems has been assessed from nano- to macro levels by advanced EM measurement techniques. Their composition and organization have been analyzed by state-of-the-art molecular, structural (Transmission Electron Microscopy (TEM) and Scanning Electron Microscopy (SEM)) and 3D Time-of-Flight-Secondary Ion Mass Spectroscopy characterization techniques.
As a result, the broadband tailoring of permittivity and permeability values has been demonstrated at the macro (or millimeter) scale, with particular control on losses and on anisotropy and periodicity, through specific strategies of conforming and the dispersion of high-aspect ratio inclusions. While classical composite metamaterials for EM signal processing usually consider losses as a drawback and try to minimize them, a major originality of the project has been to exploit absorption as an opportunity (concept of “metamaterial absorbers”) for the design of antireflective thin coatings. This is paving the road towards simple and compact implementations of surface and volume EM metamaterials suited for a wide variety of stealth or cloaking applications based on multifunctional materials and surfaces.
The project was split into five steps, strongly interconnected:
  • Synthesis of carbonaceous and metal (oxide) nano-inclusions
  • Nano-objects characterization
  • Electromagnetic properties: from nanoscale to millimeter scale
  • Control of hierarchical organization
  • Design of EM control functionalities
These steps are illustrated in the present contribution by a variety of original results obtained within the framework of this project.

2. Materials and Methods

2.1. Strategy

The general approach is illustrated through simple and compact implementations of 2D and 3D architectures based on nanoinclusions that are suited for a wide variety of broadband absorbers. This section summarizes the steps of the multiscale design and synthesis approach.

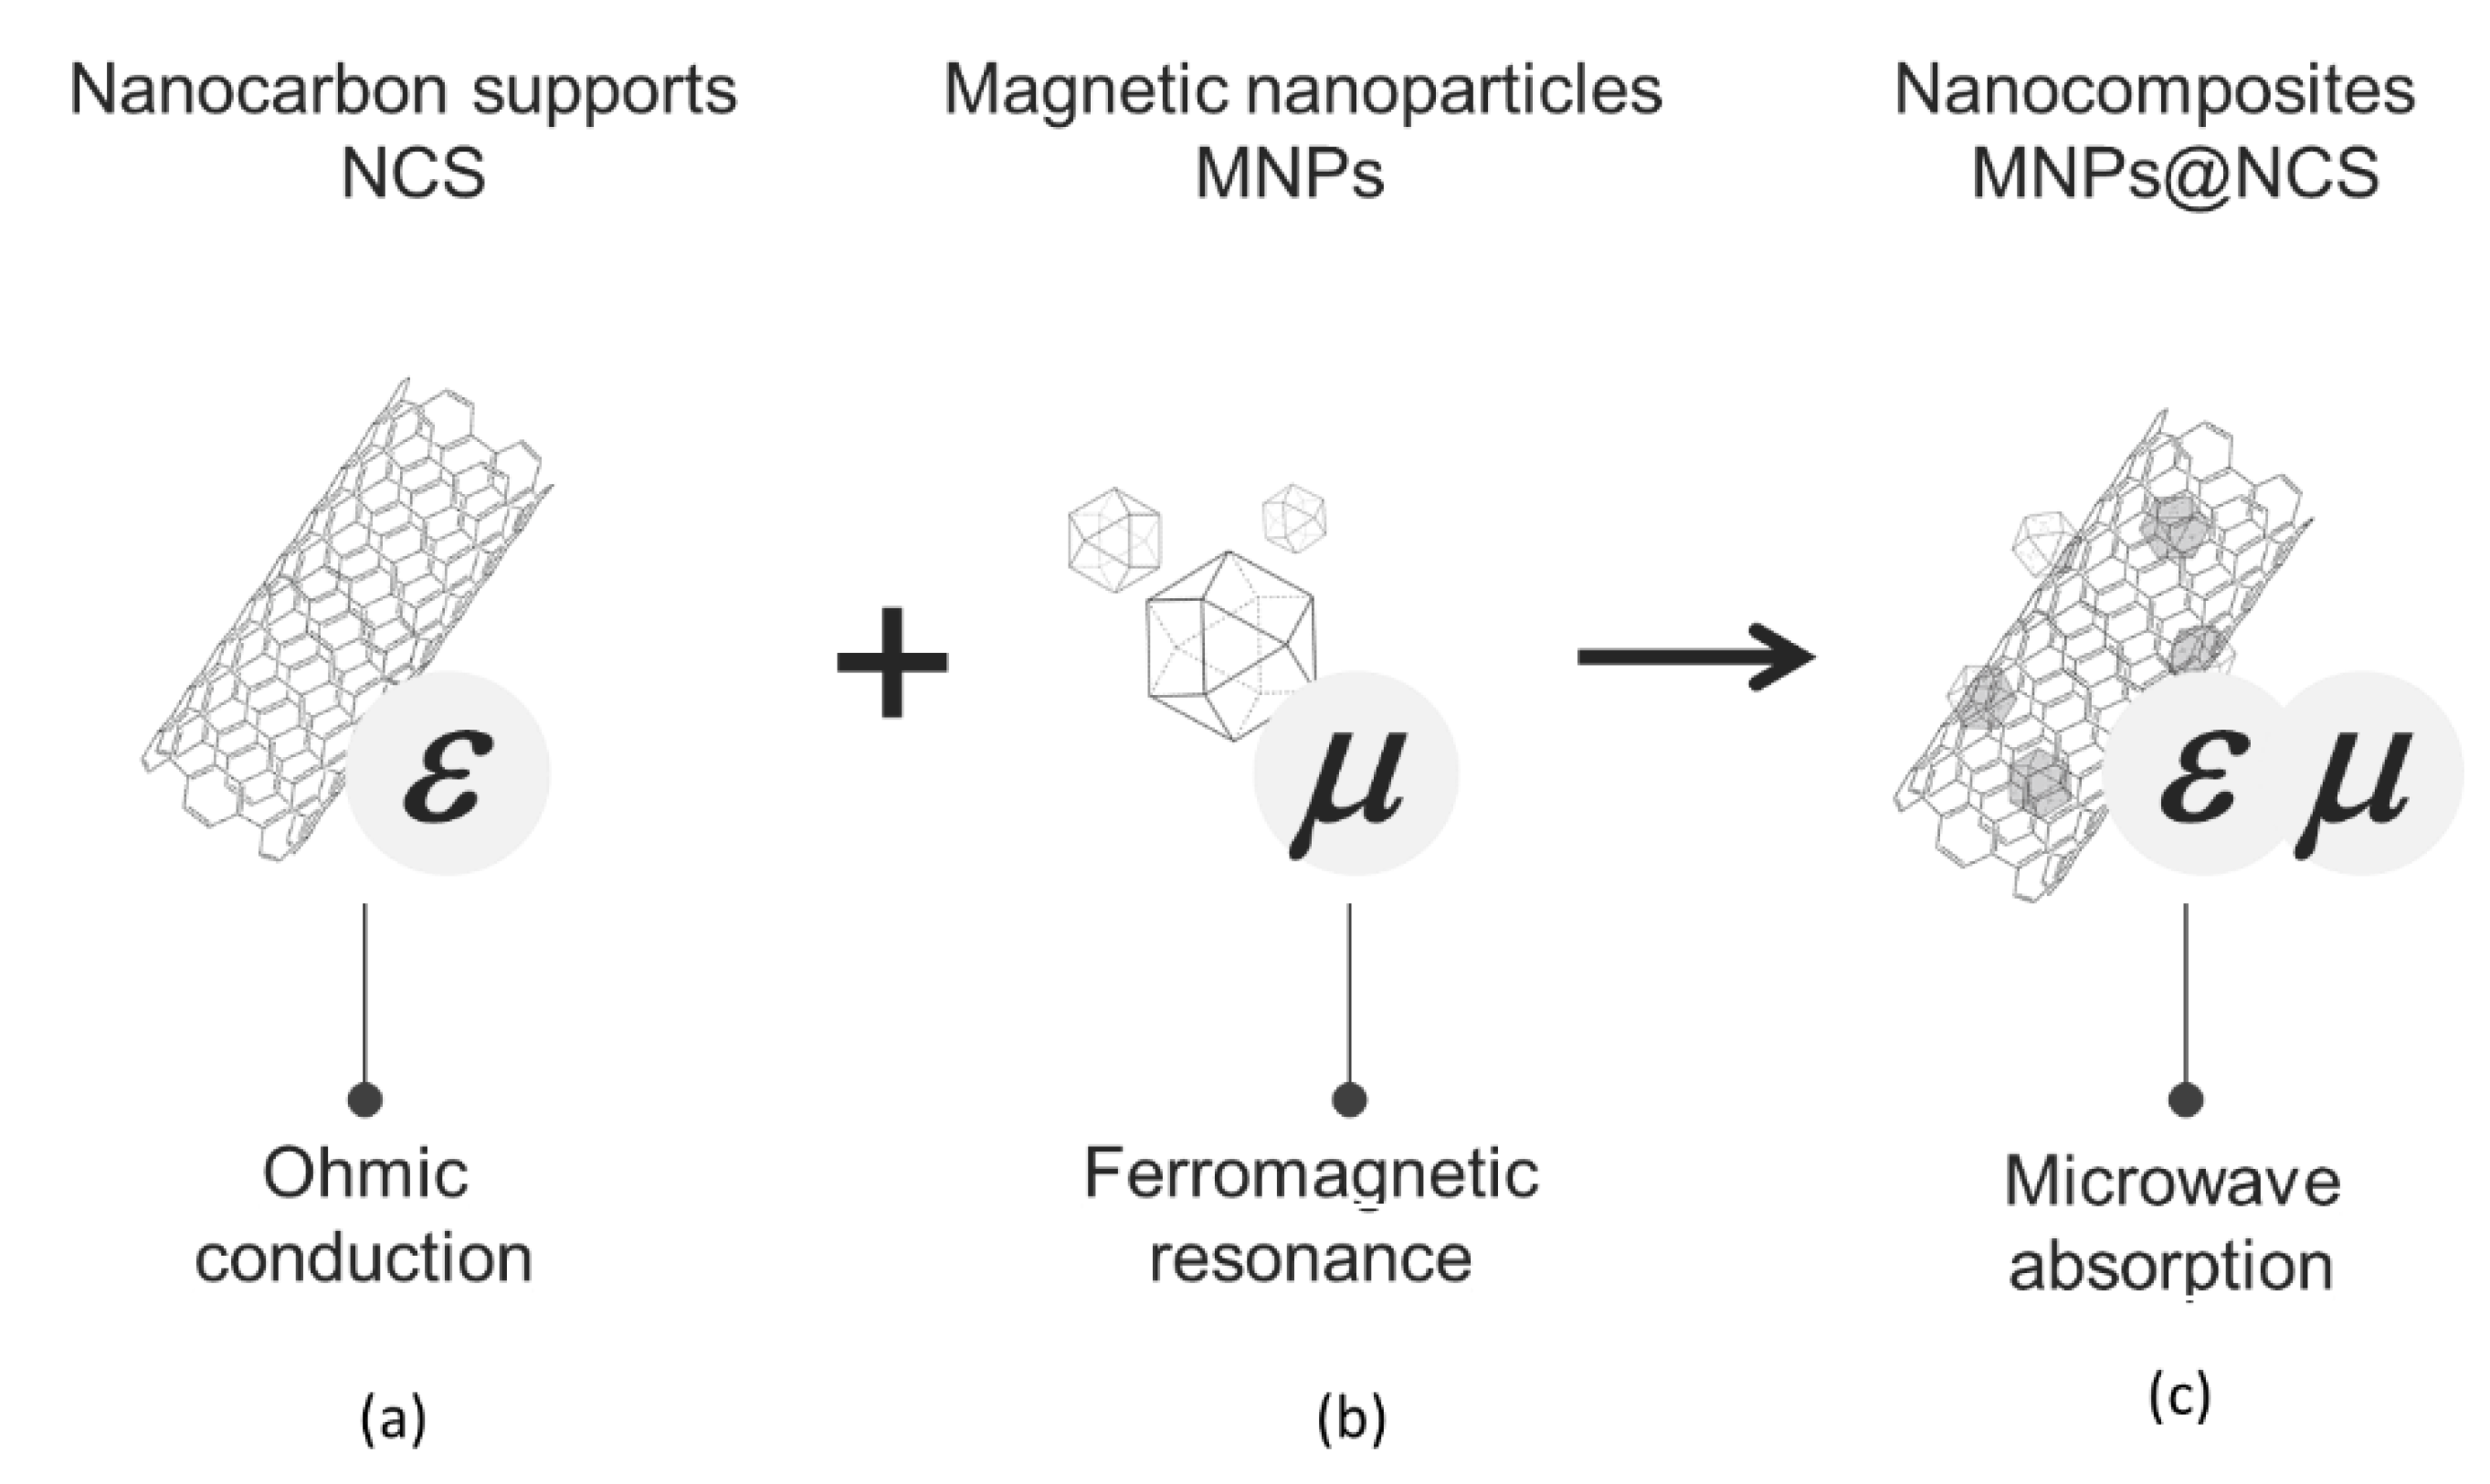
2.1.1. Selection and Combination of Nano-Inclusions

Various types of nanocarbon supports (NCS) have been tested (Figure 1a): namely, multiwalled carbon nanotubes (MWCNTs), graphene nanoplatelets (GNP) and (reduced) graphene oxide (GO and rGO), which enable the tuning of various properties over a wide electromagnetic spectrum, in particular the dielectric constant ε of the resulting composites. We have systematically explored combinations of highly anisotropic NCS and spherical ferro- and ferri-magnetic nanoparticles (MNPs) (Figure 1b), in order to induce additional electromagnetic properties to the resulting composites. Indeed, MNPs show intrinsic resonance of their permeability μ in the range of 4–40 GHz, while a short distance between NCS induces huge coupling capacitances responsible for relaxation in the GHz-range [13,14], and for enhanced permittivity εr. Controlling the composition and surface chemistry of the carbonaceous components and metal inclusions optimizes their combined nanostructuration (Figure 1c).

2.1.2. Hierarchical Organization at Millimeter Scale for the Control of Electromagnetic Propagation

Periodic or gradient structuration of isotropic or pre-oriented nanocomposites has been achieved by stacking multiple layers of films (Figure 2a) alternating insulating dielectric polymer and conductive nanocomposite films. Stacks arranged in a gradient of conductivity are predicted to favor the penetration and progressive absorption of electromagnetic waves inside a nanocomposite material (Figure 2b), which has been confirmed experimentally [5]. A simple method based on chain matrix conversion [11] simulates the scattering parameters (S-parameters) and absorption index if the physical parameters of each layer are known. Figure 2b illustrates that a periodic stack alternating insulating polycarbonate (PC) layers and layers having graded increasing conductivity induces lower reflection and higher absorption than when using layers having uniform equivalent conductivity. The simulation of Figure 2 is conceptual rather than presenting real experimental results. It aims at demonstrating the superior performance of a generic gradient structure compared to a straightforward periodic one with the same overall loading of conductive filler. The permittivity values of the insulating layers correspond to PC, but the conductive layers are not meant to represent specific conductive composites. However, the corresponding conductivities can be experimentally obtained by PC-CNT nanocomposites with controlled CNT concentration in each layer.

2.2. Synthesis of MNPs(Magnetic Nanoparticles)@NCS(Nanocarbon Supports) Nanocomposites

During the project, we were able to decorate five types of NCS with nine different types of MNPs. The origin of the various NCS is listed in Table 1, while Table 2 details the types of MNPs. The desired nanocomposite materials were successfully obtained in all cases by diverse synthetic approaches that can be divided into two main categories: (1) wet-chemical techniques at atmospheric pressure, including sol-gel, usually followed by thermal treatment in dry form and (2) solvothermal methods carried out in an autoclave under high pressure and temperature.
Ni@GO was synthesized using a one-pot solvothermal method described in [16]. The preparation of zero valence Iron (ZVI) as well as FeNi, CoNi, and FeCoNi alloyed nanoparticles supported on GO was performed using a Pechini-type sol-gel method fully described in ref. [17]. Direct co-precipitation and covalent linkage were also used, and compared in our previous paper [16], for the synthesis of magnetite Fe3O4 on various NCS. The influence of each method on the obtained nanocomposites most relevant characteristics was studied, such as chemical identity, size of particles, loading rate and spatial distribution of the MNPs over the NCS, as will be illustrated in Section 3.1. The impact of the variables controlling the solvothermal decoration of a wide variety of NCSs was investigated in more detail, such as the nature of the iron precursor and the NCS (type and oxidation state), the reaction temperature, time, and water content.
As described in Table 2, synthetic parameters were varied in order to determine their influence on the deposited NPs size and spatial distribution. Different forms of graphene, from graphite oxide (GO) to GNPs (fully reduced graphene nanoplatelets) going through rGO (reduced graphene oxide), were used to observe the effect of different levels of carbon oxidation on conduction properties (conductivity being known to decrease with an increasing number of oxygenated groups on graphenic sheets, due to their defective nature). The deposited magnetic nanoparticles were found to induce a ferromagnetic resonance (FMR) absorption process in all cases, as will be illustrated in Section 3.2.2.

2.3. Composite Polymer Processing

As shown in Table 1, MWCNTs (NC7000) were purchased from Nanocyl and GNPs (TIMREX C-Therm 002) were provided by Imerys. As detailed in [18], polycarbonate (PC) Makrolon OD2015 resin pellets were purchased from Bayer. Before processing, PC pellets were dried for 24 h at 80 °C in vacuo to remove any water residues, which can degrade the polymer and induce unwanted effects on the electrical and mechanical properties. The polymer-nanofiller dry-blends were compounded in a DSM Xplore microcompounder at 260 °C and 150 rpm for 15 min after a feeding time of 1–2 min. The MWCNTs and GNPs were separately or jointly dispersed [18,19] in low viscosity PC designed for the molding of CD and DVD at various weight concentrations and ratios. The low viscosity of the matrix and high torque capability of the machine allowed for a lower processing temperature than usual for PC while achieving excellent dispersion of the nanofillers [18,19]. Afterwards, the extrudates were hot pressed for 2 min at 260 °C and 10 MPa using a hydraulic press, into 400 µm-thick flat sheets and finally annealed at 150°C for 5 h and cold pressed before characterization [20].

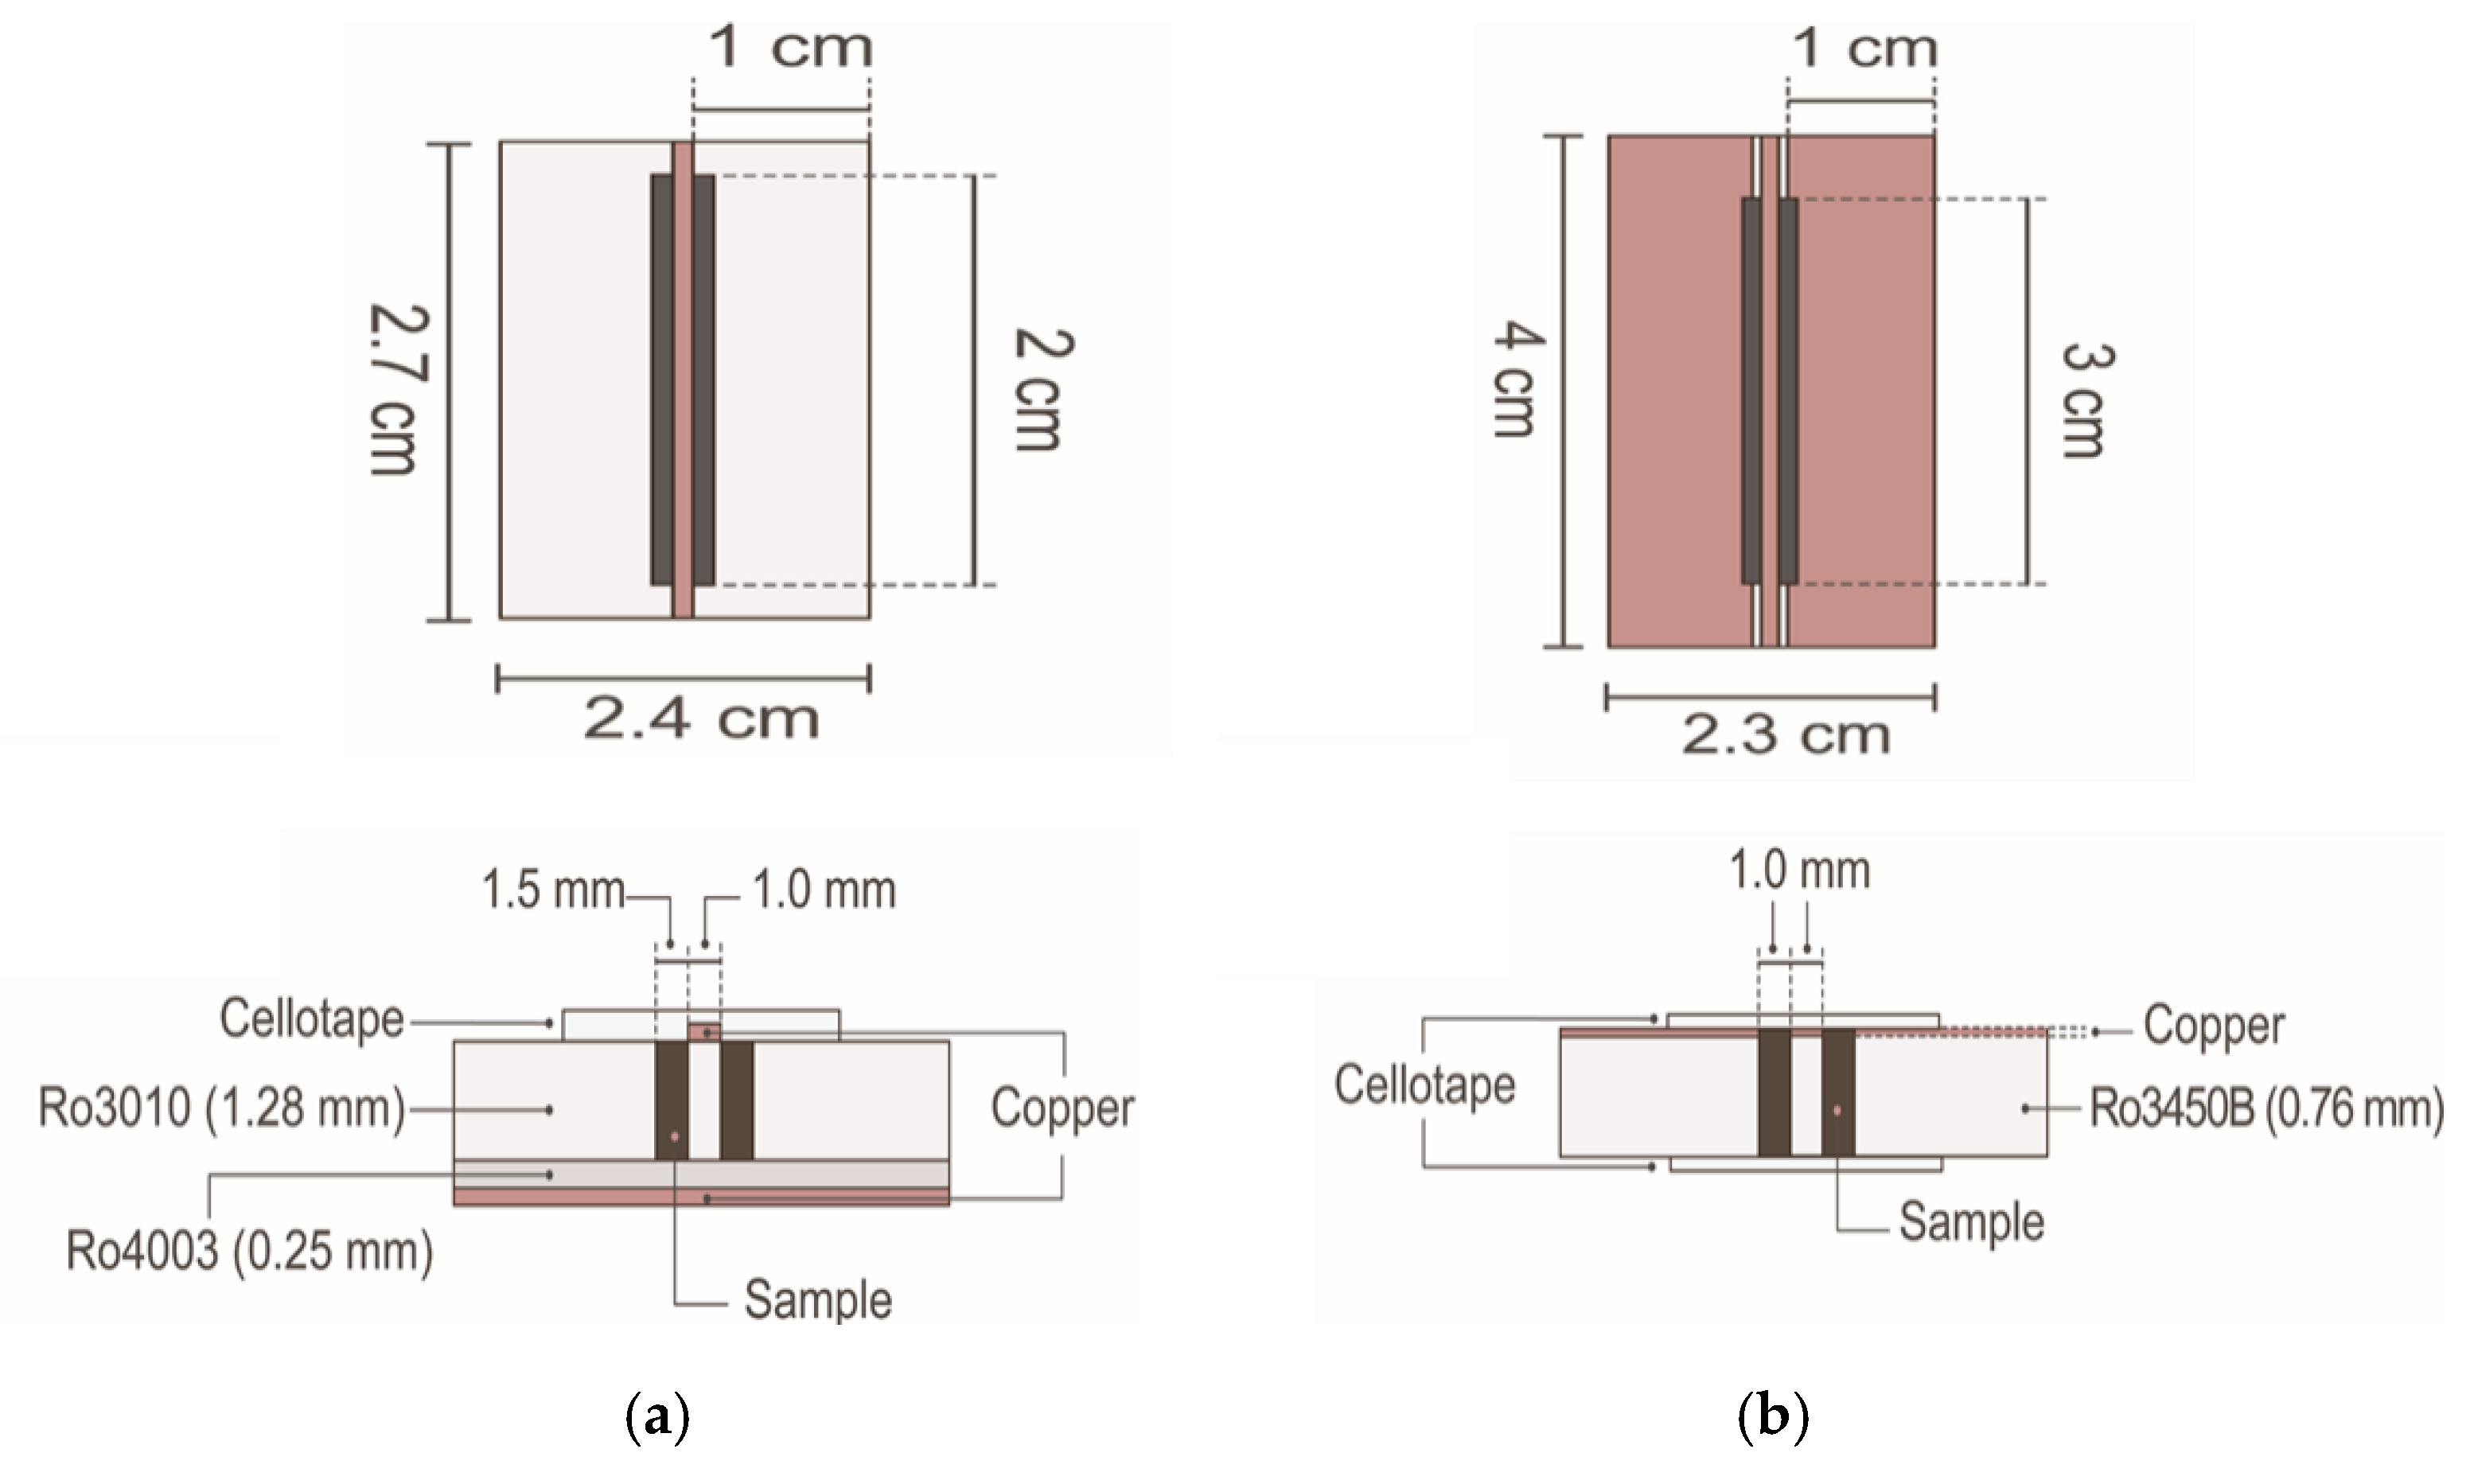
2.4. Microwave Characterization

The novel setup developed during Nano4waves for the microwave characterization of nanoinclusions powders is reported in Figure 3a. It shows the VNA (vector network analyzer) and a particular test cell developed to perform the EM characterization directly on the as-obtained nanopowders, without any type of sample preparation. Figure 4 shows the topology of the two different test cells (microstrip and coplanar) that were tested in this work. As detailed in [21], both configurations allow to retrieve the constitutive electromagnetic parameters ε and μ for each type of nanoinclusion over the considered frequency range.
The VNA is the basic instrument for the microwave characterization of nanoinclusions and resulting devices conceived during this work. It measures the transmission of a microwave signal through the materials and devices under scope, noted S21, as well as the reflection at their input, noted S11. Three VNAs were used during the project: Wiltron 360 and 37397C from Anritsu, and N5247A PNA-X 67 from Agilent/Keysight. They operate in the 40 kHz–65 GHz frequency range. For FMR measurements, the VNA was coupled with an electromagnet supplying DC magnetic field values ranging from 0 to 9 kOersteds. The whole setup is described in ref. [22].
The measurement of thin film absorbers developed during the work is illustrated in Figure 3b. Each sample is inserted between the two waveguide flanges connected to the VNA through coaxial cables. Using this configuration, the reflection at input of the absorber and absorption through it are obtained from the reflection S11 and transmission S21 coefficients measured by the VNA as:
R = |S11|2
A = 1 − |S11|2 − |S21|2

3. Results and Discussion

3.1. Properties of MNPs(Magnetic Nanoparticles)@NCS(Nanocarbon Supports) Nanoinclusions

Composites of MNP deposited on NCS were obtained as described in Section 2.2 by decorating MCWNTs, GNPs or (R)GO, by various types of metal (oxides) MNPs. As mentioned above, a wide array of techniques was employed to fully characterize the obtained nanocomposites. Typical results obtained are summarized below, using the synthesis of magnetite@NCS composites as an example.

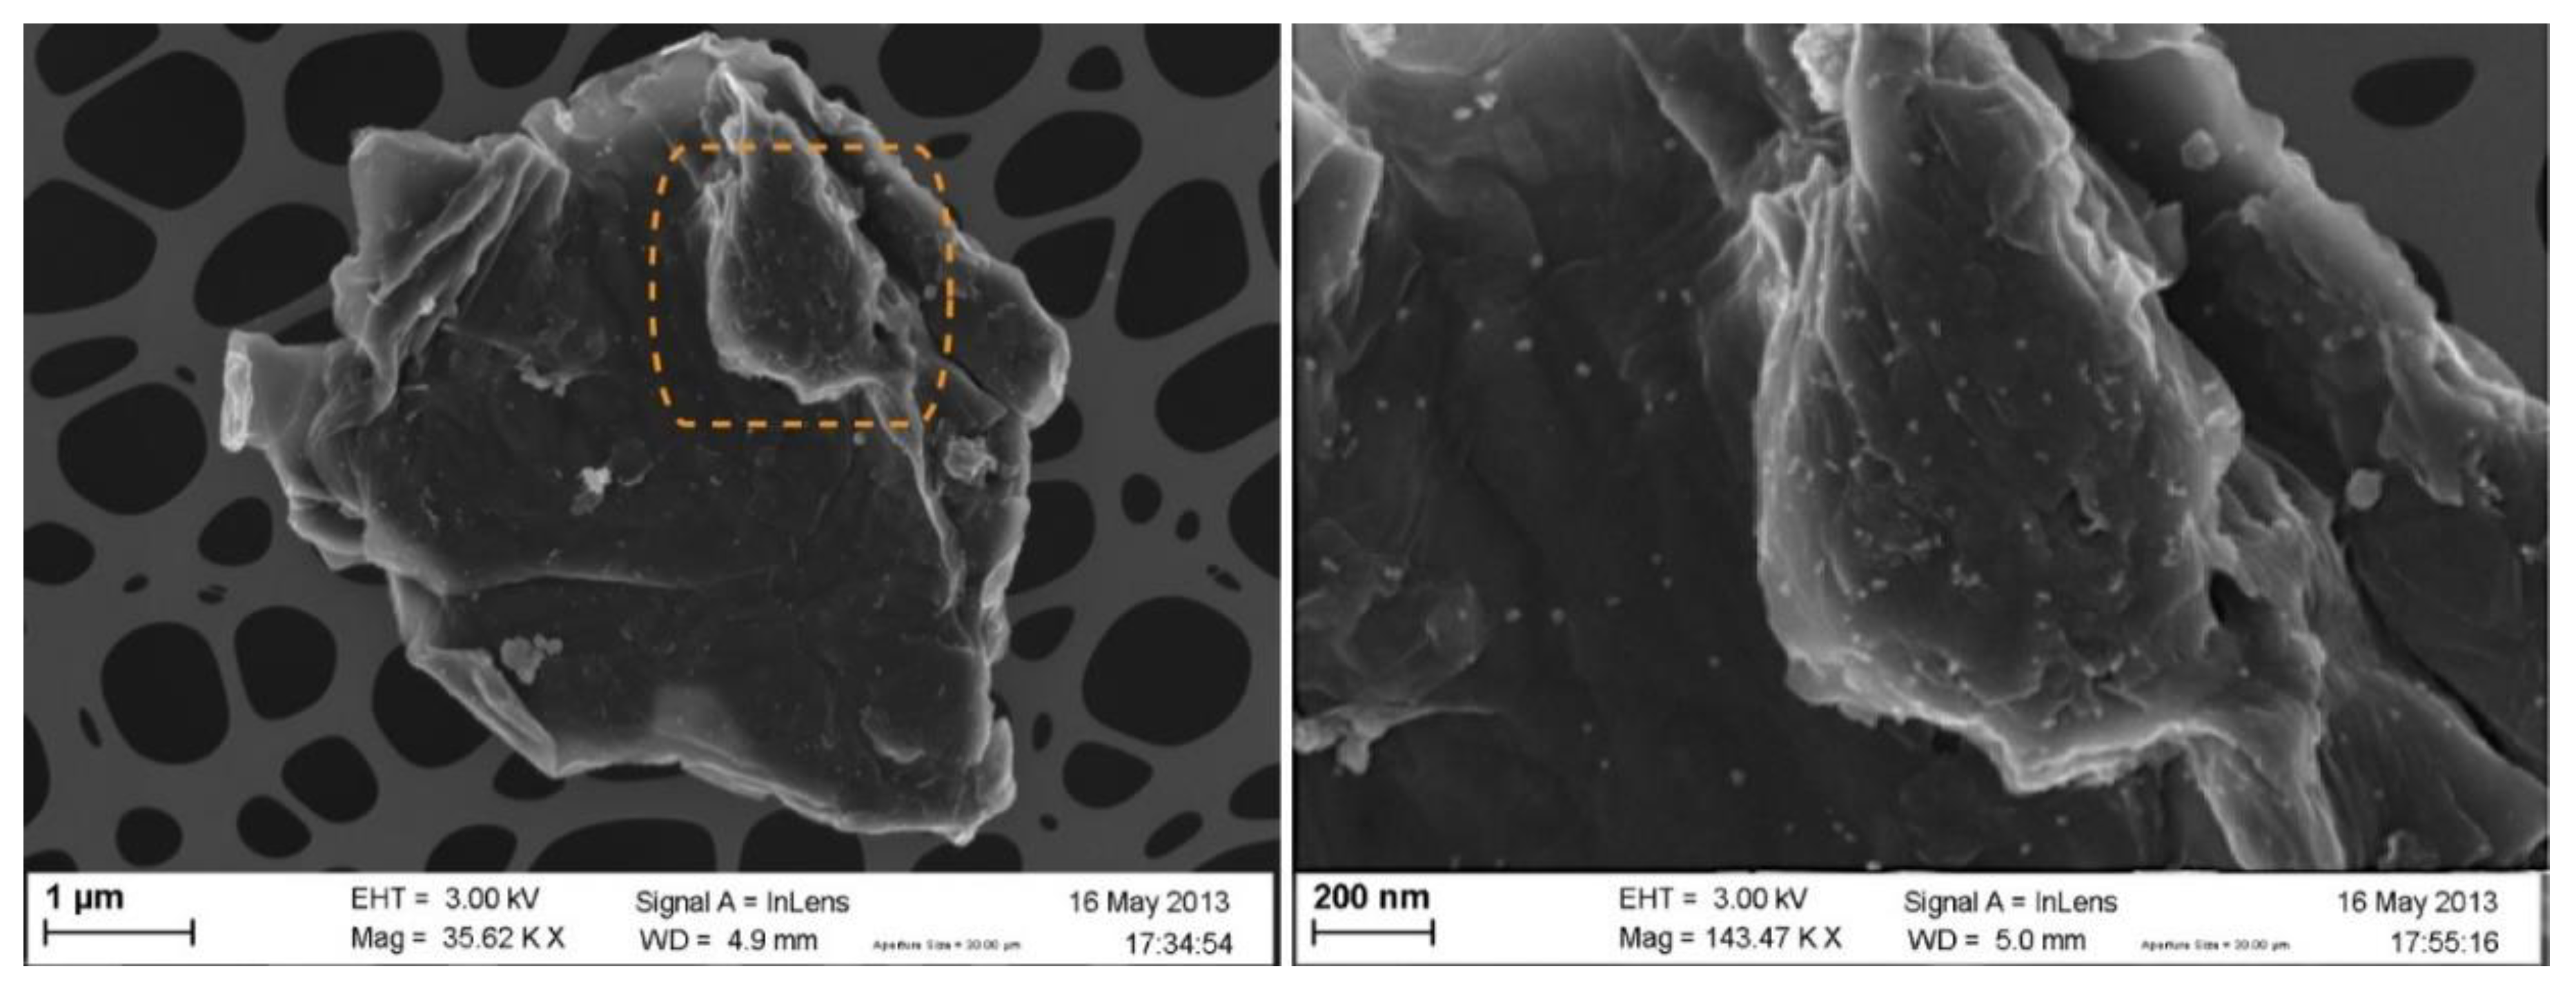
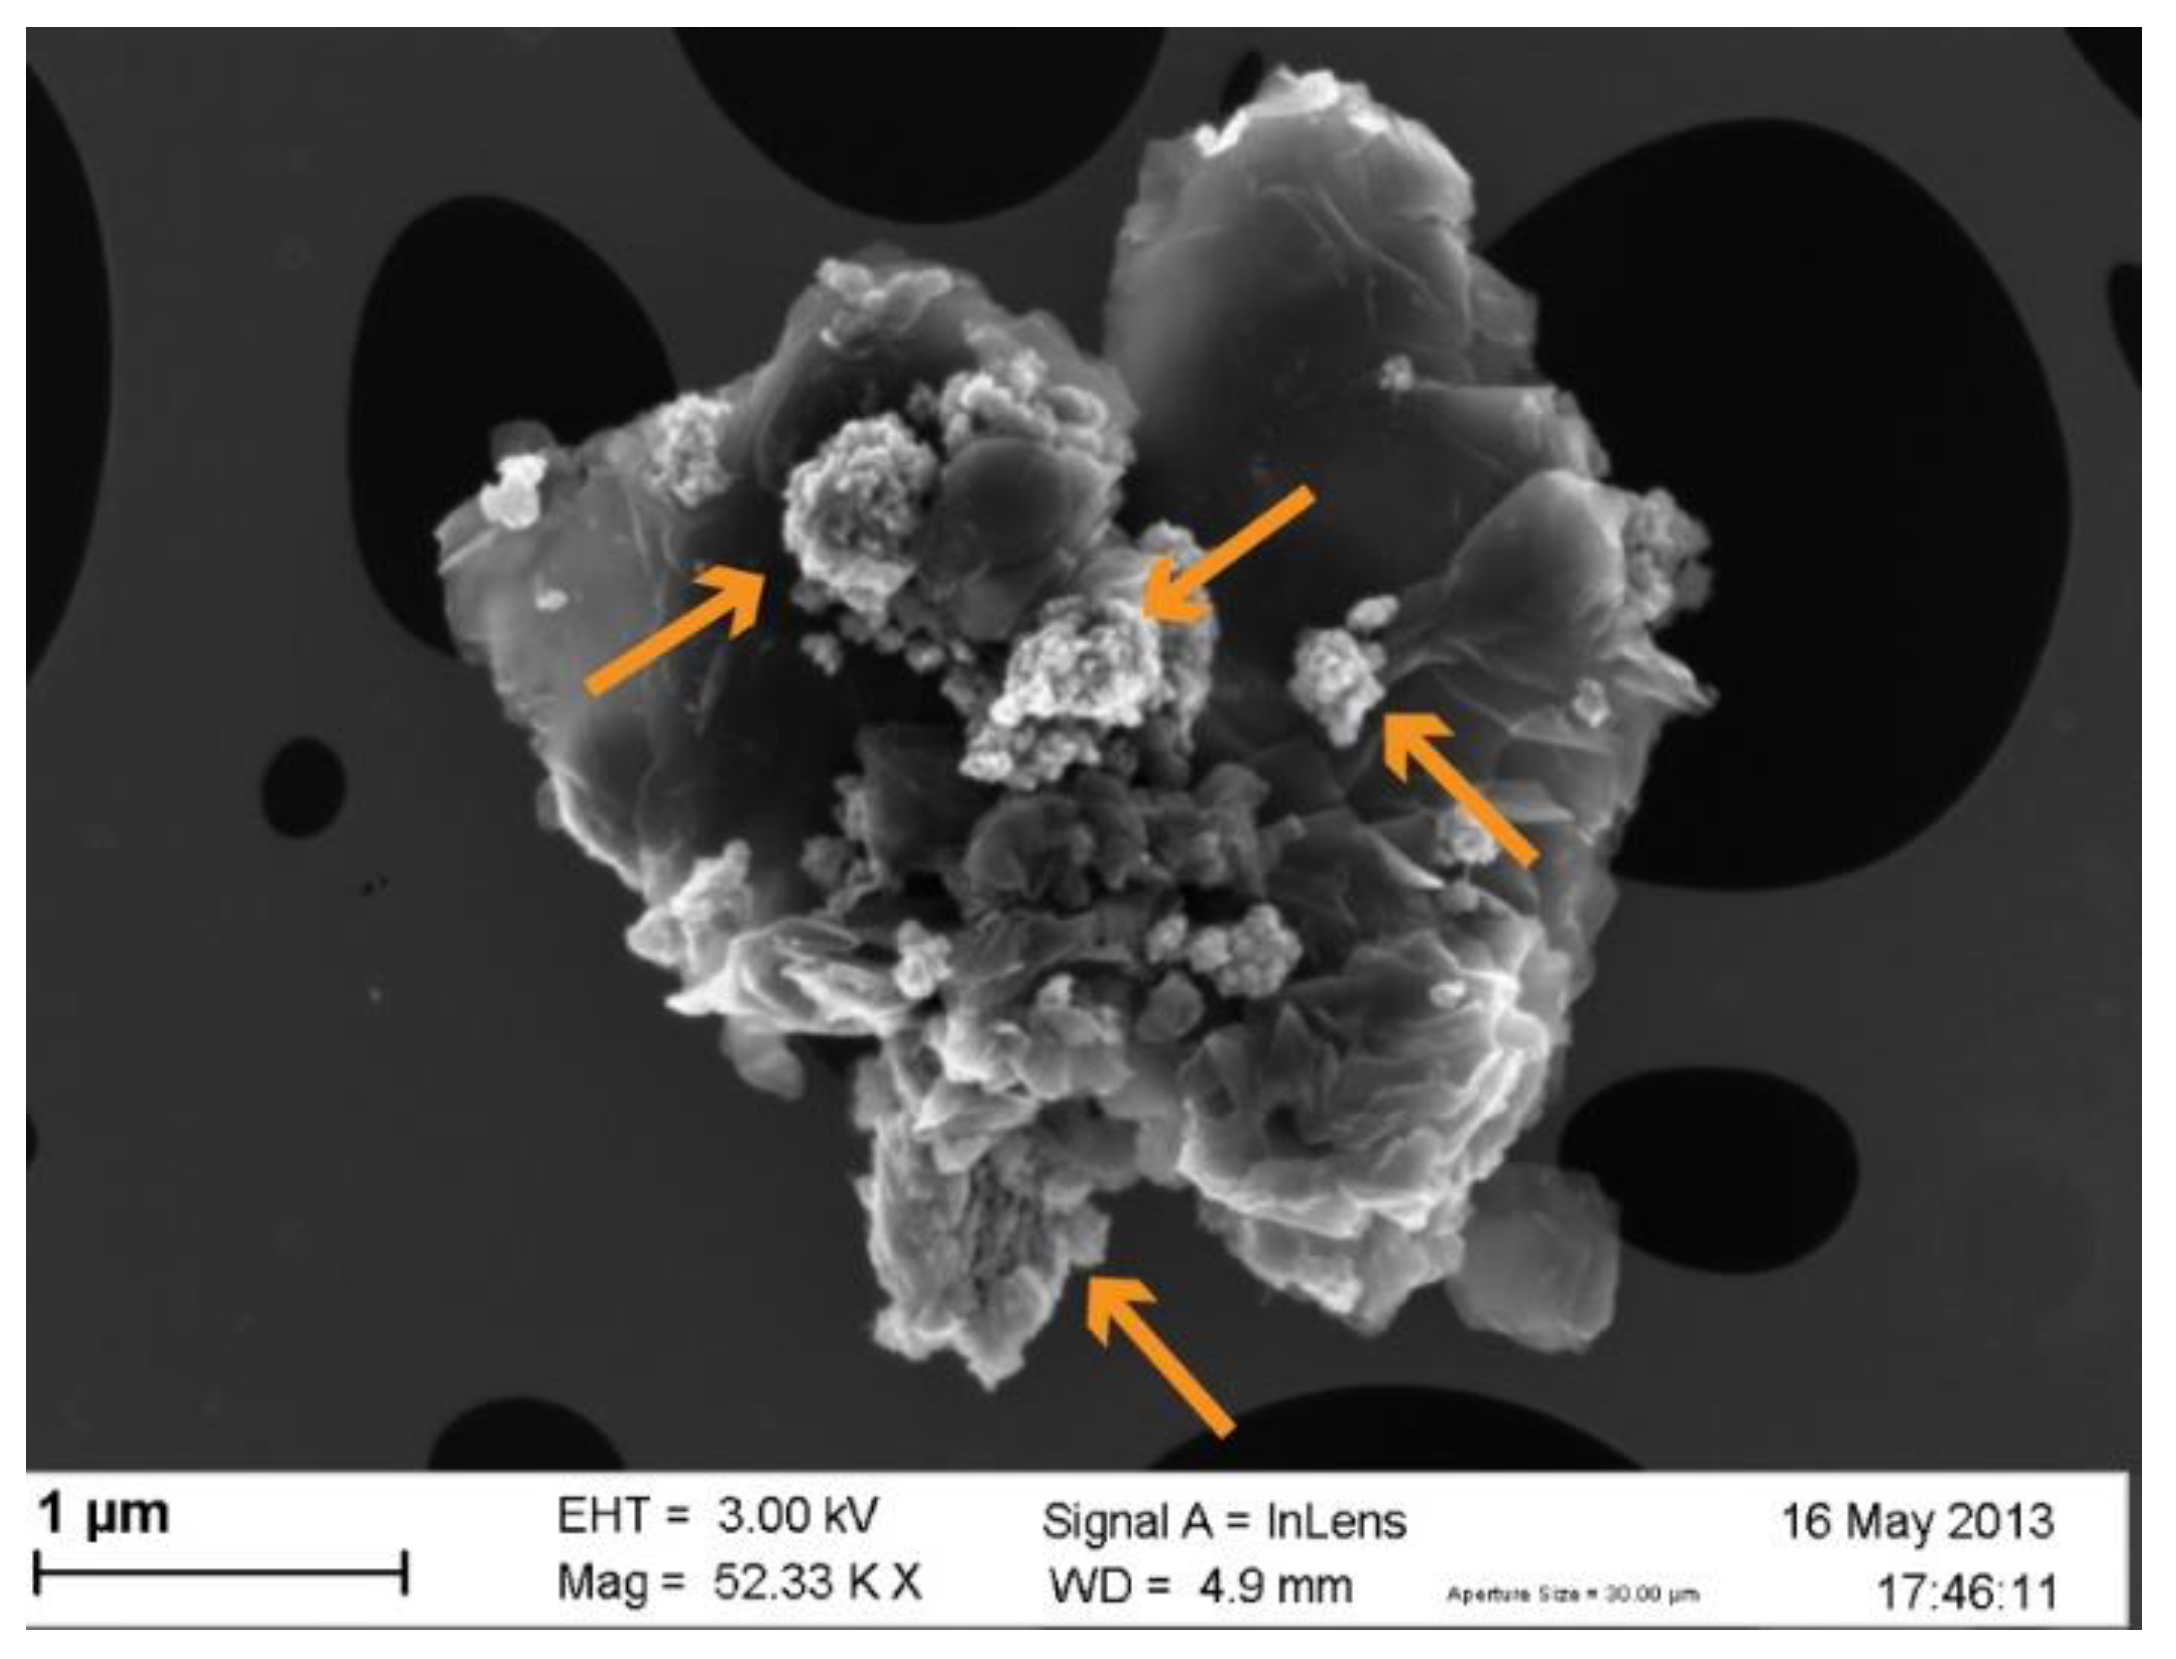
3.1.1. Morphological Characterization

In the case of the in-situ deposition of magnetite (Fe3O4) on GO, abundant precipitation of the MNPs takes place on the graphenic surface. When using the solvothermal route, the particles are homogeneously dispersed on the graphenic sheets. For composites obtained by direct co-precipitation [16], the particles agglomerate in certain areas leaving others almost uncovered (Figure 5).
A method involving covalent linkage of pre-formed magnetite nanoparticles covered by a silica coating was also tested [16]. For these products, SEM-EDX, TEM, and XPS analyses of the final products confirmed that a series of nanosized objects, presumably individual or slightly agglomerated silica-coated magnetite NPs, were covalently linked via an amide bond to the graphenic sheets (Figure 6).
However, much larger agglomerates, coexisting independently from the synthetized nanocomposites, were also found. In some cases, it seems that graphene sheets are wrapped around these agglomerates (Figure 7). These undesired objects are formed of magnetite @ silica core-shell nanoparticles.
Given these considerations, the covalent or direct co-precipitation routes were considered less suitable than the solvothermal or sol-gel approaches. The performance of the solvothermal method was thoroughly studied in terms of loading ratio, nanoparticle size, shape, and influence of the Fe precursor on these parameters. Also, the magnetic properties of the MNPs deposited on NCS were studied by a superconducting quantum interference device (SQUID), which revealed their superparamagnetic behavior [16]. Indeed, the extensive characterization of the obtained synthetic products proved that Fe3O4 is the only Fe-containing species in the obtained nanocomposites. No zero-valent iron (ZVI) could be obtained given the mild reducing conditions used during the synthesis described therein. We have nonetheless also developed other synthetic procedures to deposit ZVI@γ-Fe2O3 core-shell nanoparticles on GO. In those cases, the iron species were determined by Mossbauer spectroscopy [17] and confirmed by SQUID.

3.1.2. MNPs Spatial Distribution over the NCS (Nanocarbon Supports) Surface

The SEM and TEM inspections of three nanocomposites prepared by the solvothermal method, where the Fe/NCS weight ratios were varied from 10% to 50%, revealed that the spatial distribution over the NCS surface remains homogeneous in all cases (see Figure 8). It also showed that the MNPs stack less onto each other at lower weight ratio, forming what appears to be single layers of MNPs deposited onto the NCS surface (Figure 8c). Nevertheless, it was also observed that some areas of the support are left uncovered when engaging the lowest weight ratio value (10%).
The MNPs spatial distribution was also affected by the presence of oxygenated functions on the NCS surface. This effect was clearly observed when decorating pristine and oxidized MWCNTs using the solvothermal method at a 10% weight ratio (Figure 9). Indeed, smaller MNPs distributed along the MWCNTs surface when these were previously oxidized contrasted with only larger particle agglomerates found within the pristine MWCNT-supported samples. These results prove that the NCS oxygenated surface functions are serving as nucleation sites during the formation and growth of MNPs.

3.2. Electro-Magnetic Characterization of Nano-Inclusions

A thorough study of the electrical and magnetic properties of the various nanoinclusions taken into consideration during the Nano4waves project was performed, as described in Section 2.4.

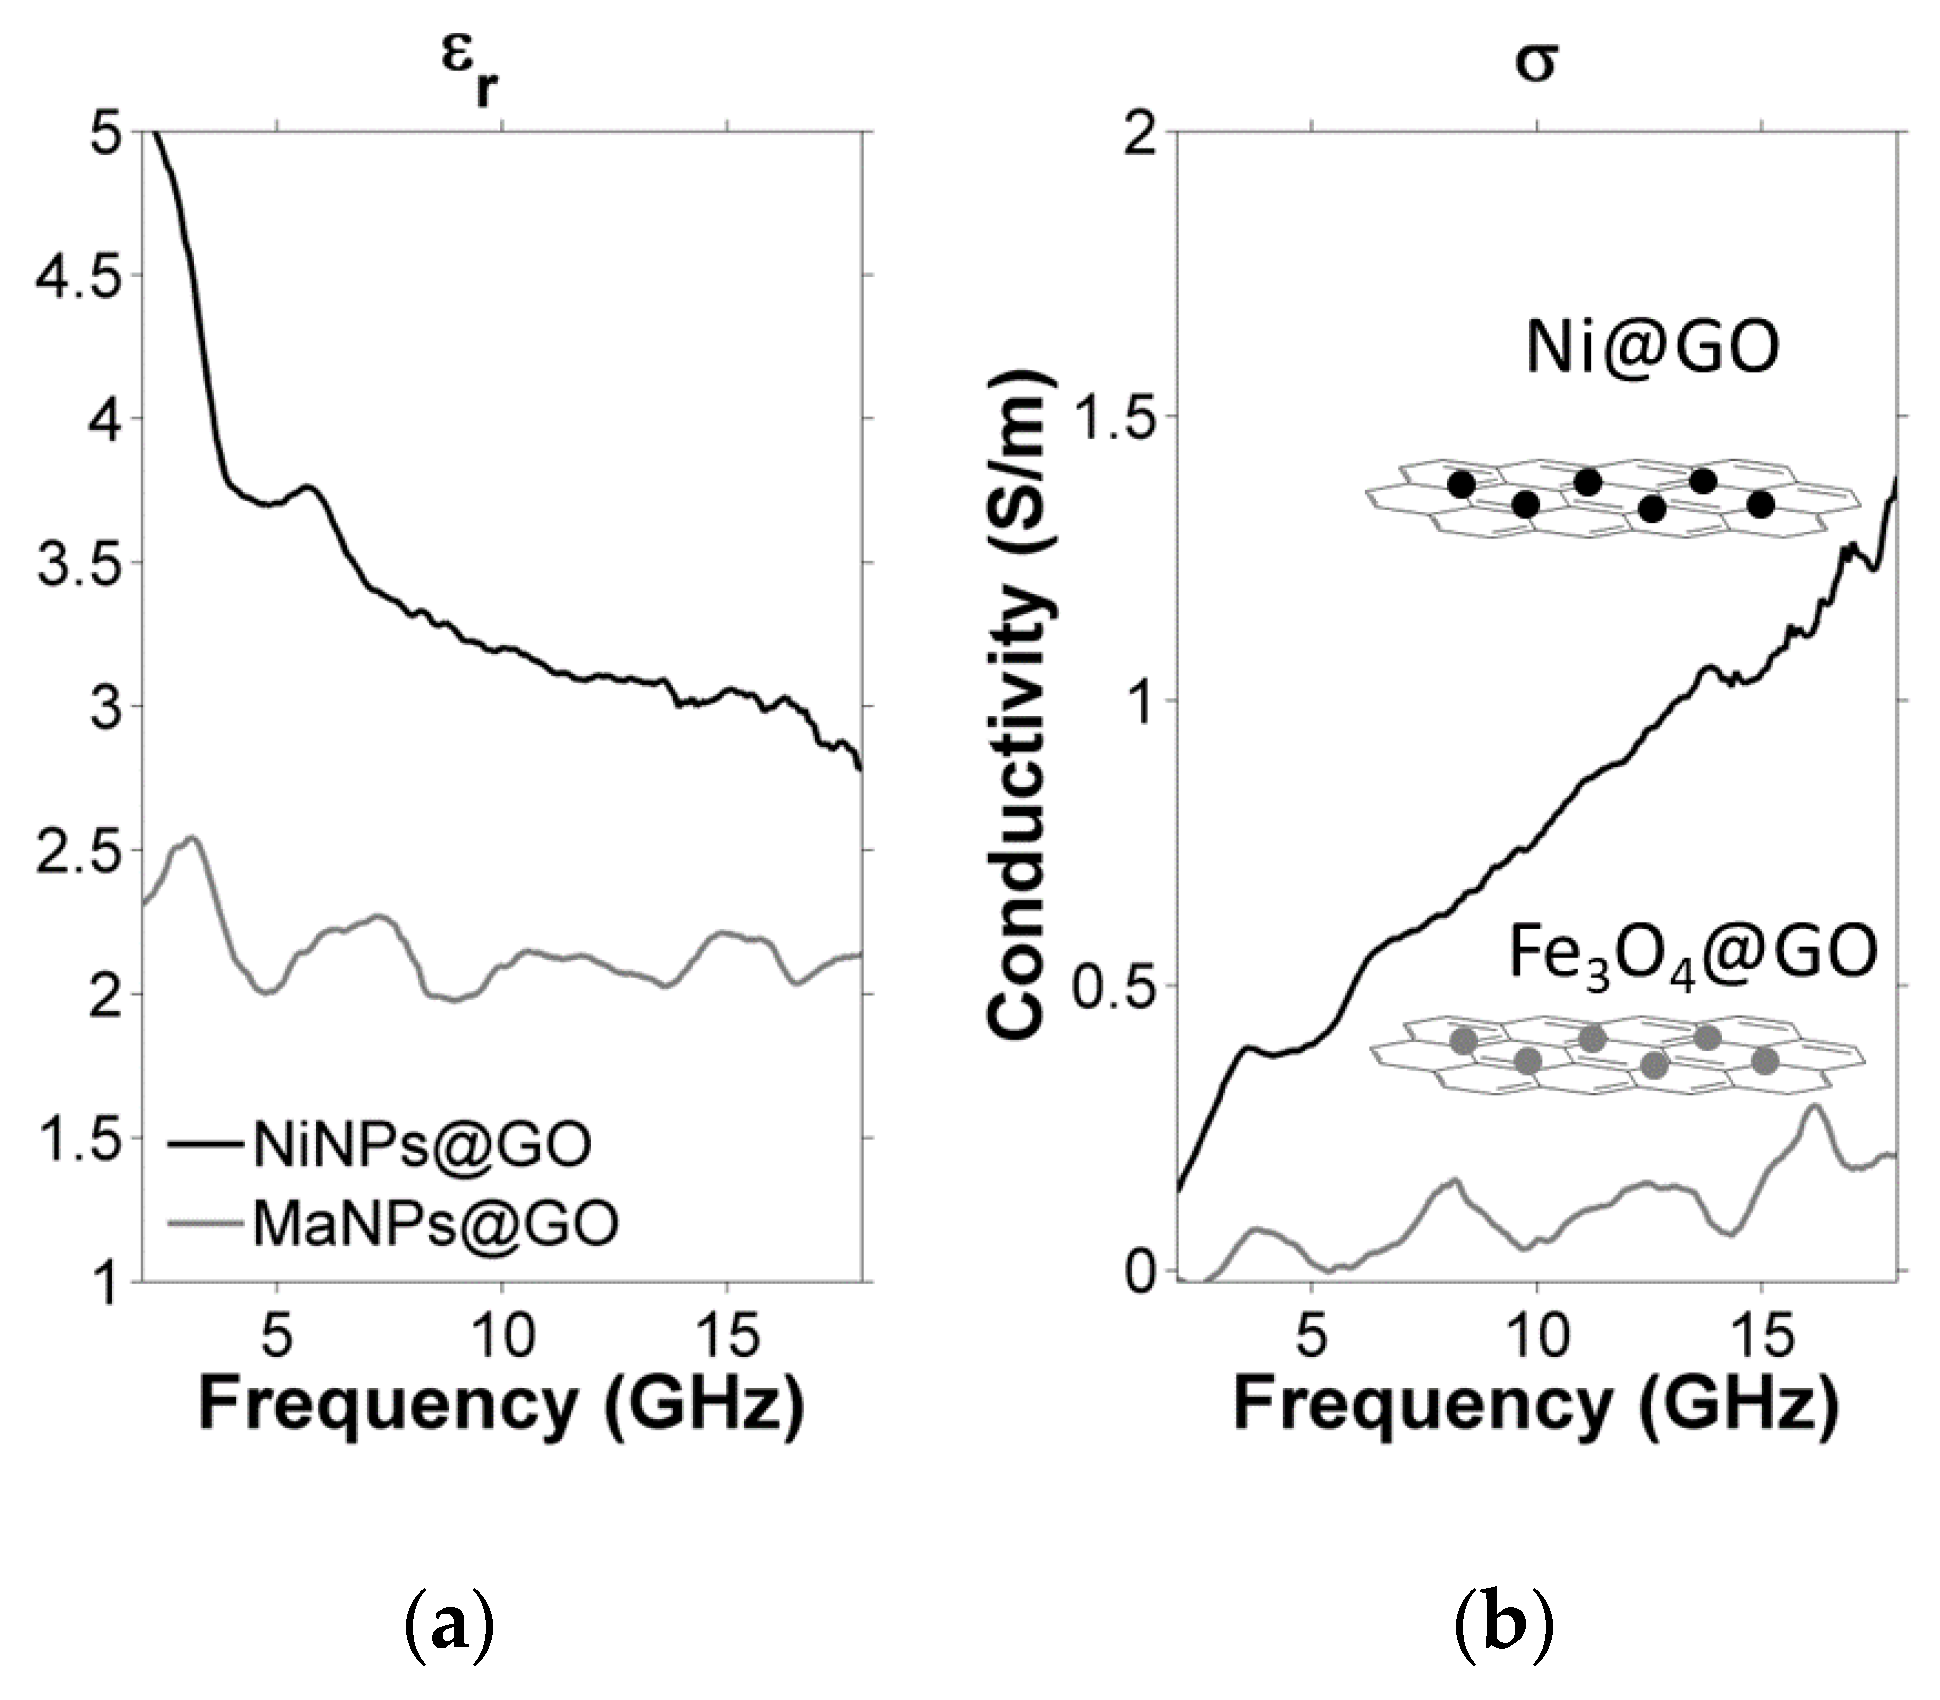
3.2.1. Electrical Characterization

As first illustration, Figure 10 shows the influence of oxidation on the dielectric constant ε, and conductivity σ, of graphenic materials. As expected, the oxidized nature of graphene oxide (GO) confirmed by XPS induces a lower conductivity than for GNPs. In turn, the dielectric constant of the latter is higher due to its conductivity, according to the Maxwell Sillars effect described in [13] and model-predicted in ref. [14,21].
The influence of the presence of MNPs on ε and σ was also investigated. Figure 11 compares electrical parameters εr and σ measured for a same 30% weight ratio of nickel (Ni) and magnetite (Fe3O4) MNPs on GO, respectively. An important difference in conductivity is observed between nickel and magnetite, in accordance with the oxidized hence insulating nature of the latter. As explained before, this difference reflects on the composite’s dielectric constant, εr.

3.2.2. Magnetic Characterization

The different types of MNPs considered during this project have as common feature the ferro- (or ferri-) magnetic property. This is of particular interest at microwaves frequencies because of the presence of a so-called ferromagnetic resonance (FMR) occurring in a specific frequency range, which is closely related to both the shape and the magnetic content of the MNPs, namely its saturation magnetization. As will be shown, the detection of the FMR frequency via microwave measurements is an efficient tool for characterizing a number of parameters of ferromagnetic MNPs, in view of the design and fabrication of novel microwave devices for the control of EM propagation.
Figure 12 shows an illustrative summary of results obtained for 10 wt.% magnetic Fe3O4 nanoparticles supported on GO. The measurements were performed for several values of DC magnetic field applied perpendicularly to the plane of the substrate (as shown in Figure 4). Figure 12a shows that absorption occurs in the transmitted signal S21 around a frequency that strongly depends on the value of applied magnetic field. The dependence is strongly linear as predicted by the Kittel theory [24]. Figure 12b shows the extracted values of permeability μ for different values of the DC field. The permeability can thus be tuned by the DC magnetic field, which is relevant for the design of adaptive and reconfigurable devices, in particular for absorbers.
FMR characterization can also serve as probing tool for magnetic content, as observed in Figure 13. It shows that the level of signal at FMR resonance is closely related to the loading rate in magnetic nanoparticles. We also demonstrate a strong correlation between the so-called natural frequency, i.e., the measured frequency where FMR resonance is observed at zero DC magnetic field, and the measured saturation magnetization Ms of the MNPs depending on their chemical nature. A proportional and linear dependence is observed in Table 3 for different iron-containing MNPs@GO.
Polycarbonate films combining NCS and magnetic nanoparticles were also considered. Films characterized in Figure 14 were prepared by mixing them in a twin co-rotating extruder and compression-molding, as described in Section 2.3. In all samples, a ferromagnetic resonance (FMR) response was observed (Figure 14a). More interestingly, samples containing the same magnetite loading and increasing GNPs content showed a significant increment of absorption, which was unexpected since graphene is not magnetic in nature. As a result, a synergy between the two components was concluded. This was further corroborated by the TEM micrographs (Figure 14b) and size distribution analysis based on TEM micrographs (Figure 14d–f) that show, for the same loading of magnetite, reduced size of magnetite nano-agglomerates with increasing GNPs concentration. The presence of high GNPs loading has the effect of increasing hydrodynamic forces during the extrusion process, which results in the breakage of larger agglomerates into smaller ones. The SQUID measurement shown in Figure 14c reveals that smaller agglomerates obtained with GNPs/MNPs mixing have a higher saturation magnetization, explaining the increase of absorption in the presence of GNPs.
A similar study was performed as detailed in [25] for PC films containing MWCNTs decorated with Ni particles, synthesized under ambient (AP) pressure or in autoclave (AC) using a solvothermal method. The procedure (AP or AC) enables control of the size of the Ni MNPs, which influences the saturation magnetization Ms, and hence the FMR frequency.

3.3. Realization of Efficient Microwaves Absorbers

This section demonstrates how the various nano-inclusions studied in the project can be combined in a hierarchical structure in order to achieve wideband absorption. The concept is illustrated through 3 different architectures: a MWCNTs-polymer absorber, a gradient-based MWCNTs-GNPs absorber, and a MNPs-MWCNTs- ink-based absorber.

3.3.1. Multi-Walled Carbon Nanotubes (MWCNTs)-Polymer Absorber

MWCNTs based nanocomposites were the first studied. Samples ranging from 1% to 5% (%w/w) MWCNTs in polycarbonate (PC) were prepared and characterized. The samples were studied by TEM. MWCNTs were found to disperse very well even at high loading. As an example, Figure 15a shows the TEM micrograph of a 1% PC MWCNT nanocomposite, in this figure a network of individual MWCNTs is clearly observed.
Further, the electromagnetic properties of the samples were characterized (see Figure 15b). All the samples showed broadband absorption in the characterized frequency range. Best absorption, around 50%, was observed at 1wt% MWCNTs loading. Absorption was found to decrease with increased MWCNTs loading. The reason is linked to higher conductivity of the composite at higher MWCNTs concentration, which increases the reflectivity, and reduces the overall absorption.
Additionally, nanocomposites with 1% GNPs were mixed with 0.5% MWCNTs to improve the electromagnetic properties. These were indeed found to have better performances compared to the nanocomposite with only 1% GNPs (see Figure 16a). This improvement is postulated to arise from the existence of a network between MWCNTs and GNPs nanoinclusions (Figure 16c). The formation of an interconnected conductive-network, along with micro-and sub-aggregates of nanofillers, induces the AC conductivity in PC-CNT-GNP composites, which may be attributed to the fact that graphene-nanoplatelets serve as a bridge connecting CNTs and vice-versa helping to form a continuous network of fillers in the composites. This explanation is supported by TEM micrographs (see Figure 16b).

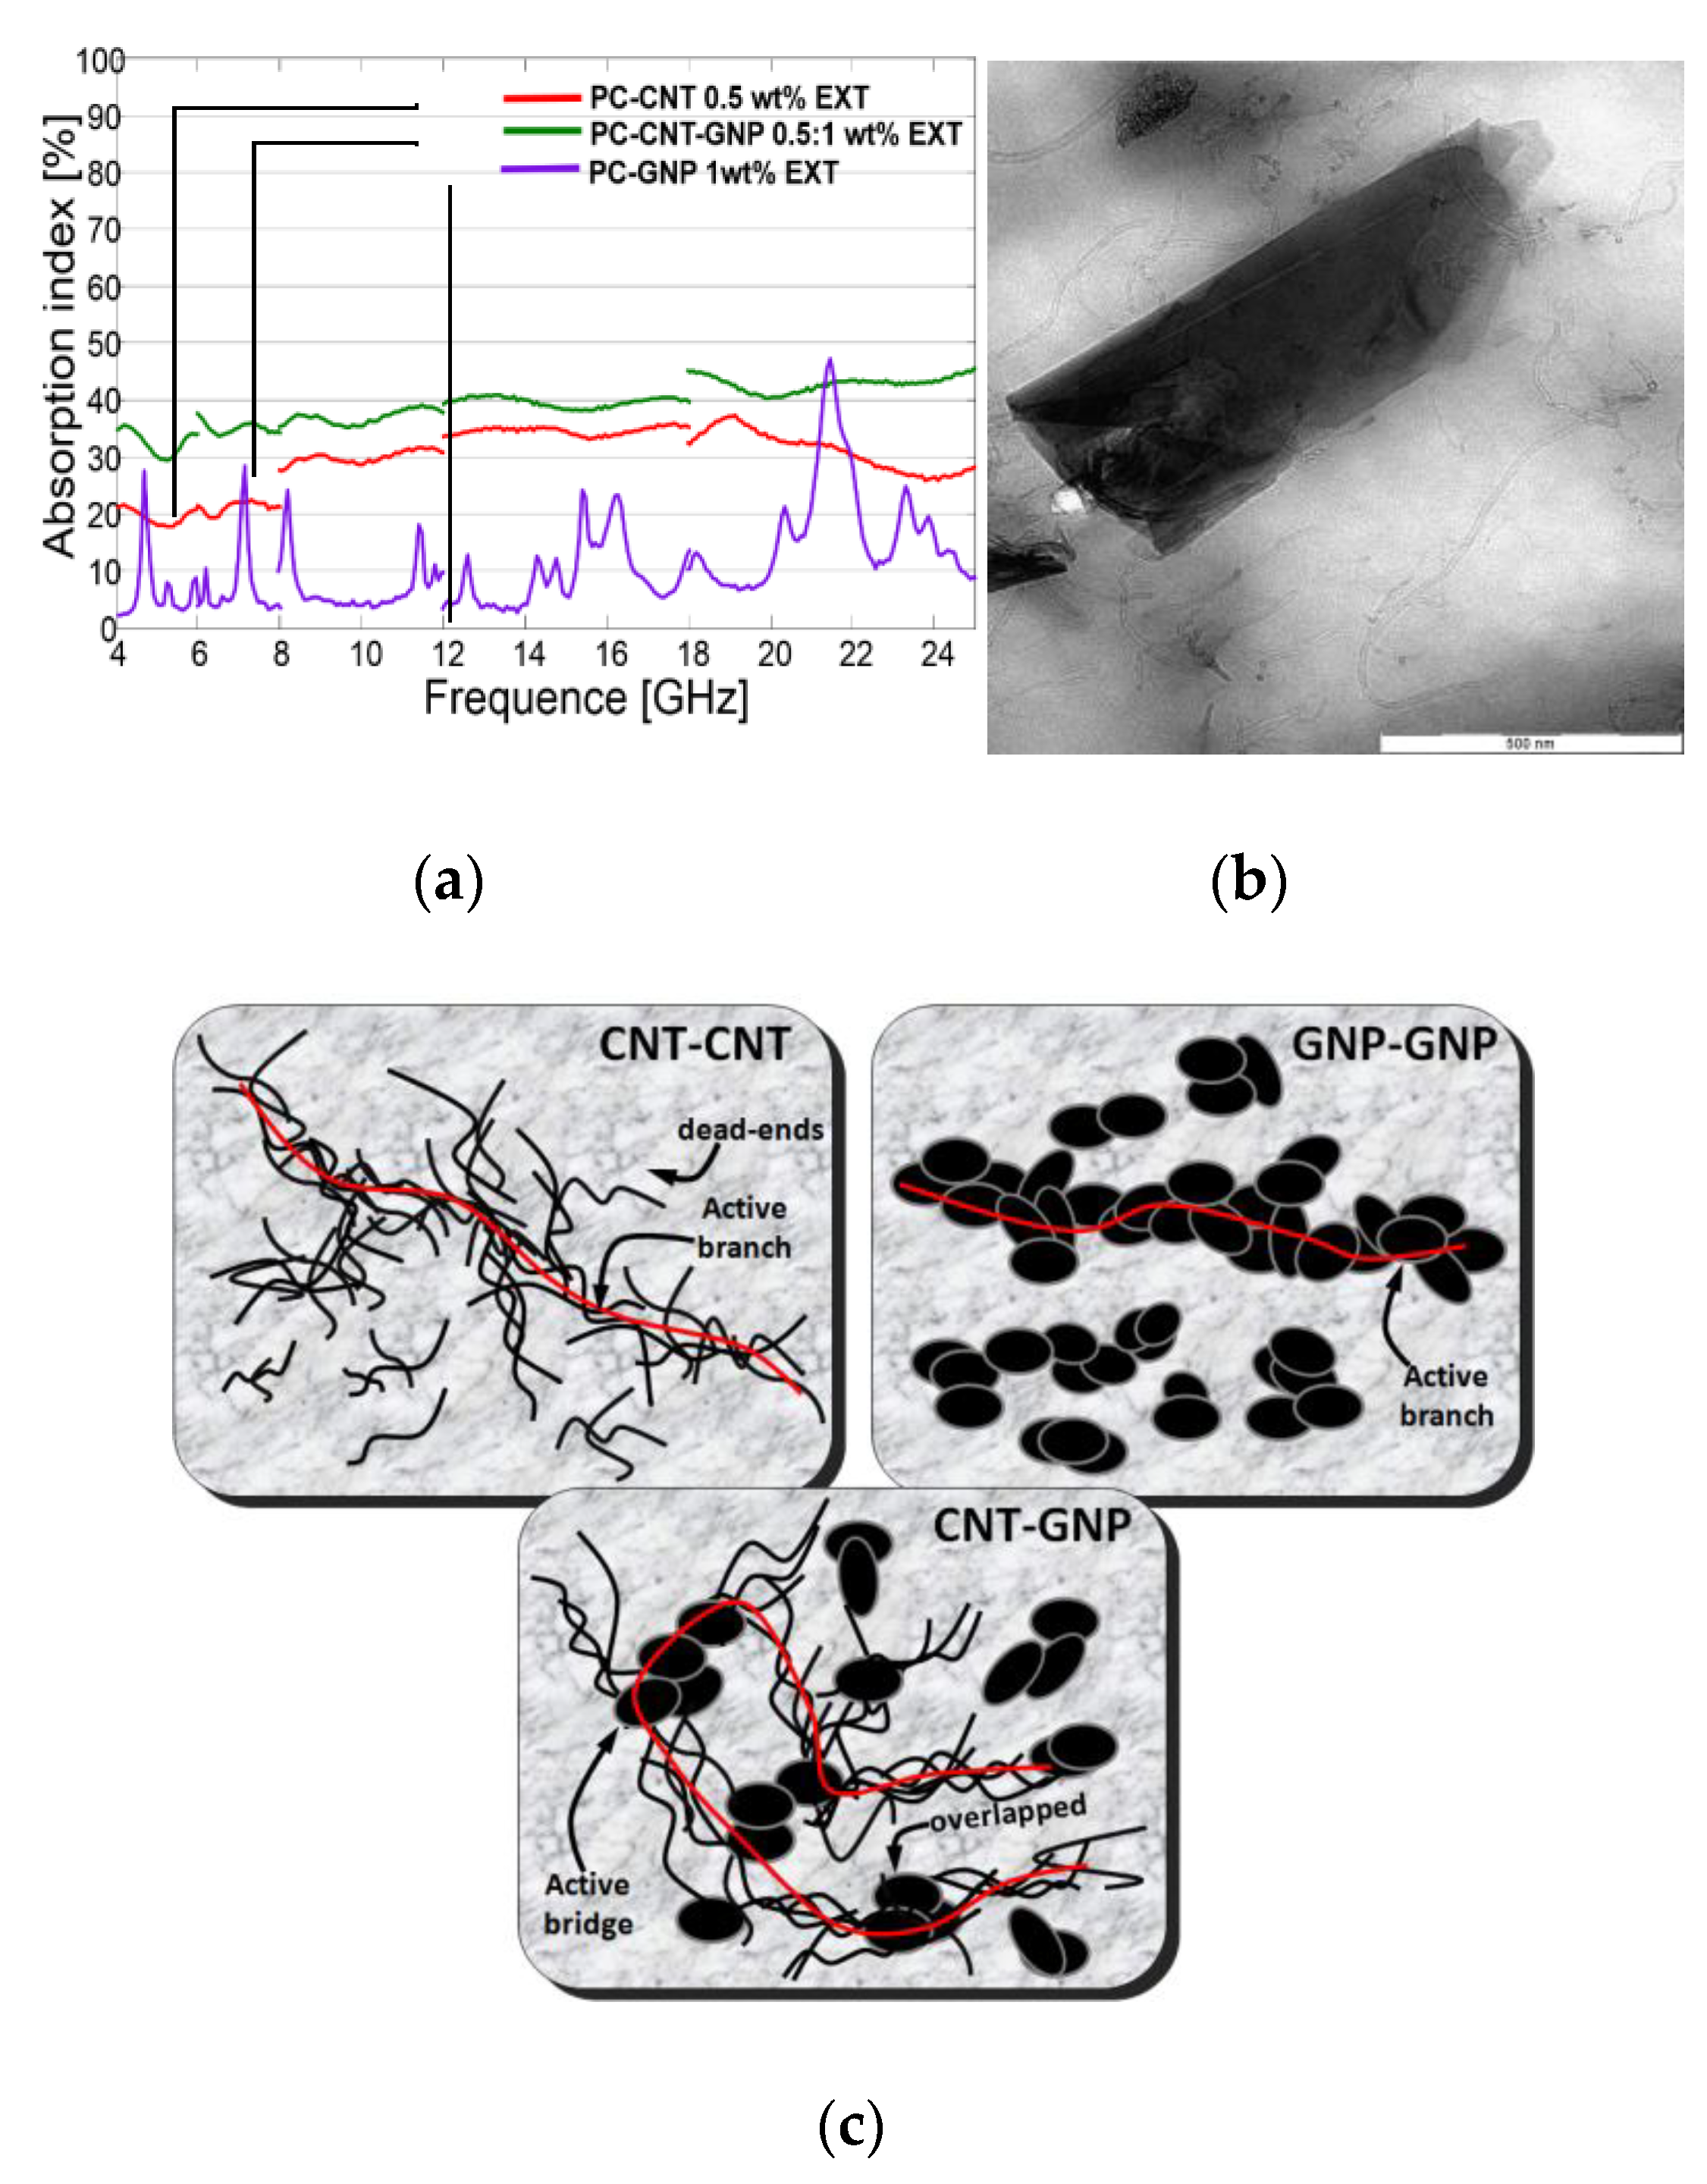
3.3.2. Multilayered Gradient Absorber

A second type of absorber is schematized in the inset of Figure 17b. It uses a stack of polymer composite films similar to those studied in the previous section, with increasing concentration of mixed MWCNTs and GNPs across the film thickness, according to column 2 of Table 4. The ε and σ parameters corresponding to each composite layer were measured using the method described in Section 2.4 and Figure 3b. As shown in columns 4 and 5 of Table 4, both ε and σ increase with overall concentration of nano-inclusions. This graded increase of the conductivity and permittivity allows a progressive penetration of the microwave signal as well as its progressive absorption through the 6-layered composite. As a consequence, the reflection can be minimized and the absorption maximized over a wide frequency range, as obtained experimentally at Figure 17 and confirmed by simulation. The operation of such kind of graded MWCNTs-GNPs nanocomposite is detailed in [18] and its behavior was announced in Section 2.1.2.

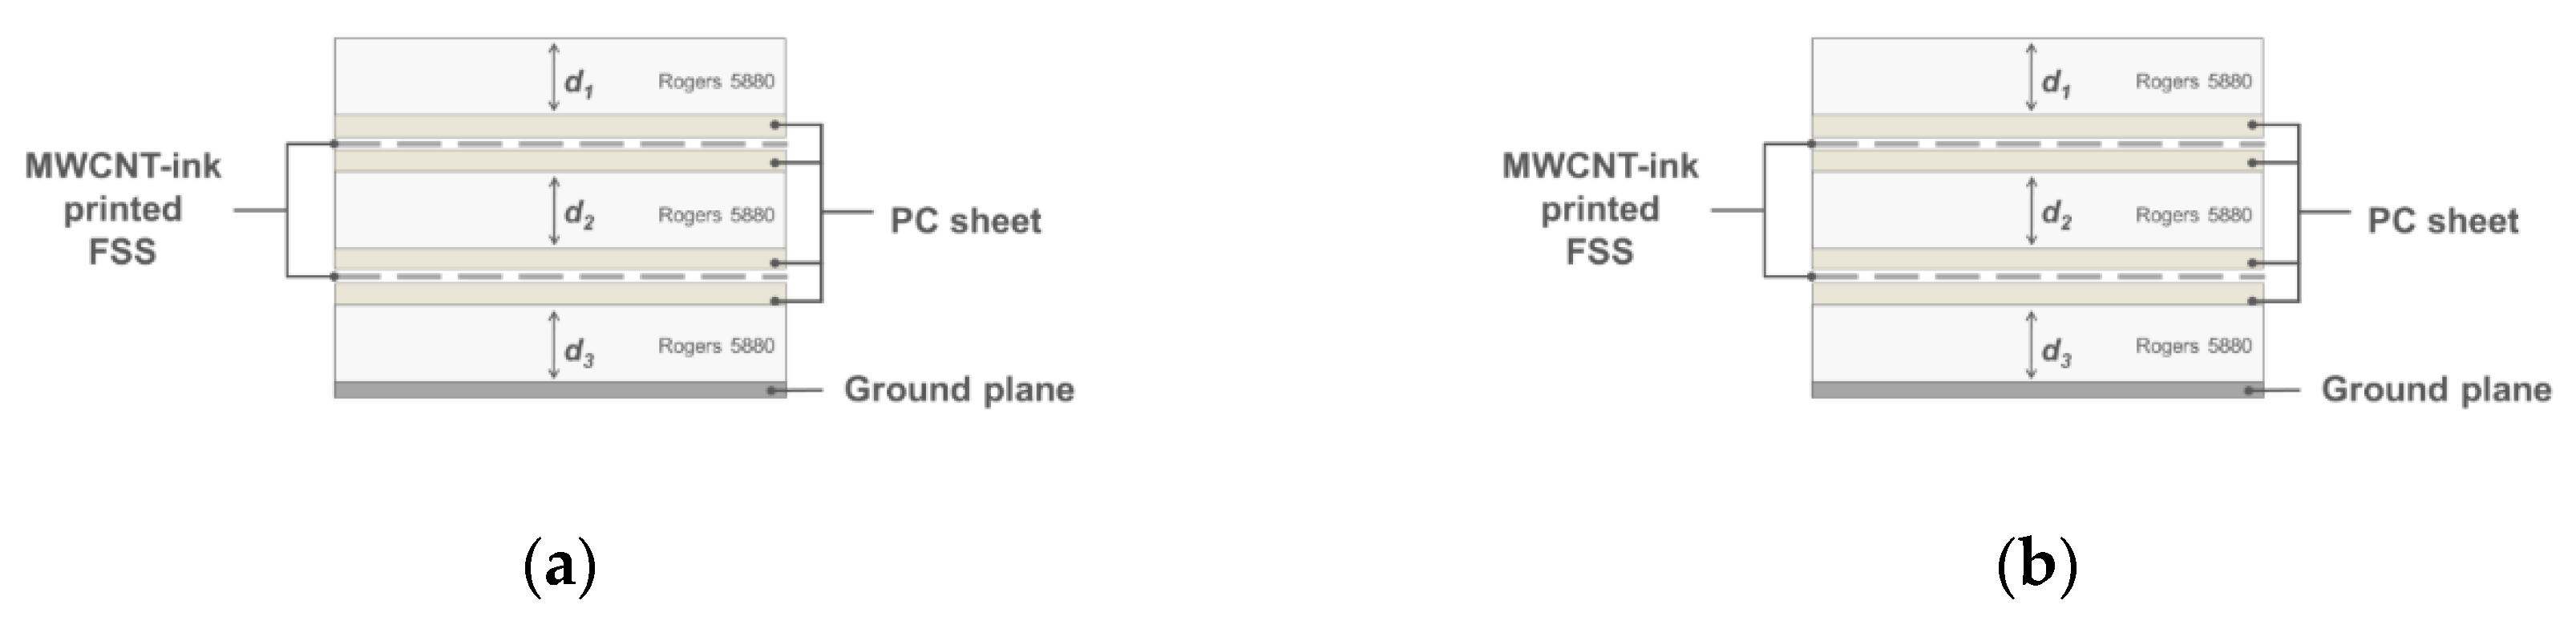
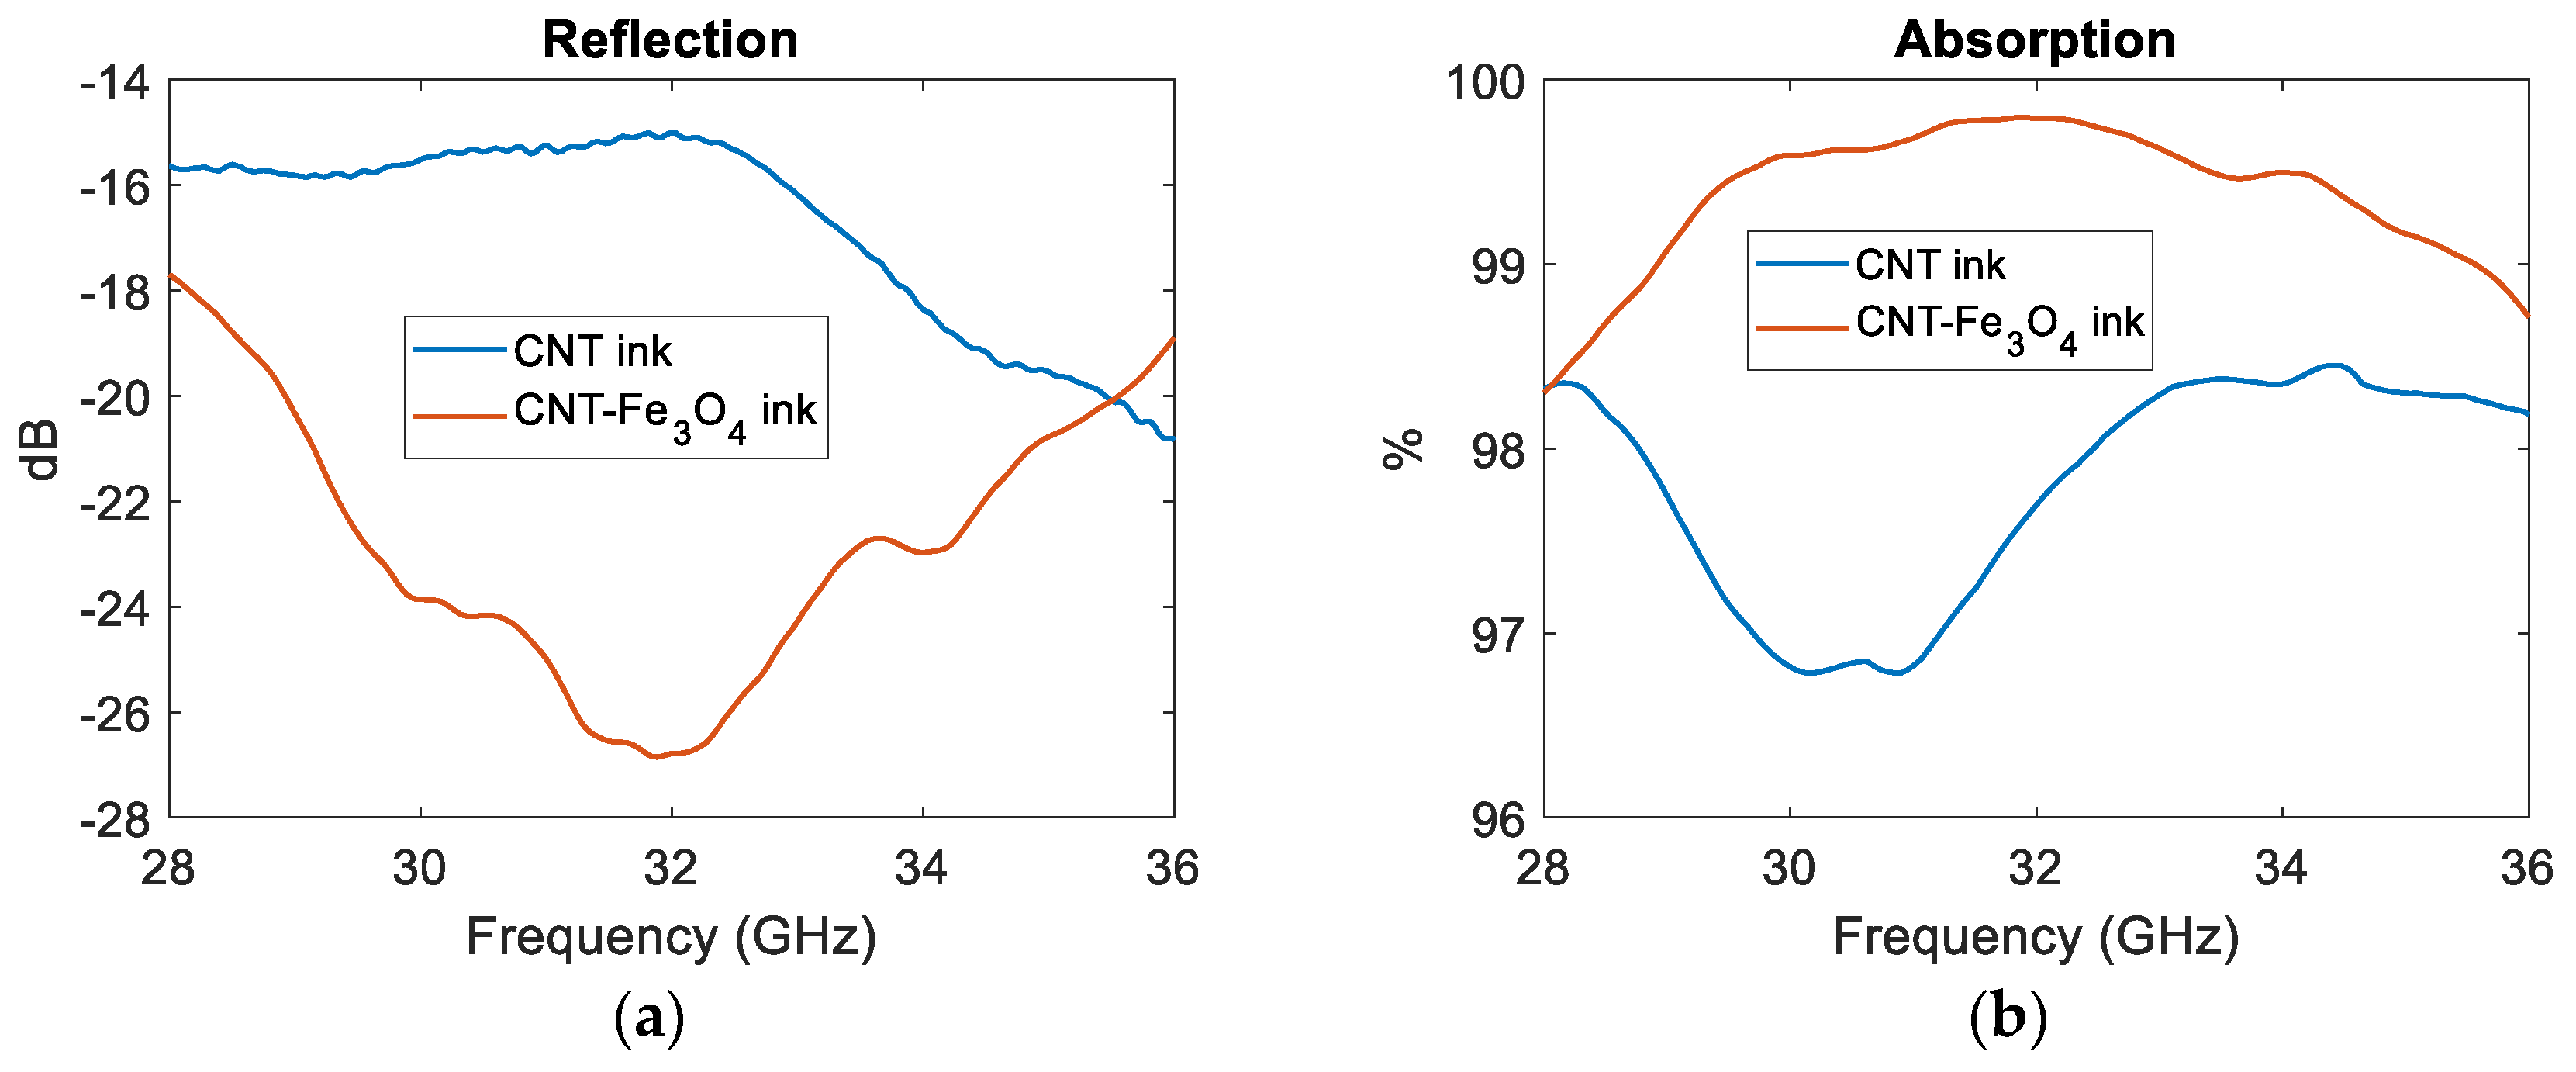
3.3.3. Ink-Based Absorber

The last kind of absorber presented in this paper has the most elaborate architecture, as shown in Figure 18. It combines a stack of insulating dielectric spacing layers with two patterns inkjet printed on thin polycarbonate films, each film being sandwiched between the insulating spacers. As shown in Figure 18b and Figure 19a, the top pattern is a Jerusalem cross, while the bottom is a square ring enclosing a dipole cross. The ink preparation, inkjet procedure and absorber design method are fully described in [26]. Here, we compare the performances of absorbers realized with pristine MWCNTs-ink with that obtained with a Fe3O4@MWCNTs ink. As explained in [26,27], the surface sheet resistance Rs of the printed ink pattern is characterized as a function of the number of printed layers (Figure 19b), while Figure 19a shows the ink-printed patterns. The sheet resistance of the Fe3O4@MWCNTs ink is higher due to the insulating nature of magnetite, as explained before. The selection of proper values for (I) the numbers of layers, (II) the top and bottom patterns and (III) the adequate dimensions of each enables to achieve ultra-wideband high absorption and low reflection for MWCNTs only and for Fe3O4@MWCNTs based absorbers, as shown in Figure 20. The benefit of the presence of magnetite nanoparticles is clearly demonstrated in Figure 20, since the corresponding absorber has the highest absorption and lowest reflection over the wide 8 GHz bandwidth, and lowest thickness (3.5 mm for Fe3O4@MWCNTs device, versus 5 mm for MWCNTs-only device) ensuring optimal compactness.

4. Conclusions

In this paper, we have taken advantage of synergies at the nanoscale between carbonaceous and magnetic metal nanoparticles in order to generate unusual combinations of effective permittivity ε, conductivity σ, and magnetic permeability μ, thanks to the interaction between waves and particles with size lower than the skin depth. This synergy has been magnified through a clever hierarchical organization, from the nano to the millimeter scale, of these nano-inclusions in a polymer hosting matrix or printable ink. The tailoring of permittivity and permeability values has been exploited through a particular control of loss mechanisms and periodicity, for the implementation of simple and compact EM metamaterials absorbers.

Author Contributions

Modeling and simulation: Y.D., H.M., R.J.; experimental investigations: F.M.-H., H.M., Y.D., R.J., supervision and funding acquisition: C.B., A.D., S.H., I.H., writing, review and editing: A.D., C.B., S.H. and I.H. All authors have read and agreed to the published version of the manuscript.

Funding

The authors are grateful to the National Fund for Scientific Research (FRS-FNRS), Belgium, for funding this research. This work is also supported by the Walloon region, and by the “Communauté Française de Belgique”, through the project “Nano4waves” funded by its research program “Actions de Recherche Concertées”.

Acknowledgments

Special thanks are due to researchers who contributed to the success of the Nano4waves project, and to the technical staff of UCLouvain technological platforms SUCH, MICA, Winfab and Welcome.

Conflicts of Interest

The authors declare no conflict of interest.

References

  1. Danlée, Y.; Jaiswar, R.; Mederos Henry, F.; Mesfin, H.; Bailly, C.; Delcorte, A.; Hermans, S.; Huynen, I. Nano4Waves: A metamaterial approach towards smart nanocomposites for nanosecond signal control. In Proceedings of the IEEE Nano 2015 (15th International Conference on Nanotechnology), Rome, Italy, 27–30 July 2015. [Google Scholar]
  2. Smith, R.; Padilla, W.J.; Vlier, D.C.; Nemat-Nasser, S.C. Composite medium with simultaneously negative permeability and permittivity. Phys. Rev. Lett. 2000, 84, 4184–4187. [Google Scholar] [CrossRef] [PubMed] [Green Version]
  3. Pendry, J. Negative diffraction makes a perfect lens. Phy. Rev. Lett. 2000, 85, 3966. [Google Scholar] [CrossRef] [PubMed]
  4. Schurig, D.; Mock, J.J.; Justice, B.J.; Cummer, S.A.; Pendry, J.; Starr, A.F.; Smith, D.R. Metamaterial electromagnetic cloak at microwave frequencies. Science 2006, 314, 977–980. [Google Scholar] [CrossRef] [Green Version]
  5. Danlée, Y.; Huynen, I.; Bailly, C. Multilayer cylindrical invisibility cloak at microwave frequencies built from polymer and carbon nanotubes. Microw. Opt. Technol. Lett. 2017, 59, 65–69. [Google Scholar] [CrossRef]
  6. Handbook of Metamaterials; Capolino, F. (Ed.) CRC Press: New York, NY, USA, 2009. [Google Scholar]
  7. Jaiswar, R.; Danlée, Y.; Mesfin, H.; Delcorte, A.; Hermans, S.; Bailly, C.; Raskin, J.-P.; Huynen, I. Absorption modulation of FSS-polymer nanocomposites through incorporation of conductive nanofillers. Appl. Phys. A 2017, 123, 164. [Google Scholar] [CrossRef]
  8. Wang, C.; Chen, M.; Lei, H.; Zeng, Z.; Yao, K.; Yuan, X.; Fang, D. Frequency-selective-surface based sandwich structure for both effective loadbearing and customizable microwave absorption. Compos. Struct. 2020, 235, 111792. [Google Scholar] [CrossRef]
  9. Yablonovitch, E. Photonic crystals. J. Phys. D Condens. Matter 1998, 5, 2443. [Google Scholar] [CrossRef]
  10. Saib, A.; Platteborze, R.; Huynen, I. Experimental demonstration of the origin of Photonic Bandgap creation and associated defect modes in microwave planar circuits. Microw. Opt. Technol. Lett. 2004, 41, 5. [Google Scholar] [CrossRef]
  11. Saib, A.; Huynen, I. Transmission lines on Periodic Bandgap metamaterials: From microwaves to opt Aics applications. J. Opt. A Pure Appl. Opt. 2005, 7, S124–S132. [Google Scholar] [CrossRef]
  12. Danlée, Y.; Huynen, I.; Bailly, C. Frequency-Selective Multilayer EBG Structure Combining Carbon Nanotubes with Polymeric or Ceramic Substrates. Appl. Phys. Lett. 2014, 105, 123118. [Google Scholar] [CrossRef]
  13. Emplit, A.; Huynen, I. Study of absorption in carbon nanotube composites from 1 Hz to GHz range. Int. J. Microw. Eng. 2017, 2, 13. [Google Scholar]
  14. Saib, A.; Bednarz, L.; Daussin, R.; Bailly, C.; Lou, X.; Thomassin, J.M.; Pagnoulle, C.; Detrembleur, C.; Jerome, R.; Huynen, I. Carbon Nanotube Composites for Broadband Microwave Absorbing Materials. IEEE Trans. Microw. Theory Tech. 2006, 54, 2745–2754. [Google Scholar] [CrossRef]
  15. Danlée, Y.; Huynen, I.; Bailly, I. Thin smart multilayer microwave absorber based on hybrid structure of polymer and carbon nanotubes. Appl. Phys. Lett. 2012, 100, 2012. [Google Scholar] [CrossRef]
  16. Mederos-Henry, F.; Pichon, B.; Tchuitio Yagang, Y.; Delcorte, A.; Bailly, C.; Huynen, I.; Hermans, S. Decoration of nanocarbon supports with magnetite nanoparticles: Towards microwave-responsive metamaterials. J. Mater. Chem. C 2016, 4, 3290–3303. [Google Scholar] [CrossRef]
  17. Mederos-Henry, F.; Mahin, J.; Pichon, B.; Durtu, M.; Garcia, Y.; Delcorte, A.; Bailly, C.; Huynen, I.; Hermans, S. Highly efficient wideband microwave absorbers based on zero-valent Fe@γ-Fe2O3 and Fe/Co/Ni carbon-protected alloy nanoparticles supported on reduced graphene oxide. Nanomaterials 2019, 9, 1196. [Google Scholar] [CrossRef] [Green Version]
  18. Jaiswar, R.; Bailly, C.; Hermans, S.; Raskin, J.P.; Huynen, I. Wideband microwave absorption in thin nanocomposite films induced by a concentration gradient of mixed carbonaceous nanostructures. J. Mater. Sci. Mater. Electron. 2019, 30, 19147–19153. [Google Scholar] [CrossRef]
  19. Mesfin, H.; Hermans, S.; Huynen, I.; Delcorte, A.; Bailly, C. Thin oriented polymer carbon nanotube composites for microwave absorption. Mater. Today 2015, 3, 491–496. [Google Scholar] [CrossRef]
  20. Pötschke, P.; Bhattacharyya, A.R.; Janke, A. Melt mixing of polycarbonate with multiwalled carbon nanotubes: Microscopic studies on the state of dispersion. Eur. Polym. J. 2004, 40, 137–148. [Google Scholar] [CrossRef]
  21. Mederos-Henry, F.; Hermans, S.; Huynen, I. Microwave characterization of metal-decorated carbon nanopowders using a single transmission line. J. Nanomater. 2019, 2019, 3280461. [Google Scholar] [CrossRef]
  22. Mederos-Henry, F.; Hermans, S.; Huynen, I. Coplanar Waveguide Method for Microwave and Ferromagnetic Resonance Characterization of Nanocarbon Powders decorated with Magnetic Nanoparticles. Microw. Opt. Technol. Lett. 2017, 59, 2330–2335. [Google Scholar] [CrossRef]
  23. Quiévy, N.; Bollen, P.; Thomassin, J.M.; Detrembleur, C.; Pardoen, T.; Bailly, C.; Huynen, I. Electromagnetic absorption properties of carbon nanotube nanocomposite foam filling honeycomb waveguide structures. IEEE Trans. Electromagn. Compat. Spec. Issue Nanotechnol. 2012, 54, 43–51. [Google Scholar] [CrossRef]
  24. Kittel, C. On the theory of ferromagnetic resonance. Phys. Rev. 1949, 73, 155. [Google Scholar] [CrossRef]
  25. Mederos-Henry, F.; Depaifve, S.; Wolf, A.; Delcorte, A.; Bailly, C.; Huynen, I.; Hermans, S. Thin Microwave Absorber Films based on Multi-walled Carbon Nanotubes Solvothermally Decorated with Nickel Nanoparticles. Compos. Sci. Technol. 2020, 187, 107187. [Google Scholar] [CrossRef]
  26. Jaiswar, R.; Mederos-Henry, F.; Dupont, V.; Hermans, S.; Raskin, J.P.; Huynen, I. A ultra-wideband thin microwave absorber using inkjet-printed Frequency Selective Surfaces combining carbon nanotubes and magnetic nanoparticles. Appl. Phys. A 2017, 125, 473. [Google Scholar] [CrossRef]
  27. Jaiswar, R.; Mederos-Henry, F.; Dupont, V.; Hermans, S.; Raskin, J.P.; Huynen, I. Inkjet-printed Frequency Selective Surfaces based on carbon nanotubes for ultrawideband thin microwave absorbers. J. Mater. Sci. Mater. Electron. 2019. [Google Scholar] [CrossRef]
Figure 1. Strategy for controlling electromagnetic propagation: (a) nanocarbon support NCS (CNT or graphene) for controlling dielectric constant εr and conductivity σ; (b) magnetic nanoparticles (MNPs) for controlling permeability μr and (c) combination of NCS and MNPs for improving EM performances.
Applsci 10 01102 g001
Figure 2. (a) Stacks alternating insulating and conductive PC sheets according to the method described in [15] (b) simulation demonstrating that stacking into gradient of conductivity improves absorption in a wide frequency range: five layers having conductivity linearly rising from 3 to 15 S/m are stacked between pure polymer layers. The dashed curves correspond to uniform concentration from layer to layer.
Applsci 10 01102 g002
Figure 3. (a) Measurement configuration for nanoinclusions powders (b) measurement configuration for absorber thin plates, adapted from [23].
Applsci 10 01102 g003
Figure 4. Measurement cell for nanopowders (a) microstrip configuration (b) coplanar configuration. Adapted from [21].
Applsci 10 01102 g004
Figure 5. SEM (top) and TEM (bottom) images of the GO-supported magnetite Fe3O4 nanocomposites obtained by direct co-precipitation (left) and solvothermolysis (right) [16], evidencing the differences in distribution of the magnetite NPs over the graphenic surface.
Applsci 10 01102 g005
Figure 6. SEM images of the covalently-linked silica-coated Fe3O4 magnetite nanocomposite. A magnification of the zone indicated by the dashed orange rectangle (left image) was made to evidence the presence of a series of nanosized objects (right image) considered to be the silica coated MNPs.
Applsci 10 01102 g006
Figure 7. SEM image of large micrometric agglomerates of functionalized silica-coated Fe3O4 MNPs (indicated by orange arrows) found during the analysis of the covalently-linked products. These were found in close contact with GO sheets.
Applsci 10 01102 g007
Figure 8. SEM (left column) and TEM (right column) images of Fe3O4@GO nanocomposites produced via the solvothermal method [16] at 50% (a), 30% (b) and 10% (c) Fe/NCS loading rate.
Applsci 10 01102 g008
Figure 9. TEM images of Fe3O4 deposited onto oxidized (a) or pristine (b) MWCNTs using the solvothermal method [16].
Applsci 10 01102 g009
Figure 10. (a) Comparison of electrical parameters εr and σ for GNPs and GO; (b) XPS analysis confirming the higher oxygen content in GO, responsible for lower σ.
Applsci 10 01102 g010
Figure 11. (a) Comparison of electrical parameters εr (a) and σ (b) for nickel (Ni) and magnetite loaded at 30% on graphene oxide (GO).
Applsci 10 01102 g011
Figure 12. (a) Dependence of FMR phenomenon on applied DC magnetic field ranging from 0 kOe to 7 kOe, for magnetic Fe3O4@GO nanoparticles (b) real (top) and imaginary (bottom) part of permeability μr.
Applsci 10 01102 g012
Figure 13. FMR (ferromagnetic resonance) intensity response at 4 kOe influenced by MNPs/NCS weight ratio (LR = loading rate in wt.%), for magnetite (Fe3O4) MNPs deposited onto GO supports.
Applsci 10 01102 g013
Figure 14. (a) Transmission (S12) (Here to help observe the resonance property as the DC magnetic field applied, S12 is taken as a difference between S12 at the applied DC magnetic field (1 KOe–9 KOe) and S12 at 0 Oe) measured for thin film containing GNPs and MNPs, as a function of applied DC magnetic field in range 0–9 kOe; all columns contain the same magnetic weight percentage and all rows contain the same GNPs amount (b) TEM images of PC with 2.5% MNPs (left) and 2.5%MNPs+10%GNPs (right) (c) measurements of saturation magnetization obtained with a MPMS-XL5 SQUID magnetometer (Quantum Design, U.S.A.) (df) size distribution of MNP for 1%, 2.5% and 5% at different concentration of GNPs respectively.
Applsci 10 01102 g014aApplsci 10 01102 g014b
Figure 15. (a) TEM micrograph of PC-CNT nanocomposite (b) absorption index from equation (2) for PC-CNT nanocomposite.
Applsci 10 01102 g015
Figure 16. (a) Improvement of absorption performance by using a mixture of MWCNTs and GNPs (b) TEM micrograph of PC containing MWCNTs-GNPs 0.5: 1% (% w/w) (c) Schematic illustration of interconnected conductive nanofillers network formation of CNT and/or GNPs in the polymer nanocomposite (adapted from [18]).
Applsci 10 01102 g016
Figure 17. (a) Measured and computed (a) Reflection coefficient ( S 11 ) (b) Absorption for 6-layer multilayer absorber.
Applsci 10 01102 g017
Figure 18. (a) cross-section (b) unit cell of ink-based absorber where ax = ay= 9 mm. Adapted from [27].
Applsci 10 01102 g018
Figure 19. (a) ink-printed patterns (adapted from [26]: left Jerusalem cross, center square ring enclosing a dipole cross, right perspective view) (b) measured surface resistance for MWCNTs only-ink and for magnetite@MWCNTs-ink as function of number of prints.
Applsci 10 01102 g019
Figure 20. Comparison of performances for MWCNTs-only and Fe3O4@MWCNTs- ink-printed absorbers: (a) reflection (b) absorption.
Applsci 10 01102 g020
Table 1. Nanocarbon supports used in the project.
NameSpecificationCompanyCountry
Multi-walled carbon nanotubes (MWCNTs)NC7000, 90%C purity
NC3100, 95%C purity
NanocylBelgium
Graphene oxide (GO)-Nanoinnova Technologies SLSpain
Reduced graphene oxide (rGO)-
Graphene nanoplatelets (GNP)TIMREX C-Therm 002 and TIMREX BNB90ImerysSwitzerland
Table 2. Summary of the studied synthetic procedures and resulting MNPs@NCS nanocomposites.
Type of NPsNCS *ProcedureStudied Synthetic Parameters
INVERSE SPINELSNiFe2O4GOSolvothermal
Type and concentration of metal precursor.
Type, concentration and molecular weight of capping agent.
Reaction temperature.
Reaction time.
Reducing agent.
Fe3O4GO
NiGNPs
ox-MWCNTs
MWCNTs
METALSCoGO
MWCNTs
Fe(ZVI)GO
rGO
GNPs
ox-MWCNTs
MWCNTs
Solution (S)
Oven (O)
Sol-gel (SG)
S
Solvent.
Reaction temperature.
Influence of capping agent.
O
Reaction time.
Reaction temperature.
ALLOYSFeCo
FeNi
CoNi
FeCoNi
GOSol-gel (SG)SG
Reaction temperature.
Composition of reaction atmosphere.
Proportions of the sol-gel reactants.
* GO: graphene oxide, rGO: reduced graphene oxide. GNPs: graphene nanoplatelets. MWCNTs: multiwalled carbon nanotubes. ox-MWCNTS: oxidized multiwalled carbon nanotubes. ZVI: zero valence iron.
Table 3. Dependence of FMR on Ms for various alloys. Ms values were determined by SQUID measurements.
AlloyFe3O4FeNiFeCoNiFeCo
Natural FMR (GHz)2.13.96.38.6
Ms (emu/g)61124187205
Table 4. EM (electromagnetic) properties of the constituent layers for 6-layer absorber.
Layer6-Layer Configuration from Air interfaceThickness
d (mm)
εσ
1.GNPs (1 wt%)0.83.970.0677
2.MWCNTs (0.5wt%) + GNPs (1wt%)0.46.9492.068
3.MWCNTs (1wt%) + GNPs (1wt%)0.410.013.134
4.MWCNTs (1wt%) + GNPs (2.5wt%)0.814.156.59
5.MWCNTs (1wt%) + GNPs (5wt%)0.820.5210.25
6.MWCNTs (1wt%) + GNPs (10wt%)0.840.8213.83

