Development of a New KPI for the Economic Quantification of Six Big Losses and Its Implementation in a Cyber Physical System


Abstract
:
1. Introduction
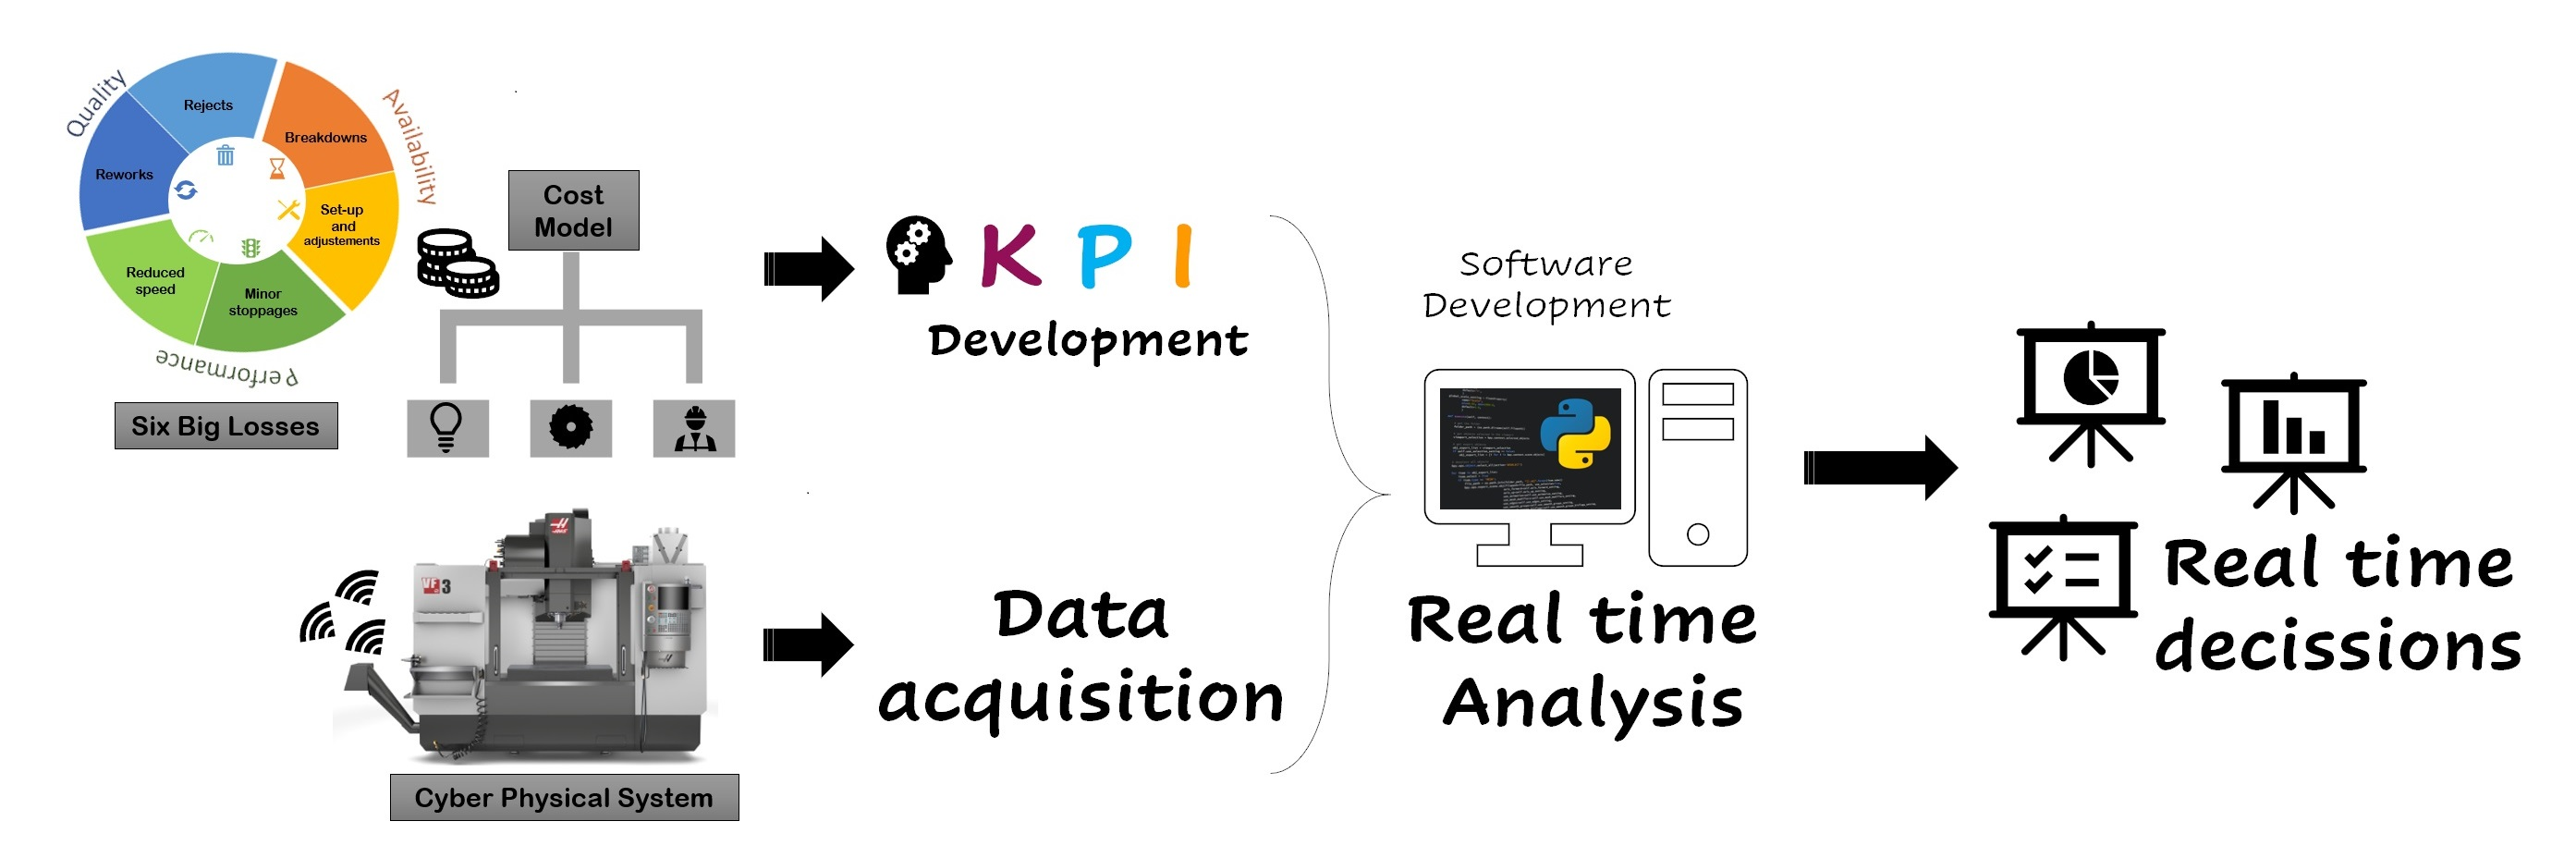
- Breakdowns or equipment failures: time losses.
- Set-up and adjustments.
- Minor stoppages during production.
- Reduced speed.
- Reworks: products with minor defects that can be reworked.
- Rejects: defective products that cannot be reworked.
2. Materials and Methods
2.1. Modelling Cost
- Raw Material: the sum of the cost of acquisition, supply, transport, storage, inspection and internal transport of raw material.
- Process of manufacturing operational: divided in previous and operational phases.
- Previous phases:
- Part design: labor cost and equipment cost involved in this process.
- Machine programming: labor cost and equipment cost involved in this process.
- Worksheet preparation: labor cost and equipment cost involved in this process.
- Operational phases:
- Direct labor: labor costs involved in operational processing.
- Machine:
- Transformed resource: it could be owned or rented.
- Consumables: the sum of cost of tools, tooling, energy and fluids.
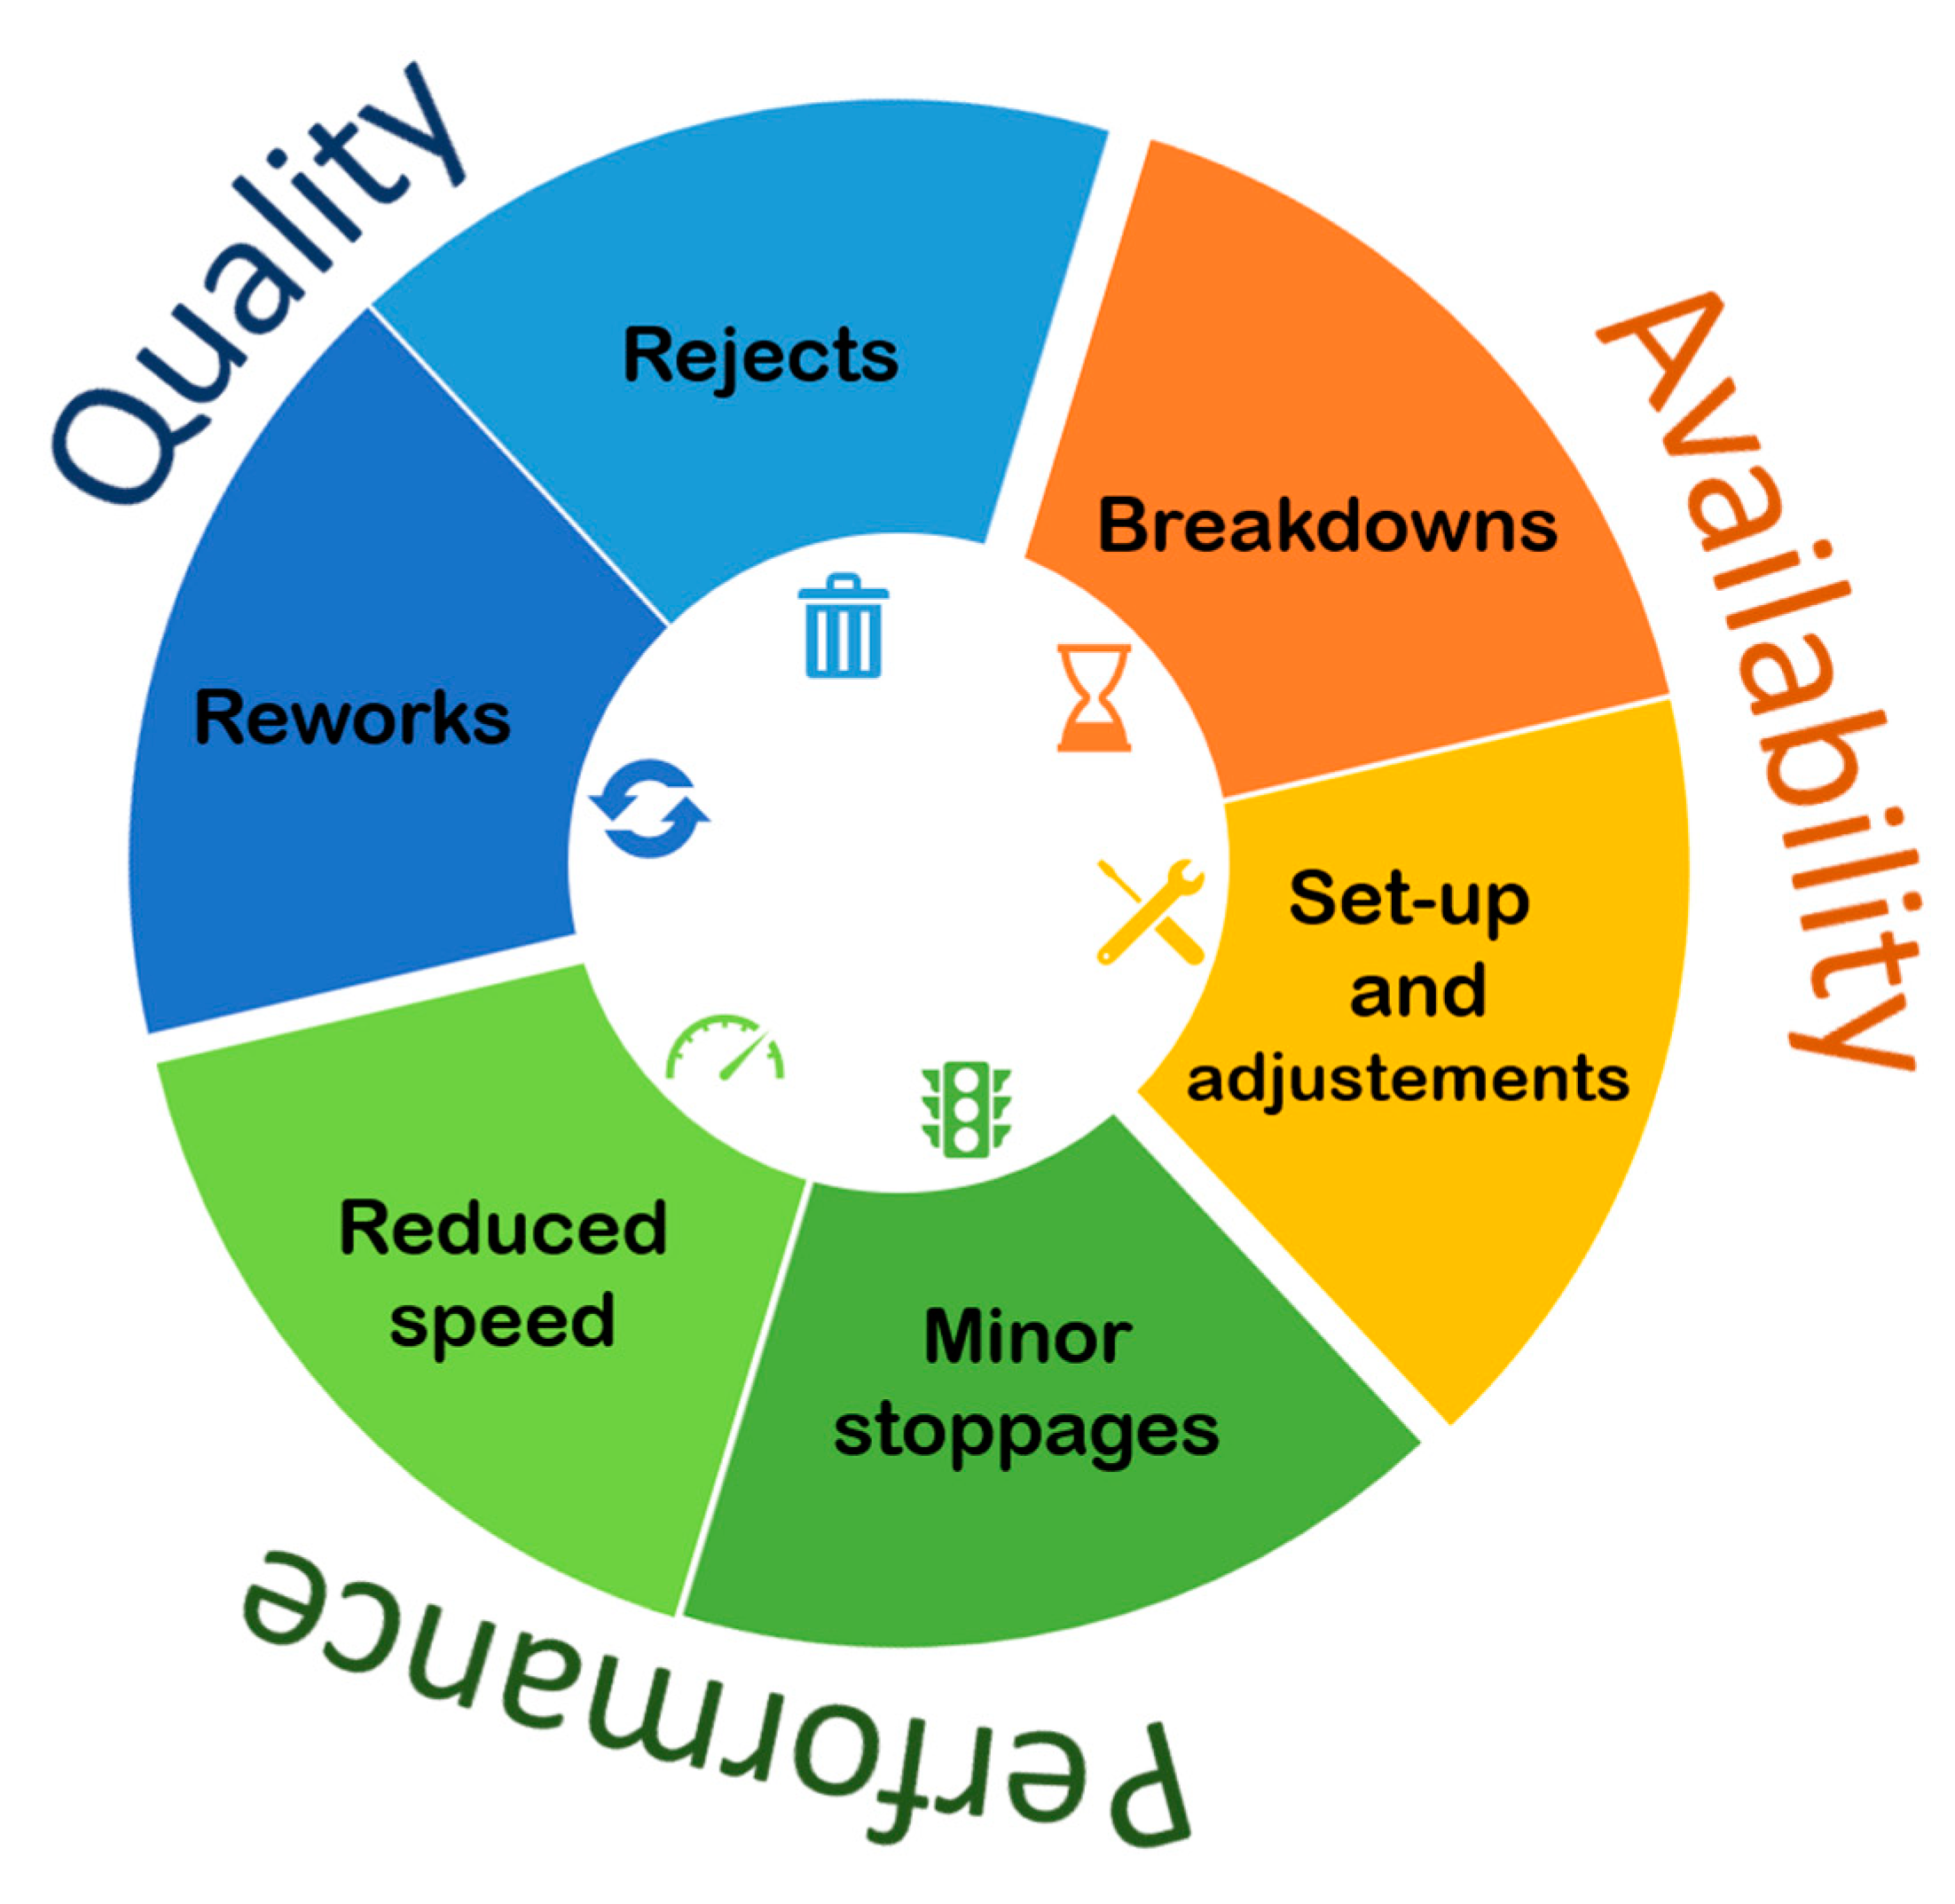
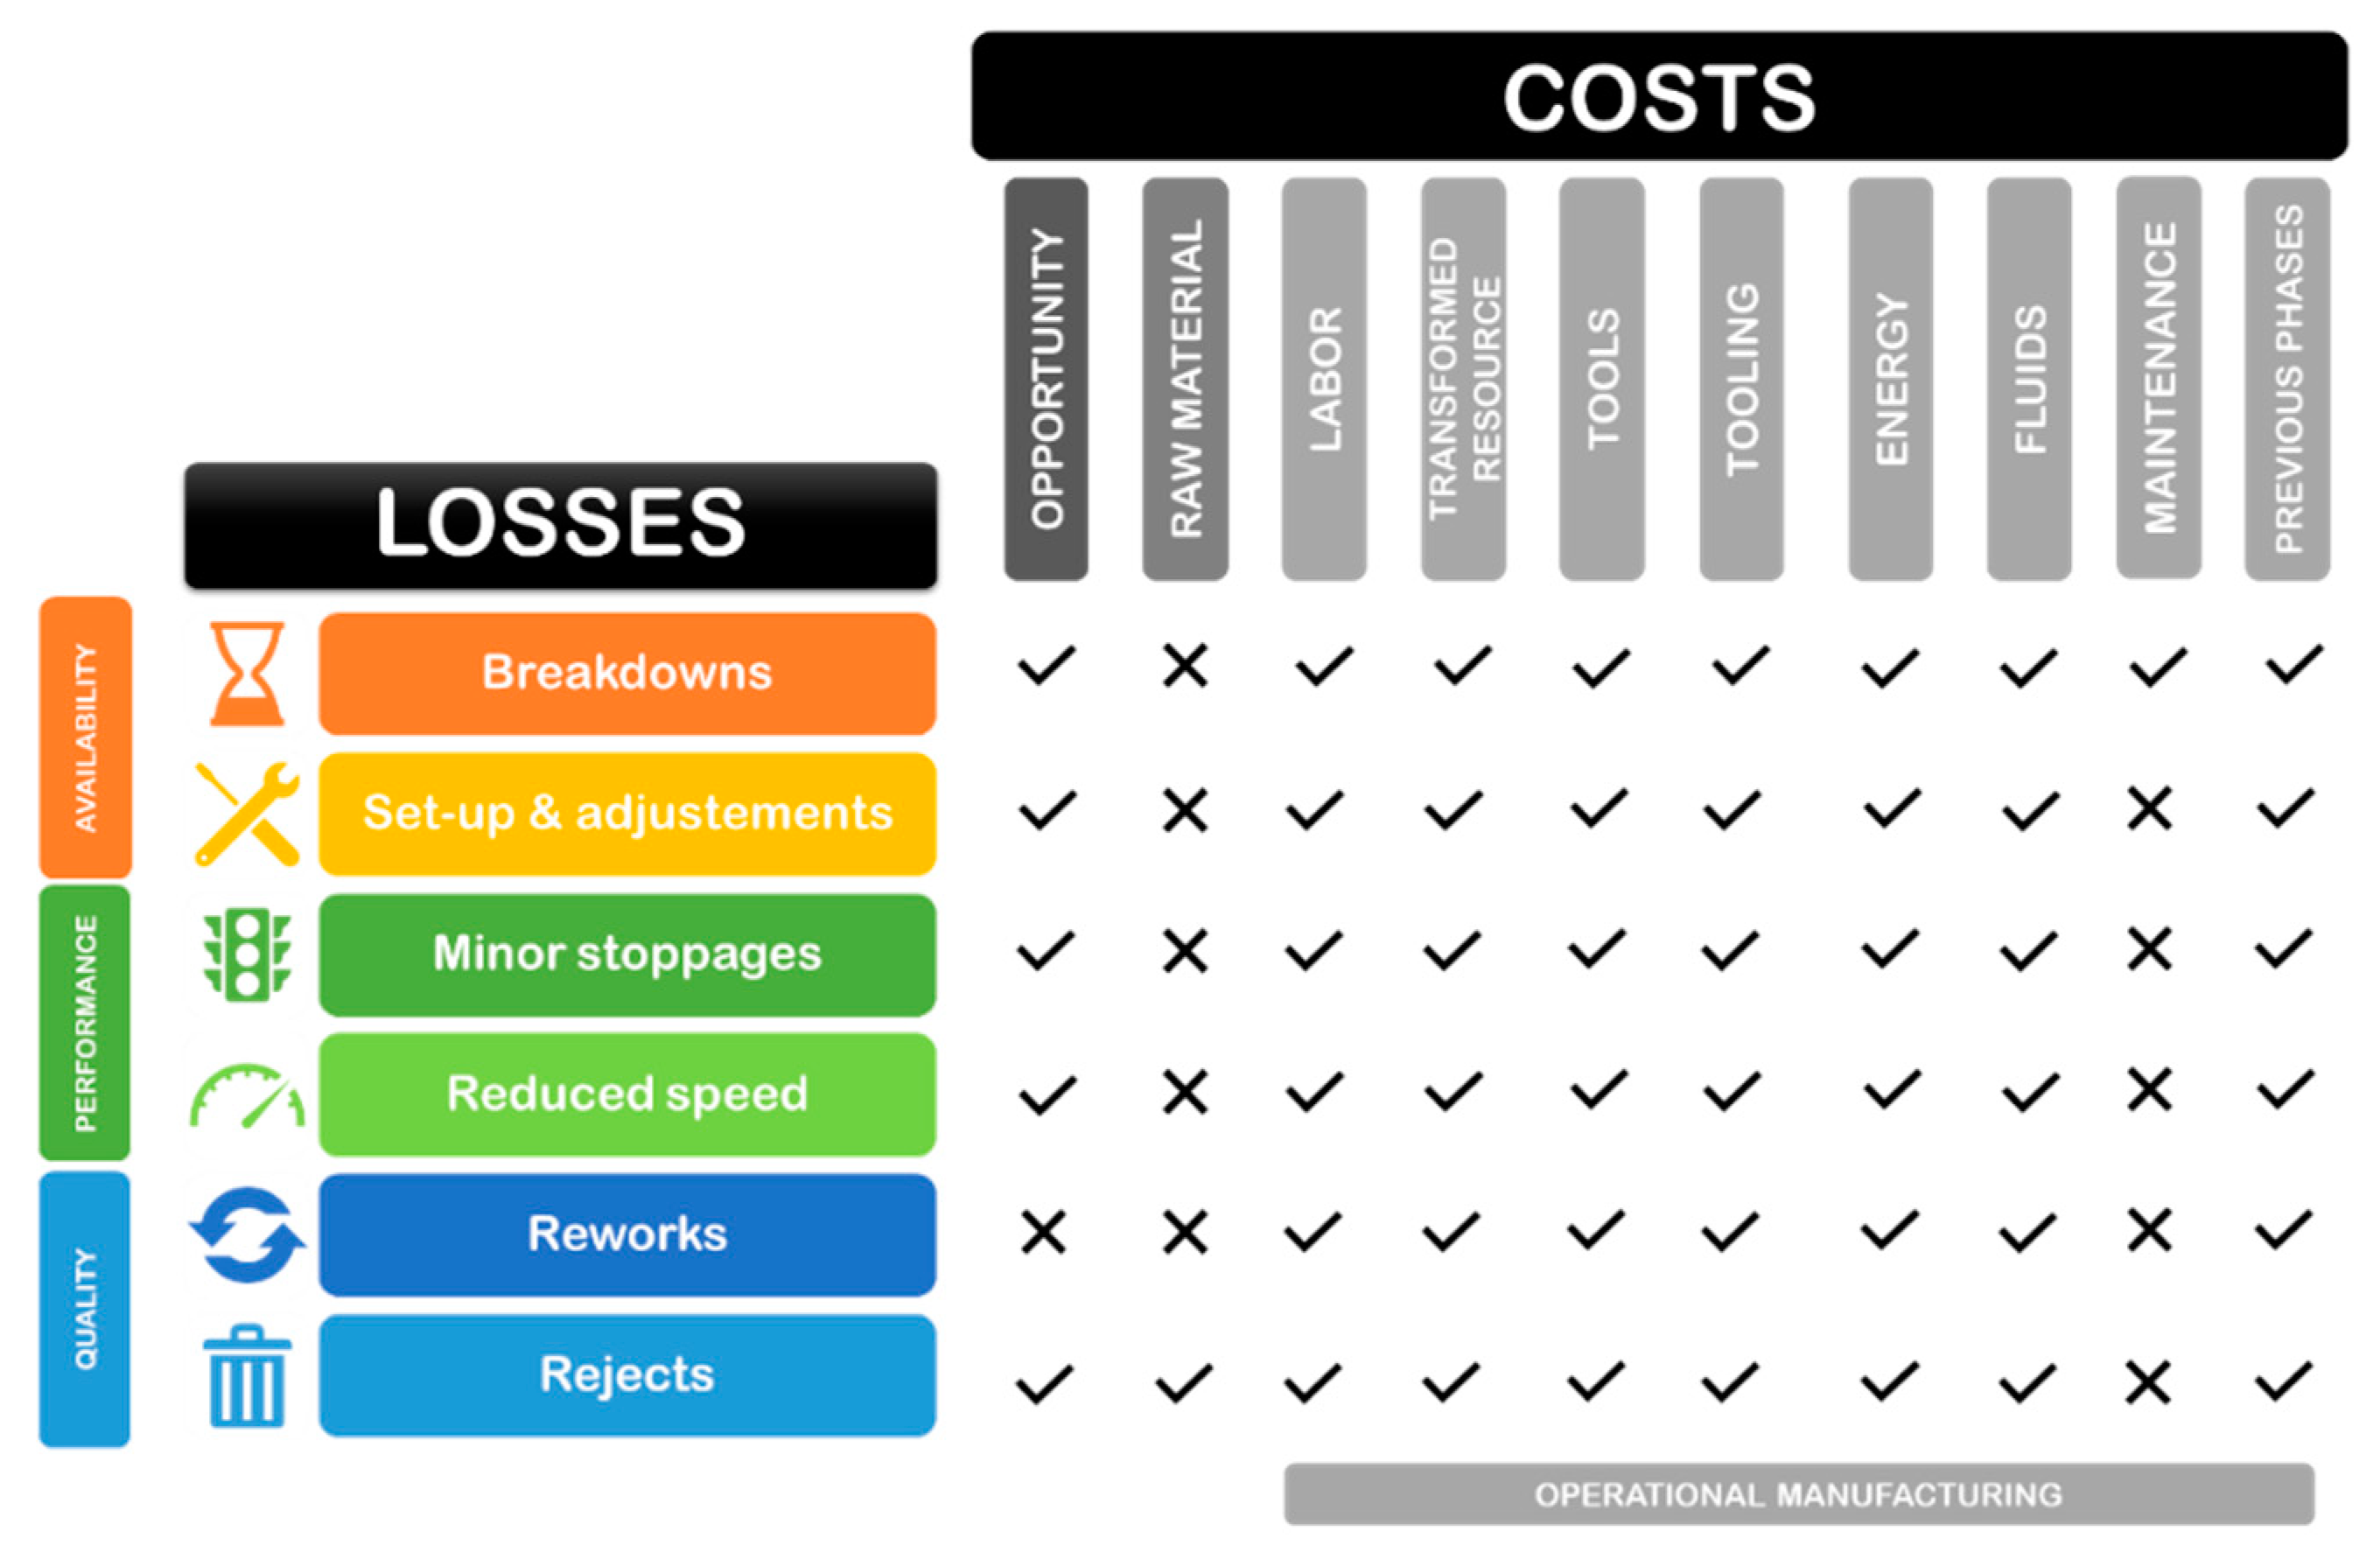
2.2. Application of the Six Big Losses to Cost
- The six big losses, traditionally referred to time losses, have been adapted to cost as follows: Breakdown and adjustment losses: all costs associated with maintenance and adjustment actions, the opportunity cost loosed and labor and machine costs involved in this process.
- Waiting time losses: opportunity cost loosed, and labor and machine costs associated with set-up and adjustments, e.g., time during tool or reference changes.
- Reduced speed losses: opportunity cost loosed, and costs associated with the difference of time between the machine possible working speed and its real one.
- Minor stoppage losses: short interruptions by process jams, incorrect feed, flow obstruction, checks, or stops leading to additional flow time. In this case, the opportunity cost loosed, and stops of maximum five minutes, although this maximum must be established for each company.
- Rework losses: costs of rework activity when the product has minor defects.
- Reject losses: opportunity cost loosed, and labor and machine costs generated by rejecting products.
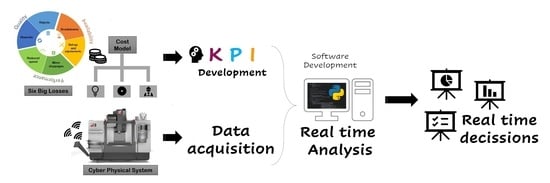
2.3. Cost KPI Definition: Cost Loss Indicator (CLI)
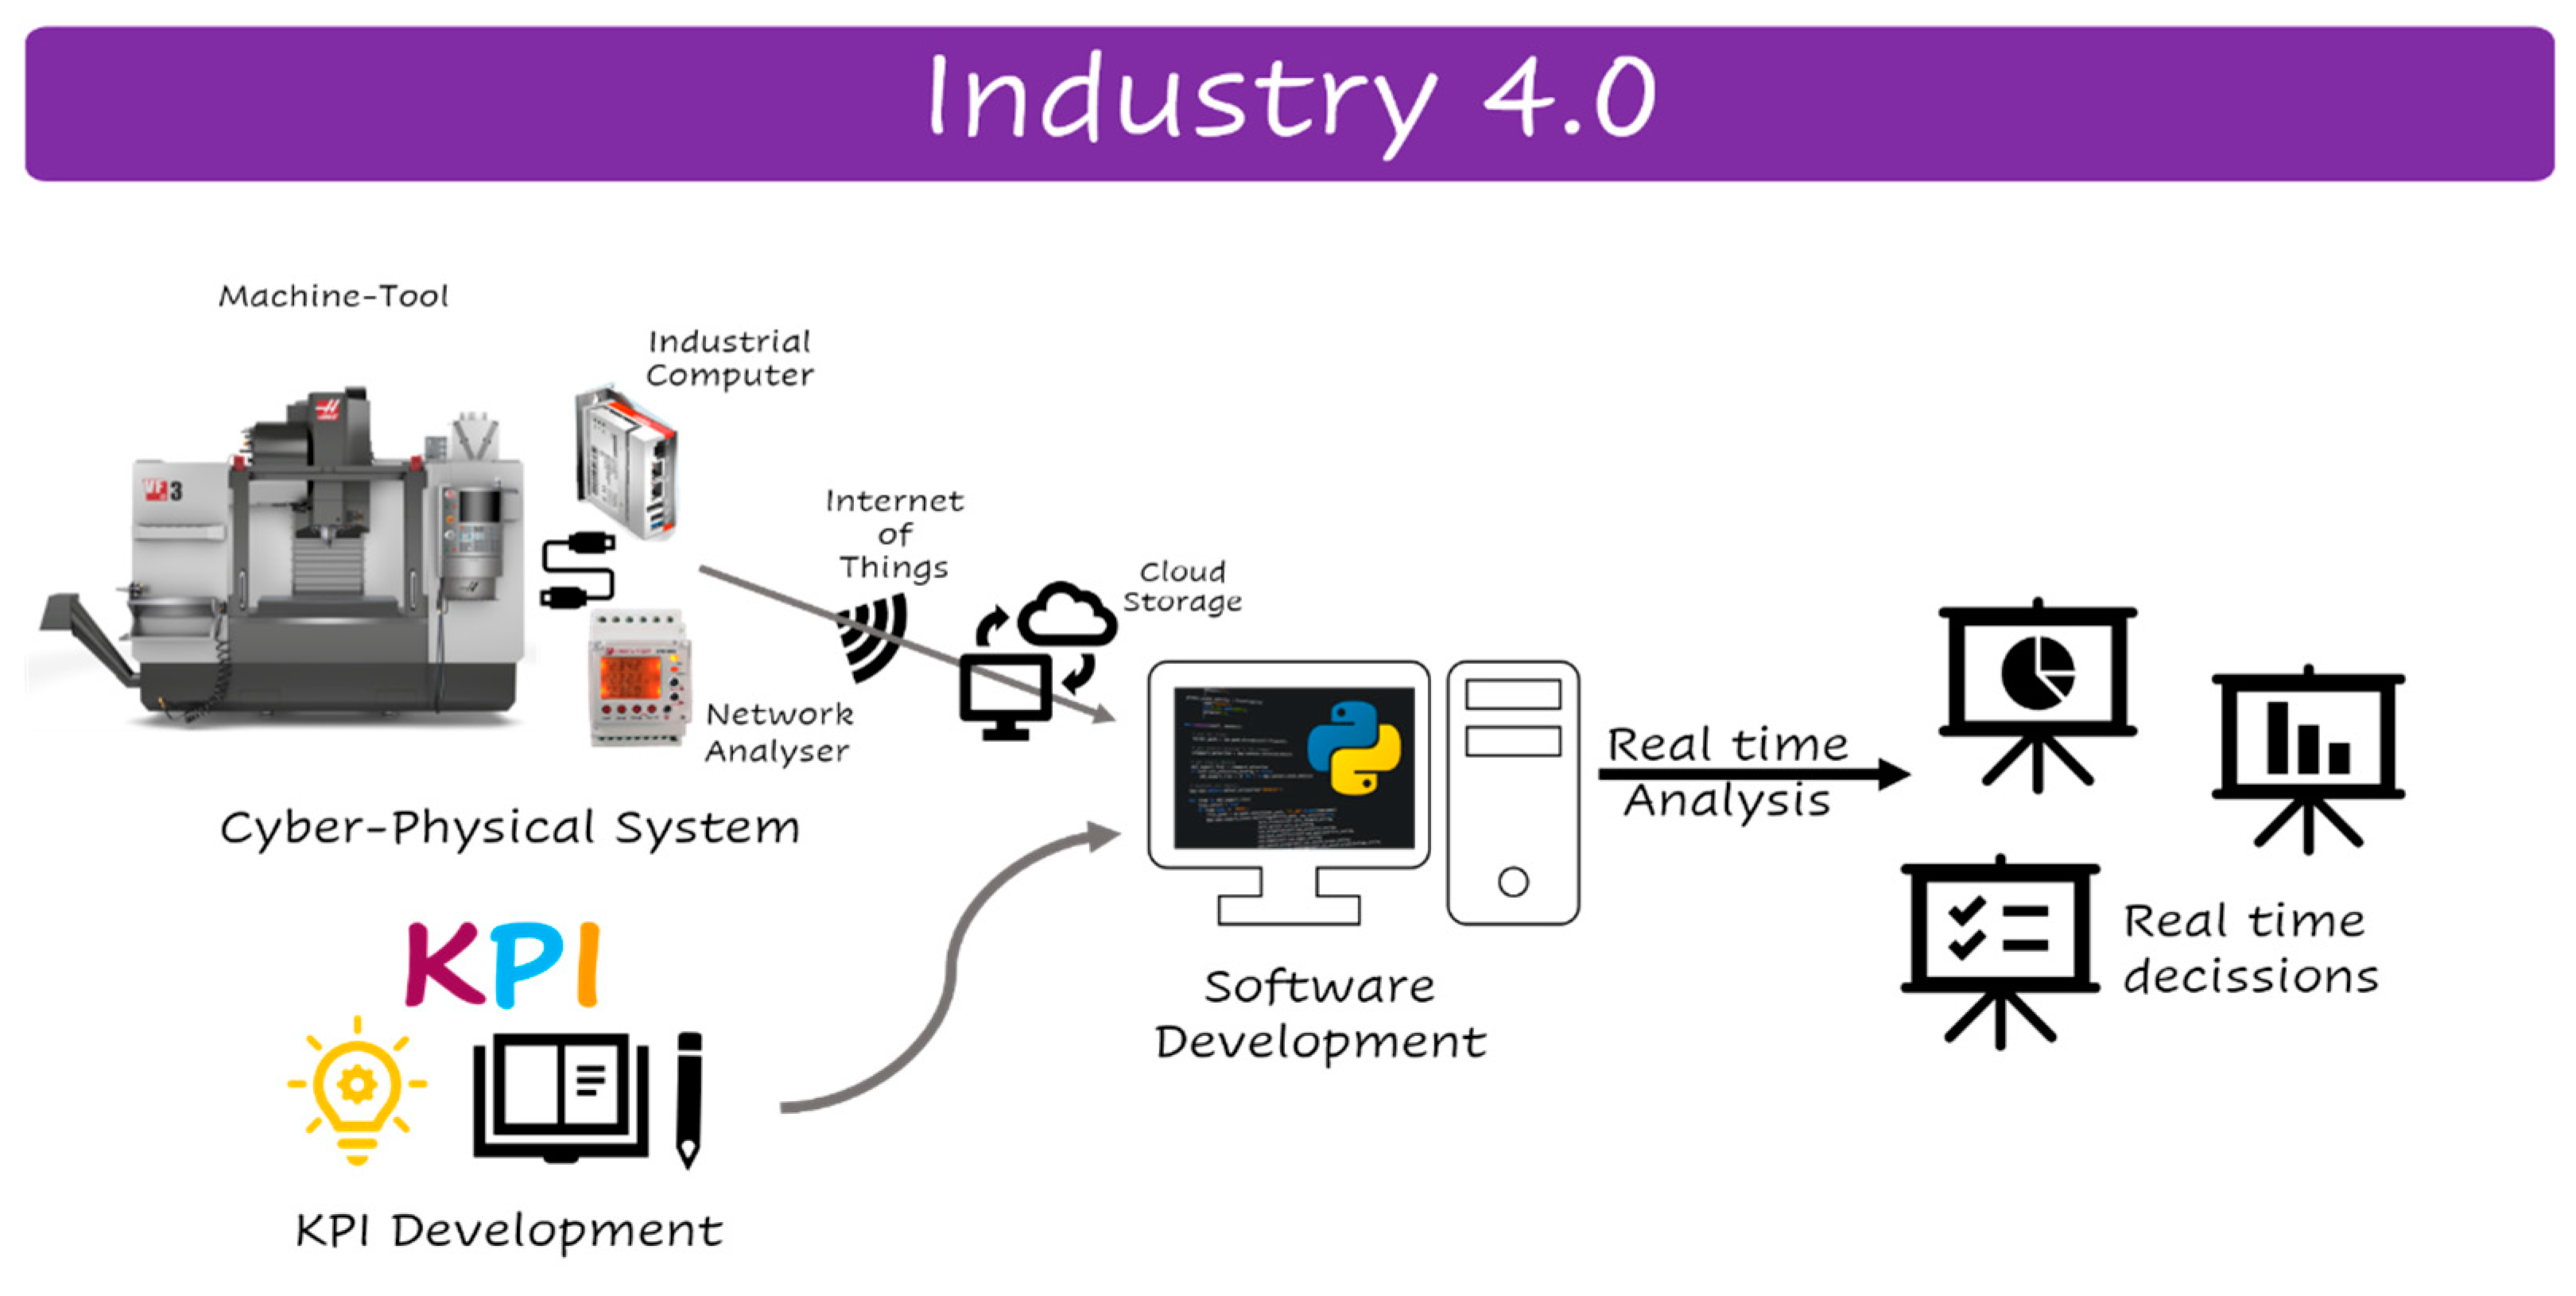
2.4. CPS Implementation
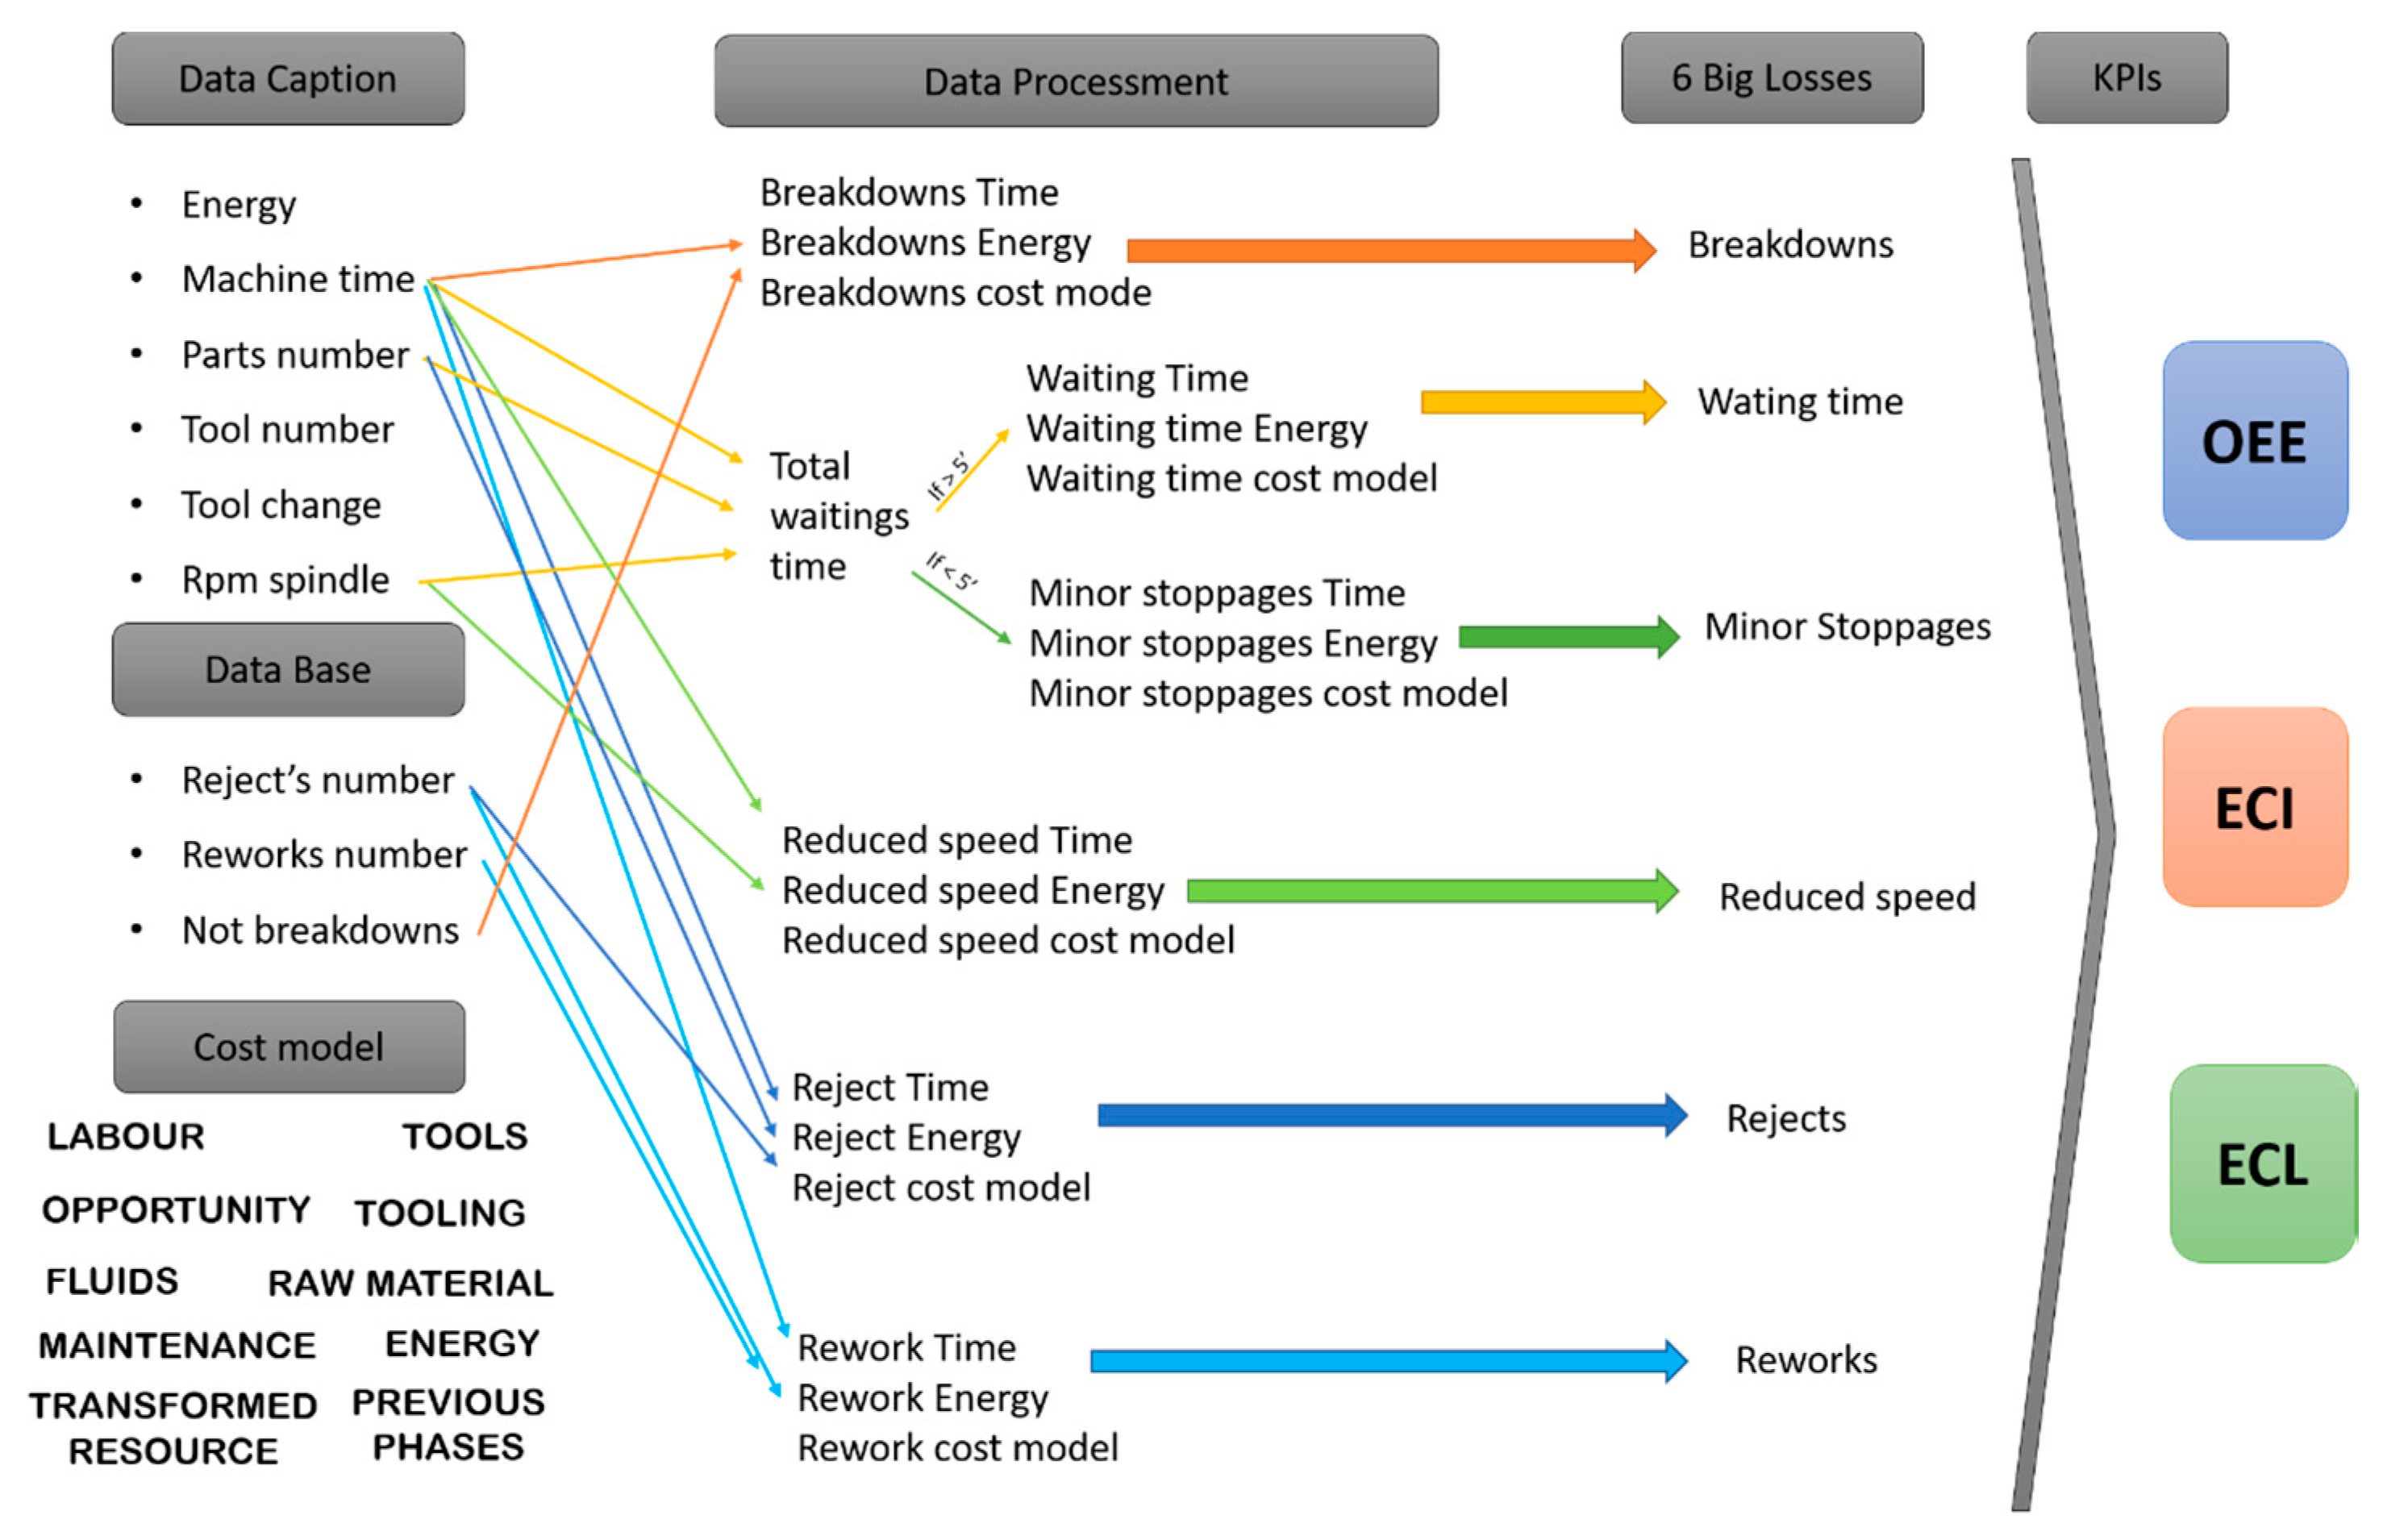
2.5. Calculating Cost KPI in a CPS
3. Results and Discussion
3.1. Test Description
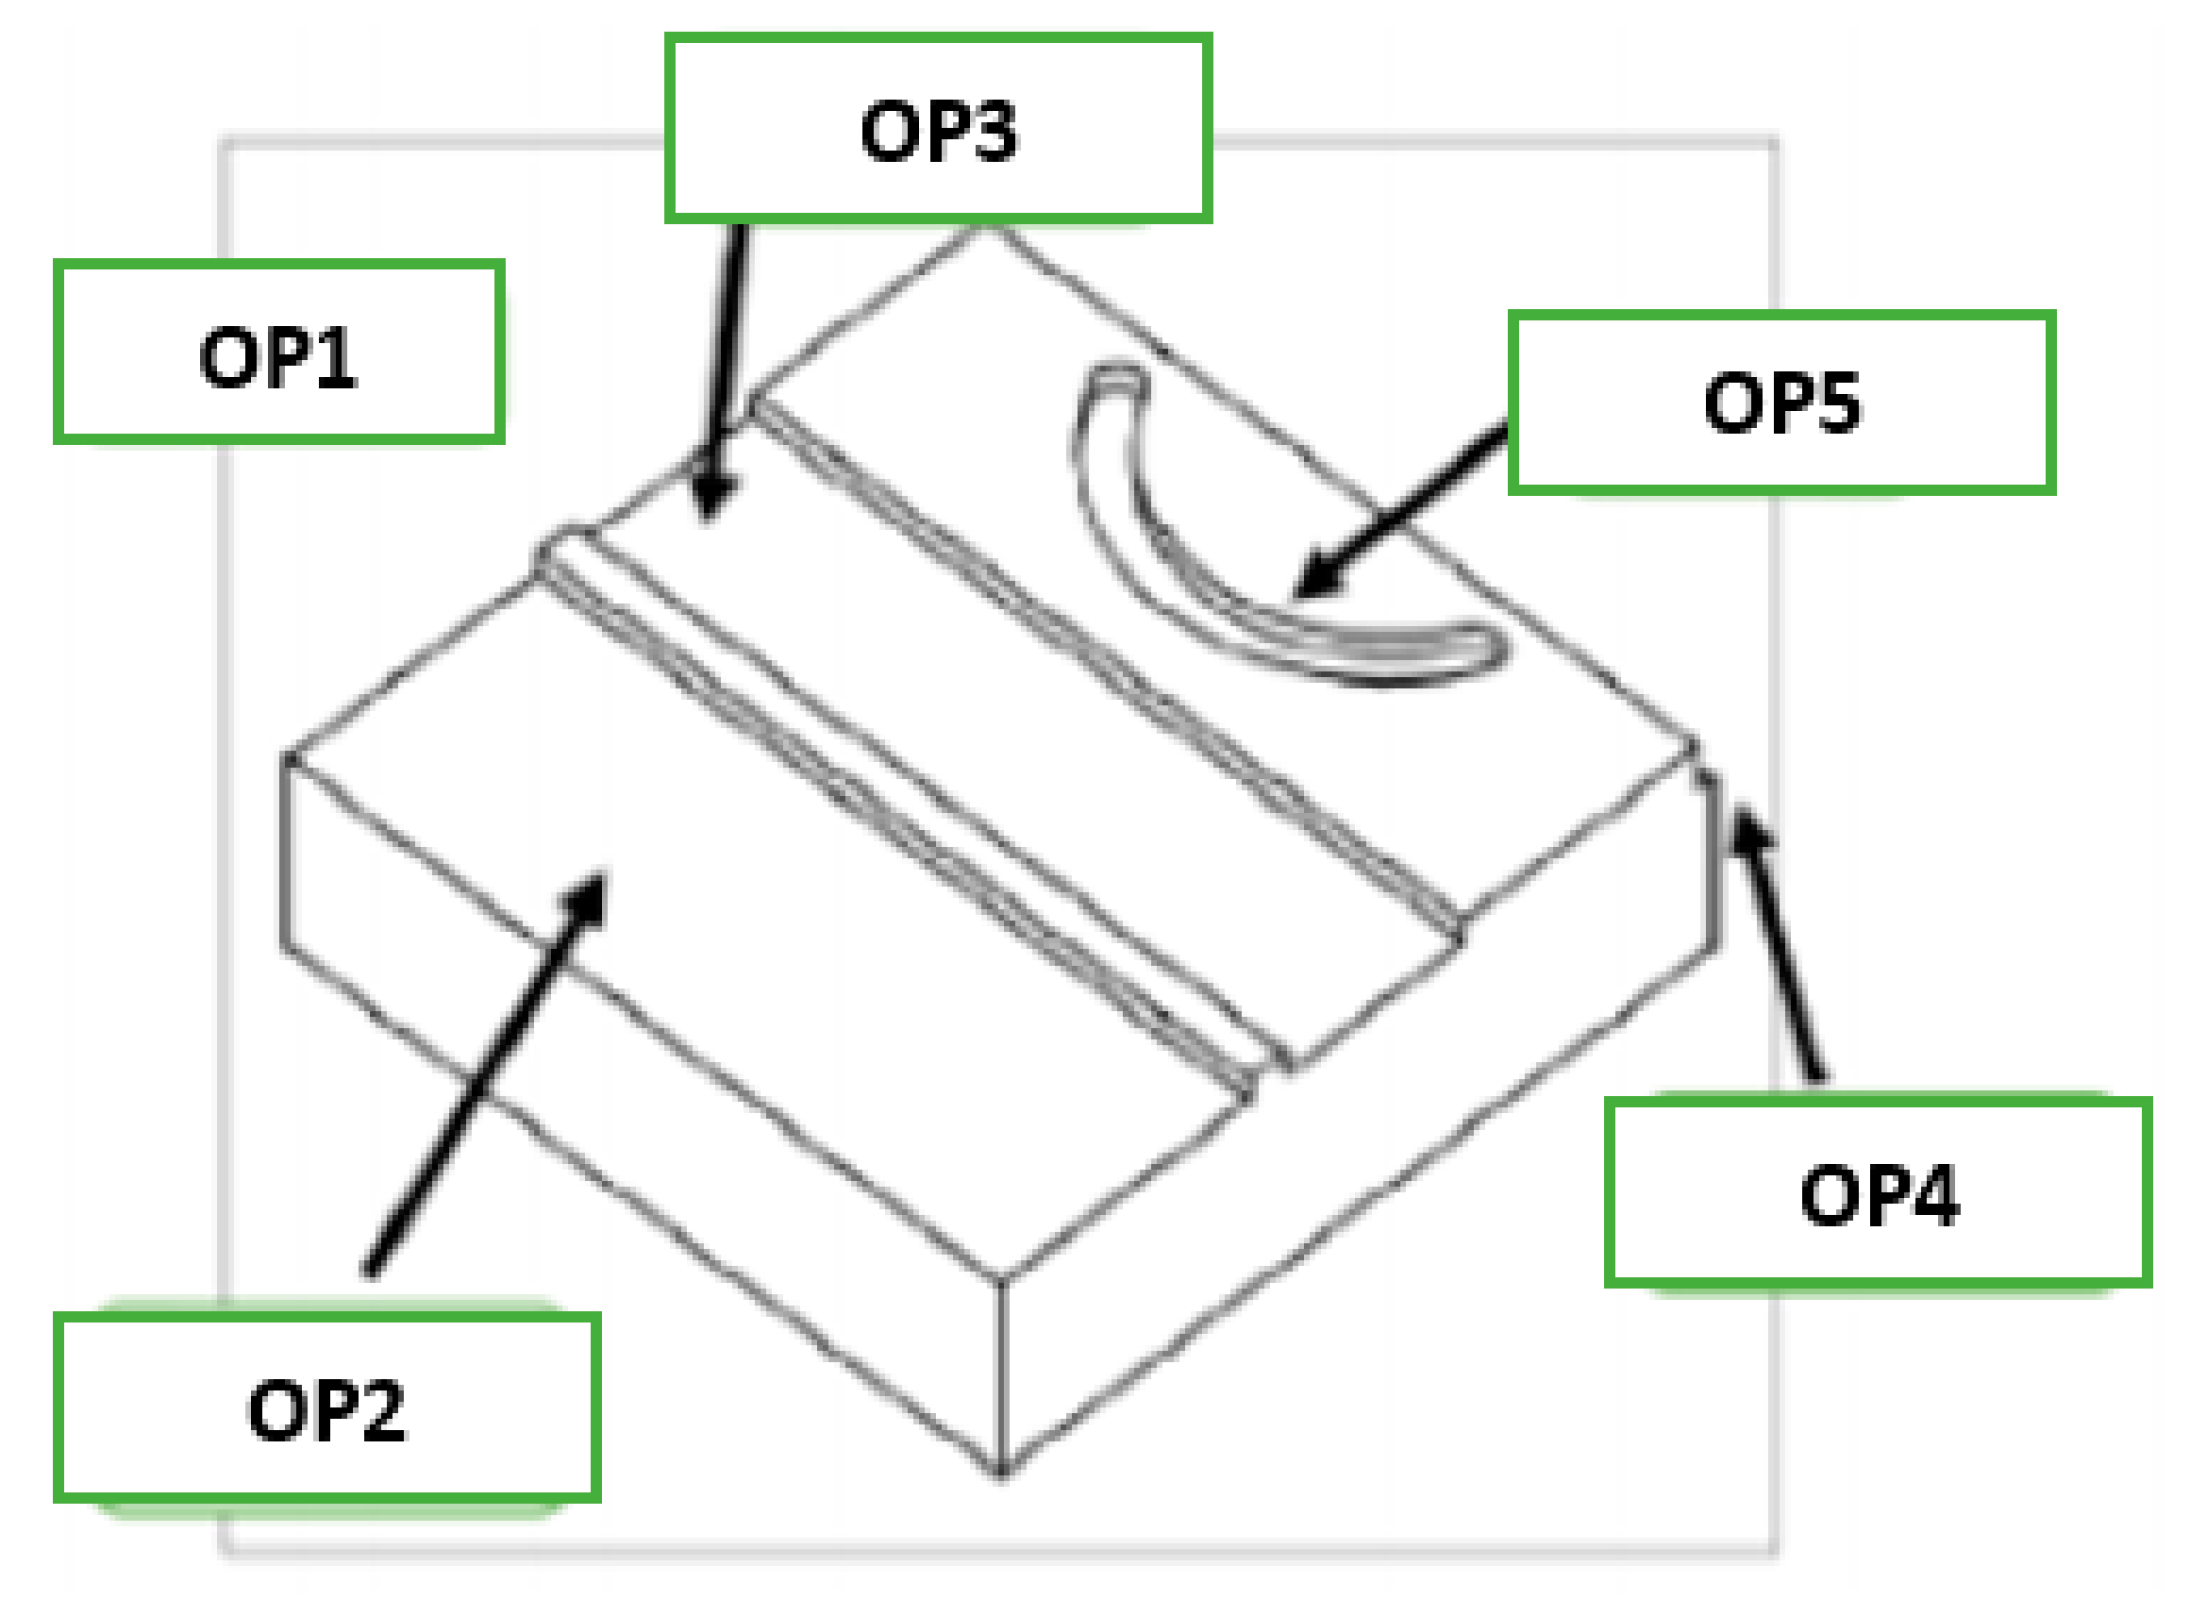
- OP1: face milling on the top side with an octagonal plate of Ø80 of five plates.
- OP2: face milling at 90 degrees with a plate of Ø63 with five plates.
- OP3: slot milling with two plates with a cutter of Ø25.
- OP4: shoulder milling with cutter of Ø14 of three cuts and a cut to the center; in other words, the tool has an edge toward the center and low cutting.
- OP5: circular slot milling with a fast steel cutter of Ø10 HSS (High Speed Steel) with three cuts and a center cut.
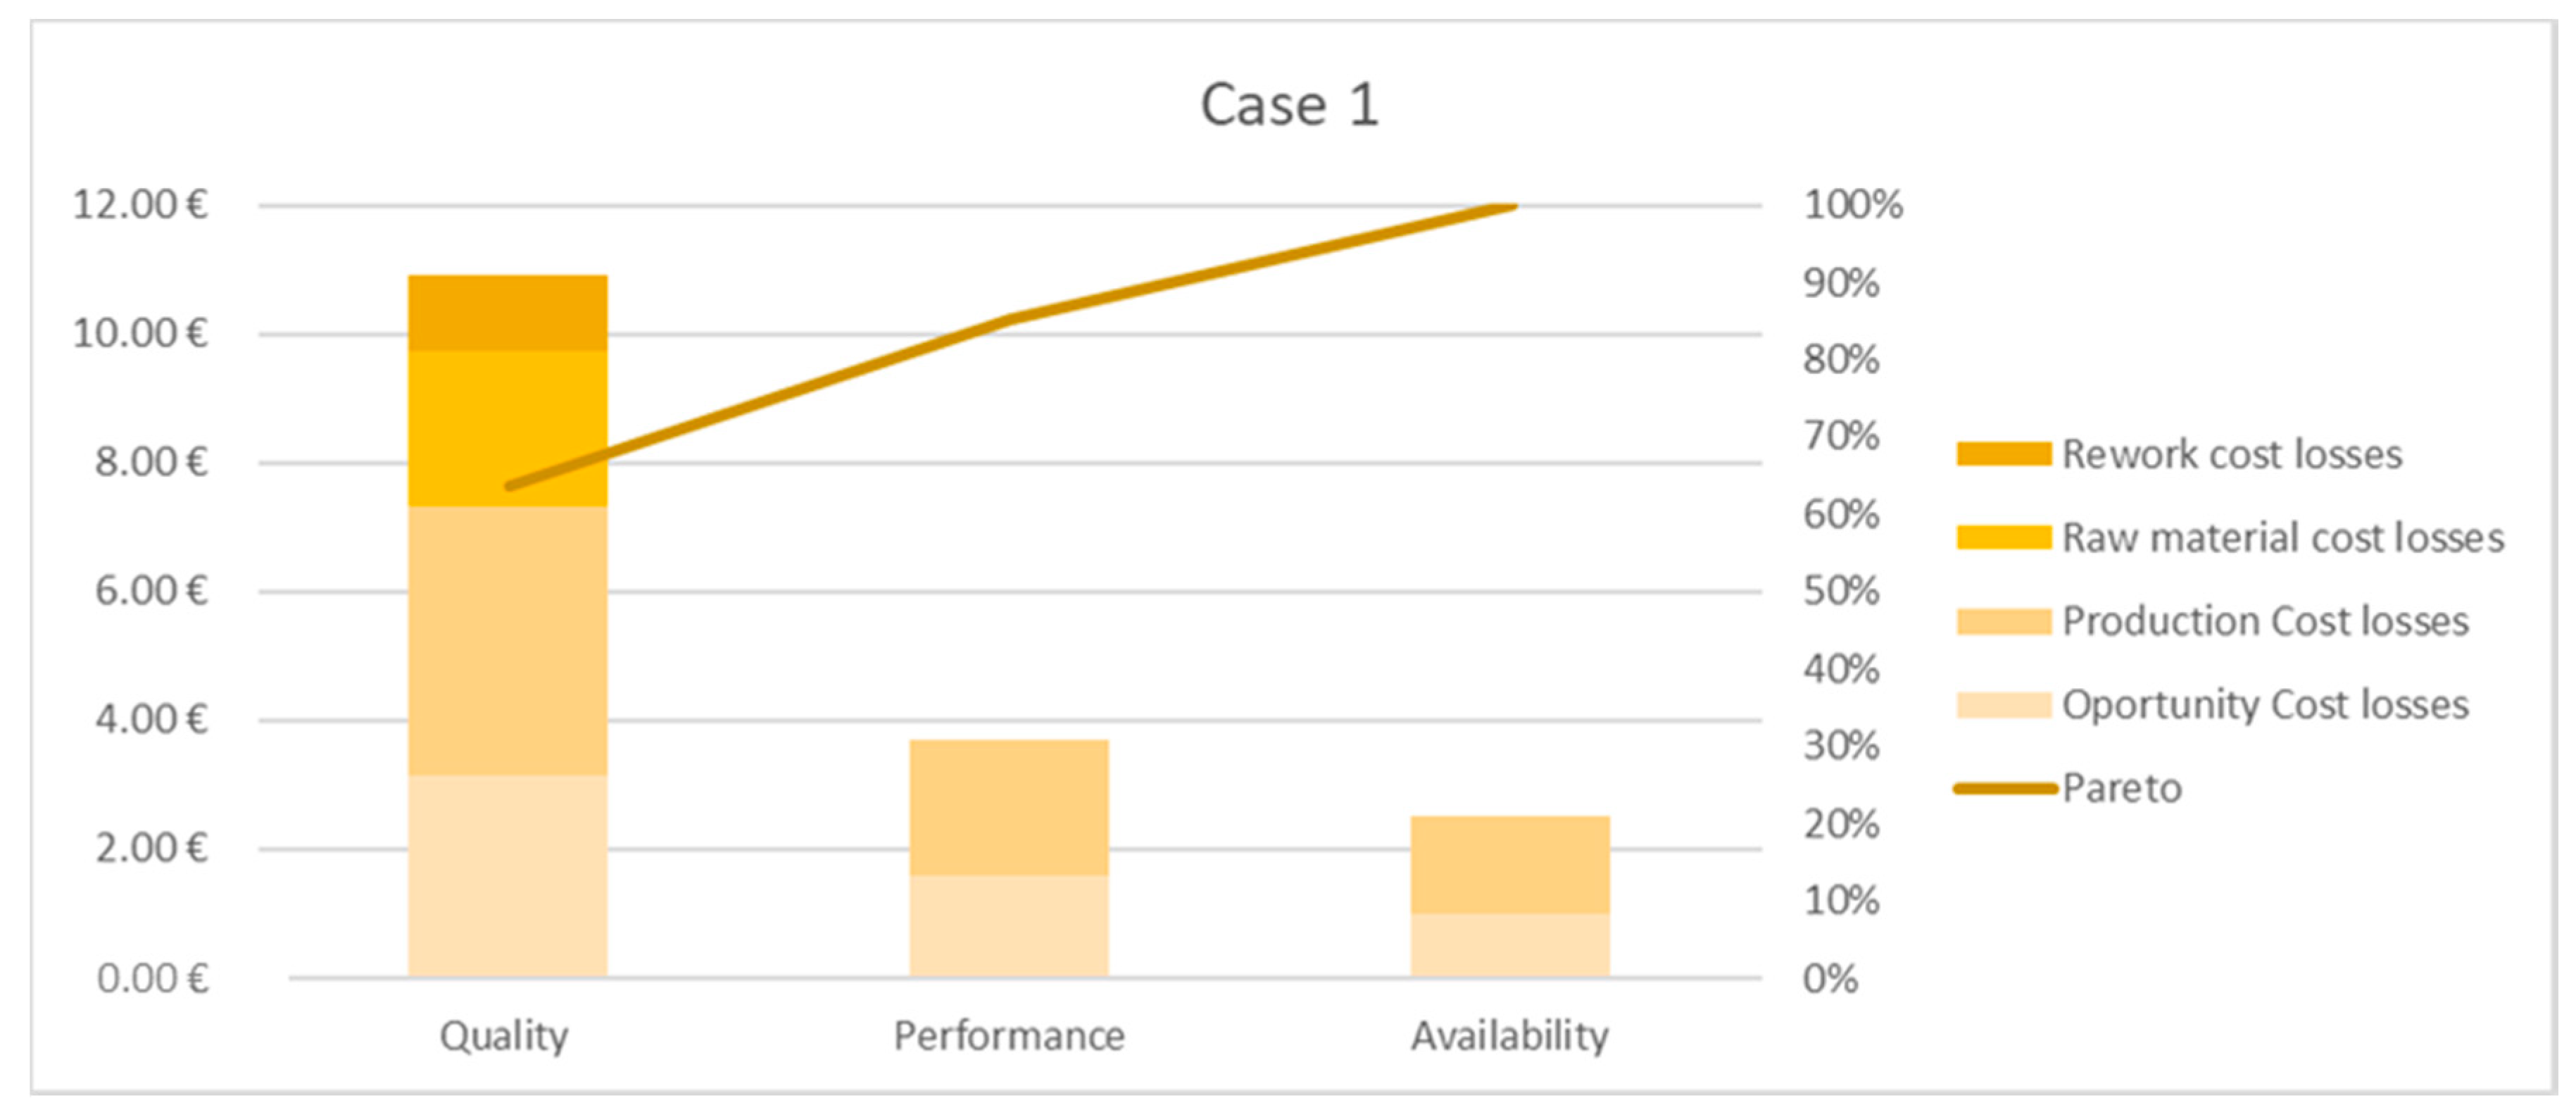
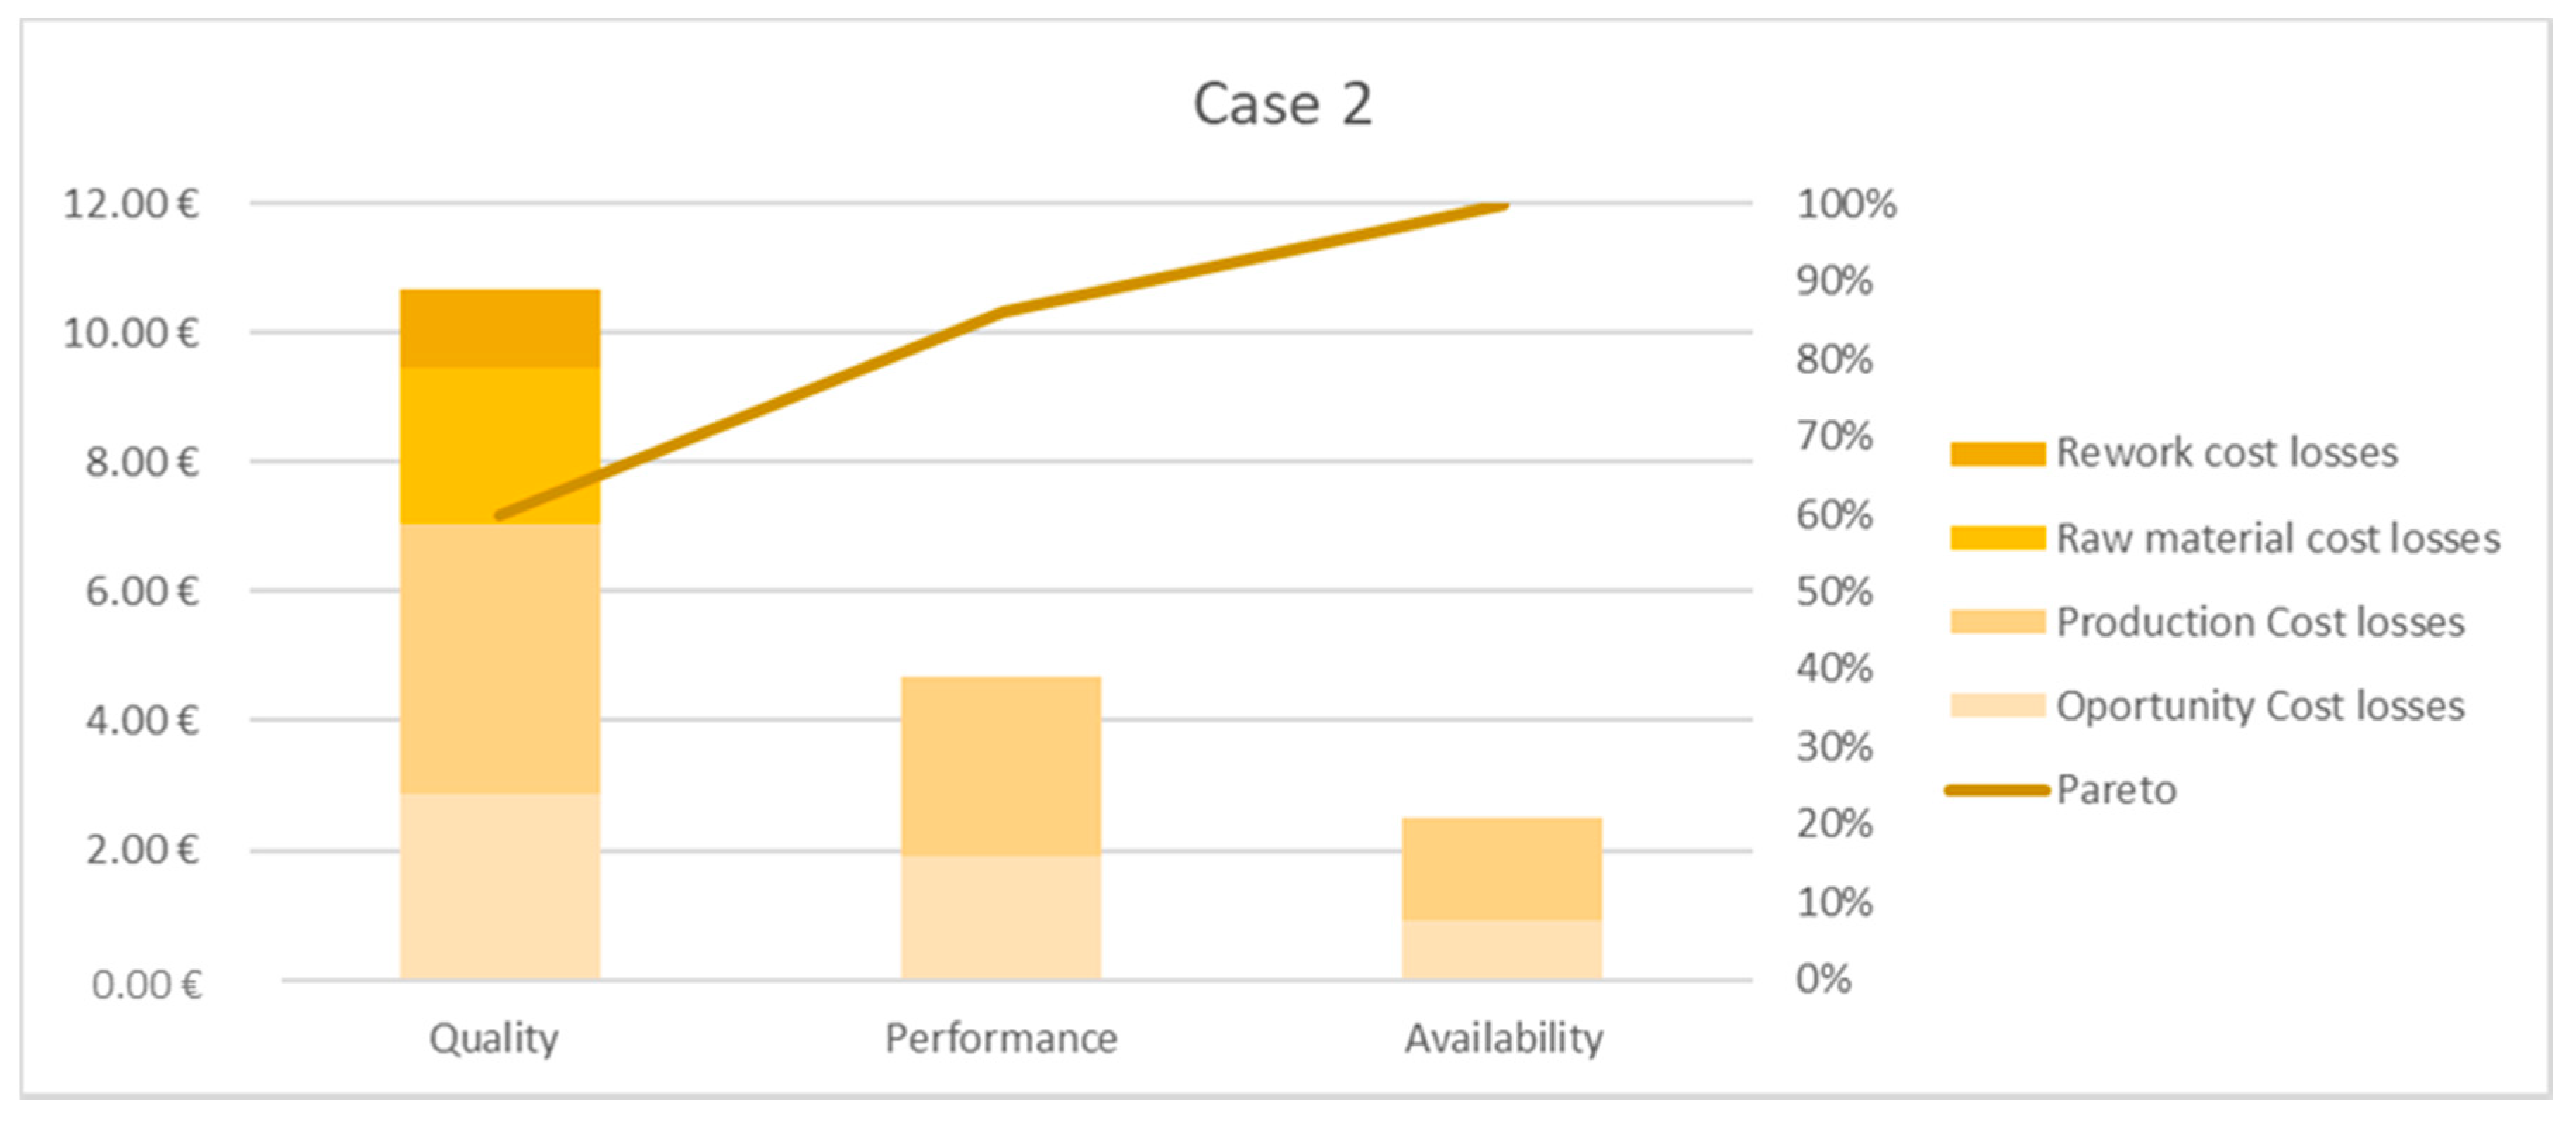
3.2. CLI Results
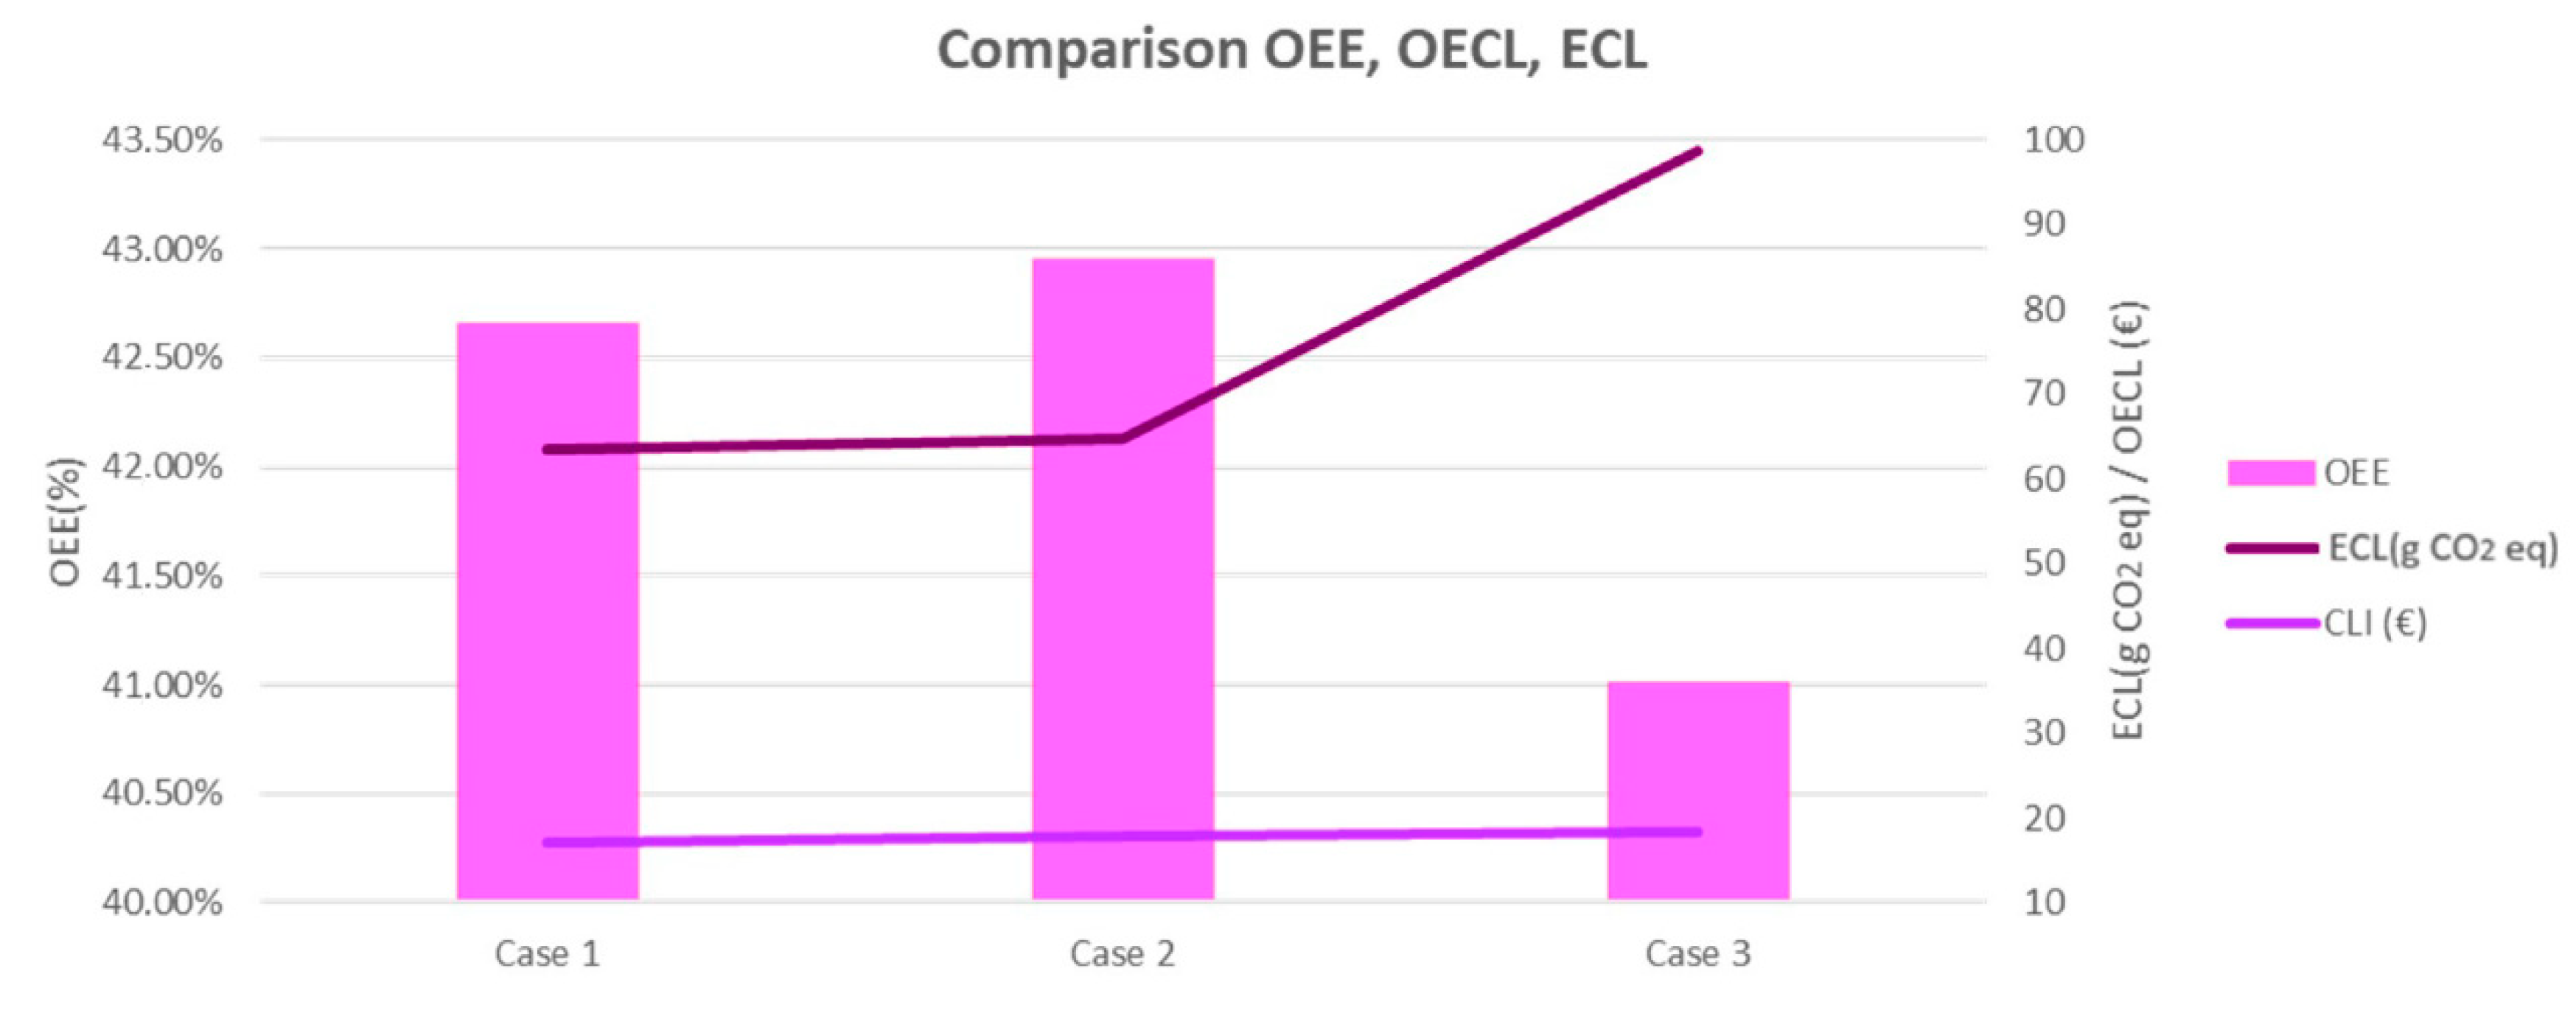
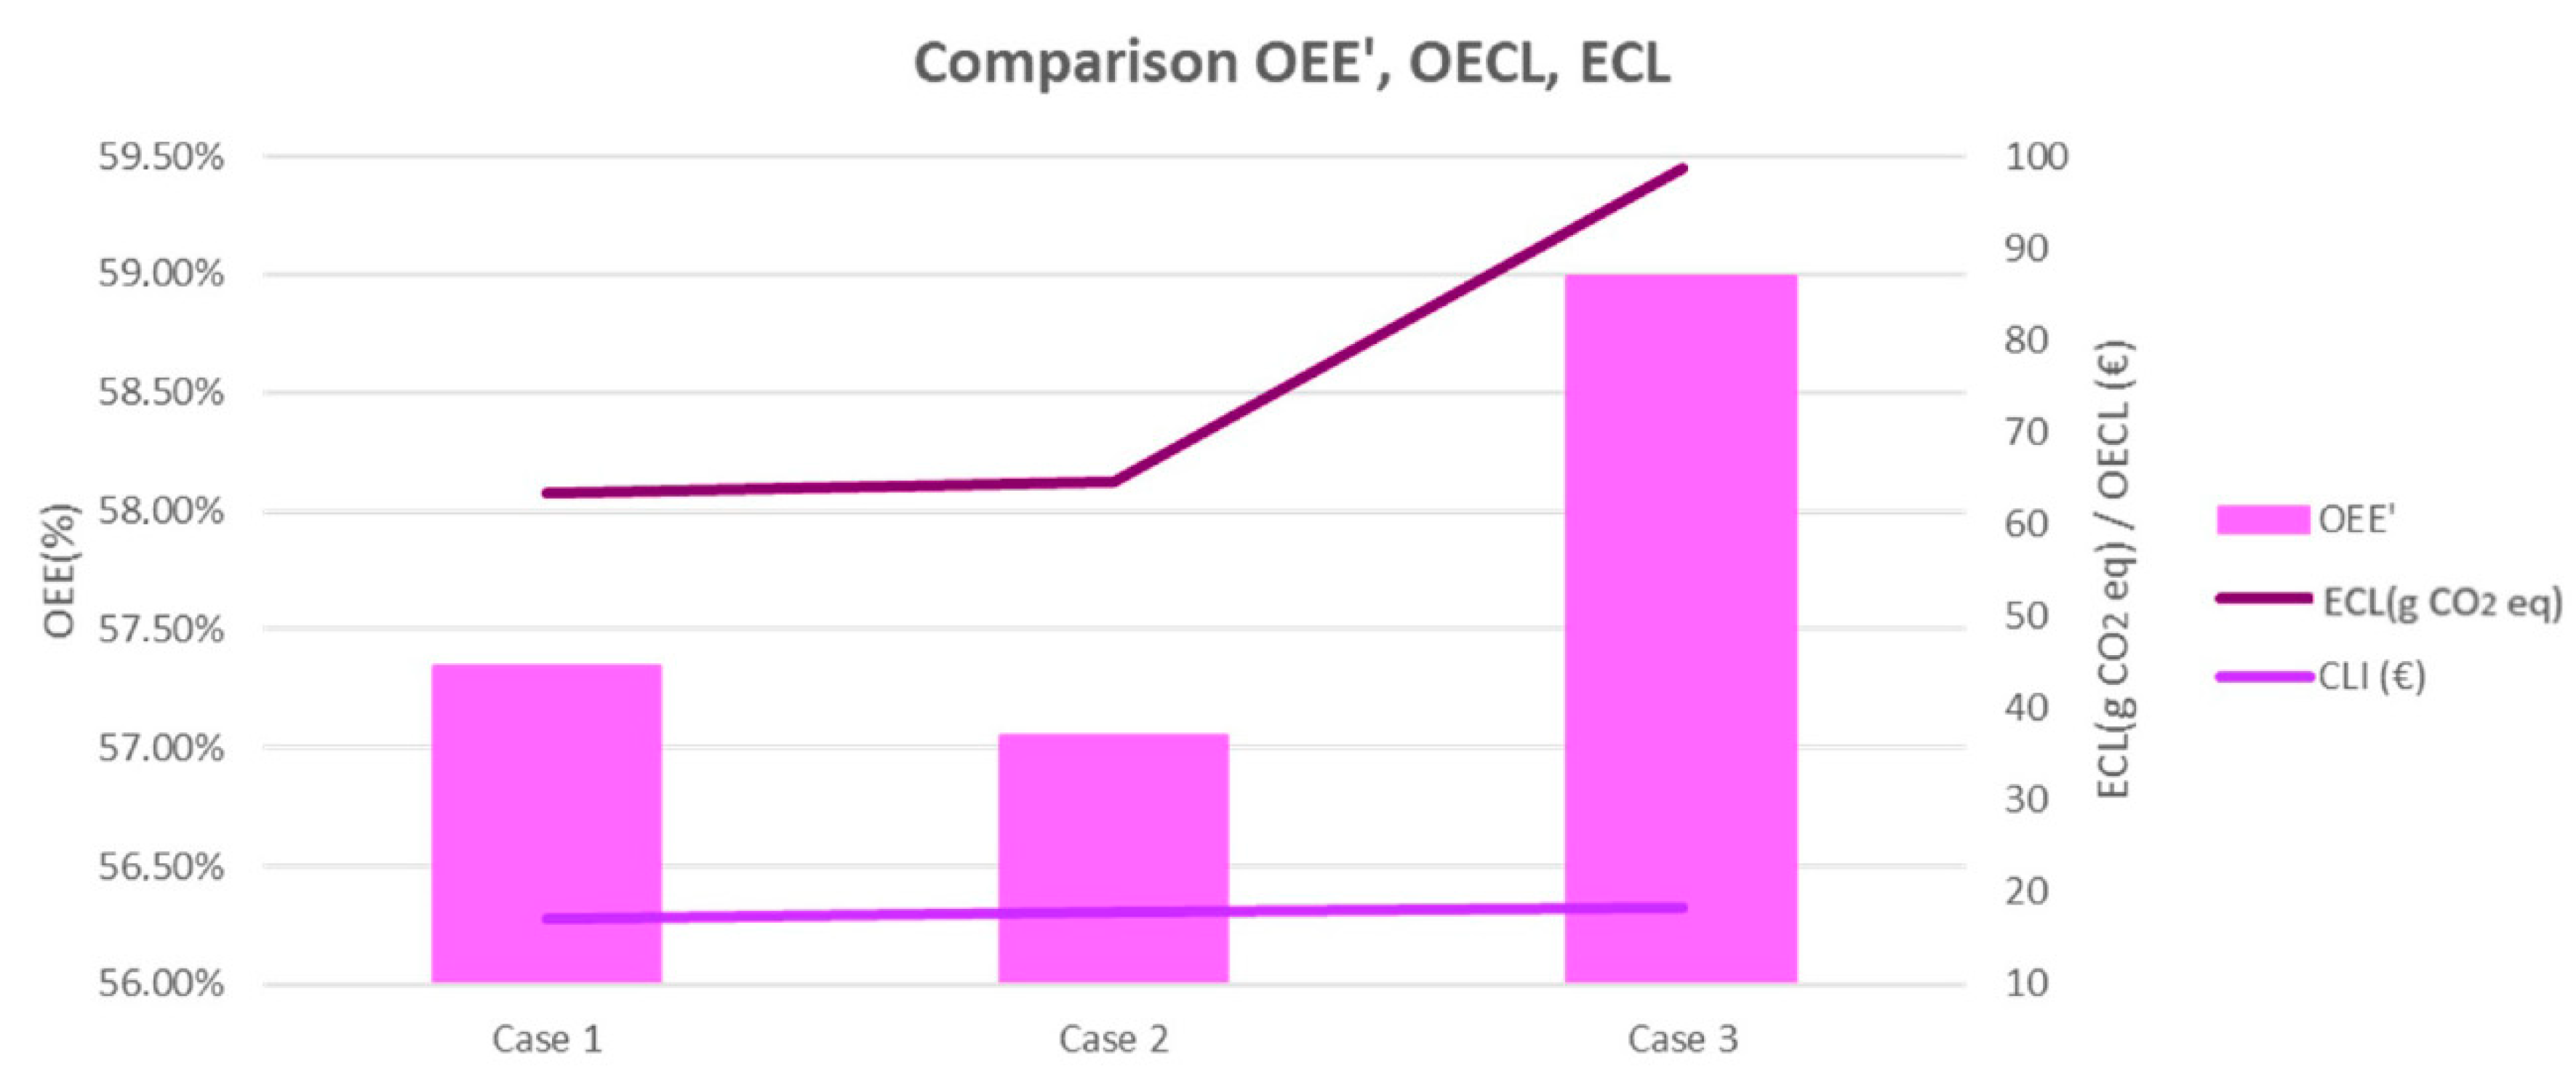
3.3. Comparison between New KPI, OEE, and OECL
4. Conclusions
Author Contributions
Funding
Acknowledgments
Conflicts of Interest
Glossary
| CAL | Cost of availability losses |
| CLI | Cost Loss Indicator |
| CPL | Cost of performance losses |
| CQL | Cost of quality losses |
| CQLrej | Cost of quality losses due to rejects |
| CQLrew | Cost of quality losses due to reworks |
| MCrej | Material cost due to rejects |
| OCA | Opportunity cost of availability |
| OCP | Opportunity cost of performance |
| OCQrej | Opportunity cost of quality due to rejects |
| PCA | Production cost of availability |
| PCP | Production cost of performance |
| PCQrej | Production cost of quality due to rejects |
| RC | Rework Cost |
References
- Davies, R. Industry 4.0 Digitalisation for Productivity and Growth. European Parliament. 2015. Available online: https://www.europarl.europa.eu/RegData/etudes/BRIE/2015/568337/EPRS_BRI(2015)568337_EN.pdf (accessed on 10 November 2020).
- Ghobakhloo, M. The future of manufacturing industry: A strategic roadmap toward Industry 4.0. J. Manuf. Technol. Manag. 2018, 29, 910–936. [Google Scholar] [CrossRef] [Green Version]
- Li, Y.; Dai, J.; Cui, L. The impact of digital technologies on economic and environmental performance in the context of industry 4.0: A moderated mediation model. Int. J. Prod. Econ. 2020, 229, 107777. [Google Scholar] [CrossRef]
- Li, G.; Yang, H.; Sun, L.; Sohal, A.S. The impact of IT implementation on supply chain integration and performance. Int. J. Prod. Econ. 2009, 120, 125–138. [Google Scholar] [CrossRef]
- Bayhan, H.; Meißner, M.; Kaiser, P.; Meyer, M.; Hompel, M.T. Presentation of a novel real-time production supply concept with cyber-physical systems and efficiency validation by process status indicators. Int. J. Adv. Manuf. Technol. 2020, 108, 527–537. [Google Scholar] [CrossRef]
- Yao, X.-F.; Lin, Y. Emerging manufacturing paradigm shifts for the incoming industrial revolution. Int. J. Adv. Manuf. Technol. 2016, 85, 1665–1676. [Google Scholar] [CrossRef]
- Lee, E. Categories and subject descriptors. In Proceedings of the 47th Design Automation Conference, New York, NY, USA, 13–18 July 2010; pp. 737–742. [Google Scholar] [CrossRef]
- de Sousa Jabbour, A.B.L.; Jabbour, C.J.C.; Foropon, C.; Godinho Filho, M. When titans meet—Can industry 4.0 revolutionise the environmentally-sustainable manufacturing wave? The role of critical success factors. Technol. Forecast. Soc. Chang. 2018, 132, 18–25. [Google Scholar] [CrossRef]
- Wouters, M.; Stecher, J. Development of real-time product cost measurement: A case study in a medium-sized manufacturing company. Int. J. Prod. Econ. 2017, 183, 235–244. [Google Scholar] [CrossRef]
- Prajogo, D.I.; Olhager, J. Supply chain integration and performance: The effects of long-term relationships, information technology and sharing, and logistics integration. Int. J. Prod. Econ. 2012, 135, 514–522. [Google Scholar] [CrossRef]
- Nguyen, T.; Zhou, L.; Spiegler, V.; Ieromonachou, P.; Lin, Y. Big data analytics in supply chain management: A state-of-the-art literature review. Comput. Oper. Res. 2018, 98, 254–264. [Google Scholar] [CrossRef] [Green Version]
- Global Industry 4.0 Survey What We Mean by Industry 4.0/Survey Key Findings/Blueprint for Digital Success. 2016. Available online: www.pwc.com/industry40 (accessed on 29 October 2020).
- Leong, W.D.; Teng, S.Y.; How, B.S.; Ngan, S.L.; Rahman, A.A.; Tan, C.P.; Ponnambalam, S.; Lam, H.L. Enhancing the adaptability: Lean and green strategy towards the Industry Revolution 4.0. J. Clean. Prod. 2020, 273, 122870. [Google Scholar] [CrossRef]
- Varela, M.L.R.; Araújo, A.; Ávila, P.; Castro, H.; Putnik, G.D. Evaluation of the Relation between Lean Manufacturing, Industry 4.0, and Sustainability. Sustainability 2019, 11, 1439. [Google Scholar] [CrossRef] [Green Version]
- Schultz, M.; Strømmen, K.H. Lean’s Impact on Innovation Processes. 2015. Available online: https://openarchive.usn.no/usn-xmlui/handle/11250/2394772 (accessed on 30 October 2020).
- Centobelli, P.; Cerchione, R.; Singh, R. The impact of leanness and innovativeness on environmental and financial performance: Insights from Indian SMEs. Int. J. Prod. Econ. 2019, 212, 111–124. [Google Scholar] [CrossRef]
- Bayou, M.; De Korvin, A. Measuring the leanness of manufacturing systems—A case study of Ford Motor Company and General Motors. J. Eng. Technol. Manag. 2008, 25, 287–304. [Google Scholar] [CrossRef]
- Machado, M.F.; Lacerda, D.P.; Morandi, M.I.W.M.; Camargo, L.F.R.; Dresch, A. Economic measuring of losses derived from inventory management at an oil refinery. Int. J. Prod. Perform. Manag. 2020. [Google Scholar] [CrossRef]
- Gopinath, S.; Freiheit, T.I. A waste relationship model and center point tracking metric for lean manufacturing systems. IIE Trans. 2012, 44, 136–154. [Google Scholar] [CrossRef]
- Romero, D.; Gaiardelli, P.; Thürer, M. Powell, D.; Wuest, T. Cyber-Physical Waste Identification and Elimination Strategies in the Digital Lean Manufacturing World. IFIP Adv. Inf. Commun. Technol. 2019, 566, 37–45. [Google Scholar] [CrossRef]
- Jonsson, P.; Lesshammar, M. Evaluation and improvement of manufacturing performance measurement systems—The role of OEE. Int. J. Oper. Prod. Manag. 1999, 19, 55–78. [Google Scholar] [CrossRef] [Green Version]
- Muchiri, P.; Pintelon, L. Performance measurement using overall equipment effectiveness (OEE): Literature review and practical application discussion. Int. J. Prod. Res. 2008, 46, 3517–3535. [Google Scholar] [CrossRef] [Green Version]
- Garza-Reyes, J.A. From measuring overall equipment effectiveness (OEE) to overall resource effectiveness (ORE). J. Qual. Maint. Eng. 2015, 21, 506–527. [Google Scholar] [CrossRef]
- Corrales, L.D.C.N.; Lambán, M.P.; Korner, M.E.H.; Royo, J. Overall Equipment Effectiveness: Systematic Literature Review and Overview of Different Approaches. Appl. Sci. 2020, 10, 6469. [Google Scholar] [CrossRef]
- García-Arca, J.; Prado-Prado, J.C.; Fernández-González, A.J. Integrating KPIs for improving efficiency in road transport. Int. J. Phys. Distrib. Logist. Manag. 2018, 48, 931–951. [Google Scholar] [CrossRef]
- Parida, A.; Kumar, U. Maintenance performance measurement (MPM): Issues and challenges. J. Qual. Maint. Eng. 2006, 12, 239–251. [Google Scholar] [CrossRef]
- Morella, P.; Lambán, M.P.; Royo, J.; Sánchez, J.C.; Corrales, L.D.C.N. Development of a New Green Indicator and Its Implementation in a Cyber–Physical System for a Green Supply Chain. Sustainability 2020, 12, 8629. [Google Scholar] [CrossRef]
- Panicker, S.; Nagarajan, H.P.; Mokhtarian, H.; Hamedi, A.; Chakraborti, A.; Coatanéa, E.; Haapala, K.R.; Koskinen, K. Tracing the Interrelationship between Key Performance Indicators and Production Cost using Bayesian Networks. Procedia CIRP 2019, 81, 500–505. [Google Scholar] [CrossRef]
- Baykasoglu, A.; Kaplanoğlu, V. Application of business process modeling and simulation to a logistics company. Int. Conf. Model. Simul. 2006, 977–982. Available online: https://www.researchgate.net/publication/343650831_Application_of_business_process_modeling_and_simulation_to_a_logistics_company (accessed on 10 November 2020).
- Gupta, M.; Galloway, K. Activity-based costing/management and its implications for operations management. Technovation 2003, 23, 131–138. [Google Scholar] [CrossRef]
- Needy, K.L.; Billo, R.E.; Warner, R.C. A cost model for the evaluation of alternative cellular manufacturing configurations. Comput. Ind. Eng. 1998, 34, 119–134. [Google Scholar] [CrossRef]
- Brüggemann, H.; Bremer, P. Einführung und Überblick. In Grundlagen Qualitätsmanagement; Springer Fachmedien: Wiesbaden, Germany, 2015; pp. 1–14. [Google Scholar]
- Cost|Definition of Cost by Merriam-Webster. Available online: https://www.merriam-webster.com/dictionary/cost (accessed on 3 November 2020).
- Grigg, N.P. Redefining quality in terms of value, risk and cost: A literature review. Int. J. Qual. Reliab. Manag. 2020. [Google Scholar] [CrossRef]
- Balakrishnan, R.; Labro, E.; Sivaramakrishnan, K. Product Costs as Decision Aids: An Analysis of Alternative Approaches (Part 2). Account. Horizons 2011, 26, 21–41. [Google Scholar] [CrossRef]
- Dogan, I.; Aydin, N. Combining Bayesian Networks and Total Cost of Ownership method for supplier selection analysis. Comput. Ind. Eng. 2011, 61, 1072–1085. [Google Scholar] [CrossRef]
- Gunasekaran, A.; Williams, H.; McGaughey, R.E. Performance measurement and costing system in new enterprise. Technovation 2005, 25, 523–533. [Google Scholar] [CrossRef]
- Christen, M.; Adey, B.T.; Wallbaum, H. On the usefulness of a cost-performance indicator curve at the strategic level for consideration of energy efficiency measures for building portfolios. Energy Build. 2016, 119, 267–282. [Google Scholar] [CrossRef]
- Windmark, C.; Bushlya, V.; Ståhl, J.-E. CPR a general Cost Performance Ratio in Manufacturing-A KPI for judgement of different technologies and development scenarios. Procedia CIRP 2018, 72, 1220–1226. [Google Scholar] [CrossRef]
- Shepherd, C.; Günter, H. Measuring supply chain performance: Current research and future directions. Int. J. Prod. Perform. Manag. 2006, 55, 242–258. [Google Scholar] [CrossRef]
- Wudhikarn, R.; Smithikul, C.; Manopiniwes, W. Developing Overall Equipment Cost Loss Indicator. Adv. Intell. Soft Comput. 2010, 66, 557–567. [Google Scholar]
- Al-Rbaihat, R. Integration of Benchmarking with Overall Equipment Cost Loss for Industrial Process Improvement. Jordan J. Mech. Ind. Eng. 2017, 11, 1–11. [Google Scholar]
- Askarany, D.; Yazdifar, H.; Askary, S. Supply chain management, activity-based costing and organisational factors. Int. J. Prod. Econ. 2010, 127, 238–248. [Google Scholar] [CrossRef]
- Qian, L.; Ben-Arieh, D. Parametric cost estimation based on activity-based costing: A case study for design and development of rotational parts. Int. J. Prod. Econ. 2008, 113, 805–818. [Google Scholar] [CrossRef]
- Öker, F.; Adiguzel, H. Time-driven activity-based costing: An implementation in a manufacturing company. J. Corp. Account. Financ. 2010, 22, 75–92. [Google Scholar] [CrossRef]
- Lambán, M.P. Determinación de Costes de Procesos de la Cadena de Suministro, e Influencia de Factores Productivos y Logísticos. Ph.D. Thesis, Universidad de Zaragoza, Aragon, Spain, 2010. [Google Scholar]
- Wudhikarn, R. Improving overall equipment cost loss adding cost of quality. Int. J. Prod. Res. 2011, 50, 3434–3449. [Google Scholar] [CrossRef]
- Ma, S.; Zhang, Y.; Lv, J.; Yang, H.; Wu, J. Energy-cyber-physical system enabled management for energy-intensive manufacturing industries. J. Clean. Prod. 2019, 226, 892–903. [Google Scholar] [CrossRef]
- Herrmann, C.; Schmidt, C.; Kurle, D.; Blume, S.; Thiede, S. Sustainability in manufacturing and factories of the future. Int. J. Precis. Eng. Manuf. Technol. 2014, 1, 283–292. [Google Scholar] [CrossRef] [Green Version]
- Zhang, G.; Chen, C.-H.; Zheng, P.; Zhong, R.Y. An integrated framework for active discovery and optimal allocation of smart manufacturing services. J. Clean. Prod. 2020, 273, 123144. [Google Scholar] [CrossRef]
- Mörth, O.; Emmanouilidis, C.; Hafner, N.; Schadler, M. Cyber-physical systems for performance monitoring in production intralogistics. Comput. Ind. Eng. 2020, 142. [Google Scholar] [CrossRef]
- Tan, Q.; Tong, Y.; Wu, S.; Li, D. Modeling, planning, and scheduling of shop-floor assembly process with dynamic cyber-physical interactions: A case study for CPS-based smart industrial robot production. Int. J. Adv. Manuf. Technol. 2019, 105, 3979–3989. [Google Scholar] [CrossRef]
- Gürdür, D.; Feljan, A.V.; El-Khoury, J.; Mohalik, S.K.; Badrinath, R.; Mujumdar, A.P.; Fersman, E. Knowledge Representation of Cyber-physical Systems for Monitoring Purpose. Procedia CIRP 2018, 72, 468–473. [Google Scholar] [CrossRef]
- Wagner, M.; Llort, G.; Mercadal, E.; Gimenez, J.; Labarta, J. Performance Analysis of Parallel Python Applications. Procedia Comput. Sci. 2017, 108, 2171–2179. [Google Scholar] [CrossRef]


| Parameter | Value | Observations |
|---|---|---|
| Labor cost | 12 €/h | One operator per action |
| Informatics resources | 0 €/h | There is no maintenance or licenses |
| Transform resource | 5.84 €/h | 8 years of amortization |
| Tools | 0.34 €/h | 15 min of useful life |
| Tooling | 0.55 €/h | Only 1 tooling is used |
| Fluids | 0.21 €/h | Distilled water and coolant |
| Energy | 0.135 €/kWh | Standard electric rate |
| Preparation time | 1 h | Measured in the workshop |
| Programming time | 1 h | Measured in the workshop |
| Number of rejects | 1 | Hypothesis |
| Number of reworks | 1 | Hypothesis |
| Case 1 | Case 2 | Case 3 | |
|---|---|---|---|
| Unit production cost | 11.84 € | 12.13 € | 12.71 € |
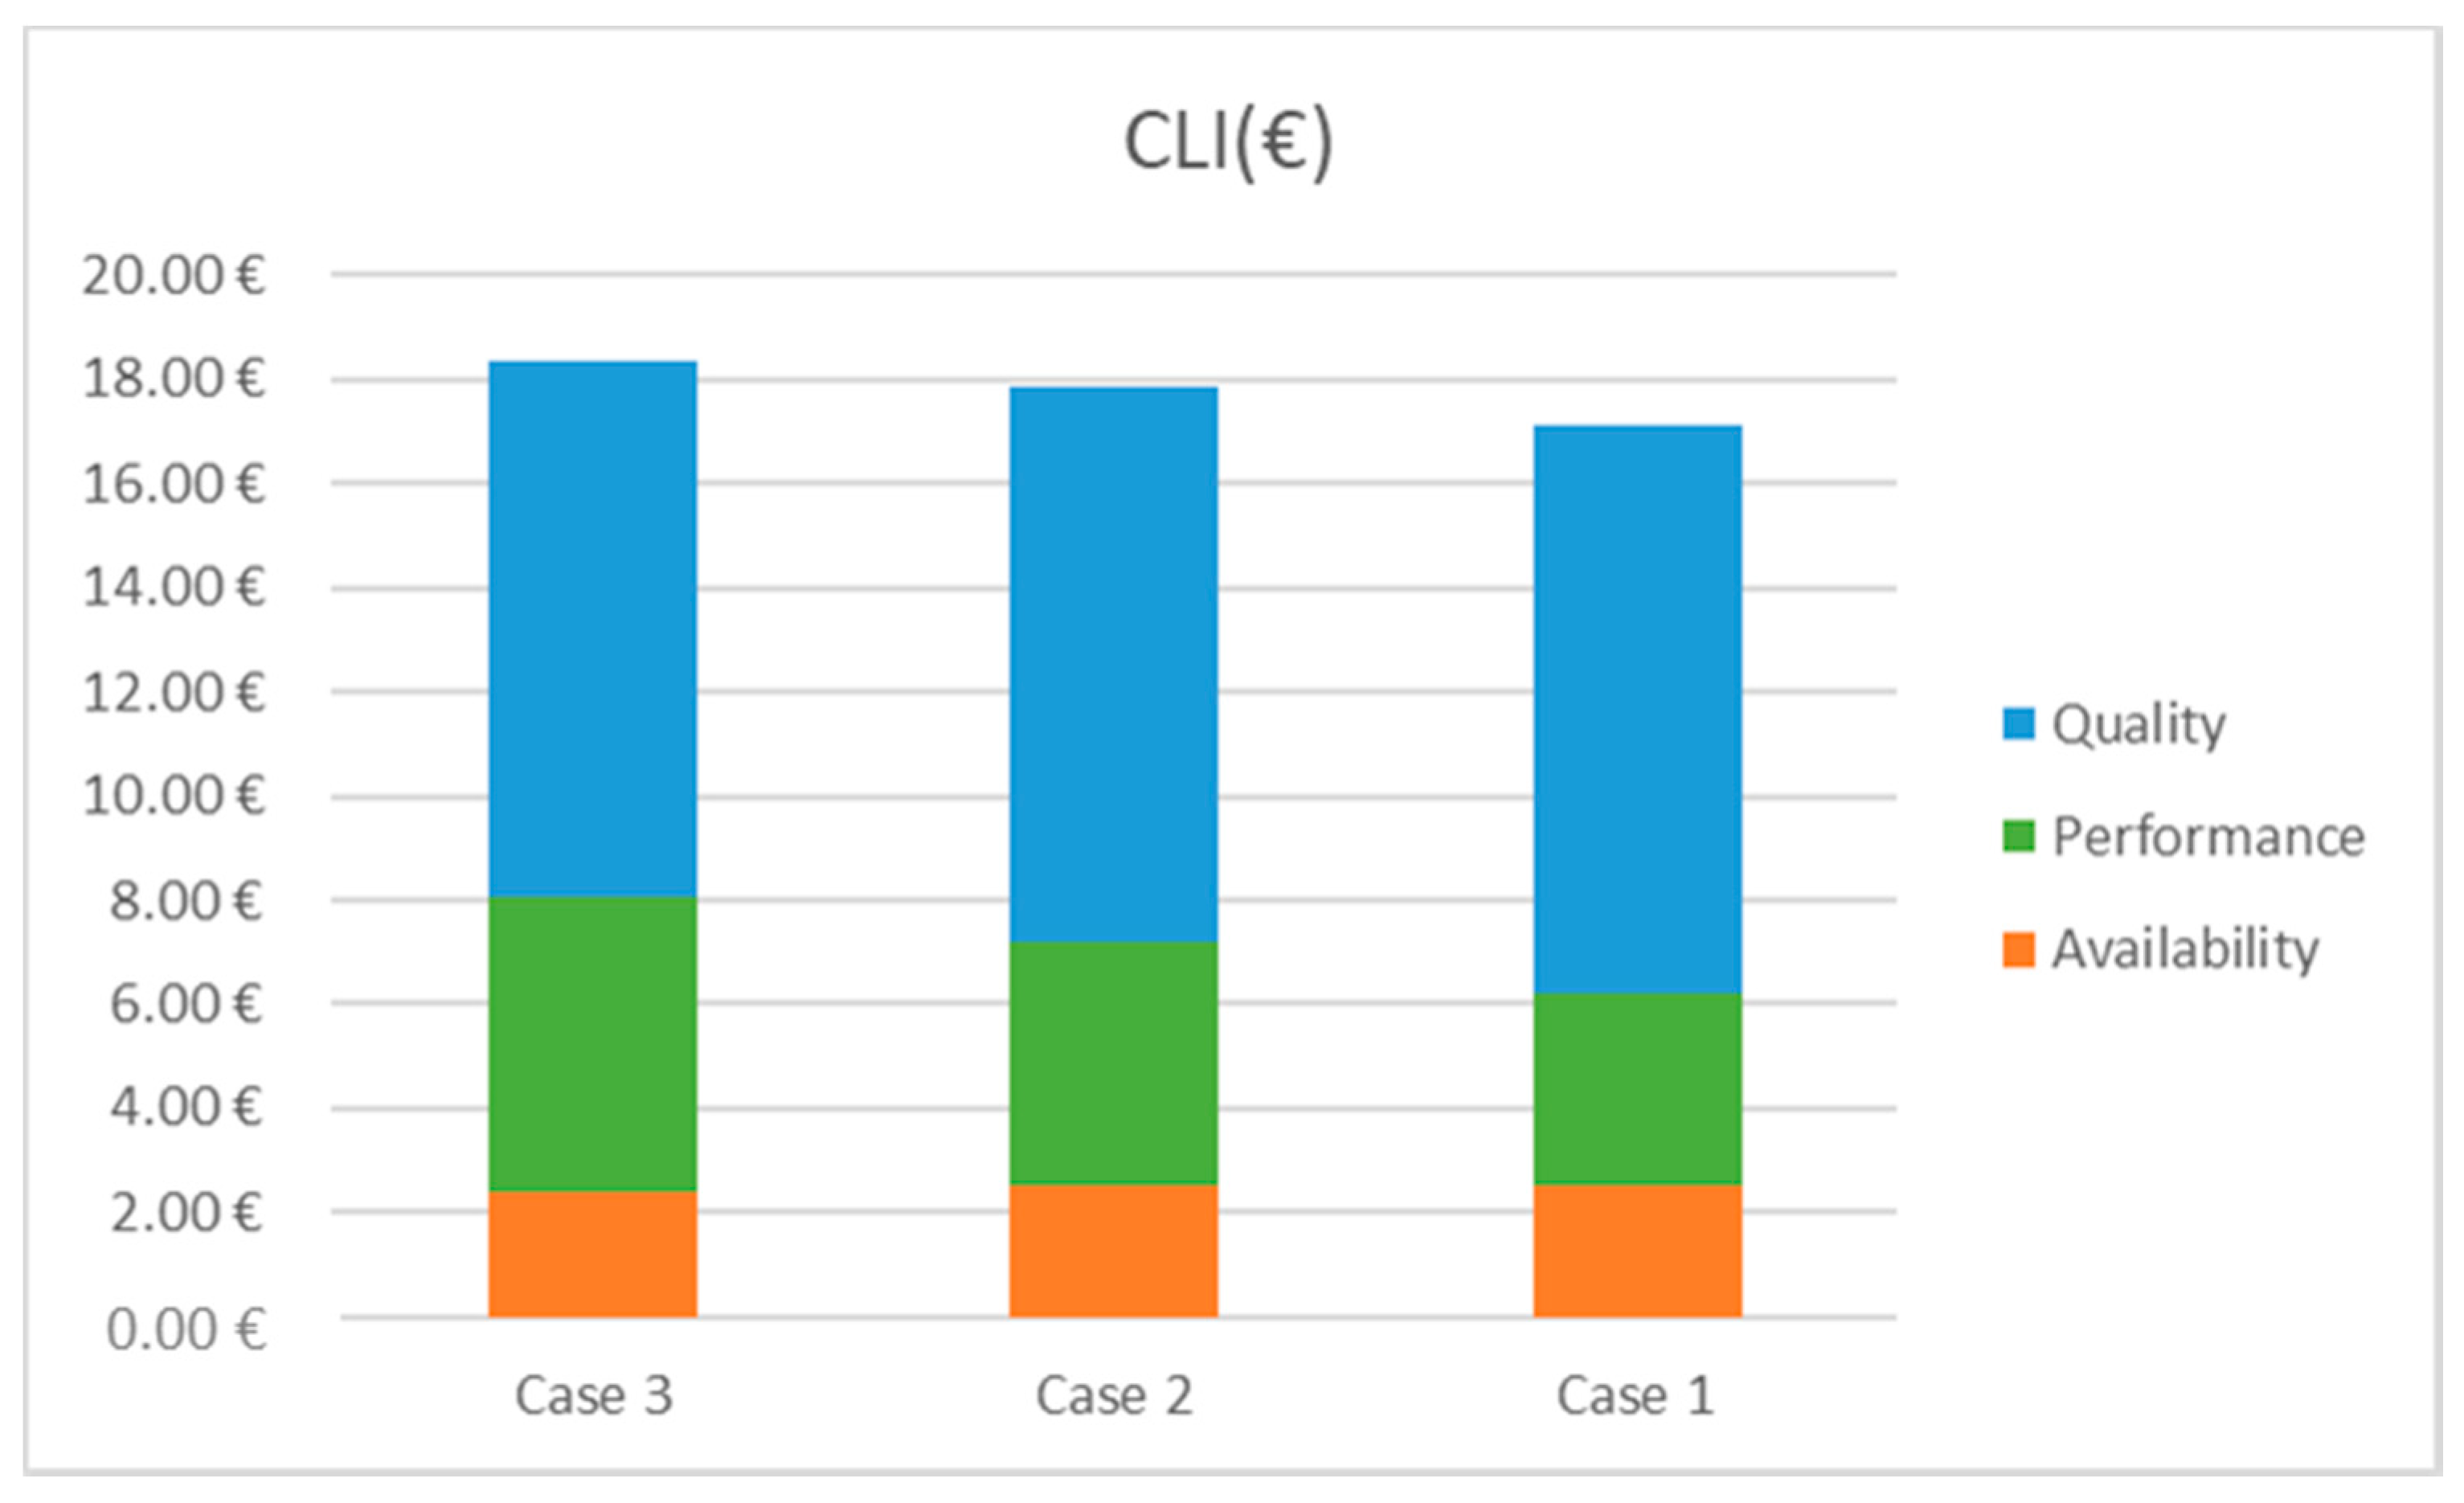
| Case 1 | Case 2 | Case 3 | |
|---|---|---|---|
| Section | 2.53 € | 2.51 € | 2.40 € |
| Section | 3.70 € | 4.67 € | 5.68 € |
| Section | 10.90 € | 10.67 € | 10.27 € |
| Section | 17.13 € | 17.85 € | 18.35 € |
| OEE | ECL (g CO2 eq) | OECL (€) | |
|---|---|---|---|
| Case 1 | 42.66% | 63.39 | 17.13 € |
| Case 2 | 42.95% | 64.64 | 17.85 € |
| Case 3 | 41.01% | 98.63 | 18.35 € |
Publisher’s Note: MDPI stays neutral with regard to jurisdictional claims in published maps and institutional affiliations. |
© 2020 by the authors. Licensee MDPI, Basel, Switzerland. This article is an open access article distributed under the terms and conditions of the Creative Commons Attribution (CC BY) license (http://creativecommons.org/licenses/by/4.0/).
Share and Cite
Morella, P.; Lambán, M.P.; Royo, J.; Sánchez, J.C.; Latapia, J. Development of a New KPI for the Economic Quantification of Six Big Losses and Its Implementation in a Cyber Physical System. Appl. Sci. 2020, 10, 9154. https://doi.org/10.3390/app10249154
Morella P, Lambán MP, Royo J, Sánchez JC, Latapia J. Development of a New KPI for the Economic Quantification of Six Big Losses and Its Implementation in a Cyber Physical System. Applied Sciences. 2020; 10(24):9154. https://doi.org/10.3390/app10249154
Chicago/Turabian StyleMorella, Paula, María Pilar Lambán, Jesús Royo, Juan Carlos Sánchez, and Jaime Latapia. 2020. "Development of a New KPI for the Economic Quantification of Six Big Losses and Its Implementation in a Cyber Physical System" Applied Sciences 10, no. 24: 9154. https://doi.org/10.3390/app10249154