Analytical Evaluation of MCE Collapse Performance of Seismically Base Isolated Buildings Located at Low-to-Moderate Seismicity Regions


Abstract
:1. Introduction
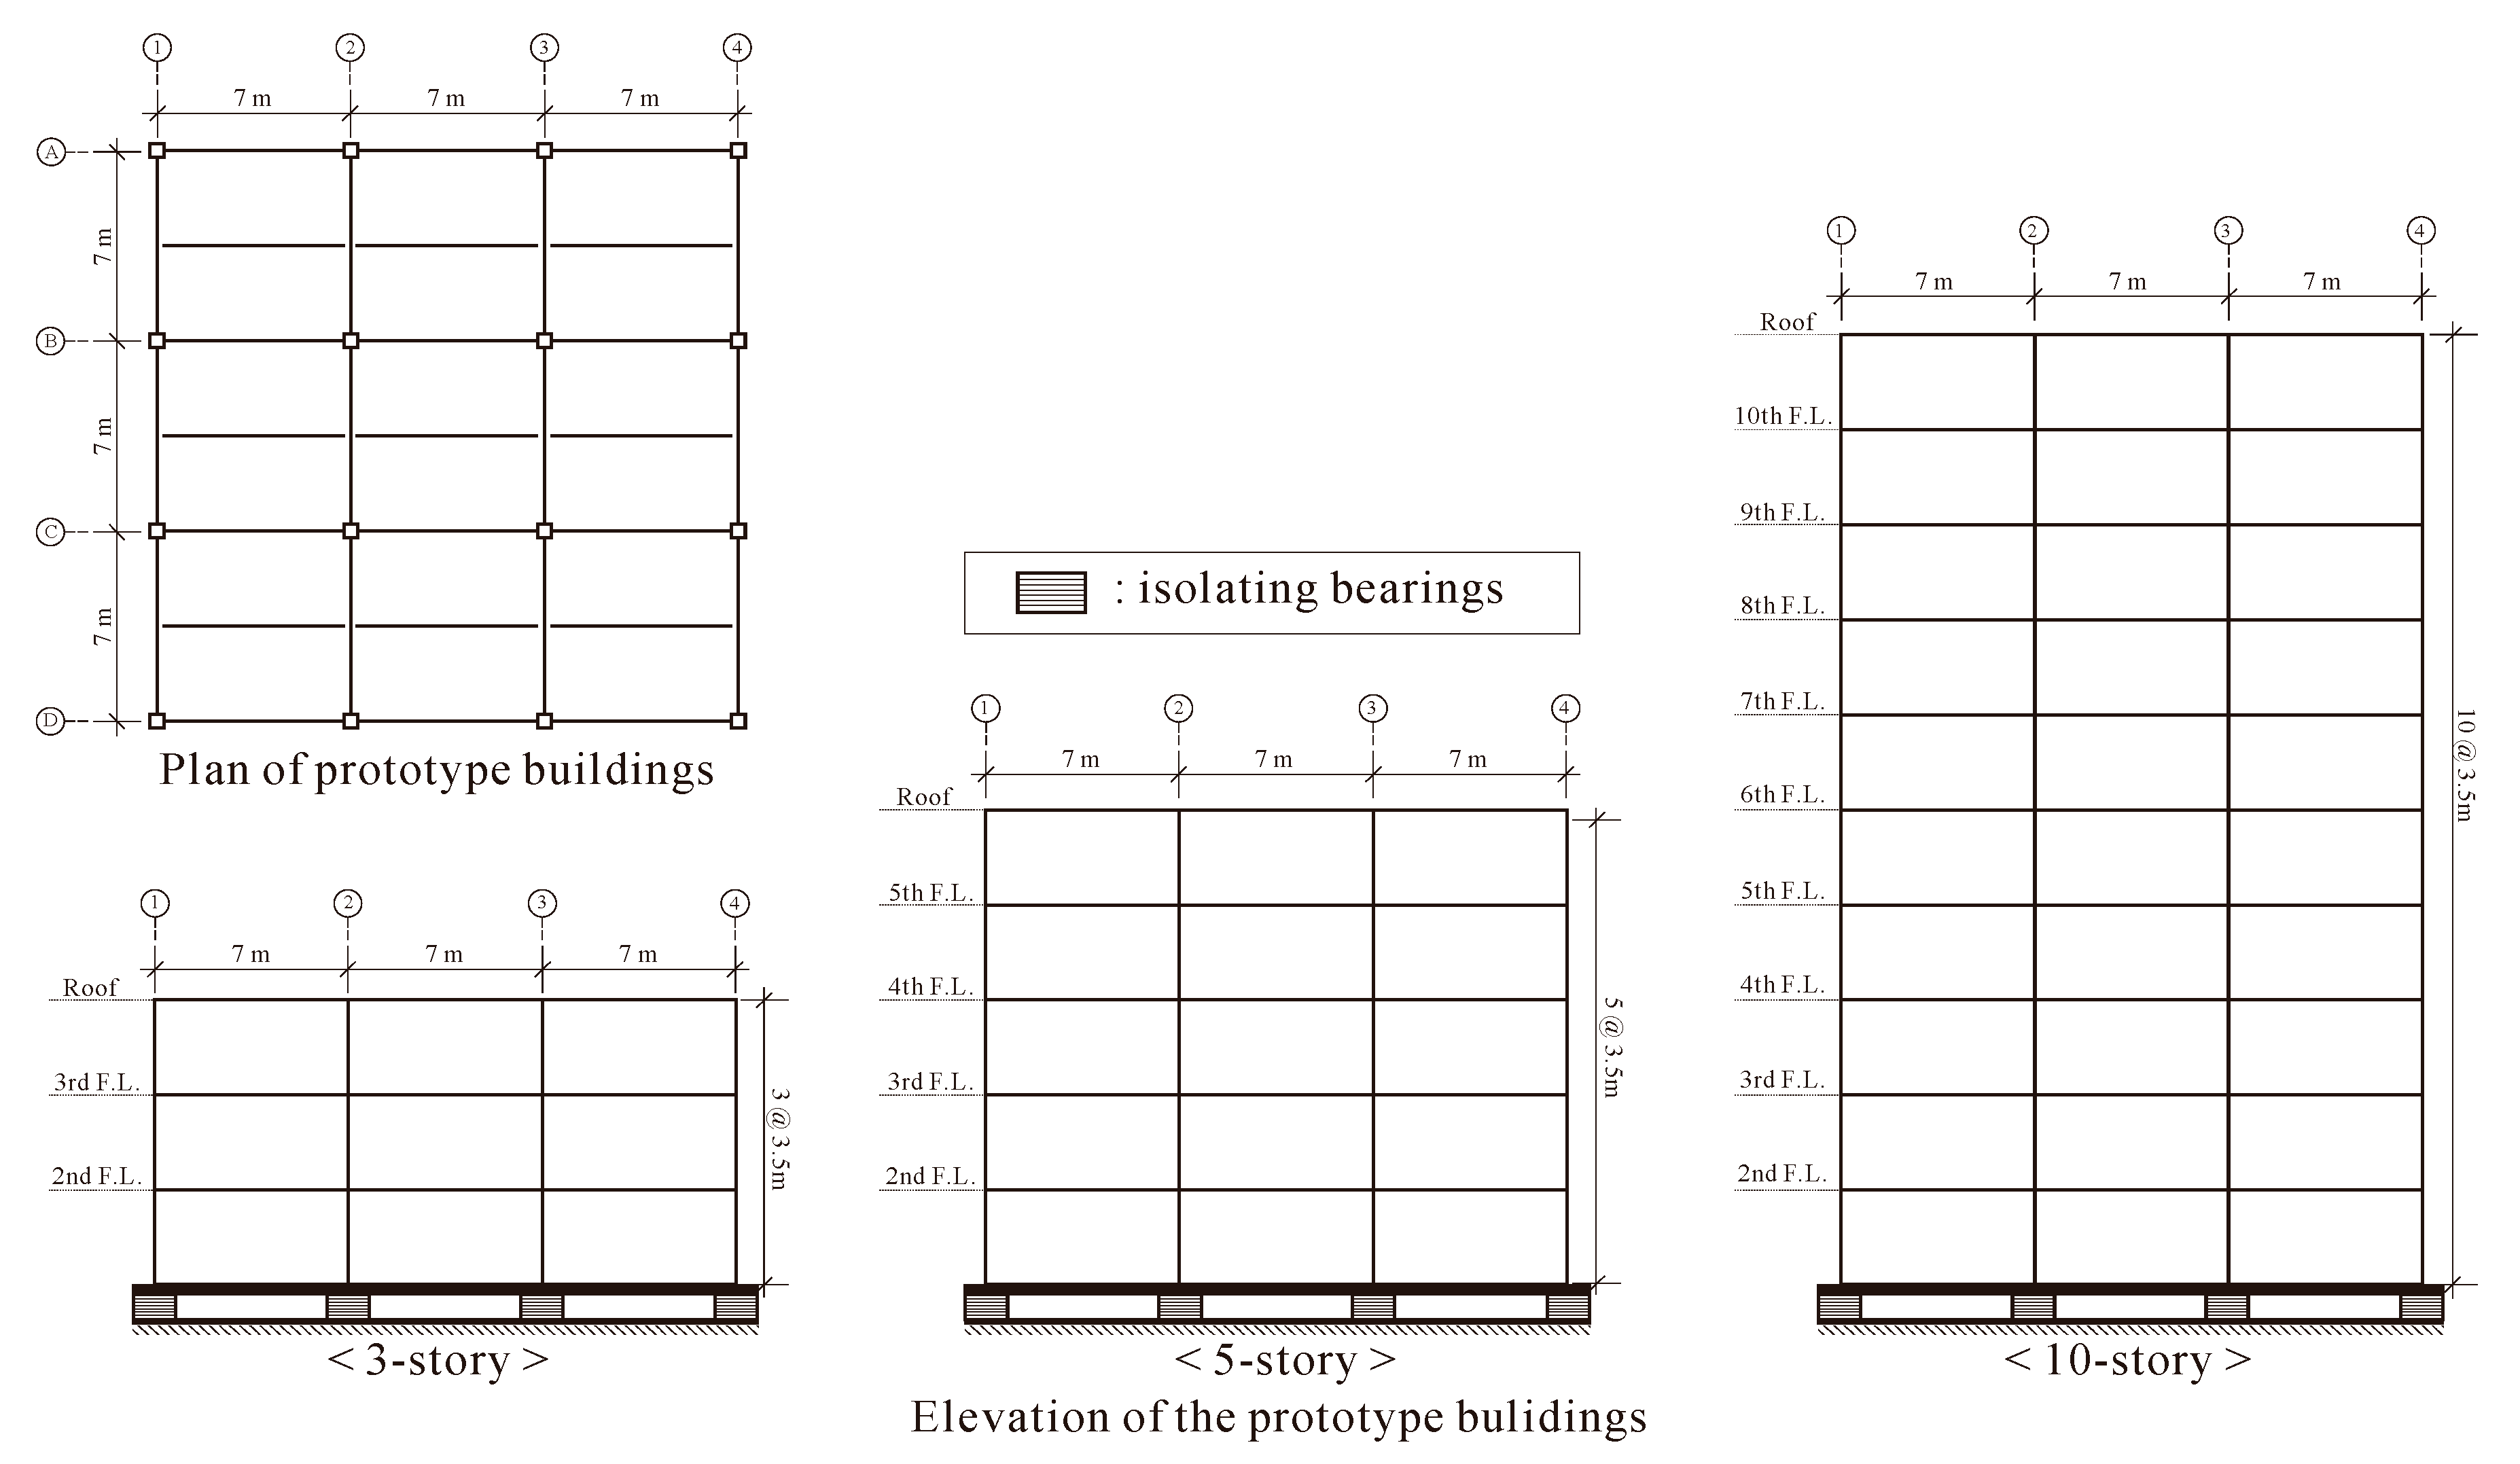
2. Description of Prototype Seismically Isolated Buildings
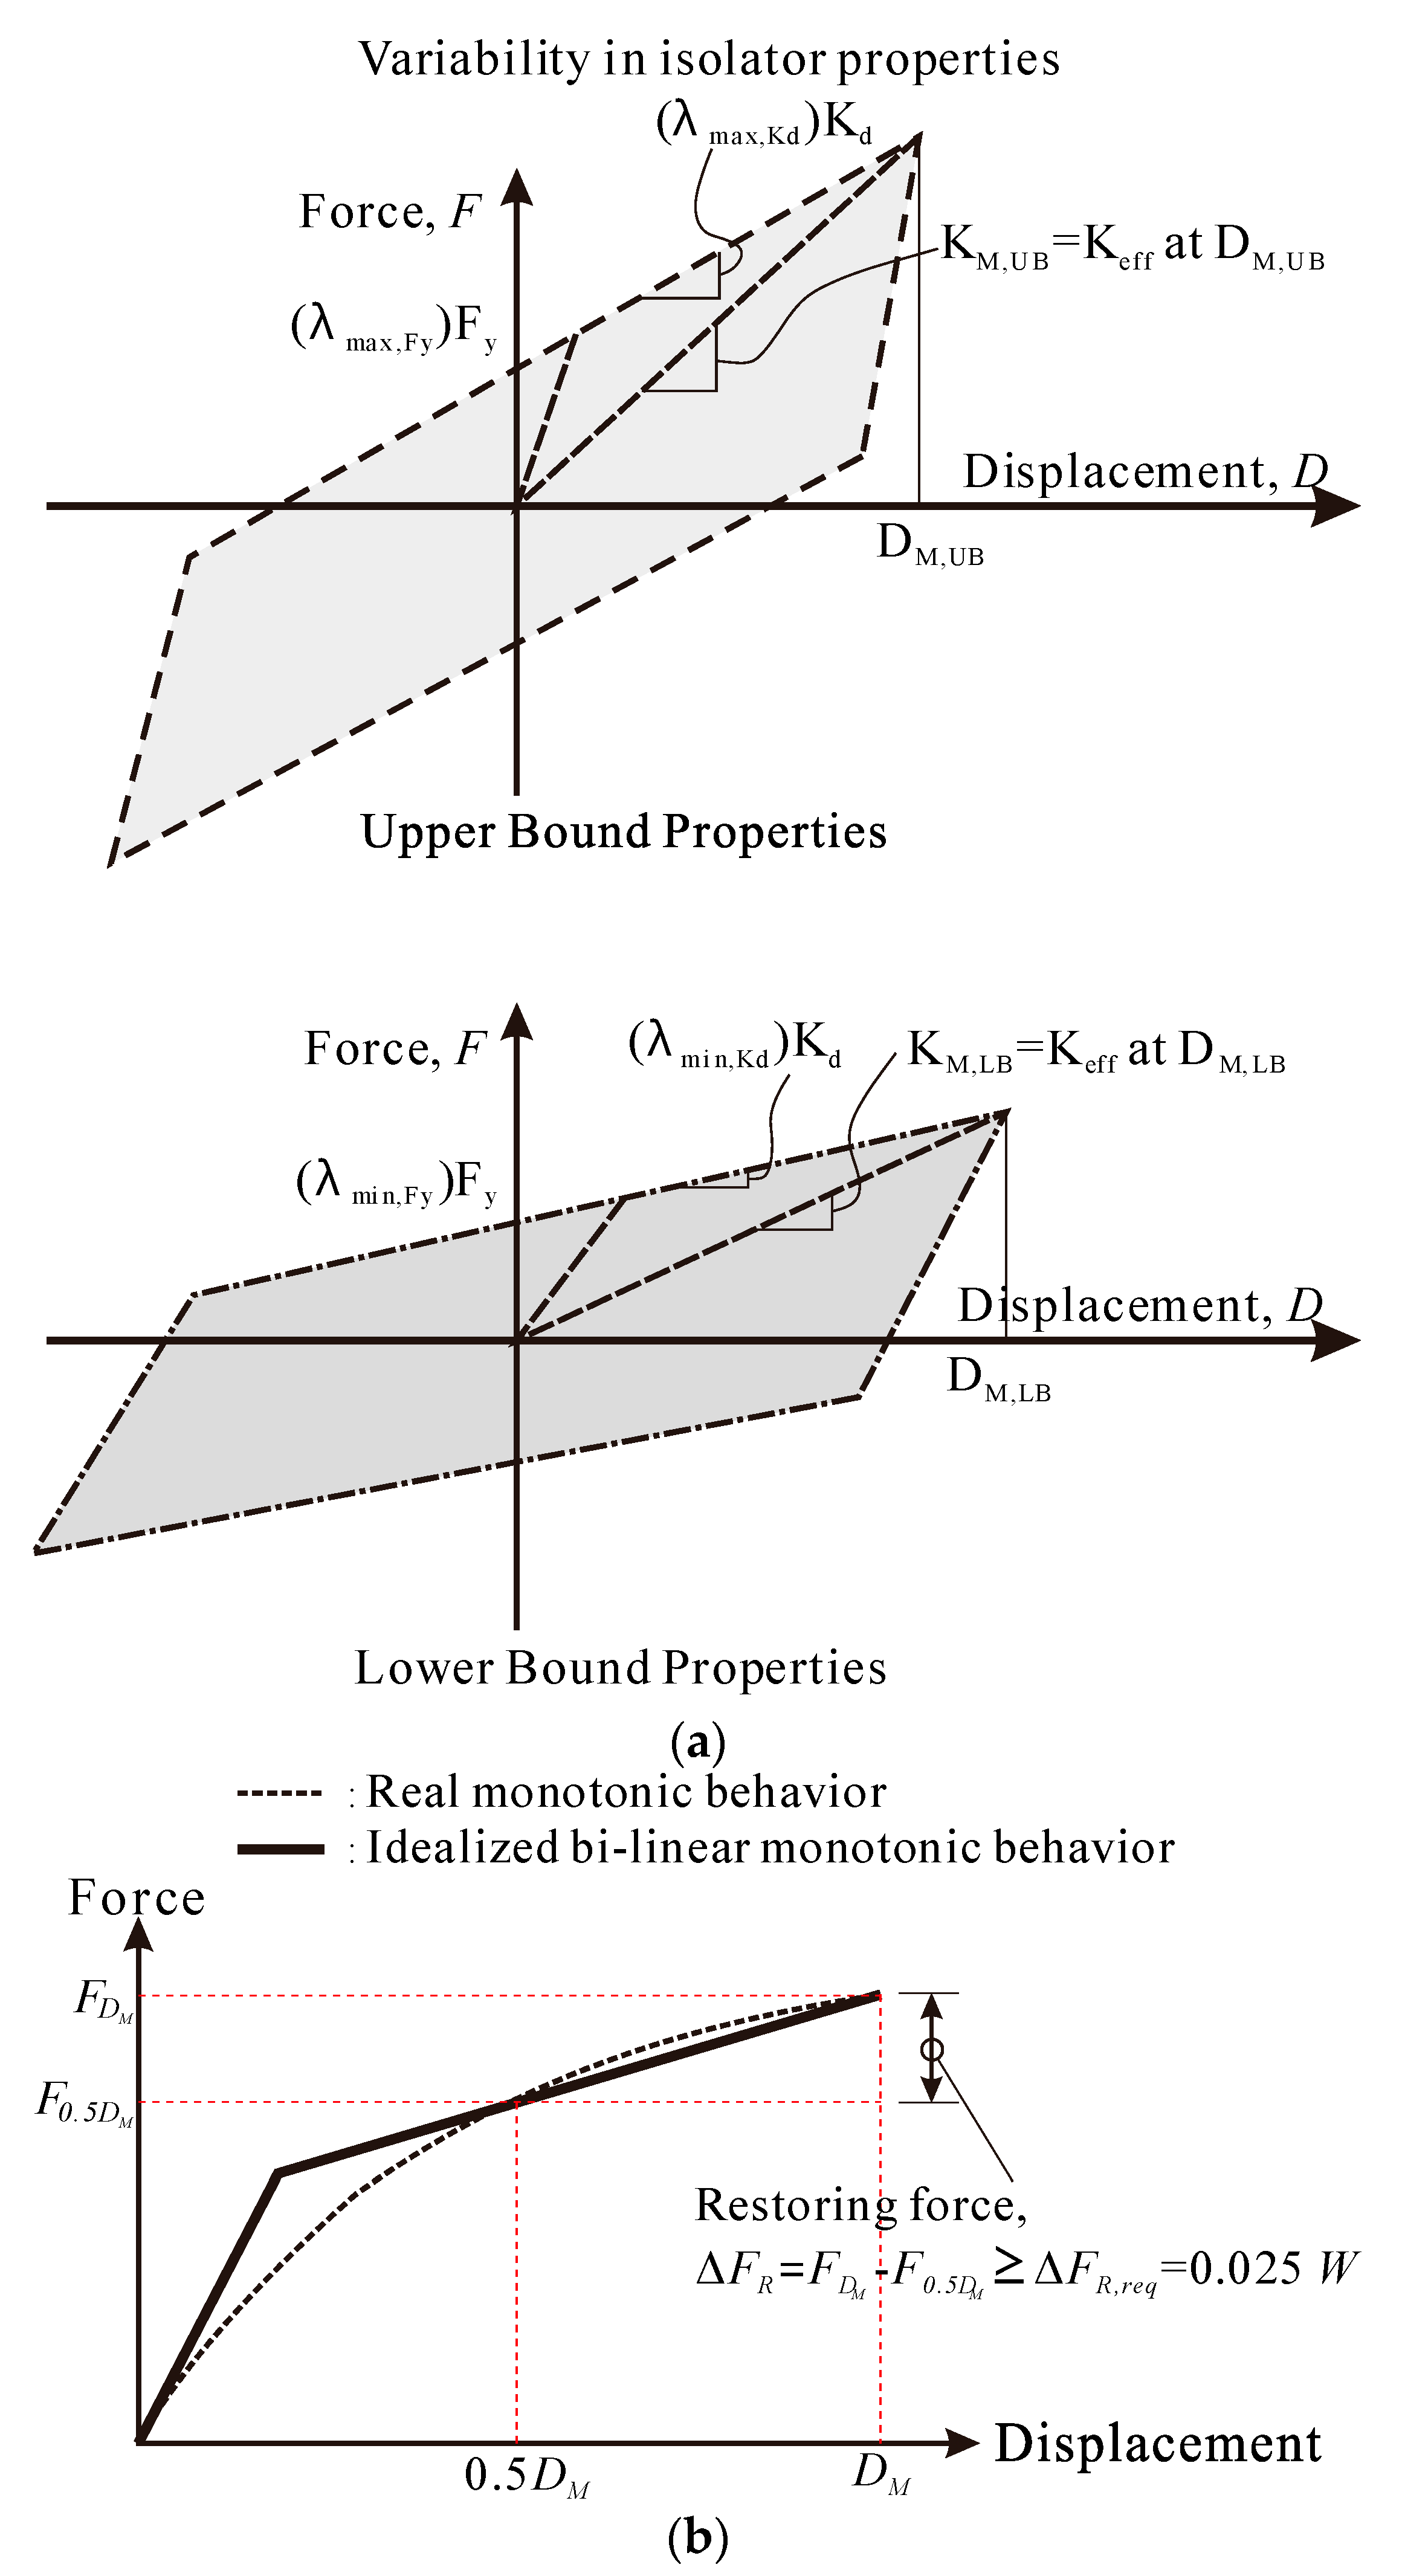
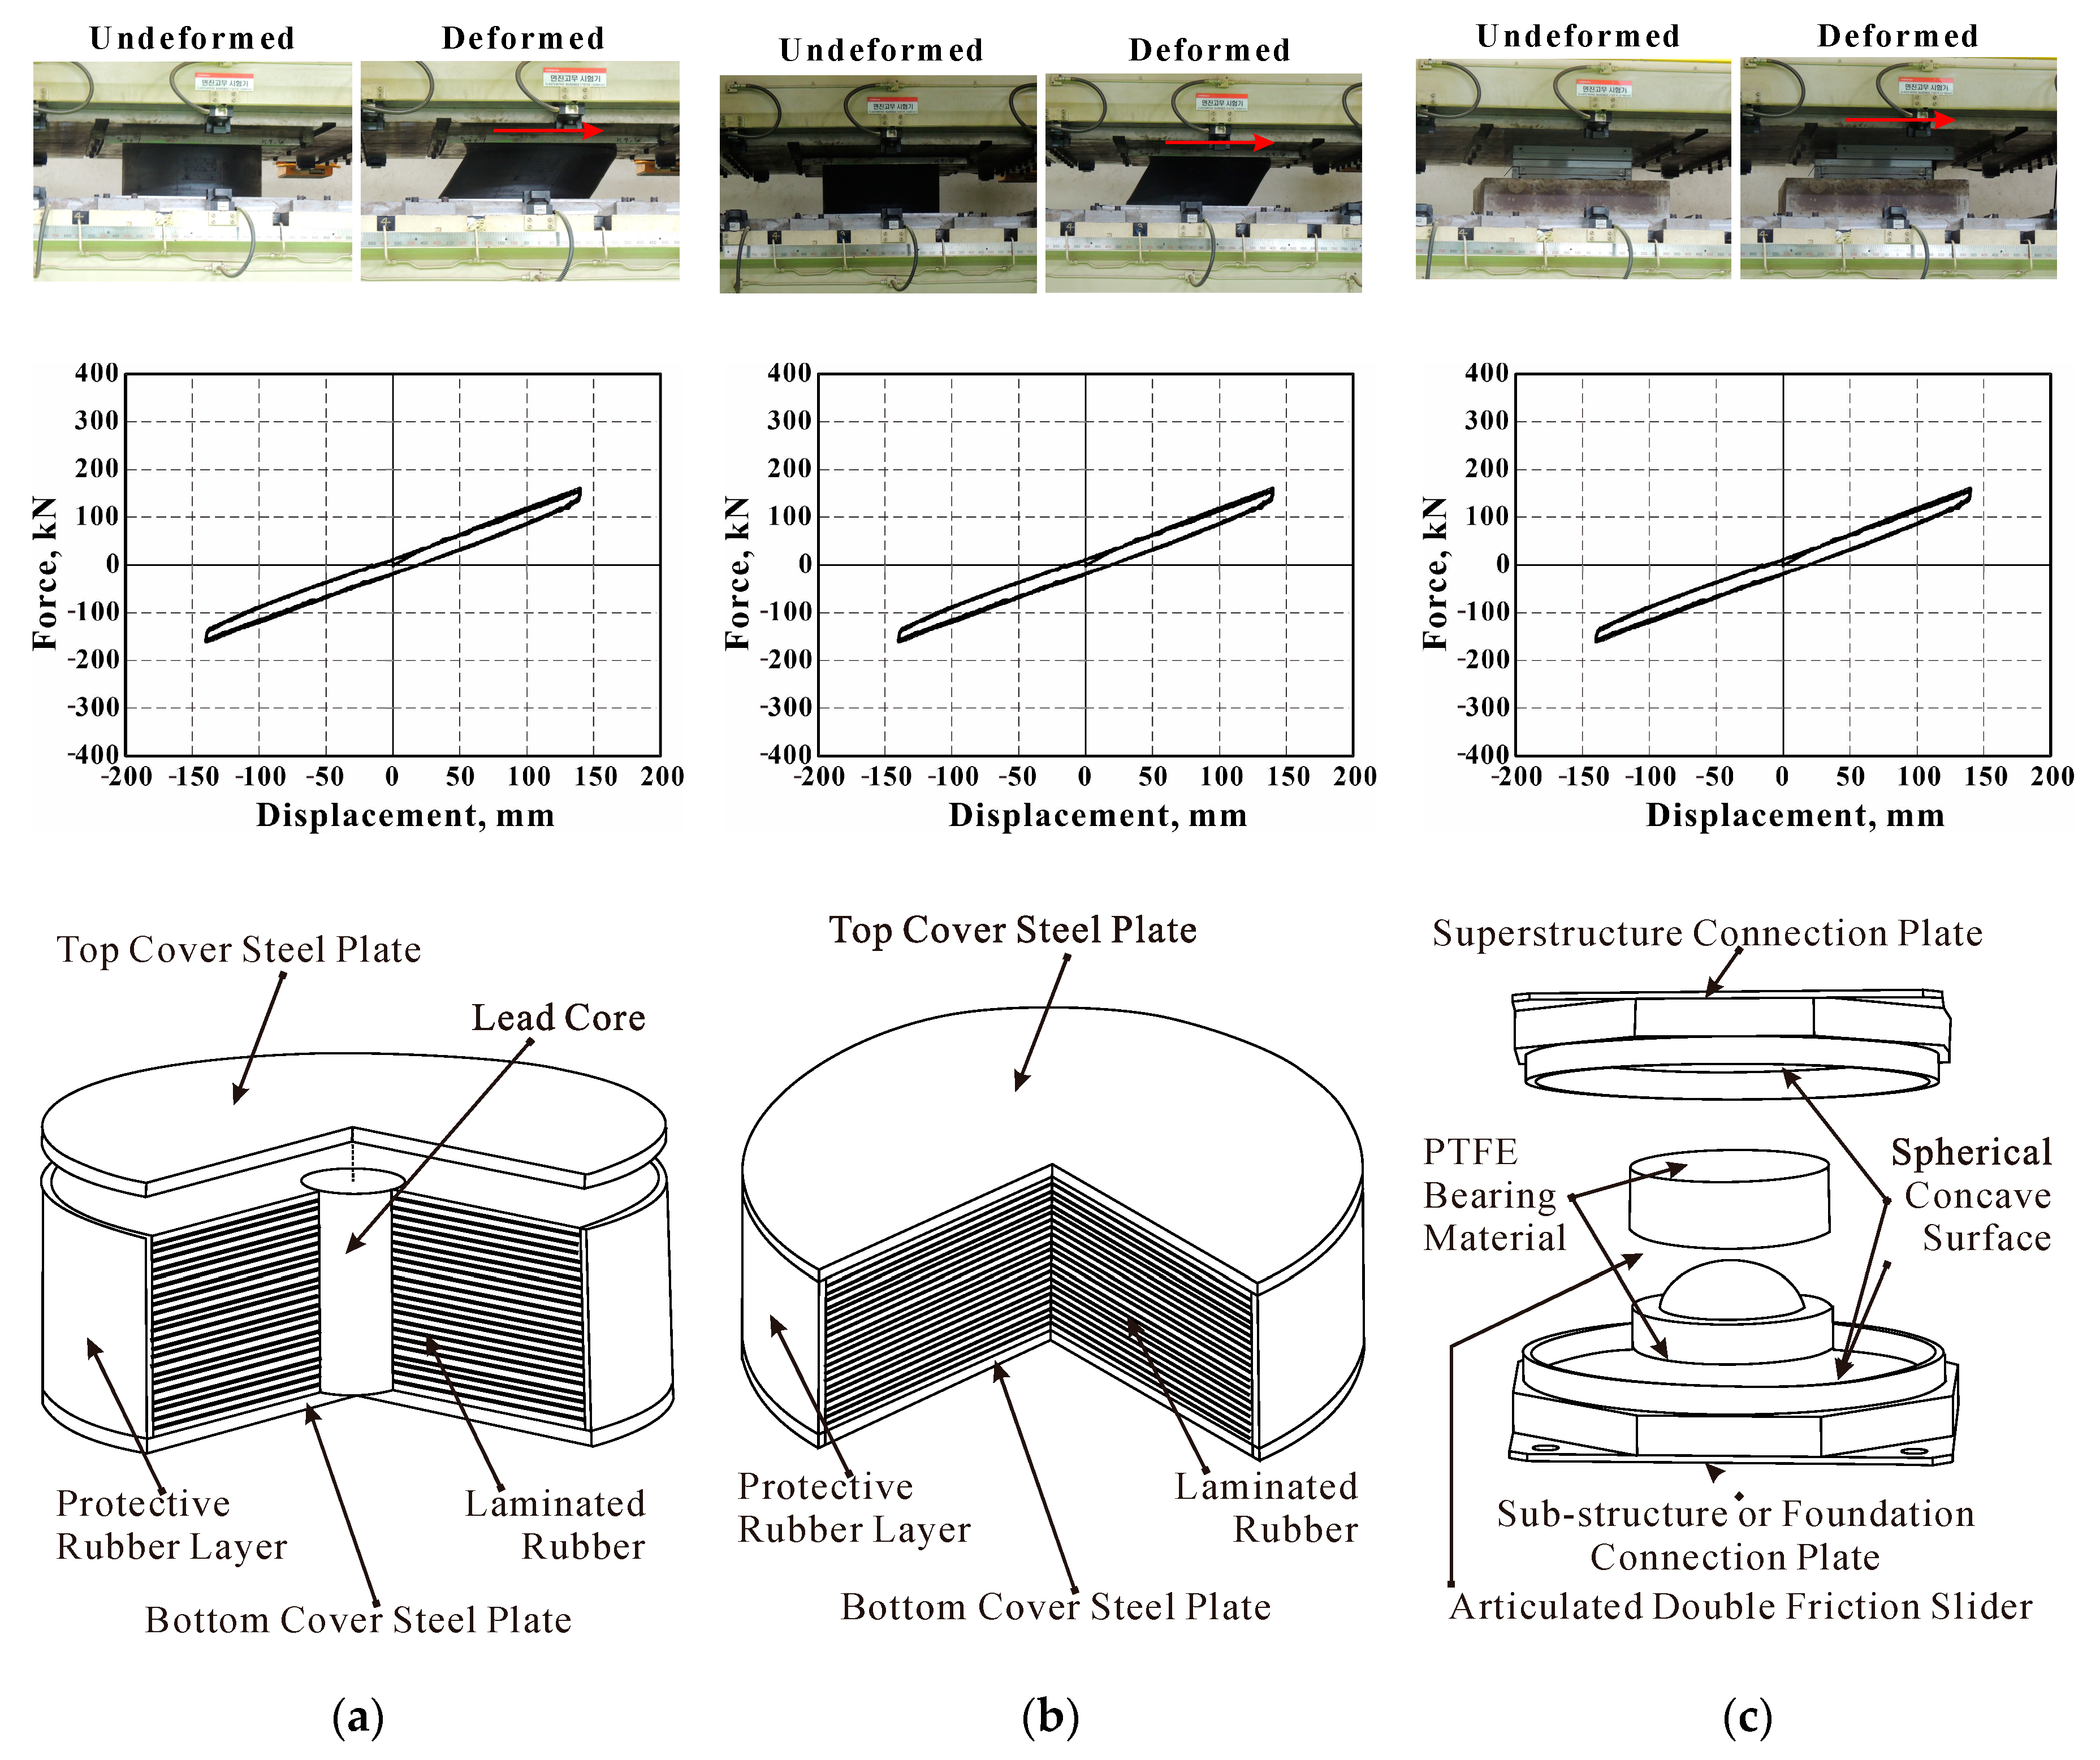
2.1. Main Design Requirements for Isolation Systems
2.2. Design of Seismically Isolated Buildings
3. Collapse Performance of Seismically Isolated Buildings
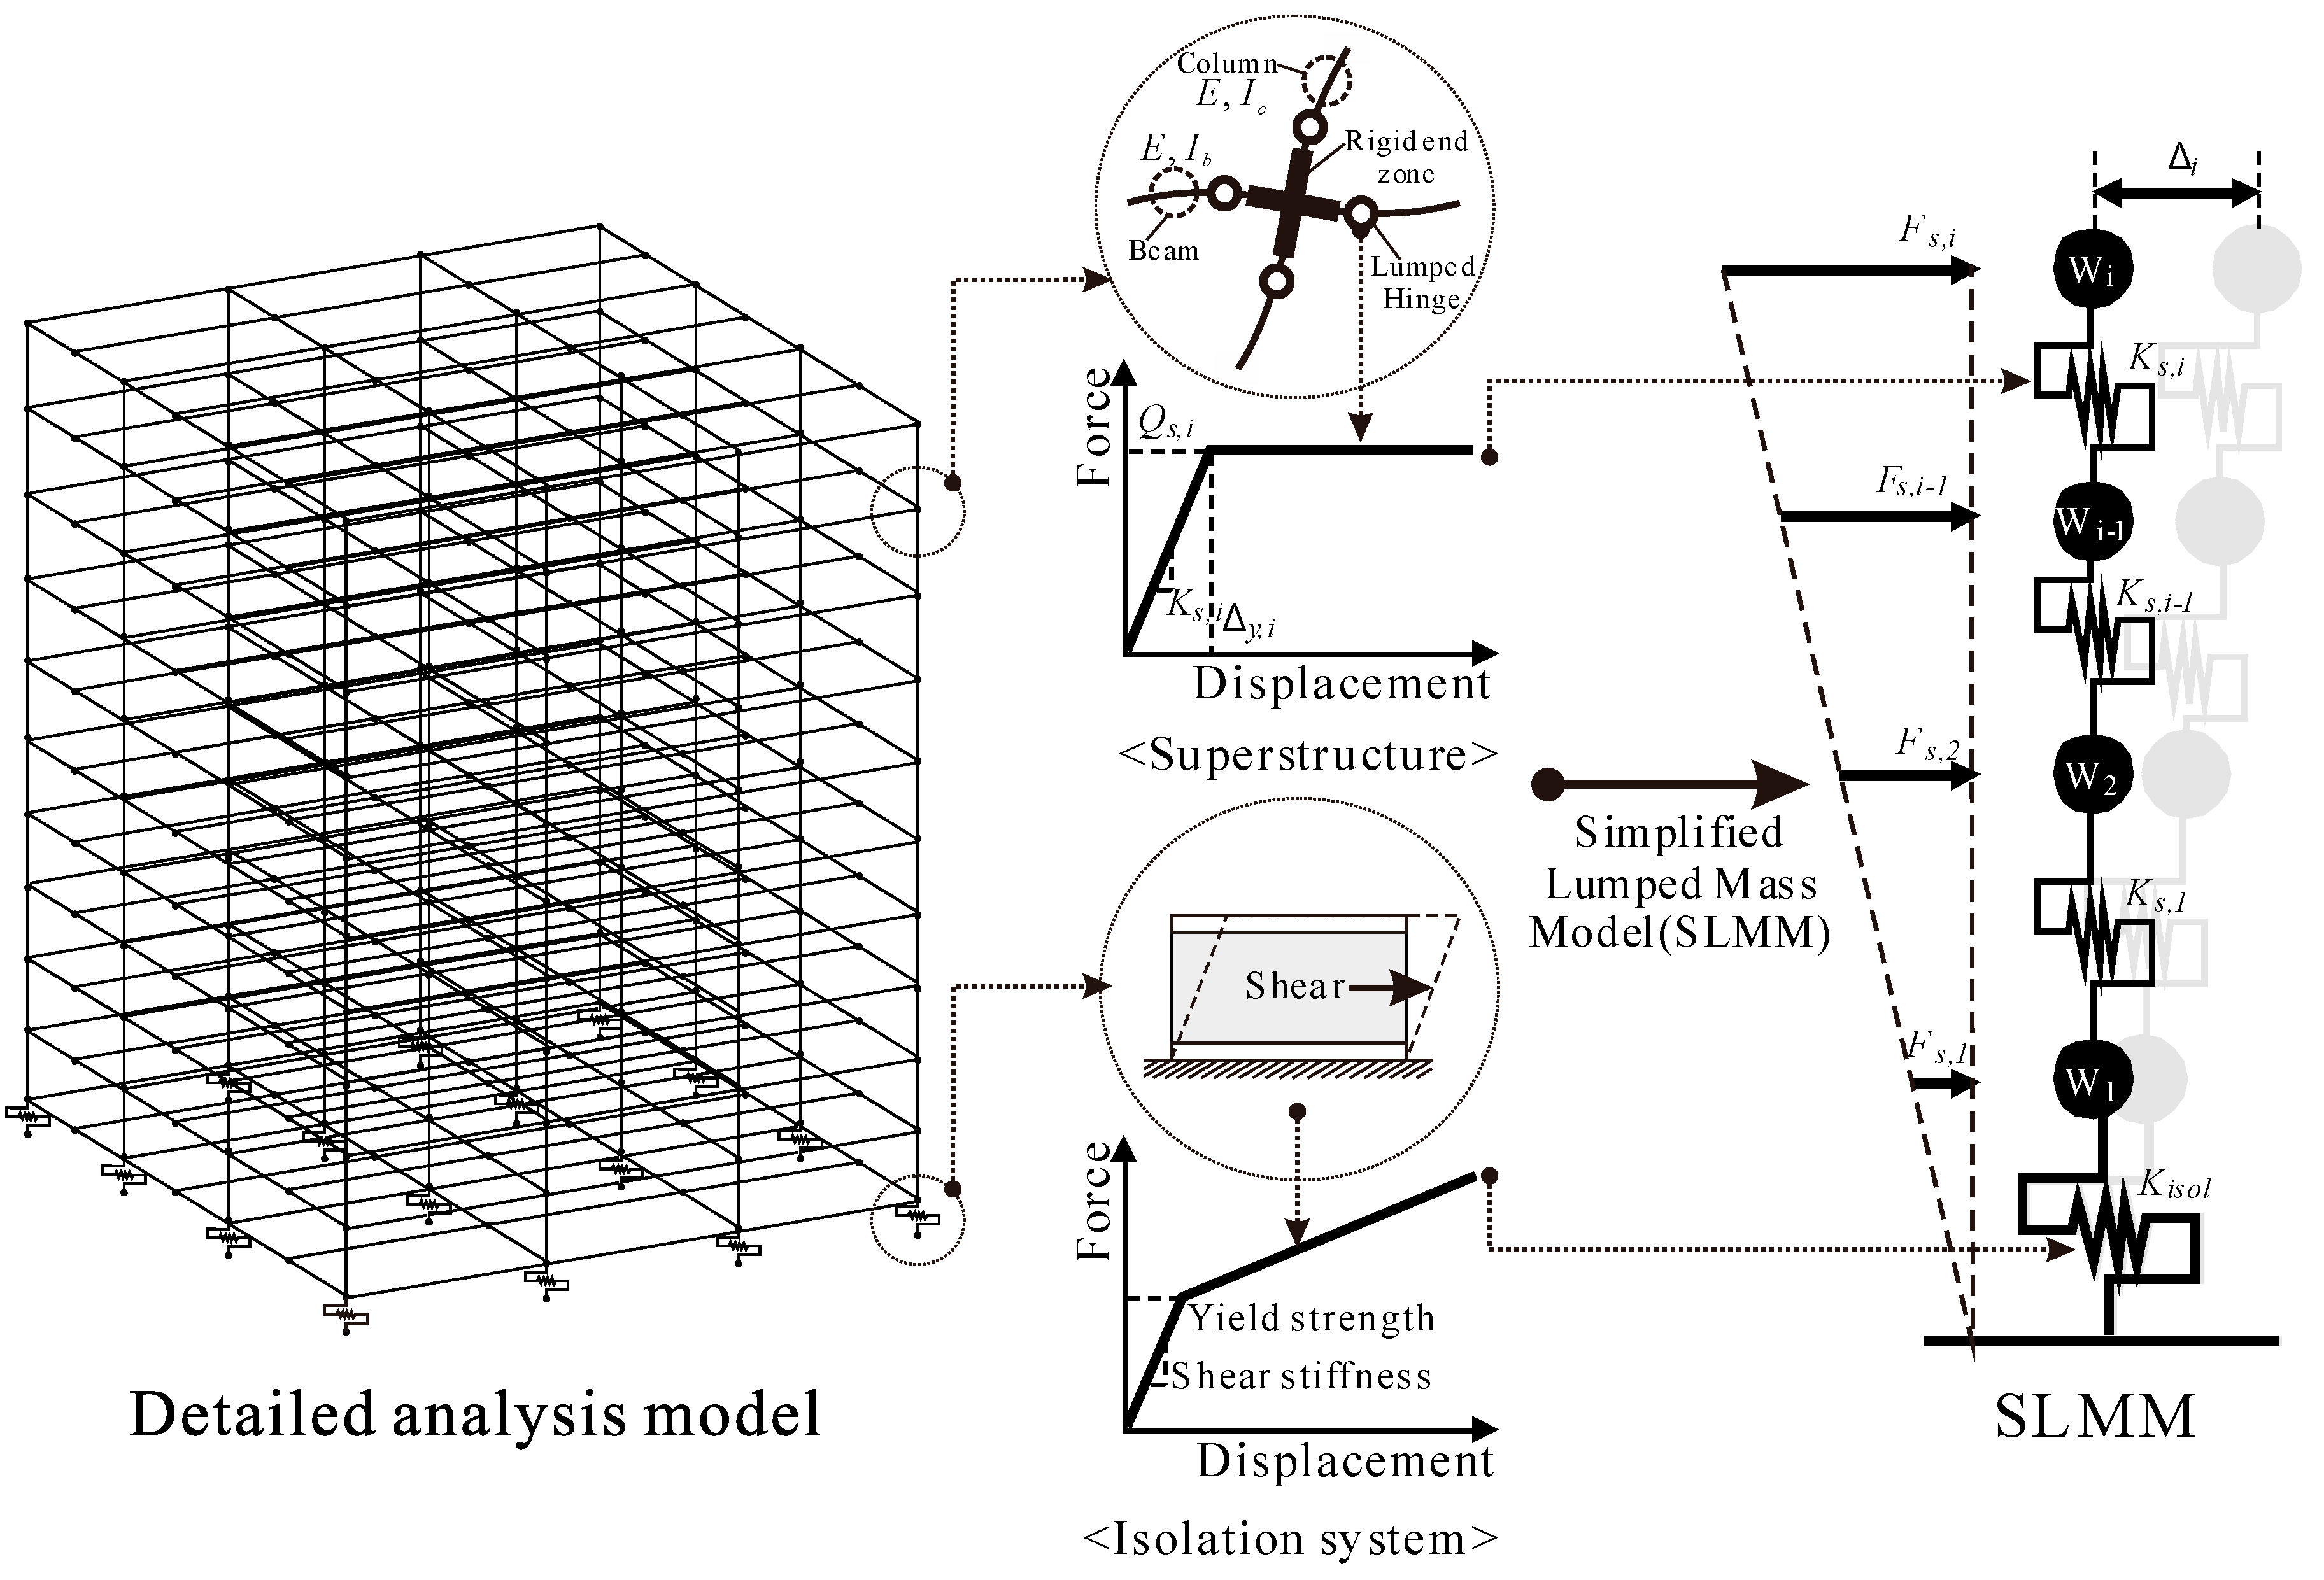
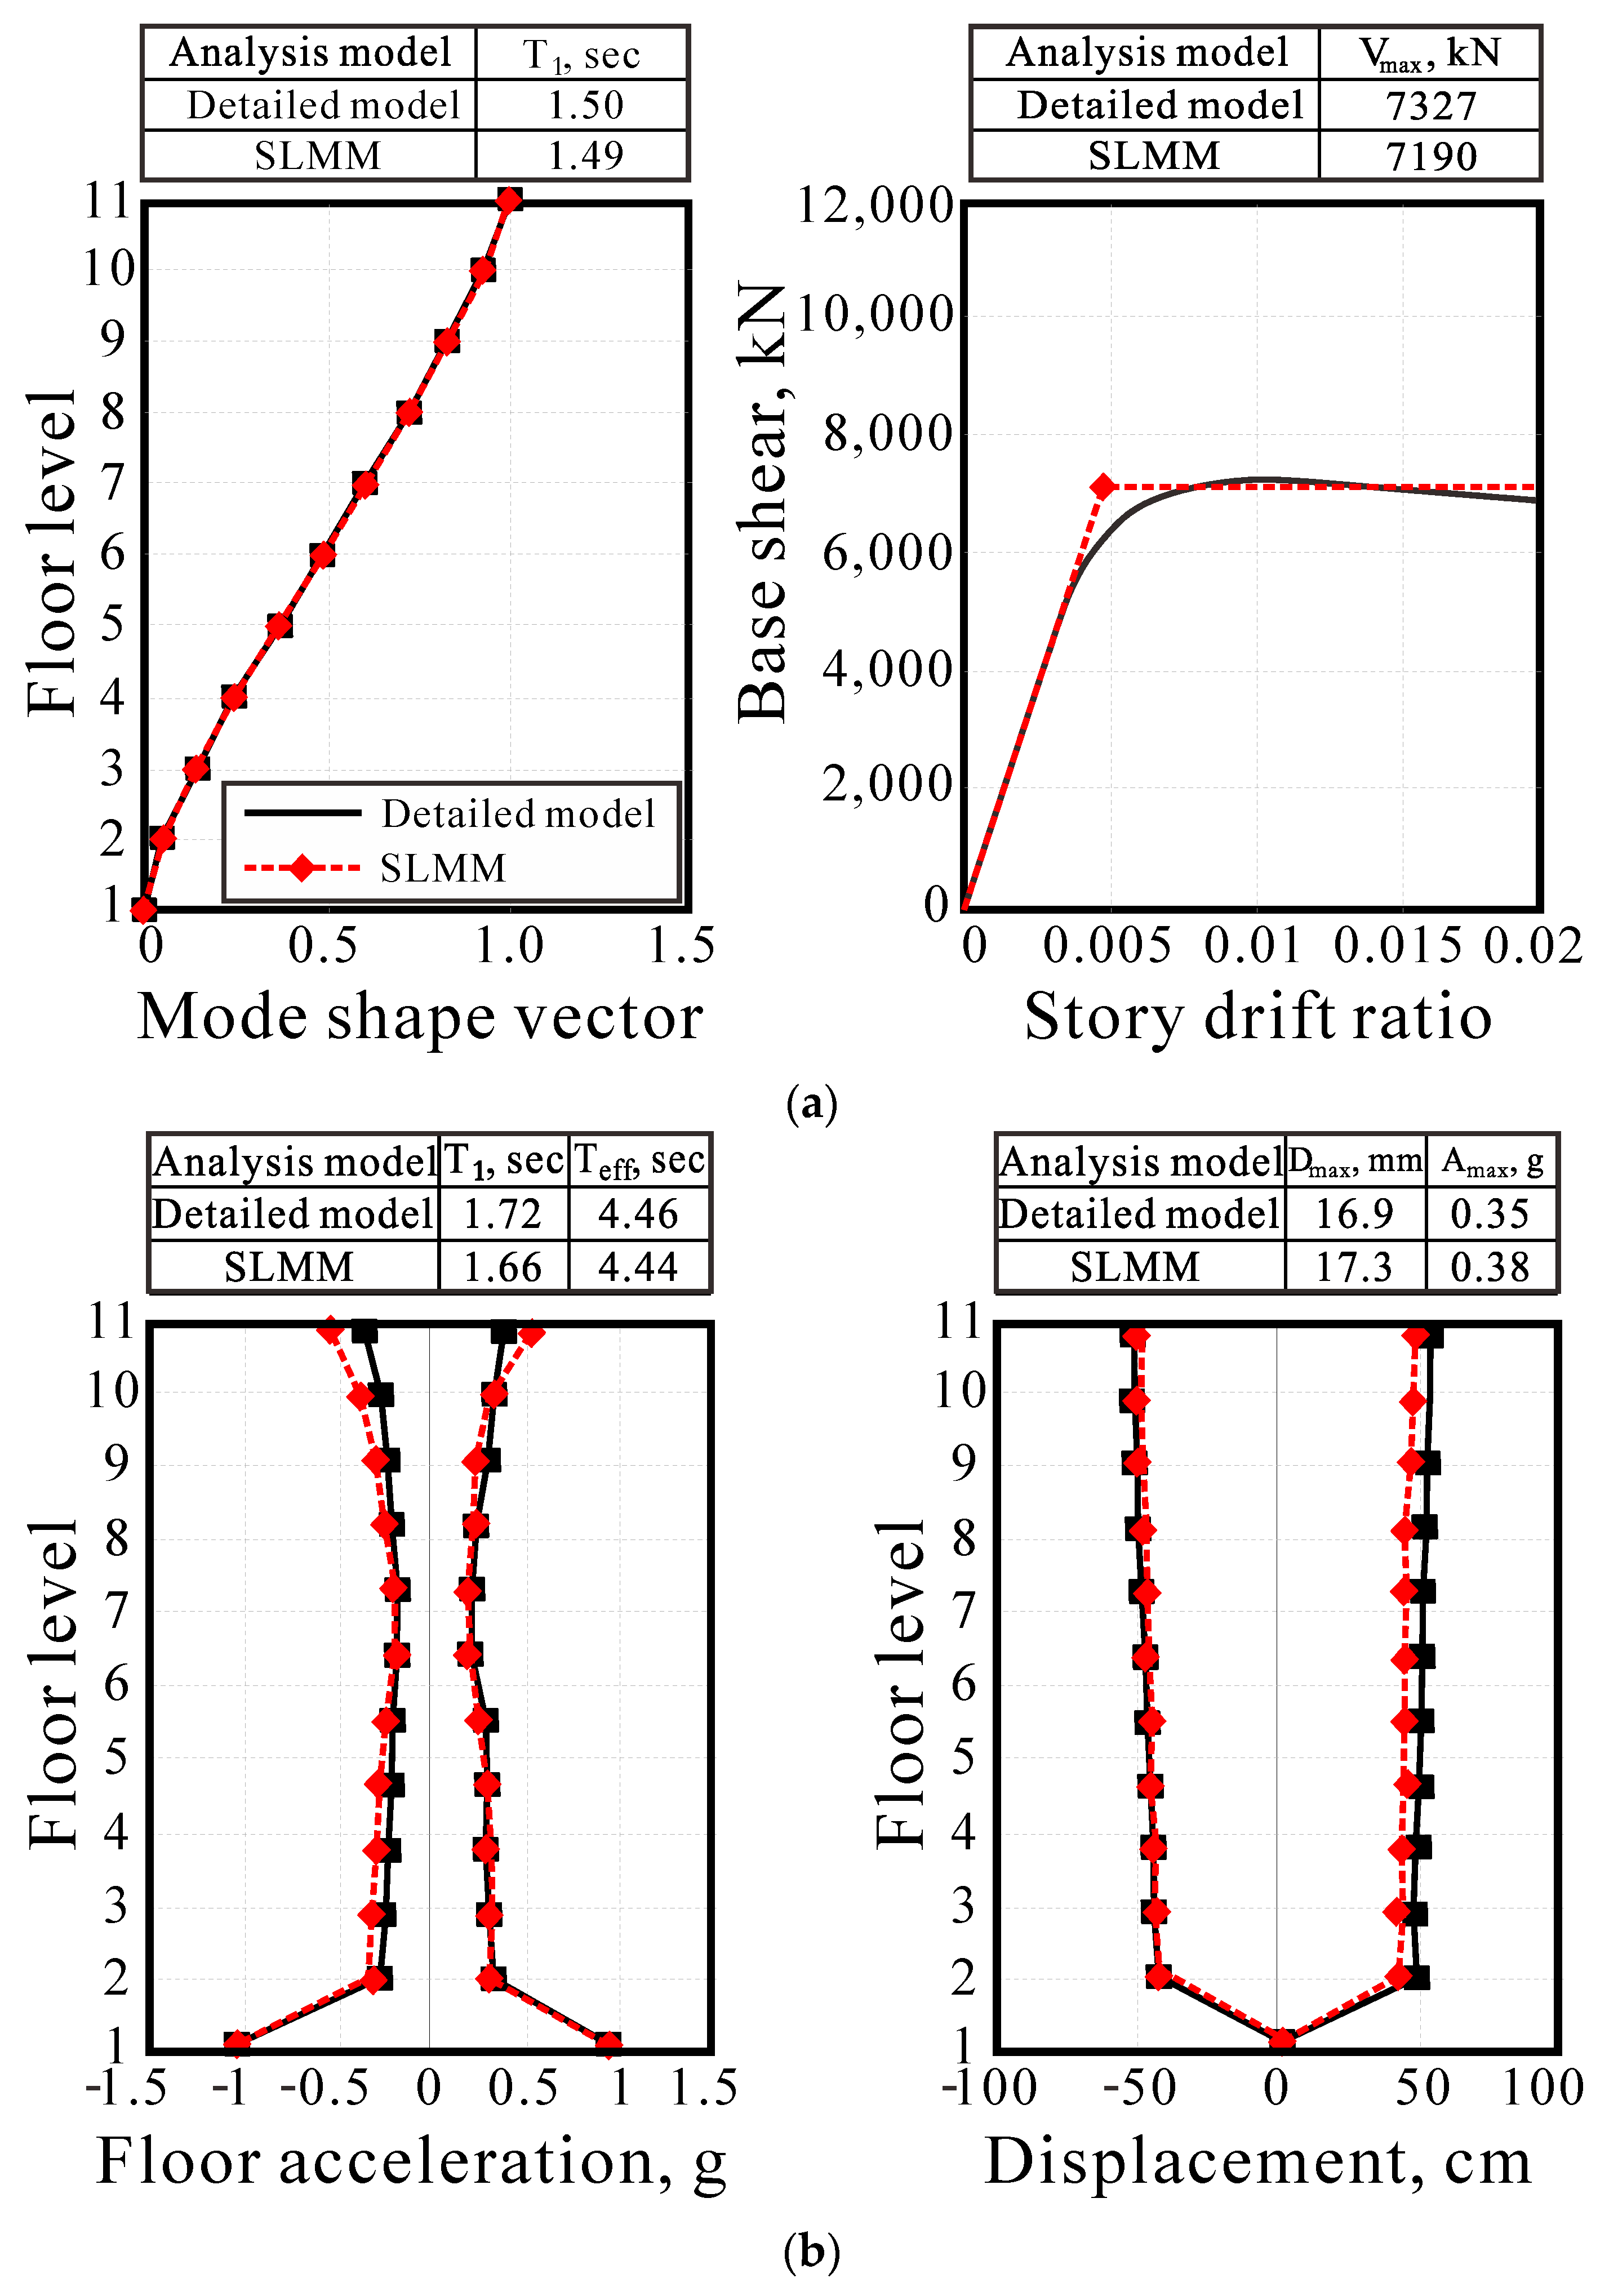
3.1. Analysis Models of Isolated Buildings
- (1)
- With a lateral load pattern corresponding to the yield displacement of the superstructure, δy is then obtained. Then, the yield displacement of the ith story, dyi, is calculated by multiplying the relative eigenvector {fi+1 − fi} and the value of δy.
- (2)
- The stiffness of spring elements, Ks,i, is determined by introducing the coefficient for modifying the stiffness, ρi to the seismic weight over relative eigenvector, Wi/{fi+1 − fi}. The value of ρi can be obtained throughout iterations by changing it until the difference between T1 and {fi} of the SLMM and those of the detailed model is sufficiently small.
- (3)
- The yield strength of spring elements, Qs,i is determined by multiplying Ks,i and dyi. Until the difference between the strength obtained from the SLMM and detailed model is sufficiently small, the Qs,i value is modified by introducing the coefficient for modifying the strength, γi.
3.2. Collapse Capacity Evaluation of the Prototype Isolated Buildings
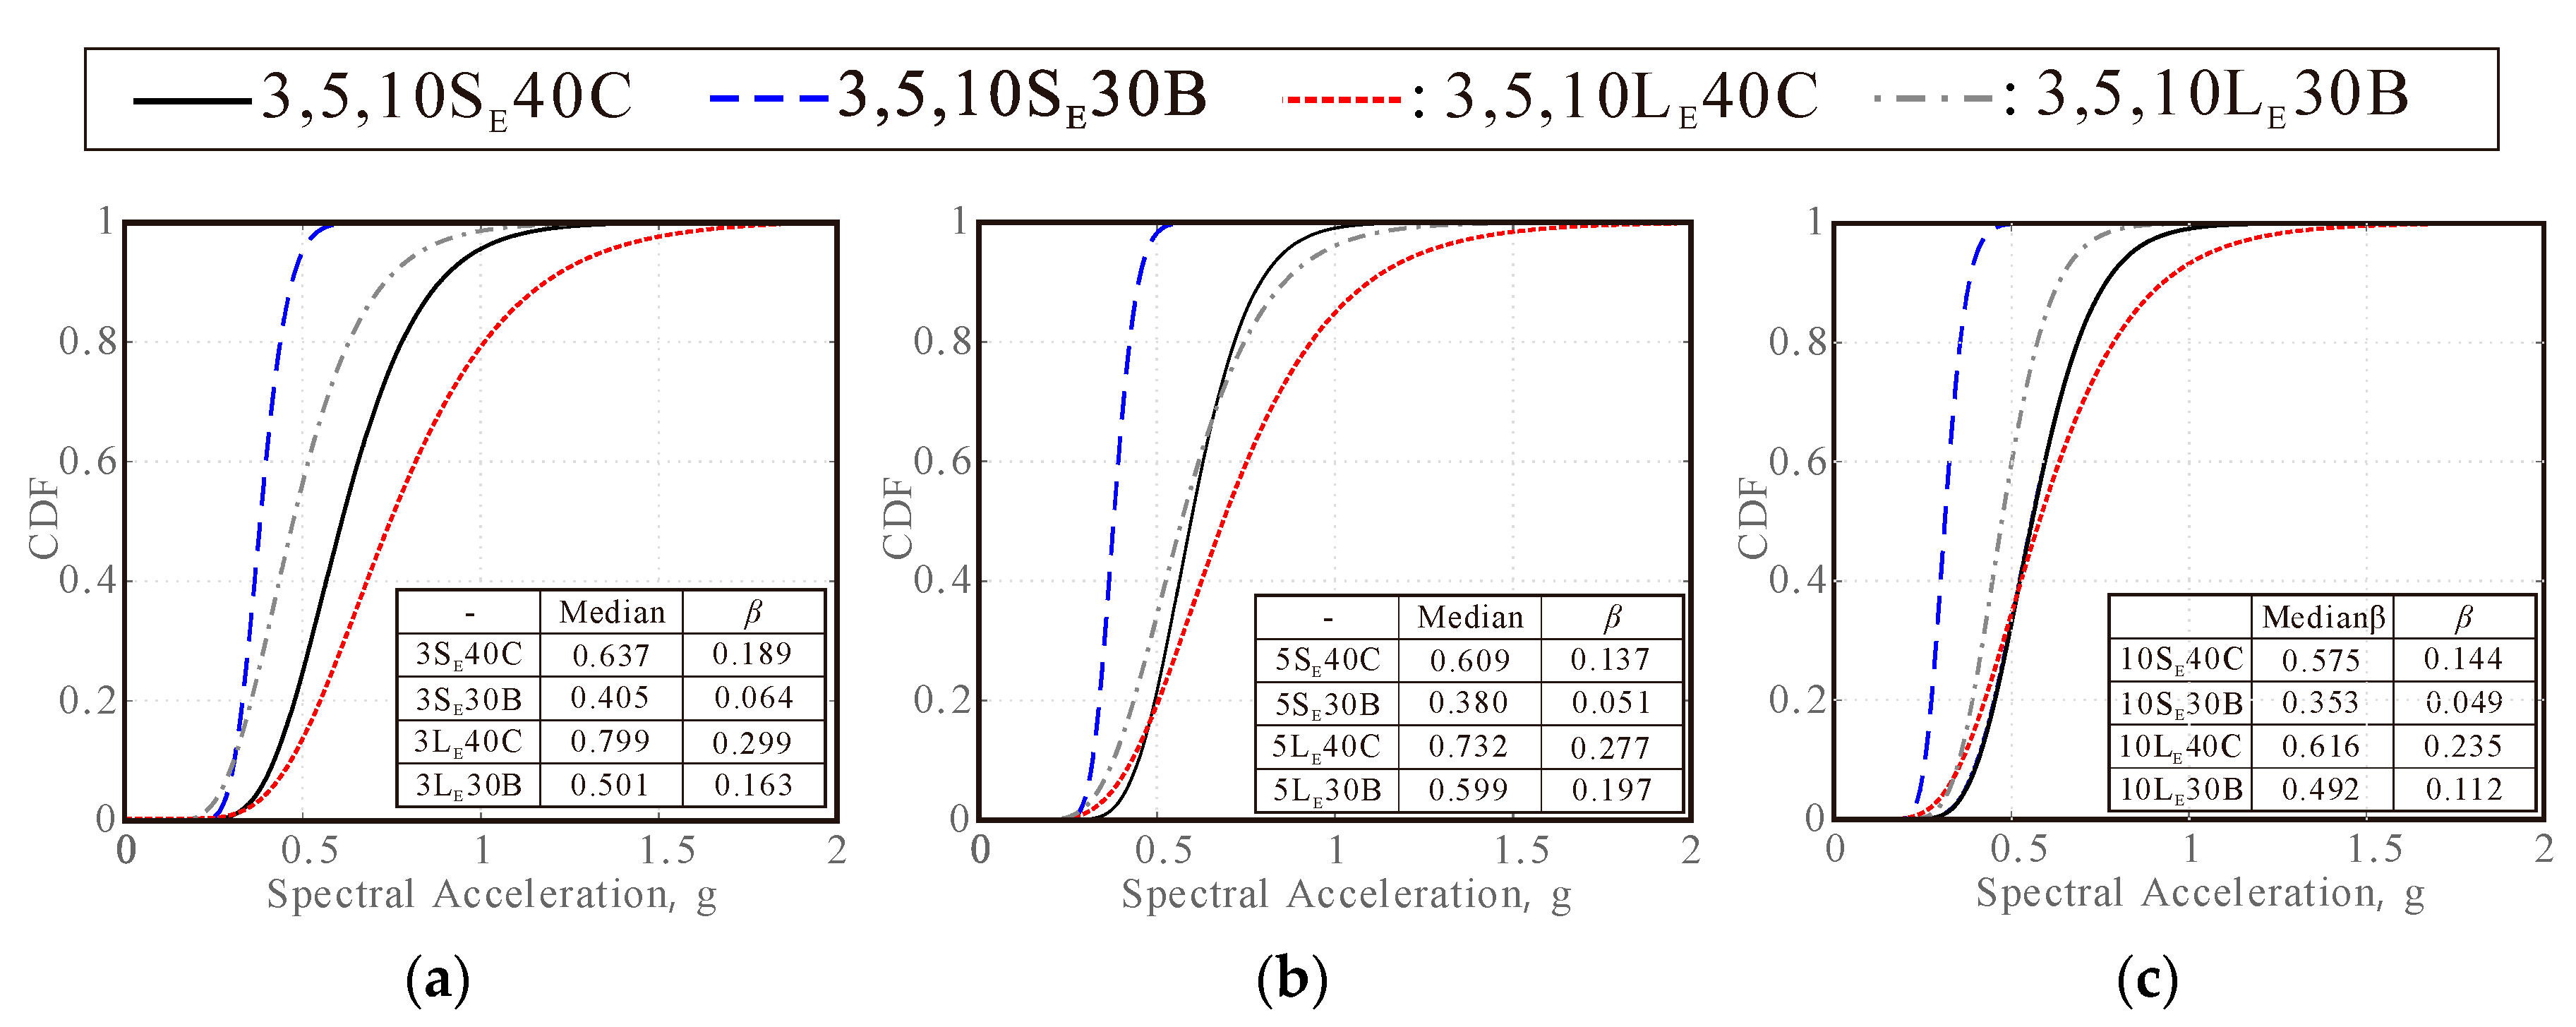
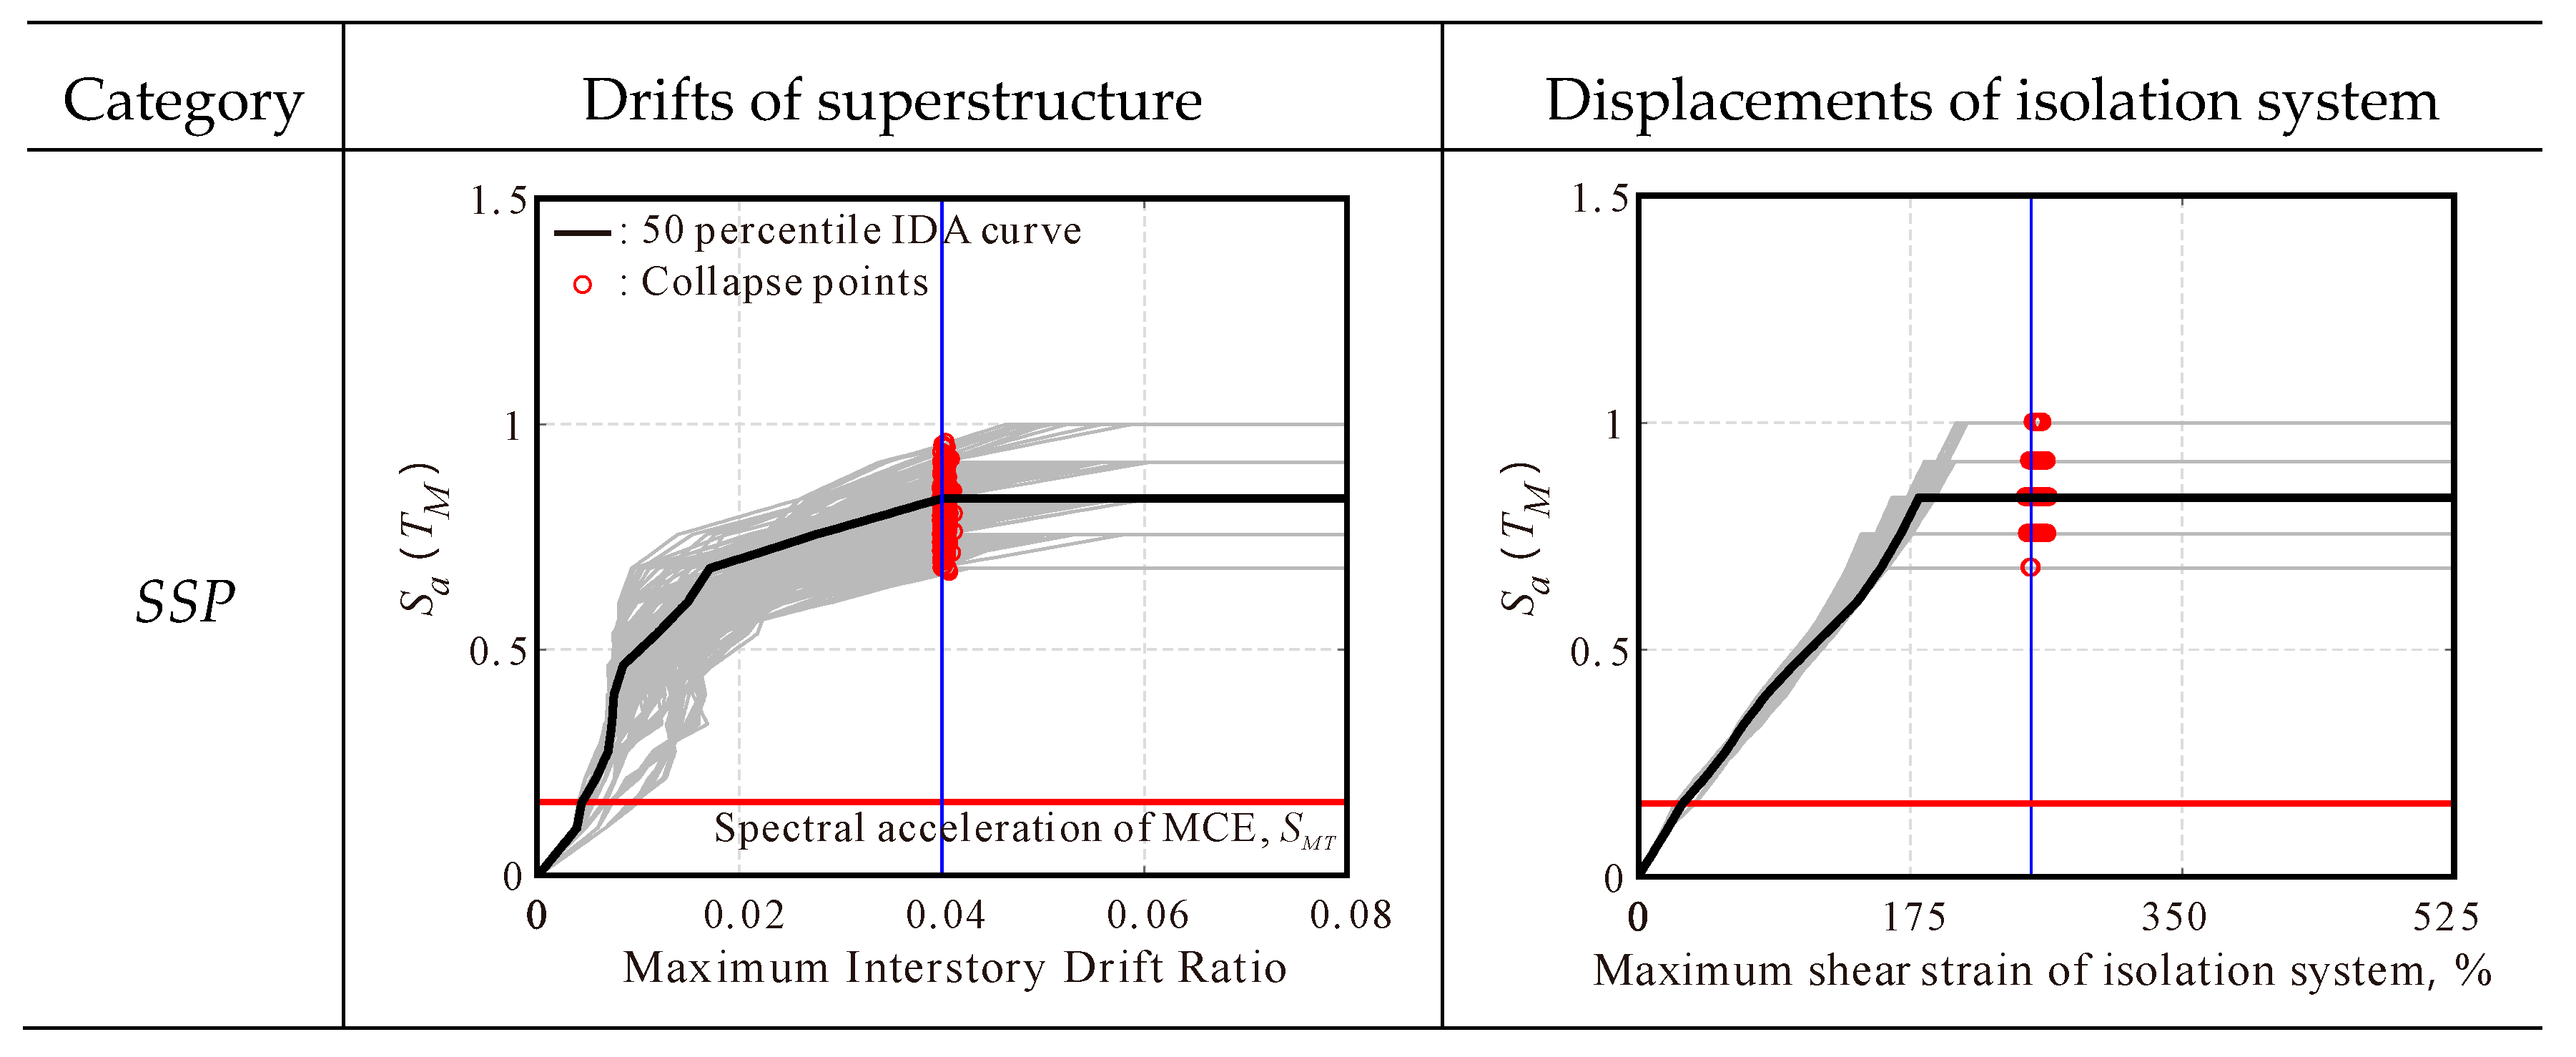
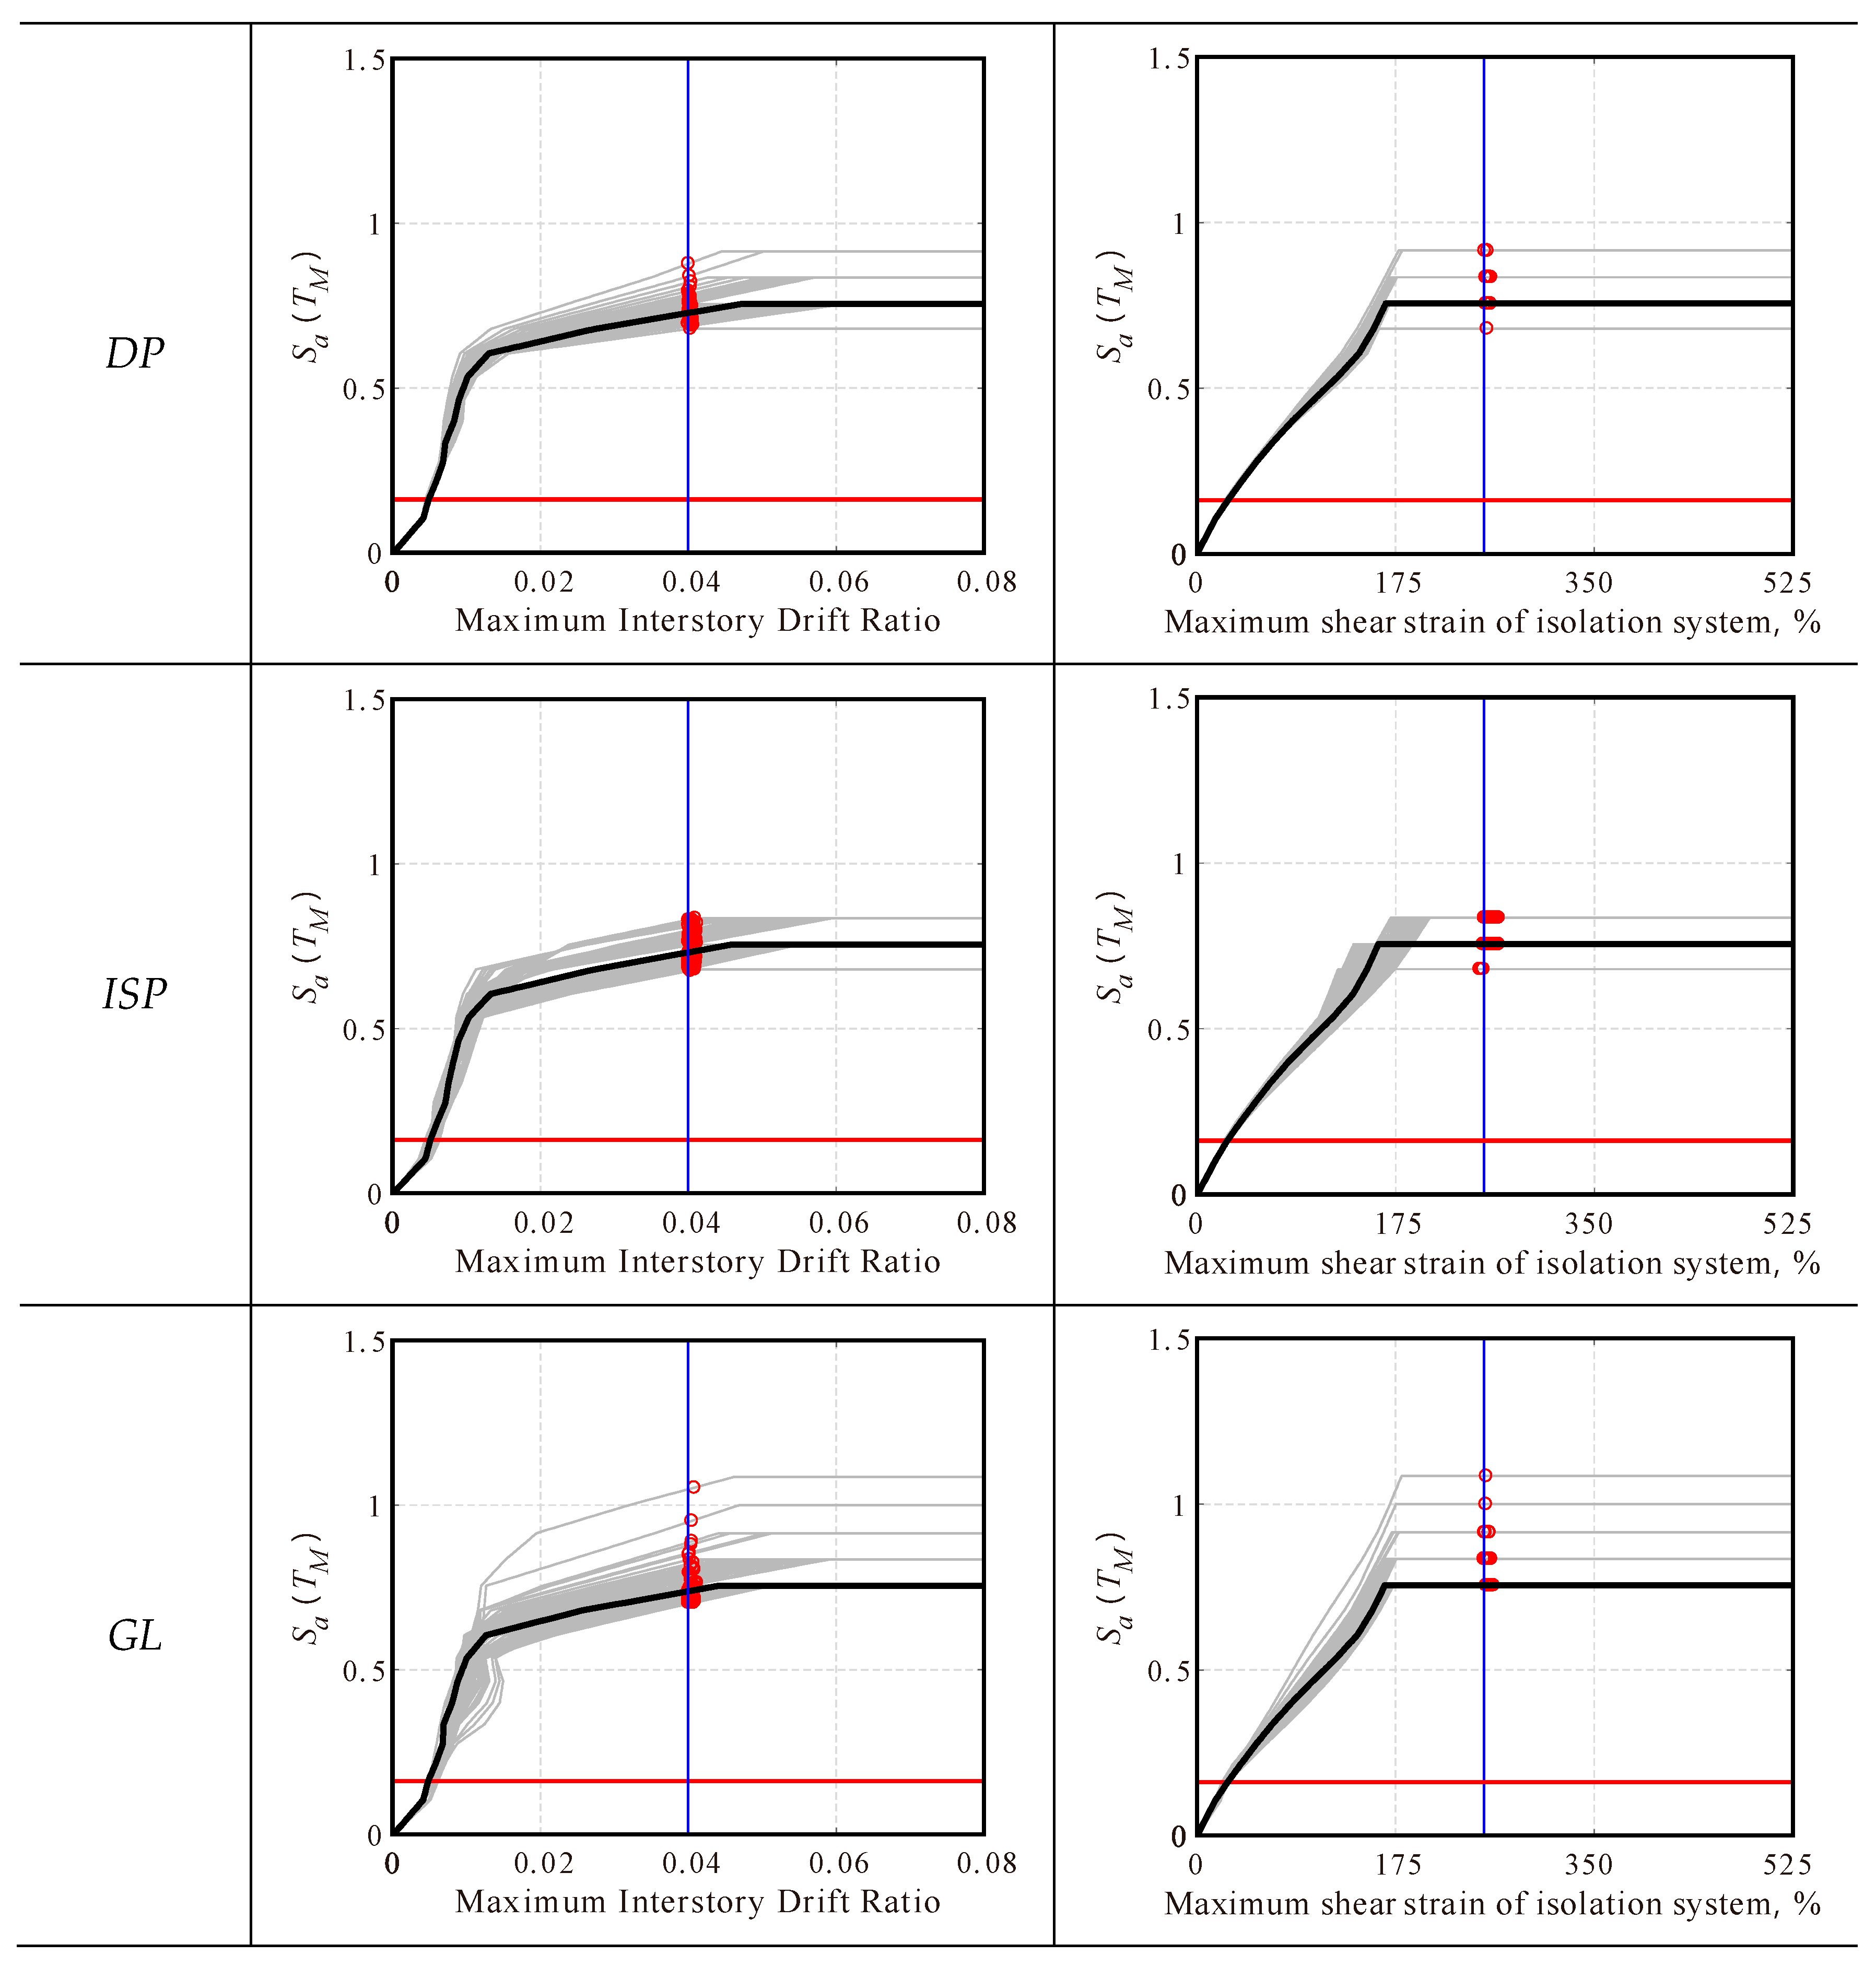
3.2.1. Results of Incremental Dynamic Analysis
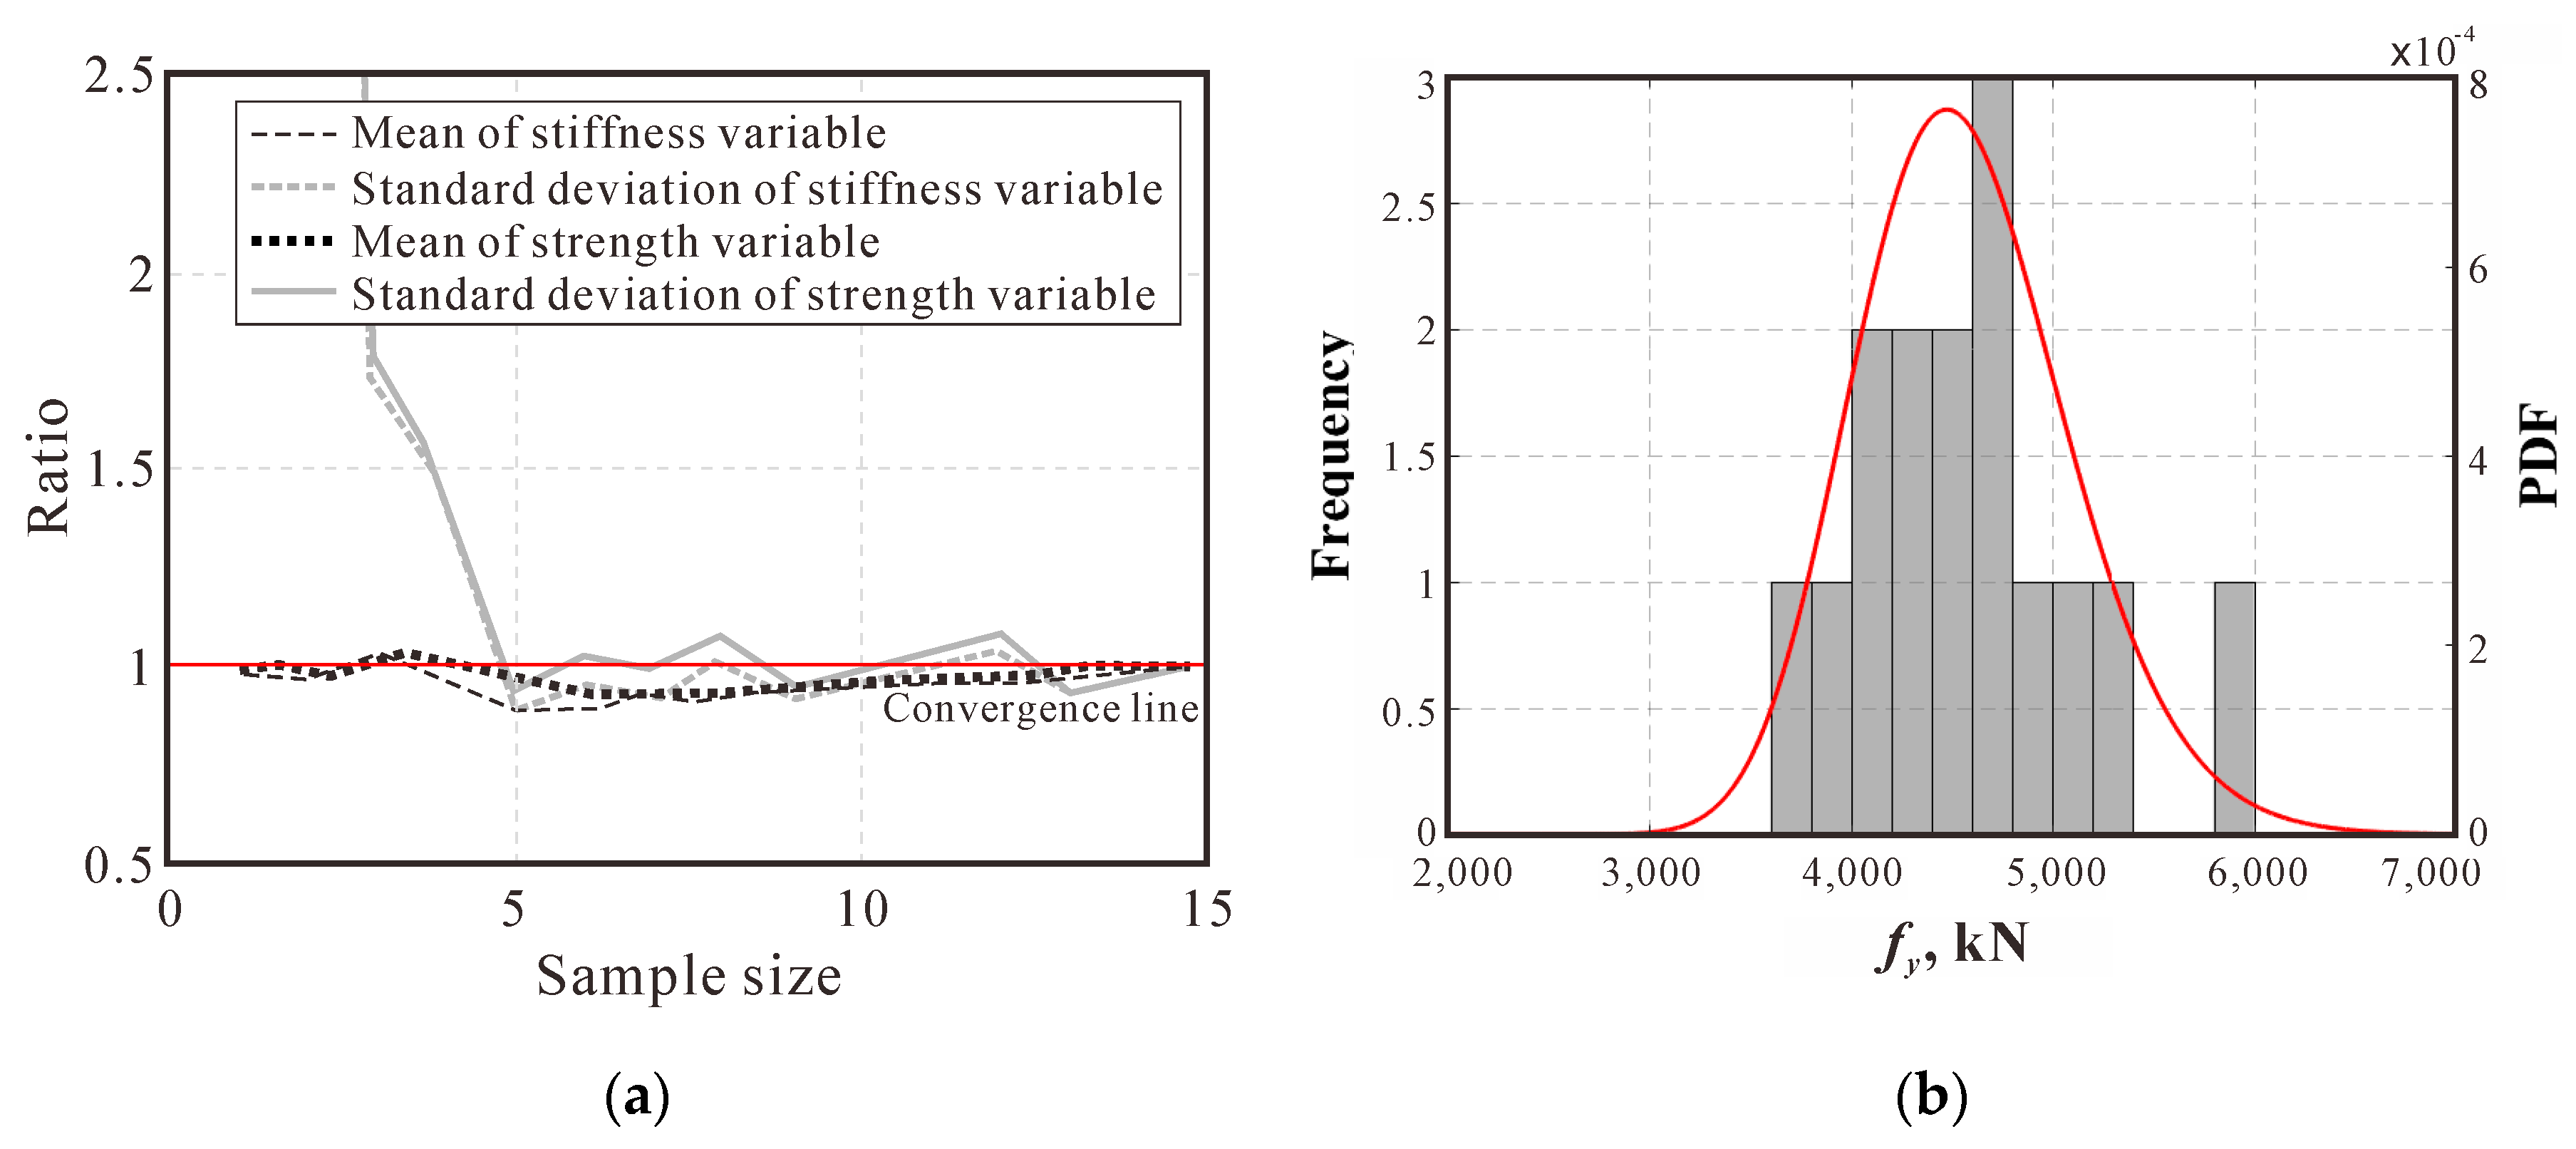
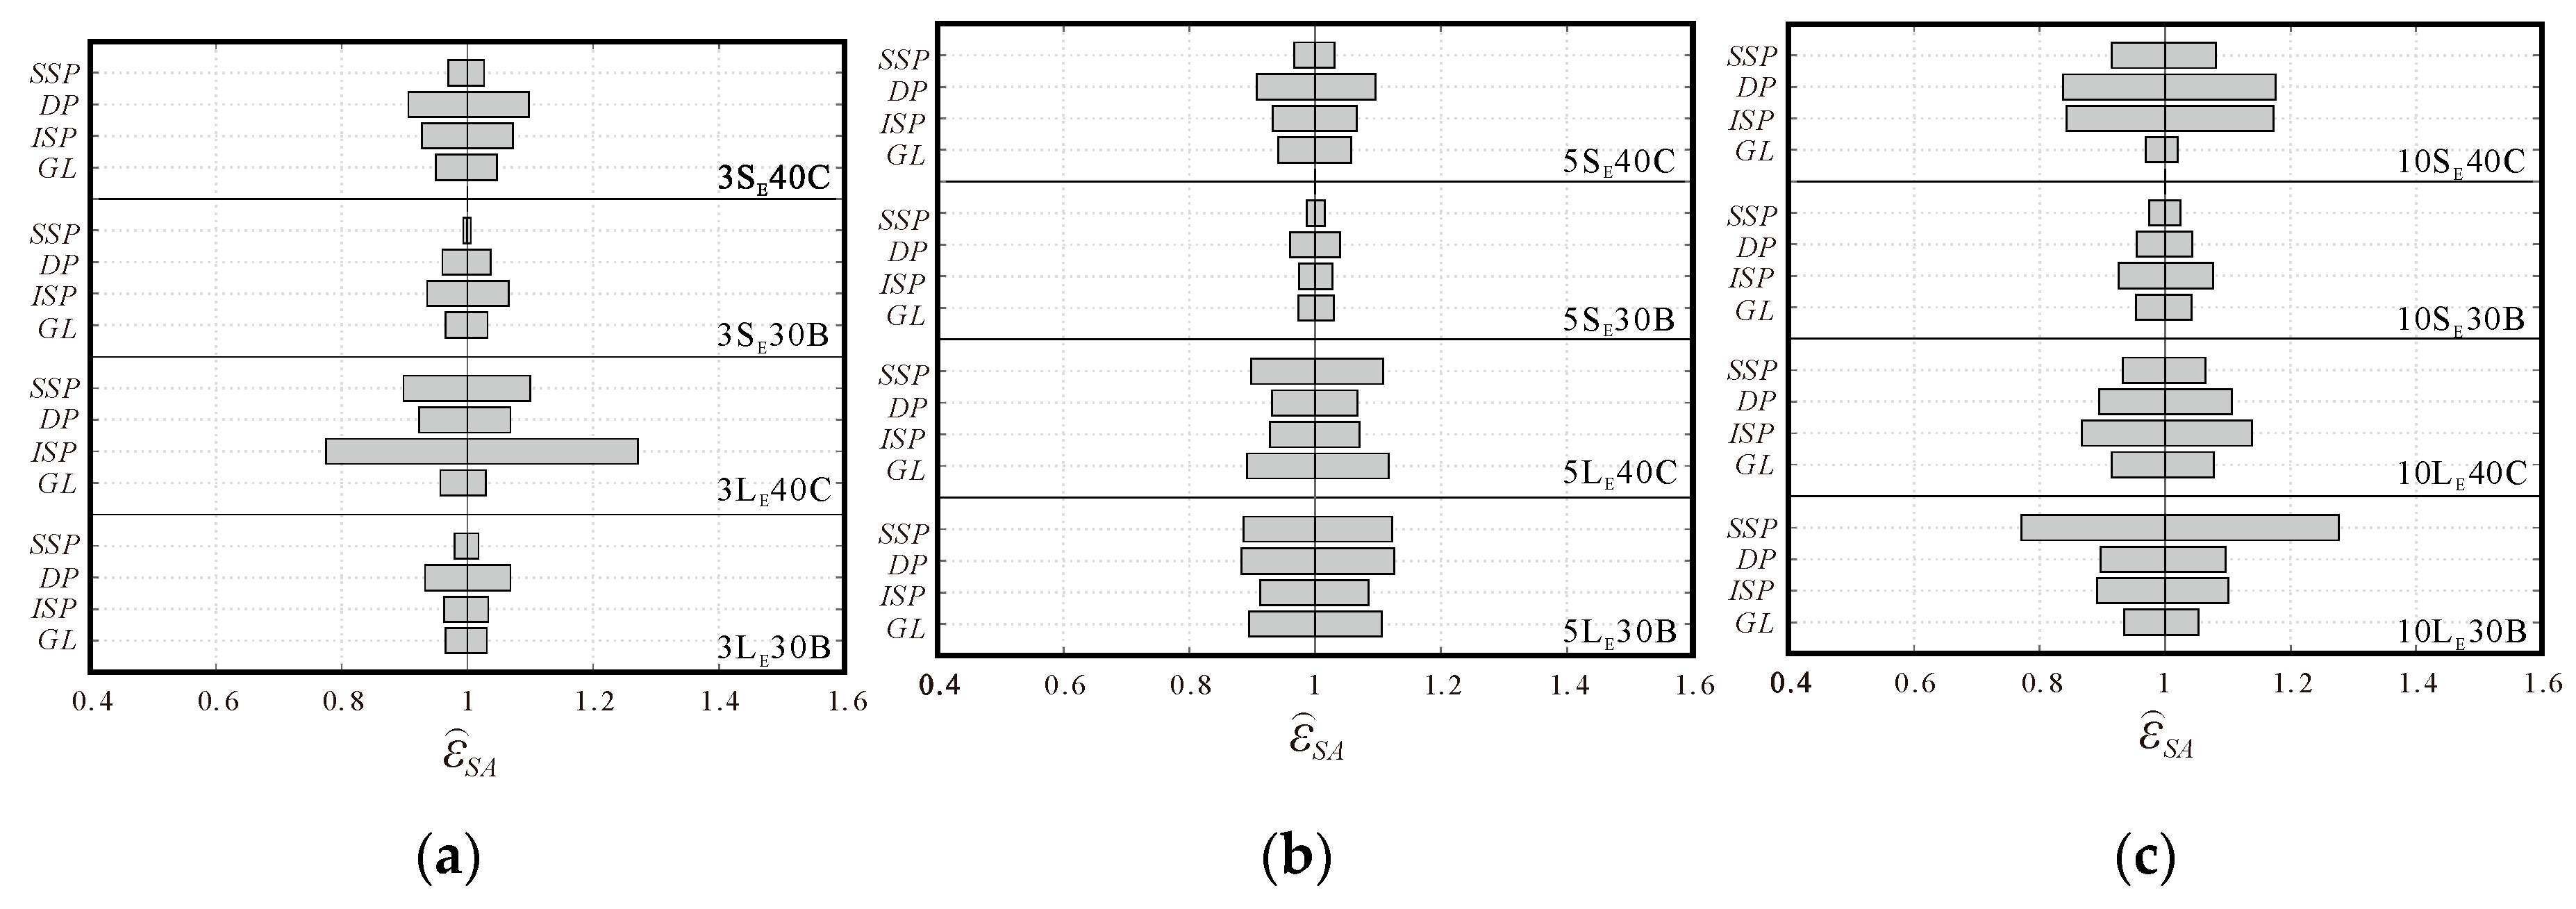
3.2.2. Assessment of Probabilistic Propagation of Modeling Uncertainty Sources Related to Isolated Buildings
4. Comparative Evaluation of Collapse Probability
4.1. Methodology to Evaluate Collapse Probability
- (1)
- Perform incremental dynamic analysis to obtain the collapse capacity defined as the spectral acceleration at the collapse under the jth ground motion;
- (2)
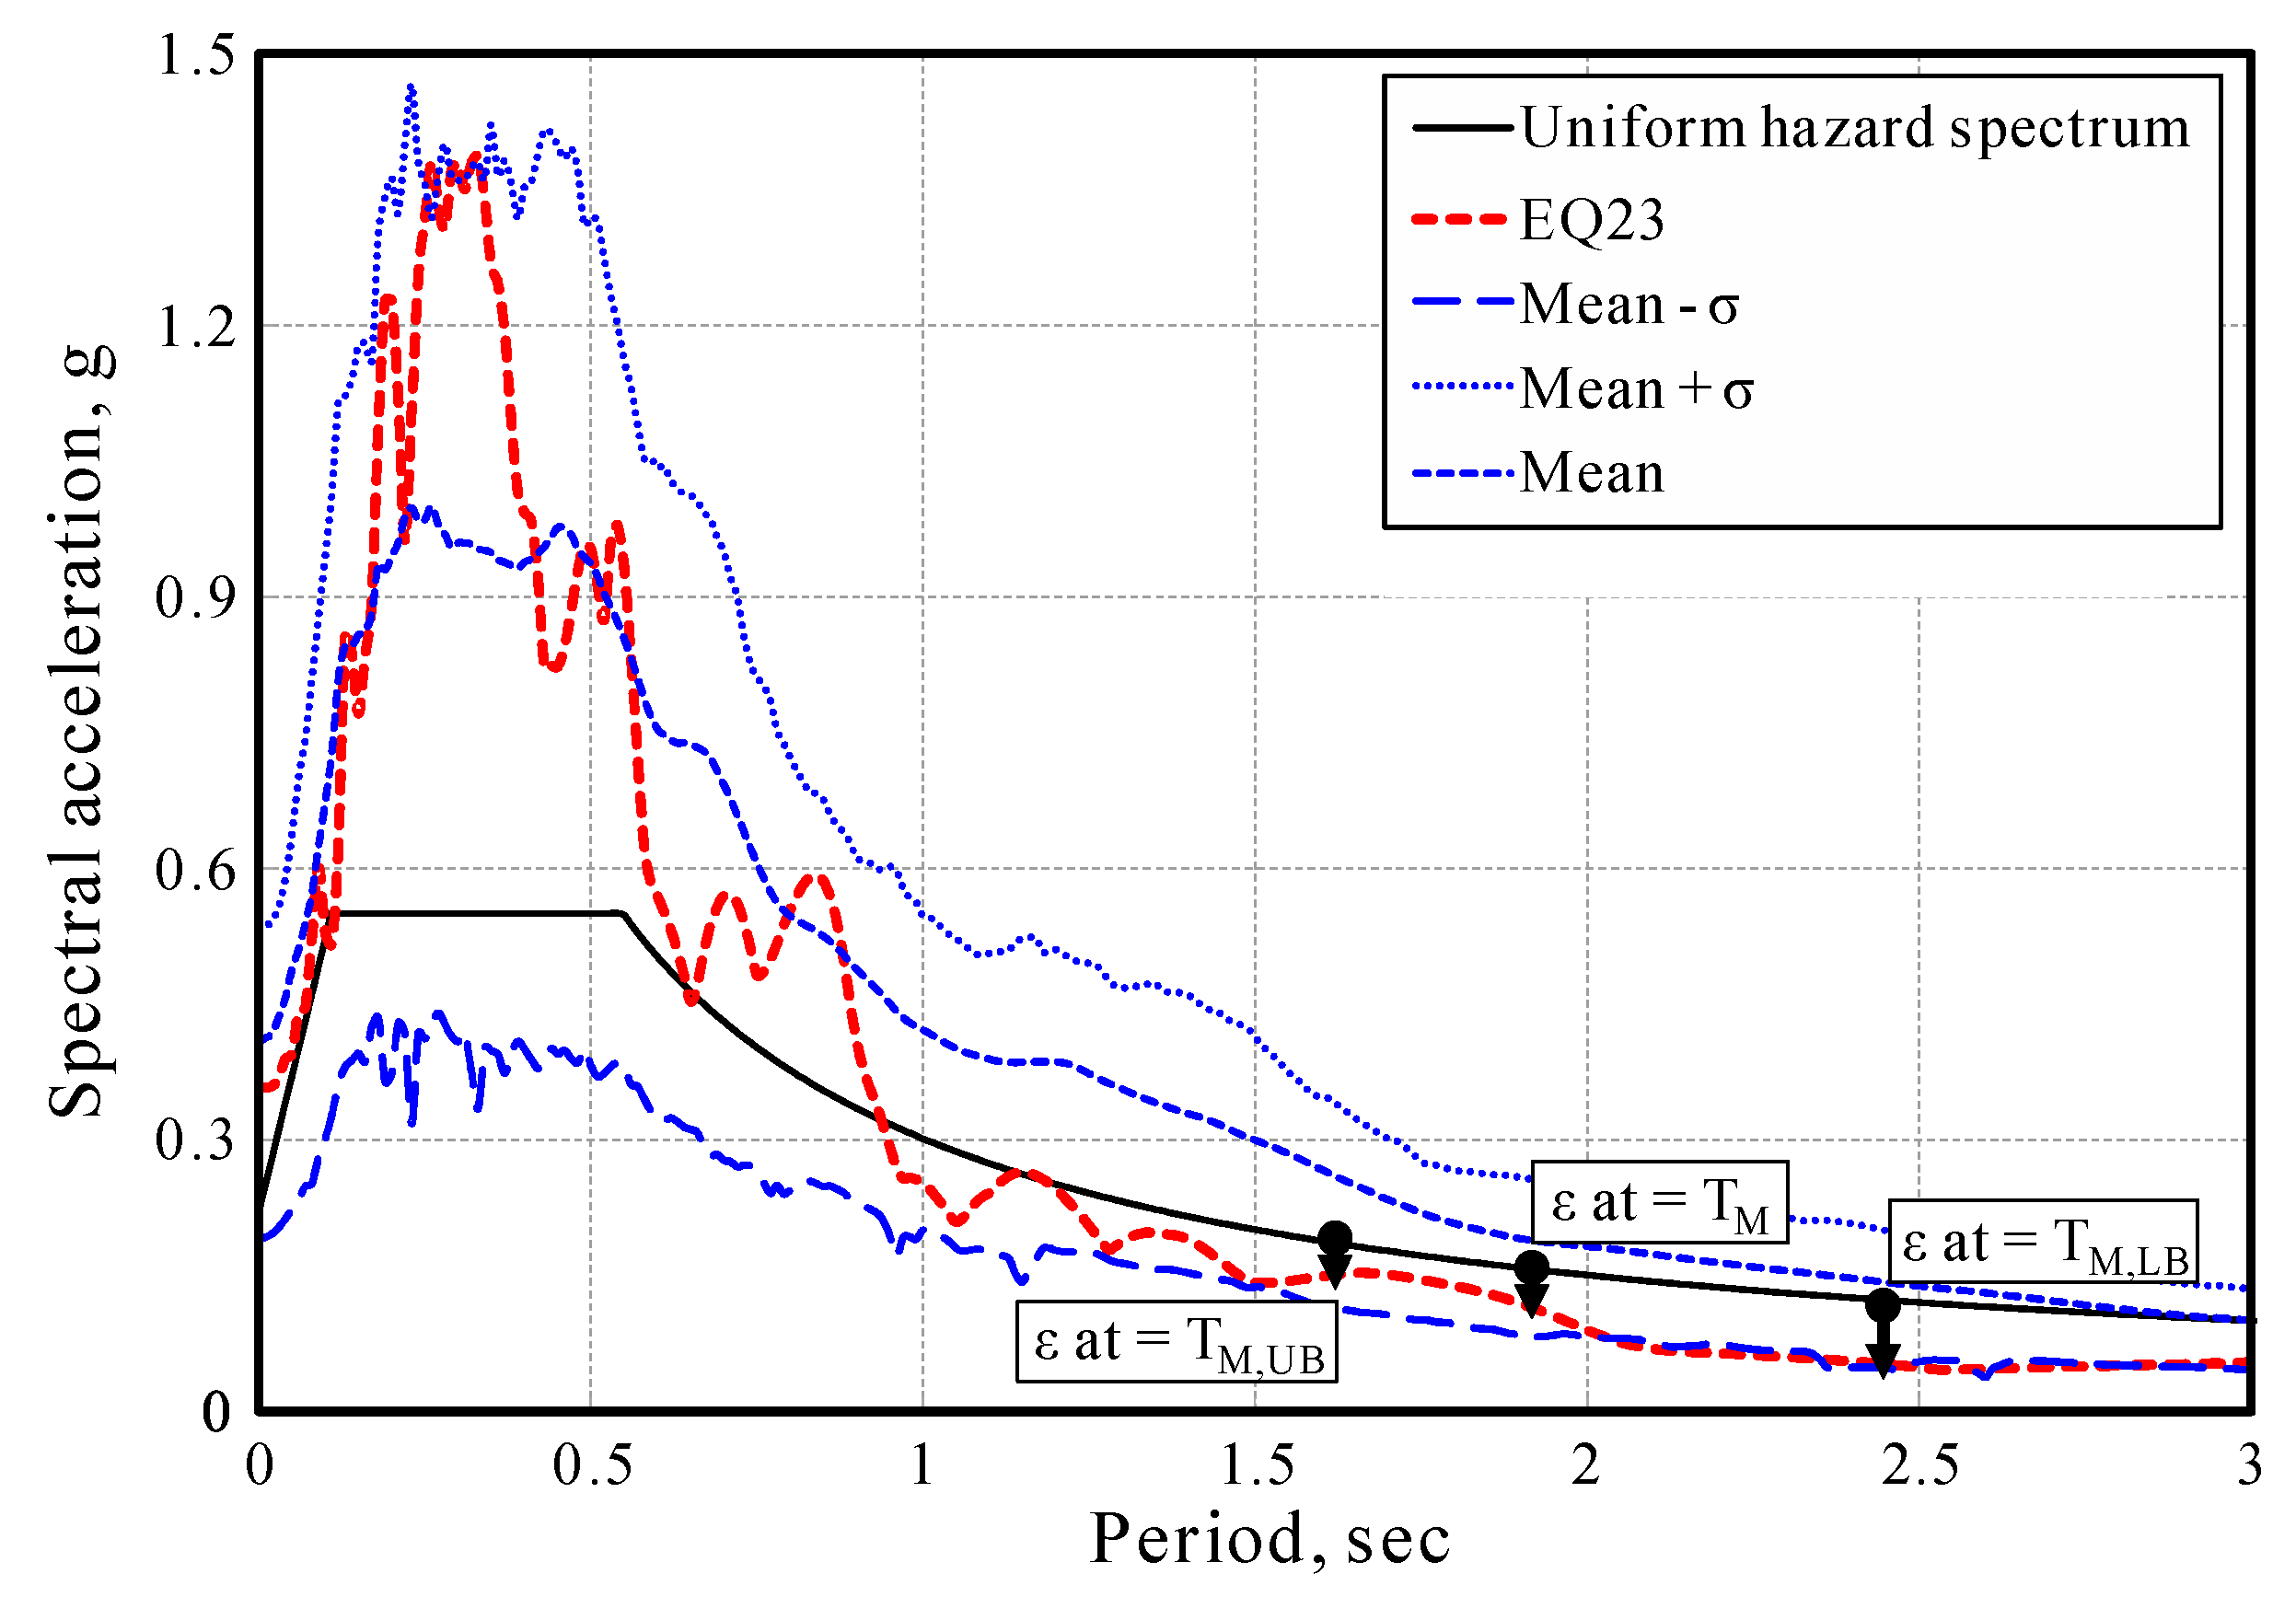
- Calculate at TM using Equation (1);
- (3)
- (4)
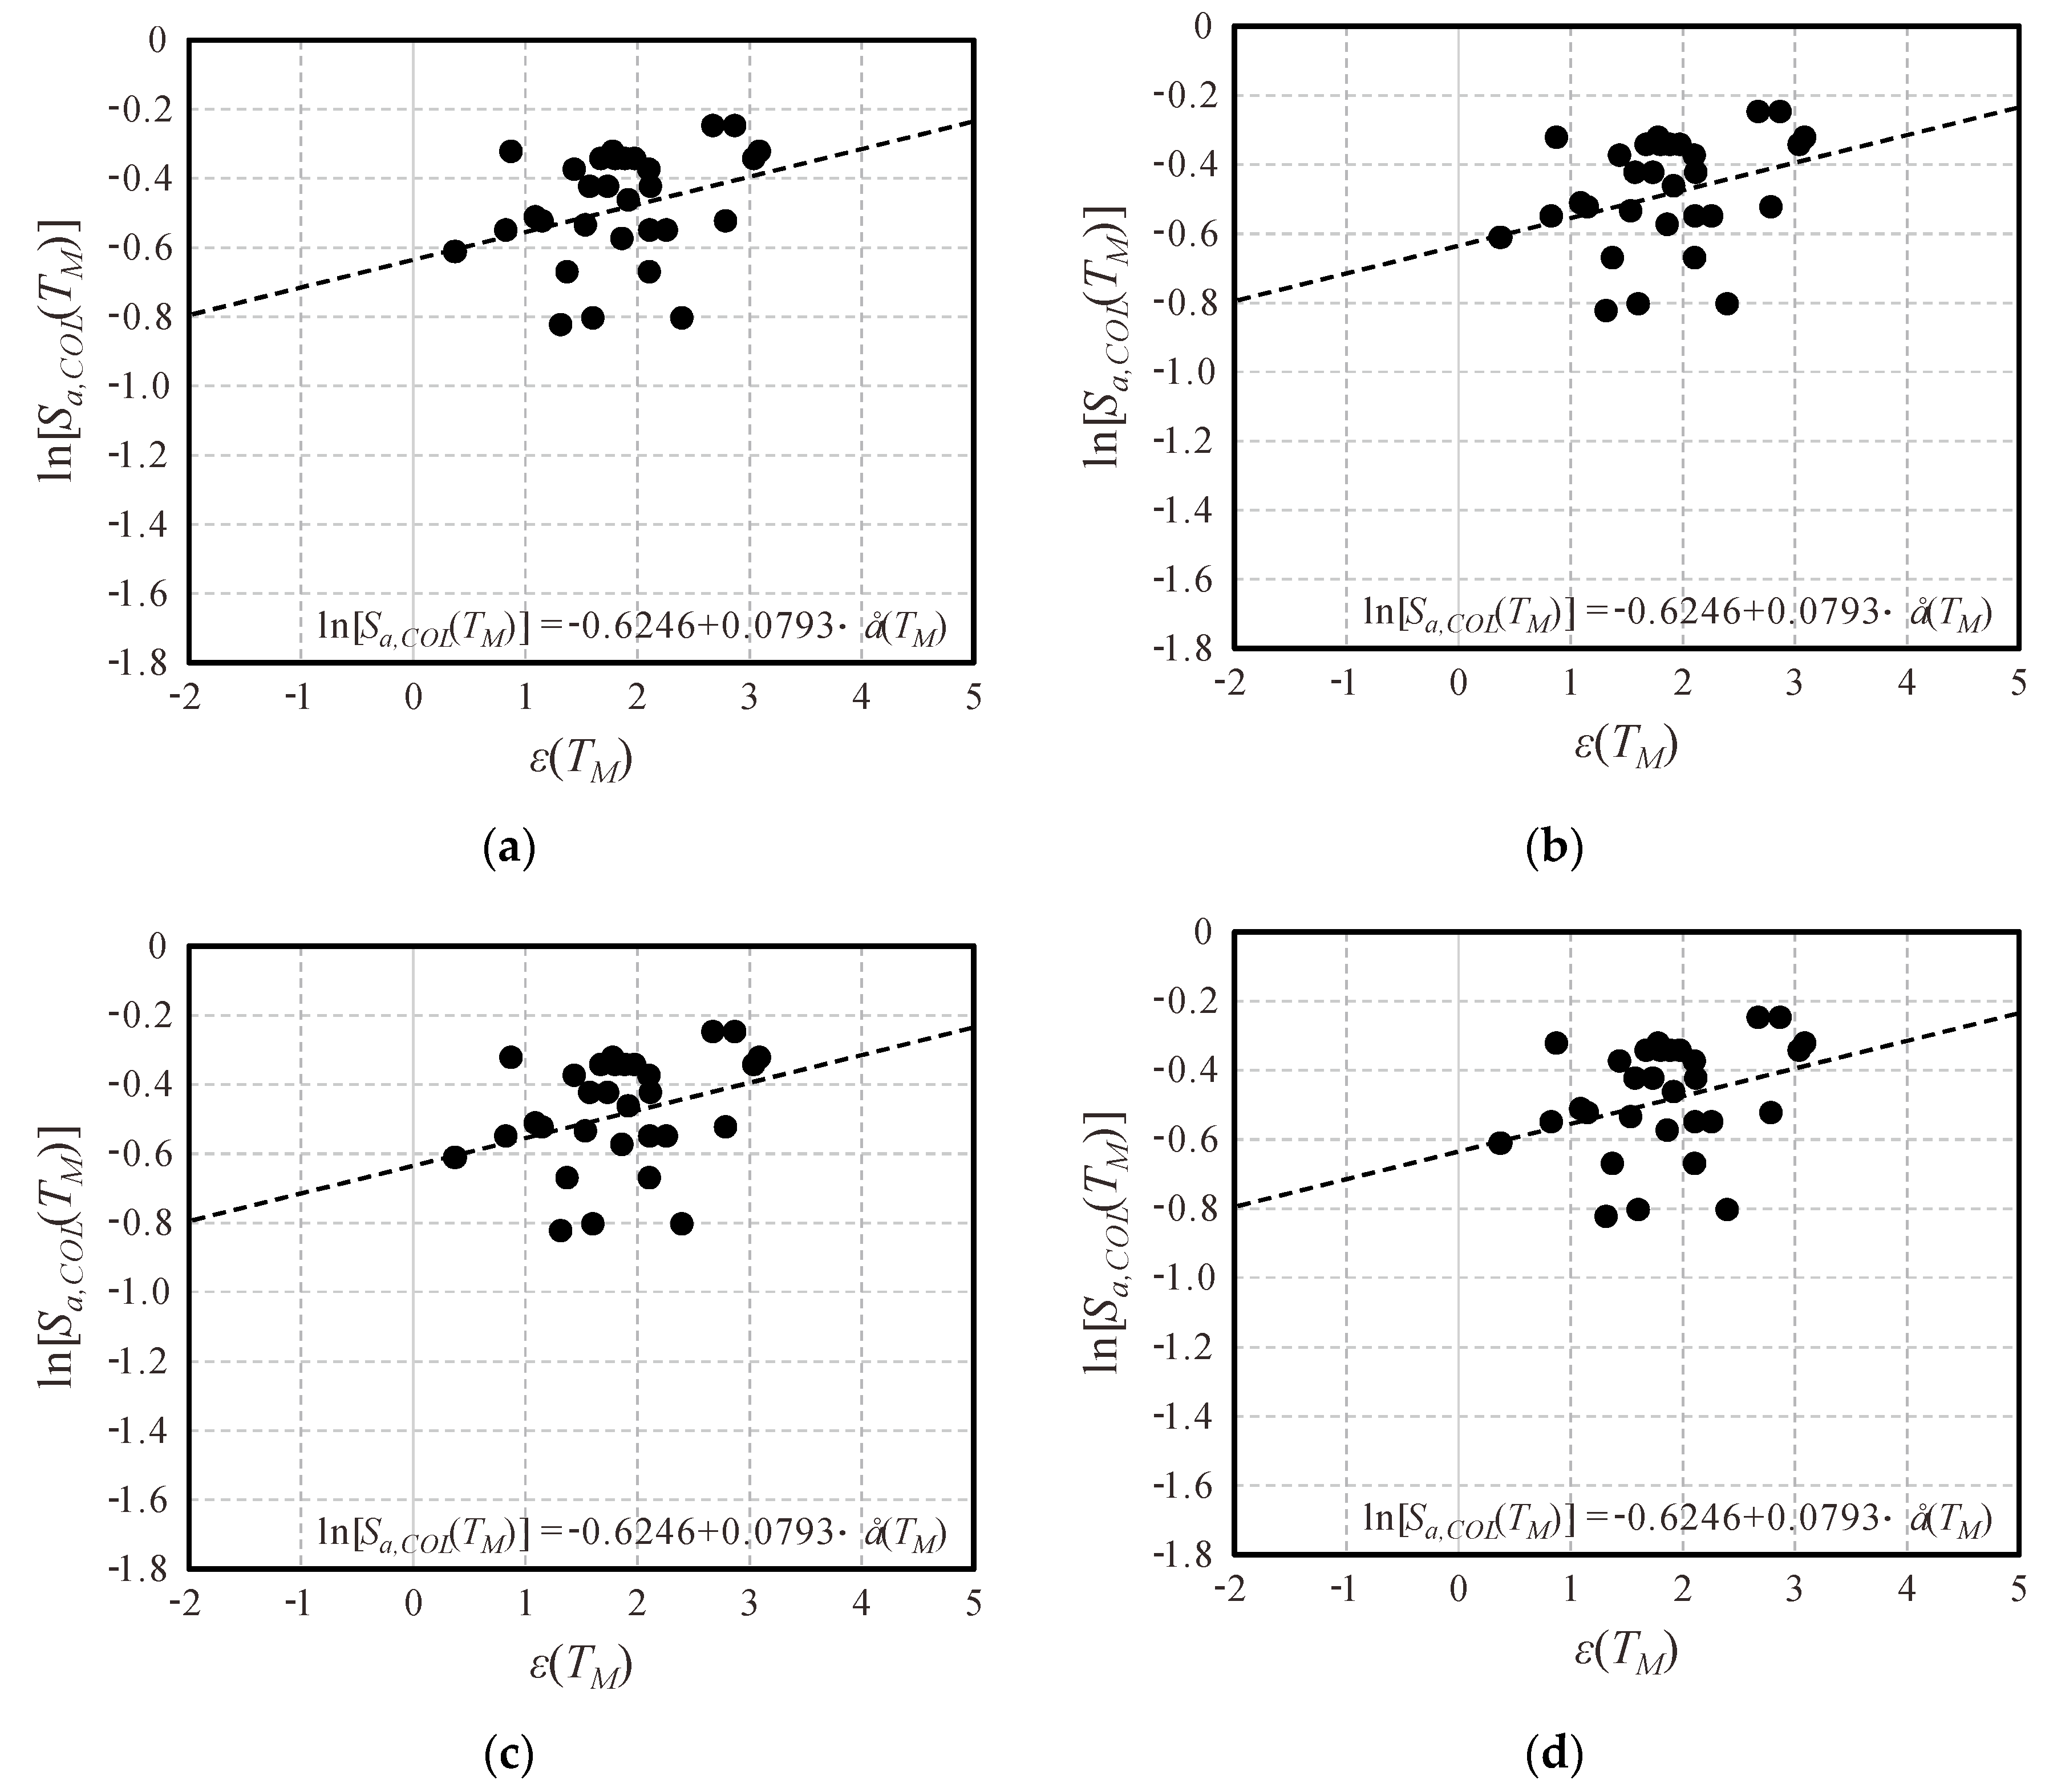
- Replace with in Equation (2) and obtain an adjusted median collapse capacity, :
- (5)
- Compute adjusted collapse margin ratios (ACMR) using the equation:
- (6)
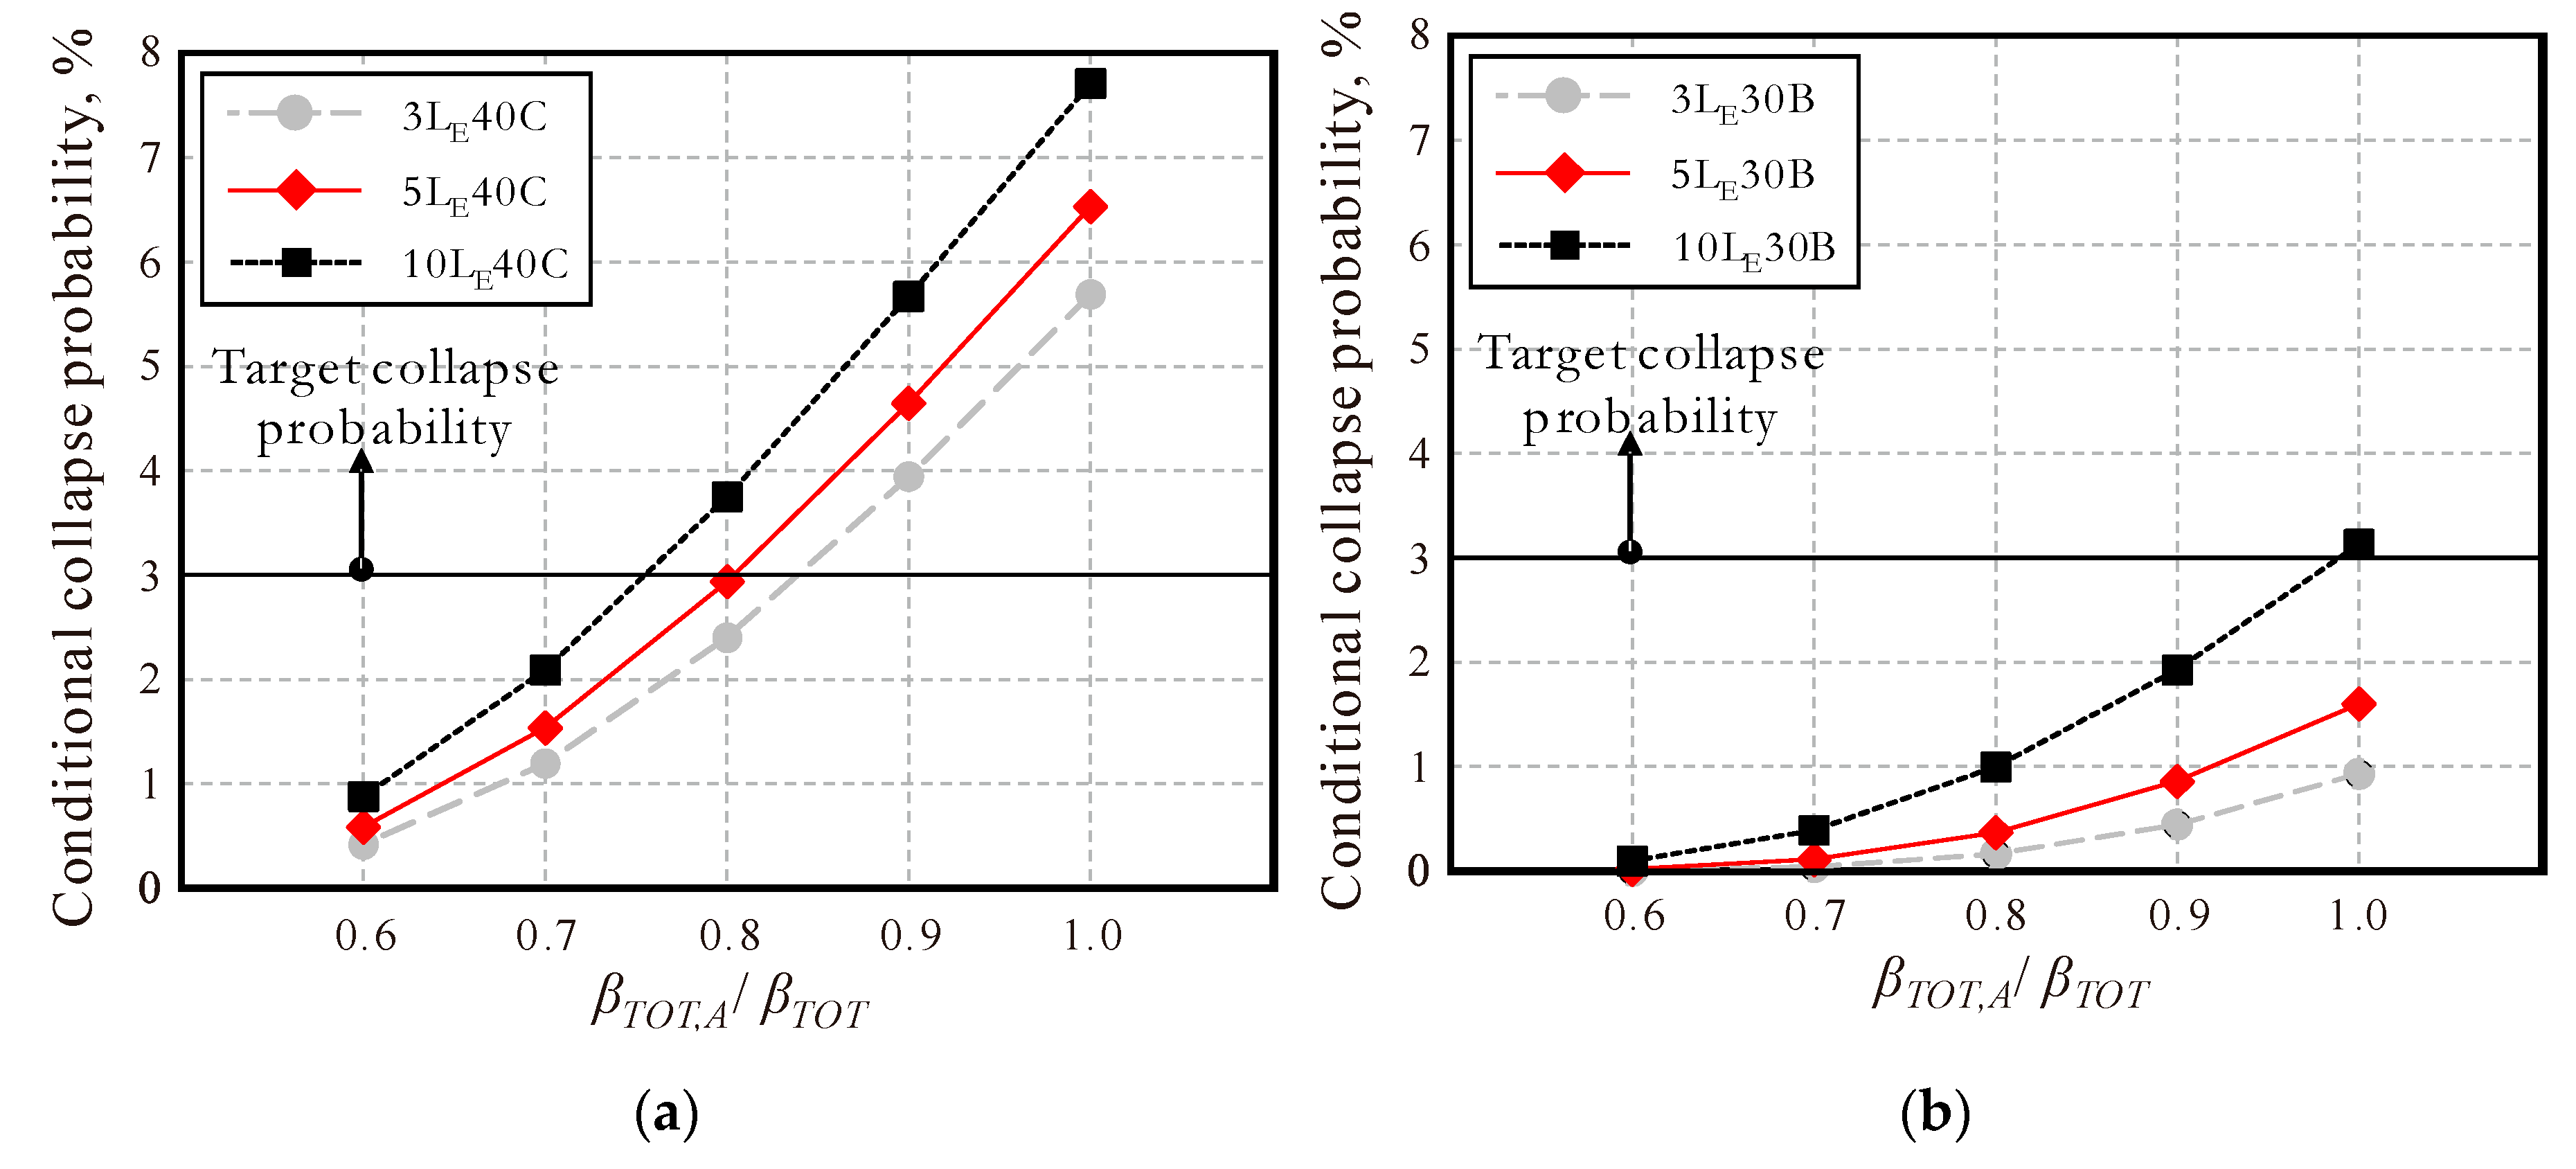
- Calculate the conditional probability of the collapse caused by MCEs, PCol,MCE using the equation:
4.2. Discussion on the Collapse Probability of Prototype Isolated Buildings
5. Conclusions
Author Contributions
Funding
Acknowledgments
Conflicts of Interest
References
- Skinner, R.I.; Robinson, W.H.; McVerry, G.H. An Introduction to Seismic Isolation; John Wiley & Sons Inc.: New York, NY, USA, 1993. [Google Scholar]
- Naeim, F.; Kelly, J.M. Design of Seismic Isolated Structures: From Theory to Practice; John Wiley and Sons Inc.: New York, NY, USA, 1999. [Google Scholar]
- Jangid, R.S.; Datta, T.K. Seismic behavior of base isolated building: A state-of-the-art review. Struct. Build. 1995, 110, 186–203. [Google Scholar] [CrossRef]
- Lin, A.N.; Shenton, H.W. Seismic performance of fixed-base and base-isolated steel frames. J. Struct. Eng. 1992, 119, 921–941. [Google Scholar] [CrossRef]
- Furukawa, S.; Sato, E.; Shi, Y.; Becker, T.; Nakashima, M. Full-scale shaking table test of a base-isolated medical facility subjected to vertical motions. Earthq. Eng. Struct. Dynam. 2013, 42, 1931–1949. [Google Scholar] [CrossRef]
- Nagarajaiah, S.; Reinhorn, A.M.; Constantinou, M.C. Torsion in base-isolated structures with elastomeric isolation systems. J. Struct. Eng. 1993, 119, 2932–2951. [Google Scholar] [CrossRef]
- Zhou, Z.; Wong, J.; Mahin, S. Potentiality of using vertical and three-dimensional isolation systems in nuclear structures. Nucl. Eng. Technol. 2016, 48, 1237–1251. [Google Scholar] [CrossRef] [Green Version]
- Katsaras, C.; Panagiotakos, T.; Kolias, B. Evaluation of current code requirements for displacement restoring capability of seismic isolation systems. In Lessloss Risk Mitigation for Earthquakes and Landslides; Project No: GOCE-CT-2003-505488; Pavia University: Pavia, Italy, 2006. [Google Scholar]
- Mazza, F. Effects of the long-term behaviour of isolation devices on the seismic response of base-isolated buildings. Struct. Control Health Monit. 2019, 26, e2331. [Google Scholar] [CrossRef]
- Kumar, M.; Whittaker, A.S.; Constantinou, M.C. An advanced numerical model of elastomeric seismic isolation bearings. Earthq. Eng. Struct. Dyn. 2014, 43, 1955–1974. [Google Scholar] [CrossRef]
- Islam, A.B.M.S.; Ahmad, S.I.; Jameel, M.; Zamin, M.J. Seismic base isolating for buildings in regions of low to moderate seismicity: Practical alternative design. Pract. Period. Struct. Des. Constr. 2012, 17, 13–20. [Google Scholar] [CrossRef] [Green Version]
- Martelli, A.; Forni, M. Seismic isolation of civil buildings in Europe. Prog. Struct. Eng. Mater. 1998, 1, 286–294. [Google Scholar] [CrossRef]
- Shin, D.H.; Kim, H.J. Influence of the lateral restoring force of isolation system to the seismic performance of isolated buildings in low-to-moderate seismicity regions. Soil Dyn. Earthq. Eng. 2019, 125, 105706. [Google Scholar] [CrossRef]
- ASCE. Minimum Design Loads for Buildings and Other Structures: ASCE/SEI 7; American Society of Civil Engineers: Reston, VA, USA, 2016. [Google Scholar]
- AIK. Korean Building Code: KBC2016; Architectural Institute of Korea: Seoul, Korea, 2016. [Google Scholar]
- Krawinkler, H.; Zaraian, F.; Lignos, D.G.; Ibarra, L.F. Significance of modelling deterioration in structural components for predicting the collapse potential of structures under earthquake excitations. In Advances in Performance-Based Earthquake Engineering. Geotechnical, Geological and Earthquake Engineering; Springer: Dordrecht, The Netherlands, 2010. [Google Scholar]
- FEMA. Quantification of Building Seismic Performance Factors: FEMA P695; Federal Emergency Management Agency: Washington, DC, USA, 2009.
- Parsaeimaram, M.; Fang, C.; Luo, X.; Shaya, C. Seismic performance evaluation of double-skin semi-base-isolated building using incremental dynamic analysis. Adv. Civ. Eng. 2018, 2018, 2747836. [Google Scholar] [CrossRef]
- Nakazawa, N.; Kishiki, S.; Qu, Z.; Miyoshi, A.; Wada, A. Fundamental study on probabilistic evaluation of the ultimate state of base isolated structures. In Proceedings of the 8CUEE Conference Proceedings, 8th International Conference on Urban Earthquake Engineering, Tokyo, Japan, 7–8 March 2011. [Google Scholar]
- Erduran, E.; Dao, N.D.; Ryan, K.L. Comparative response assessment of minimally compliant low-rise conventional and base-isolated steel frames. Earthq. Eng Struct Dynam. 2011, 40, 1123–1141. [Google Scholar] [CrossRef]
- Sayani, P.J.; Erduran, E.; Ryan, K.L. Comparative response assessment of minimally compliant low-rise base-isolated and conventional steel moment-resisting frame buildings. J. Struct. Eng. 2011, 137, 1118–1131. [Google Scholar] [CrossRef]
- Terzic, V.; Mahin, S.A.; Comerio, M.C. Comparative Life-cycle cost and performance analysis of structural systems for buildings. In Proceedings of the 10th National Conference in Earthquake Engineering, Anchorage, AK, USA; 2012. [Google Scholar]
- McVitty, W.J.; Constantinou, M.C. Property Modification Factors for Seismic Isolators: Design Guidance for Buildings; Multidisciplinary Center for Earthquake Engineering Research: Buffalo, NY, USA, 2015. [Google Scholar]
- Kitayama, S.; Constantinou, M.C. Collapse performance of seismically isolated buildings designed by the procedures of ASCE/SEI 7. Eng. Struct. 2018, 164, 243–258. [Google Scholar] [CrossRef]
- Christopoulos, C.; Filiatrault, A. Principles of Passive Supplemental Damping and Seismic Isolation; IUSS Press: Pavia, Italy, 2006. [Google Scholar]
- Pant, D.R.; Wijeyewickrema, A.C. Performance of base-isolated reinforced concrete buildings under bidirectional seismic excitation considering pounding with retaining walls including friction effects. Earthq. Eng. Struct. Dyn. 2014, 43, 1521–1541. [Google Scholar] [CrossRef]
- Masroor, A.; Mosqueda, G. Assessing the collapse probability of base-isolated buildings considering pounding to moat walls using the FEMA P695 methodology. Earthq. Spectra. 2015, 31, 2069–2086. [Google Scholar] [CrossRef]
- Computers and Structures Inc. PERFORM Components and Elements for Perform 3D and Perform-Collapse Ver 4; Computers and Structures, Inc.: Berkerley, CA, USA, 2006. [Google Scholar]
- FEMA. Prestandard and Commentary for the Seismic Rehabilitation of Buildings; Federal Emergency Management Agency: Washington, DC, USA, 2000.
- FEMA. HAZUS-MH, MH2.0 Earthquake Model Technical Manual; Federal Emergency Management Agency: Washington, DC, USA, 2003.
- Zhang, J.; Huo, Y. Evaluating effectiveness and optimum design of isolation devices for highway bridges using the fragility function method. Eng. Struct. 2009, 31, 1648–1660. [Google Scholar] [CrossRef]
- Han, R.; Li, Y.; Lindt, J. Seismic risk of base isolated non-ductile reinforced concrete buildings considering uncertainties and mainshock-aftershock sequences. Struct. Saf. 2014, 50, 39–56. [Google Scholar] [CrossRef]
- Vamvatsikos, D.; Fragiadakis, M. Incremental dynamic analysis for estimating seismic performance sensitivity and uncertainty. Earthq. Eng. Struct. Dyn. 2009, 39, 141–163. [Google Scholar] [CrossRef]
- Shin, D.H.; Yang, W.J.; Kim, H.J. Comparative Evaluation of Probabilistic Uncertainty-Propagations to Seismic Collapse Capacity of Low-Rise Steel Moment-Resisting Frames. Int. J. Steel Struct. 2016, 16, 887–900. [Google Scholar] [CrossRef]
- Ellingwood, B. Reliability Basis of Load and Resistance Factor for Reinforced Concrete Design: National Bureau of Standards Buildings Science Series 110; National Bureau of Standards: Washington, DC, USA, 1978.
- Celik, O.C.; Ellingwood, B. Seismic fragilities for non-ductile reinforced concrete frames-Role of aleatoric and epistemic uncertainties. Struct. Saf. 2010, 32, 1–12. [Google Scholar] [CrossRef]
- Porter, K.A.; Beck, J.L.; Shaikhutdinov, R.V. Sensitivity of building loss estimates to major uncertain variables. Earthq. Spectra. 2002, 18, 719–743. [Google Scholar] [CrossRef] [Green Version]
- Baker, J.W. Vector-Valued Ground Motion Intensity Measures for Probabilistic Seismic Demand Analysis. Ph.D. Thesis, Department of Civil and Environmental Engineering, Stanford University, Stanford, CA, USA, 2005. [Google Scholar]
- Baker, J.W.; Cornell, C.A. Spectral shape, epsilon and record selection. Earthq. Eng. Struct. Dyn. 2006, 35, 1077–1095. [Google Scholar] [CrossRef]
- Haselton, C.B.; Baker, J.W.; Liel, A.B.; Deierlein, G.G. Accounting for ground-motion spectral shape characteristics in structural collapse assessment through an adjustment for Epsilon. J. Struct. Eng. 2011, 137, 332–344. [Google Scholar] [CrossRef] [Green Version]
- Abrahamson, N.A.; Silva, W.J. Empirical response spectral attenuation relations for shallow crustal earthquakes. Seismol. Res. Lett. 1997, 68, 94–127. [Google Scholar] [CrossRef] [Green Version]
- Shin, D.H.; Hong, S.J.; Kim, H.J. Investigation on Effective peak ground accelerations based on the Gyeongju Earthquake records. Eesk. J. Earthq. Eng. 2016, 20, 425–434. [Google Scholar] [CrossRef]
- United States Geological Survey. Earthquake Hazards Program-Unified Hazard Tool. Available online: https://earthquake.usgs.gov/hazards/interactive/ (accessed on 16 April 2020).


| (a) Wind Load Conditions | |||||
|---|---|---|---|---|---|
| - | Exposure Category | Basic Wind Speed, m/s | |||
| Strong windy load | C | 30 | |||
| Weak windy load | B | 40 | |||
| (b) Seismic Design Parameters | |||||
| R | Ω0 | Cd | I | RI | Site Class |
| 5 | 3 | 4.5 | 1.0 | 1.875 | C |
| (a) Building at High Seismicity Region | ||||||||||||||||||
|---|---|---|---|---|---|---|---|---|---|---|---|---|---|---|---|---|---|---|
| - | Under Strong Windy Load | Under Weak Windy Load | ||||||||||||||||
| 3-Story | 5-Story | 10-Story | 3-Story | 5-Story | 10-Story | |||||||||||||
| 3SE40C | 5SE40C | 10SE40C | 3SE30B | 5SE30B | 10SE30B | |||||||||||||
| LB | M | UB | LB | M | UB | LB | M | UB | LB | M | UB | LB | M | UB | LB | M | UB | |
| ke | 68 | 86 | 86 | 140 | 140 | 140 | 186 | 186 | 186 | 48 | 48 | 48 | 76 | 76 | 76 | 128 | 128 | 128 |
| 4.7 | 6.6 | 8.9 | 8.7 | 11.0 | 14.9 | 11.6 | 14.4 | 19.9 | 2.8 | 3.6 | 4.7 | 4.3 | 5.4 | 6.9 | 7.6 | 9.6 | 12.7 | |
| 5.5 | 8.1 | 11.3 | 10.4 | 13.3 | 18.7 | 15.5 | 20.1 | 29.5 | 3.4 | 4.3 | 6.0 | 5.3 | 6.7 | 9.1 | 9.2 | 11.7 | 16.2 | |
| 498 | 622 | 933 | 917 | 1146 | 1719 | 2177 | 2722 | 4083 | 298 | 373 | 559 | 399 | 499 | 748 | 1036 | 1295 | 1942 | |
| DM | 489 | 402 | 314 | 483 | 417 | 333 | 506 | 435 | 339 | 632 | 551 | 441 | 666 | 577 | 451 | 744 | 644 | 514 |
| ΔFR,req | 328 | 328 | 328 | 571 | 571 | 571 | 1271 | 1271 | 1271 | 328 | 328 | 328 | 568 | 568 | 568 | 1271 | 1271 | 1271 |
| 1150 | 1948 | 2056 | 2103 | 2292 | 2476 | 2931 | 3126 | 3375 | 895 | 983 | 1041 | 1427 | 1546 | 1551 | 2837 | 3086 | 3267 | |
| (b) Building at Low-to-Moderate Seismicity Region | ||||||||||||||||||
| - | Under Strong Windy Load | Under Weak Windy Load | ||||||||||||||||
| 3-Story | 5-Story | 10-Story | 3-Story | 5-Story | 10-Story | |||||||||||||
| 3LE40C | 5LE40C | 10LE40C | 3LE30B | 5LE30B | 10LE30B | |||||||||||||
| LB | M | UB | LB | M | UB | LB | M | UB | LB | M | UB | LB | M | UB | LB | M | UB | |
| ke | 70 | 89 | 89 | 122 | 122 | 123 | 199 | 200 | 201 | 59 | 59 | 59 | 78 | 79 | 79 | 135 | 136 | 139 |
| 5.1 | 9.4 | 12.9 | 10.4 | 12.8 | 14.5 | 24.0 | 32.1 | 43.3 | 3.5 | 4.5 | 5.9 | 7.1 | 9.0 | 12.7 | 15.9 | 23.5 | 30.6 | |
| 9.4 | 15.8 | 24.7 | 18.5 | 24.8 | 39.7 | 37.7 | 50.5 | 81.0 | 5.0 | 6.5 | 9.6 | 8.8 | 11.3 | 16.6 | 20.3 | 24.7 | 38.4 | |
| Qy | 498 | 622 | 933 | 929 | 1160 | 1741 | 2177 | 2722 | 4083 | 241 | 302 | 453 | 399 | 499 | 748 | 1036 | 1295 | 1942 |
| DM | 110 | 84 | 65 | 98 | 84 | 66 | 103 | 89 | 72 | 163 | 142 | 110 | 178 | 154 | 116 | 161 | 155 | 111 |
| 306 | 306 | 306 | 531 | 531 | 531 | 1152 | 1152 | 1152 | 306 | 306 | 306 | 531 | 531 | 531 | 1152 | 1152 | 1152 | |
| ΔFR | 420 | 581 | 615 | 754 | 790 | 781 | 1236 | 1432 | 1558 | 425 | 475 | 477 | 632 | 689 | 738 | 1279 | 1821 | 1692 |
| (a) Building at High Seismicity Region | ||||||||||||||||||
|---|---|---|---|---|---|---|---|---|---|---|---|---|---|---|---|---|---|---|
| - | Under Strong Windy Load | Under Weak Windy Load | ||||||||||||||||
| 3-Story | 5-Story | 10-Story | 3-Story | 5-Story | 10-Story | |||||||||||||
| 3SE40C | 5SE40C | 10SE40C | 3SE30B | 5SE30B | 10SE30B | |||||||||||||
| LB | M | UB | LB | M | UB | LB | M | UB | LB | M | UB | LB | M | UB | LB | M | UB | |
| 0.49 | 0.69 | 1.12 | 0.49 | 0.69 | 1.12 | |||||||||||||
| 3.11 | 2.56 | 2.16 | 2.97 | 2.63 | 2.22 | 3.63 | 3.19 | 2.63 | 3.94 | 3.49 | 2.98 | 4.17 | 3.70 | 3.17 | 4.72 | 4.18 | 3.55 | |
| 0.16 | 0.19 | 0.23 | 0.23 | 0.26 | 0.31 | 0.31 | 0.35 | 0.43 | 0.12 | 0.14 | 0.16 | 0.17 | 0.19 | 0.22 | 0.24 | 0.27 | 0.32 | |
| βeq,M | 11.1 | 11.2 | 14.6 | 9.8 | 10.7 | 13.1 | 16.4 | 17.4 | 20.4 | 10.5 | 11.0 | 13.7 | 10.5 | 11.5 | 14.1 | 11.0 | 12.0 | 14.7 |
| BM | 1.23 | 1.24 | 1.34 | 1.19 | 1.22 | 1.29 | 1.39 | 1.42 | 1.51 | 1.21 | 1.23 | 1.31 | 1.22 | 1.25 | 1.36 | 1.23 | 1.26 | 1.34 |
| (b) Building at Low-to-Moderate Seismicity Region | ||||||||||||||||||
| - | Under Strong Windy Load | Under Weak Windy Load | ||||||||||||||||
| 3-Story | 5-Story | 10-Story | 3-Story | 5-Story | 10-Story | |||||||||||||
| 3LE40C | 5LE40C | 10LE40C | 3LE30B | 5LE30B | 10LE30B | |||||||||||||
| LB | M | UB | LB | M | UB | LB | M | UB | LB | M | UB | LB | M | UB | LB | M | UB | |
| T1 | 0.70 | 1.00 | 1.49 | 0.70 | 1.00 | 1.49 | ||||||||||||
| TM | 2.29 | 1.78 | 1.46 | 2.15 | 1.86 | 1.46 | 2.22 | 1.91 | 1.51 | 3.14 | 2.76 | 2.27 | 3.12 | 2.73 | 2.27 | 3.02 | 2.74 | 2.20 |
| T1/TM | 0.31 | 0.39 | 0.48 | 0.47 | 0.54 | 0.68 | 0.67 | 0.78 | 0.99 | 0.22 | 0.25 | 0.31 | 0.32 | 0.37 | 0.44 | 0.49 | 0.54 | 0.68 |
| βeq,M | 22.9 | 24.2 | 26.5 | 27.7 | 28.1 | 28.6 | 25.9 | 25.7 | 23.8 | 18.1 | 18.4 | 22.5 | 13.8 | 14.7 | 16.6 | 16.9 | 14.3 | 17.7 |
| BM | 1.56 | 1.58 | 1.63 | 1.65 | 1.66 | 1.67 | 1.62 | 1.61 | 1.58 | 1.44 | 1.45 | 1.55 | 1.32 | 1.34 | 1.45 | 1.41 | 1.33 | 1.75 |
| No. of EQ | Ground Motions | Stations | Duration, s | Magnitude | PGA, g | |
|---|---|---|---|---|---|---|
| X-Comp | Y-Comp | |||||
| 1, 2 | Northridge | Beverly Hills-Mulhol | 29.99 | 6.7 | 0.416 | 0.516 |
| 3, 4 | Northridge | Canyon Country-WLC | 19.99 | 6.7 | 0.410 | 0.482 |
| 5, 6 | Duze, Turkey | Bolu | 55.9 | 7.1 | 0.728 | 0.822 |
| 7, 8 | Hector Mine | Hector | 45.31 | 7.1 | 0.266 | 0.337 |
| 9, 10 | Imperial Valley | Delta | 99.92 | 6.5 | 0.238 | 0.351 |
| 11, 12 | Imperial Valley | El Centro Array #11 | 39.035 | 6.5 | 0.364 | 0.380 |
| 13, 14 | Kobe, Japan | Nishi-Akashi | 40.96 | 6.9 | 0.509 | 0.503 |
| 15, 16 | Kobe, Japan | Shin-Osaka | 40.96 | 6.9 | 0.243 | 0.212 |
| 17, 18 | Kocaeli, Turkey | Duzce | 27.185 | 7.5 | 0.312 | 0.358 |
| 19, 20 | Kocaeli, Turkey | Arcelik | 30 | 7.5 | 0.218 | 0.149 |
| 21, 22 | Landers | Yermo Fire Station | 44 | 7.3 | 0.245 | 0.152 |
| 23, 24 | Landers | Coolwater | 27.965 | 7.3 | 0.283 | 0.417 |
| 25, 26 | Loma Prieta | Capitola | 39.955 | 6.9 | 0.529 | 0.443 |
| 27, 28 | Loma Prieta | Gilroy Array #3 | 39.945 | 6.9 | 0.555 | 0.367 |
| 29, 30 | Superstition Hills | El Centro Imp.Co. | 40 | 6.5 | 0.358 | 0.258 |
| 31, 32 | Superstition Hills | Poe Road (temp) | 22.3 | 6.5 | 0.446 | 0.300 |
| 33, 34 | Cape Mendocino | Rio Dell Overpass | 36 | 7.0 | 0.385 | 0.549 |
| 35, 36 | Chi-Chi, Taiwan | CHY101 | 90 | 7.6 | 0.353 | 0.440 |
| 37, 38 | San Fernando | LA-Hollywood Stor | 28 | 6.6 | 0.210 | 0.174 |
| 39, 40 | Friuli, Italy | Tolmezzo | 36.345 | 6.5 | 0.351 | 0.315 |
| Category | Random Variables | Distribution Type | λ | δ | Reference |
|---|---|---|---|---|---|
| SSP | fck | Normal | 1.14 | 0.18 | Ellingwood et al. [35], Celik and Ellingwood [36] |
| fy | Log-Normal | 1.05 | 0.11 | ||
| DP | Dp | Log-Normal | 1.0 | 0.30 to 0.40 | Porter et al. [37] |
| ISP | KNRB | Uniform | 1.0 | 0.8μ to 1.8μ | ASCE/SEI 7 [14], Han et al. [32] |
| KLRB | Uniform | 1.0 | 0.8μ to 1.8μ | ||
| QLRB | Uniform | 1.0 | 0.8μ to 1.8μ | ||
| GL | D.L. | Normal | 1.05 | 0.10 | Ellingwood et al. [35] |
| L.L. | Gumbel | Varies per floor area | 0.25 |
| (a) Buildings at High Seismicity Regions | ||||||
|---|---|---|---|---|---|---|
| - | Strong Windy Region | Weak Windy Region | ||||
| 3SE40C | 5SE40C | 10SE40C | 3SE30B | 5SE30B | 10SE30B | |
| βMDL | 0.064 | 0.069 | 0.109 | 0.020 | 0.011 | 0.025 |
| (b) Buildings at Low-to-Moderate Seismicity Regions | ||||||
| - | Strong Windy Region | Weak Windy Region | ||||
| 3LE40C | 5LE40C | 10LE40C | 3LE30B | 5LE30B | 10LE30B | |
| βMDL | 0.187 | 0.113 | 0.108 | 0.029 | 0.089 | 0.093 |
| Design Condition | Prototype Buildings | Median Collapse Spectral Acceleration | Collapse Probability | ||||||
|---|---|---|---|---|---|---|---|---|---|
| ε0 | c0 | c1 | Sa,Col,adj, g | Sa,MCE, g | βTOT | ACMR | PCOL,MCE, % | ||
| Buildings at high seismicity region | 3SE40C | 1.544 | −0.6246 | 0.0793 | 0.605 | 0.305 | 0.257 | 1.984 | 0.38 |
| 5SE40C | 1.537 | −0.8953 | 0.1644 | 0.526 | 0.297 | 0.210 | 1.771 | 0.32 | |
| 10SE40C | 1.479 | −1.1852 | 0.2665 | 0.453 | 0.245 | 0.229 | 1.851 | 0.36 | |
| 3SE30B | 1.446 | −1.1723 | 0.1023 | 0.359 | 0.224 | 0.159 | 1.603 | 0.15 | |
| 5SE30B | 1.423 | −1.2973 | 0.1414 | 0.334 | 0.211 | 0.158 | 1.584 | 0.18 | |
| 10SE30B | 1.370 | −1.3105 | 0.0574 | 0.292 | 0.187 | 0.154 | 1.560 | 0.19 | |
| Buildings at low-to-moderate seismicity region | 3LE40C | 0.808 | −1.2594 | 0.1803 | 0.328 | 0.180 | 0.380 | 1.824 | 5.69 |
| 5LE40C | 0.809 | −1.4851 | 0.2101 | 0.268 | 0.162 | 0.334 | 1.657 | 6.53 | |
| 10LE40C | 0.809 | −1.5954 | 0.2075 | 0.240 | 0.158 | 0.293 | 1.518 | 7.71 | |
| 3LE30B | 0.818 | −1.9169 | 0.2590 | 0.182 | 0.109 | 0.217 | 1.667 | 0.93 | |
| 5LE30B | 0.817 | −1.8140 | 0.1880 | 0.190 | 0.110 | 0.255 | 1.728 | 1.60 | |
| 10LE30B | 0.817 | −1.8721 | 0.1526 | 0.174 | 0.110 | 0.247 | 1.584 | 3.13 | |
Publisher’s Note: MDPI stays neutral with regard to jurisdictional claims in published maps and institutional affiliations. |
© 2020 by the authors. Licensee MDPI, Basel, Switzerland. This article is an open access article distributed under the terms and conditions of the Creative Commons Attribution (CC BY) license (http://creativecommons.org/licenses/by/4.0/).
Share and Cite
Kim, H.-J.; Shin, D.-H. Analytical Evaluation of MCE Collapse Performance of Seismically Base Isolated Buildings Located at Low-to-Moderate Seismicity Regions. Appl. Sci. 2020, 10, 9150. https://doi.org/10.3390/app10249150
Kim H-J, Shin D-H. Analytical Evaluation of MCE Collapse Performance of Seismically Base Isolated Buildings Located at Low-to-Moderate Seismicity Regions. Applied Sciences. 2020; 10(24):9150. https://doi.org/10.3390/app10249150
Chicago/Turabian StyleKim, Hyung-Joon, and Dong-Hyeon Shin. 2020. "Analytical Evaluation of MCE Collapse Performance of Seismically Base Isolated Buildings Located at Low-to-Moderate Seismicity Regions" Applied Sciences 10, no. 24: 9150. https://doi.org/10.3390/app10249150