Article

Evaluation of the Temperature and Time in Centrifugation-Assisted Freeze Concentration

1
Food Engineering Department, Universidad del Bío-Bío, Casilla 447, Chillán 3349001, Chile
2
Department of Computer Science and Artificial Intelligence, University of the Basque Country (UPV/EHU), 20018 Donostia-San Sebastian, Spain
*
Author to whom correspondence should be addressed.
Appl. Sci. 2020, 10(24), 9130; https://doi.org/10.3390/app10249130
Submission received: 26 November 2020 / Revised: 12 December 2020 / Accepted: 14 December 2020 / Published: 21 December 2020

Abstract

:
Centrifugation is a technique applied to assist in the freeze concentration of fruit juices and solutions. The aim of this work was to study the influence of the time–temperature parameters on the centrifugation process as a technique applied to assist in the first cycle of the freeze concentration of blueberry juice. A completely randomized 4 × 3 factorial design was performed using temperature and time as the factors, and the response variables included the percentage of concentrate, efficiency and solutes recovered. The results were evaluated using multiple linear regression, random forest regression, and Gaussian processes. The solid content in the concentrate doubled compared to the initial sample (18 °Brix) and approached 60% in the first cycle of blueberry juice freeze concentration. The combination of factors affected the percentage of the concentrate and solutes recovered, and the optimum of concentration was obtained at 15 °C with a centrifugation time of 20 min. Gaussian processes are suggested as suitable machine learning techniques for modelling the quantitative effect of the relevant factors in the centrifugation process.

1. Introduction

Freeze concentration (FC) or cryoconcentration is an attractive nonthermal technology applied to several liquid foods, and sub-zero temperatures are used, instead of thermal technologies such as evaporation that are usually performed at temperatures above 70 °C. Compared to conventional evaporation processes, FC is a method that allows the preservation of the organoleptic and nutritional properties of liquid food products [1].
FC is a method for recovering a food solute from a solution based on the separation of pure ice crystals from a freeze-concentrated aqueous phase [2]. Four FC techniques are used: (i) suspension freeze concentration [3]; (ii) progressive freeze concentration [4]; (iii) falling-film freeze concentration [5,6,7]; and (iv) block freeze concentration (BFC) [8,9].
The industrial future of FC is mostly associated with developments in the configuration of BFC rather than conventional freeze concentration systems or suspension crystallization, given the simpler separation step of BFC [10]. Another advantage of one-step block freeze concentration systems is their simplicity in terms of both the construction and operation of the systems [11]. In BFC, a food–liquid solution is completely frozen, the whole frozen solution is thawed, and then, the concentrated fraction is separated from the ice fraction by gravitational thawing. Other techniques may or may not be used in the last stage to improve the separation efficiency, and the ice block acts as a solid casing through which the concentrated fraction passes [4].
The technical viability of the block freeze concentration method has been demonstrated by several researchers [12,13,14,15,16,17]. Considering these conditions, Petzold, Sánchez and Miyawaki [10,11,18,19] suggested that the advancement of the freeze concentration technique is associated with the development of the characteristics or mechanisms of solute recovery occluded in the ice. These mechanisms are simple and economical in terms of their application; thus, these mechanisms serve as alternatives that allow us to make the process more efficient.
Many studies have focused on centrifugation and vacuuming as techniques to assist in freezing concentration. Centrifugation is an effective assisted technique to remove the concentrated solution from the ice matrix in a one-stage freeze concentration. The force of gravity is largely replaced by a greater driving force applied by centrifugal force. The higher concentration yield by freezing using centrifugation is attributed to the ice matrix acting as a porous solid through which the concentrated solution is filtered through ice drainage channels, which is enhanced by the centrifugal force applied [13,20,21,22].
Some authors have studied how the choice of the parameters for the assisted technique can help achieve more efficient freeze concentration. For example, Petzold [23] investigated the initial concentration of sucrose and the centrifugation speed. Petzold [24] reported that centrifugation enhances the separation of the concentrated solution of frozen fruit juices (blueberry and pineapple).
However, there are no scientific reports in which parameters, such as the temperature and centrifugation time, have been studied in detail to obtain a highly efficient FC concentration process. Furthermore, although research has shown the advantages of applying machine learning techniques to food technology [25,26], the authors did not find any previous reference to the use of these techniques for predicting the effects of the parameters in the centrifugation-assisted freeze concentration process.
In this paper, we study the influence of temperature and time parameters on the centrifugation process as an assisted technique. This study is focused on the case in which the centrifugation process is applied to the freezing concentration of blueberry juice. In the first stage, we collected experimental data to evaluate the effects of the temperature and centrifugation time. In the second stage, we used regression models that predicted the values of the response variables that characterize the outcome of the centrifugation process (concentrate, efficiency and solute).

2. Materials and Methods

2.1. Materials

The fresh blueberries (Powderblue Rabbiteye Blueberry variety) was purchased in a supermarket in the city of Chillán, Chile, and maintained under refrigeration at 4 ± 1 °C until processing. The juice was extracted from the fresh blueberries by pressing and filtering to separate the seeds, pulp and peel and obtain juice for subsequent cryoconcentration. The total solids of the juice obtained were 18 °Brix.

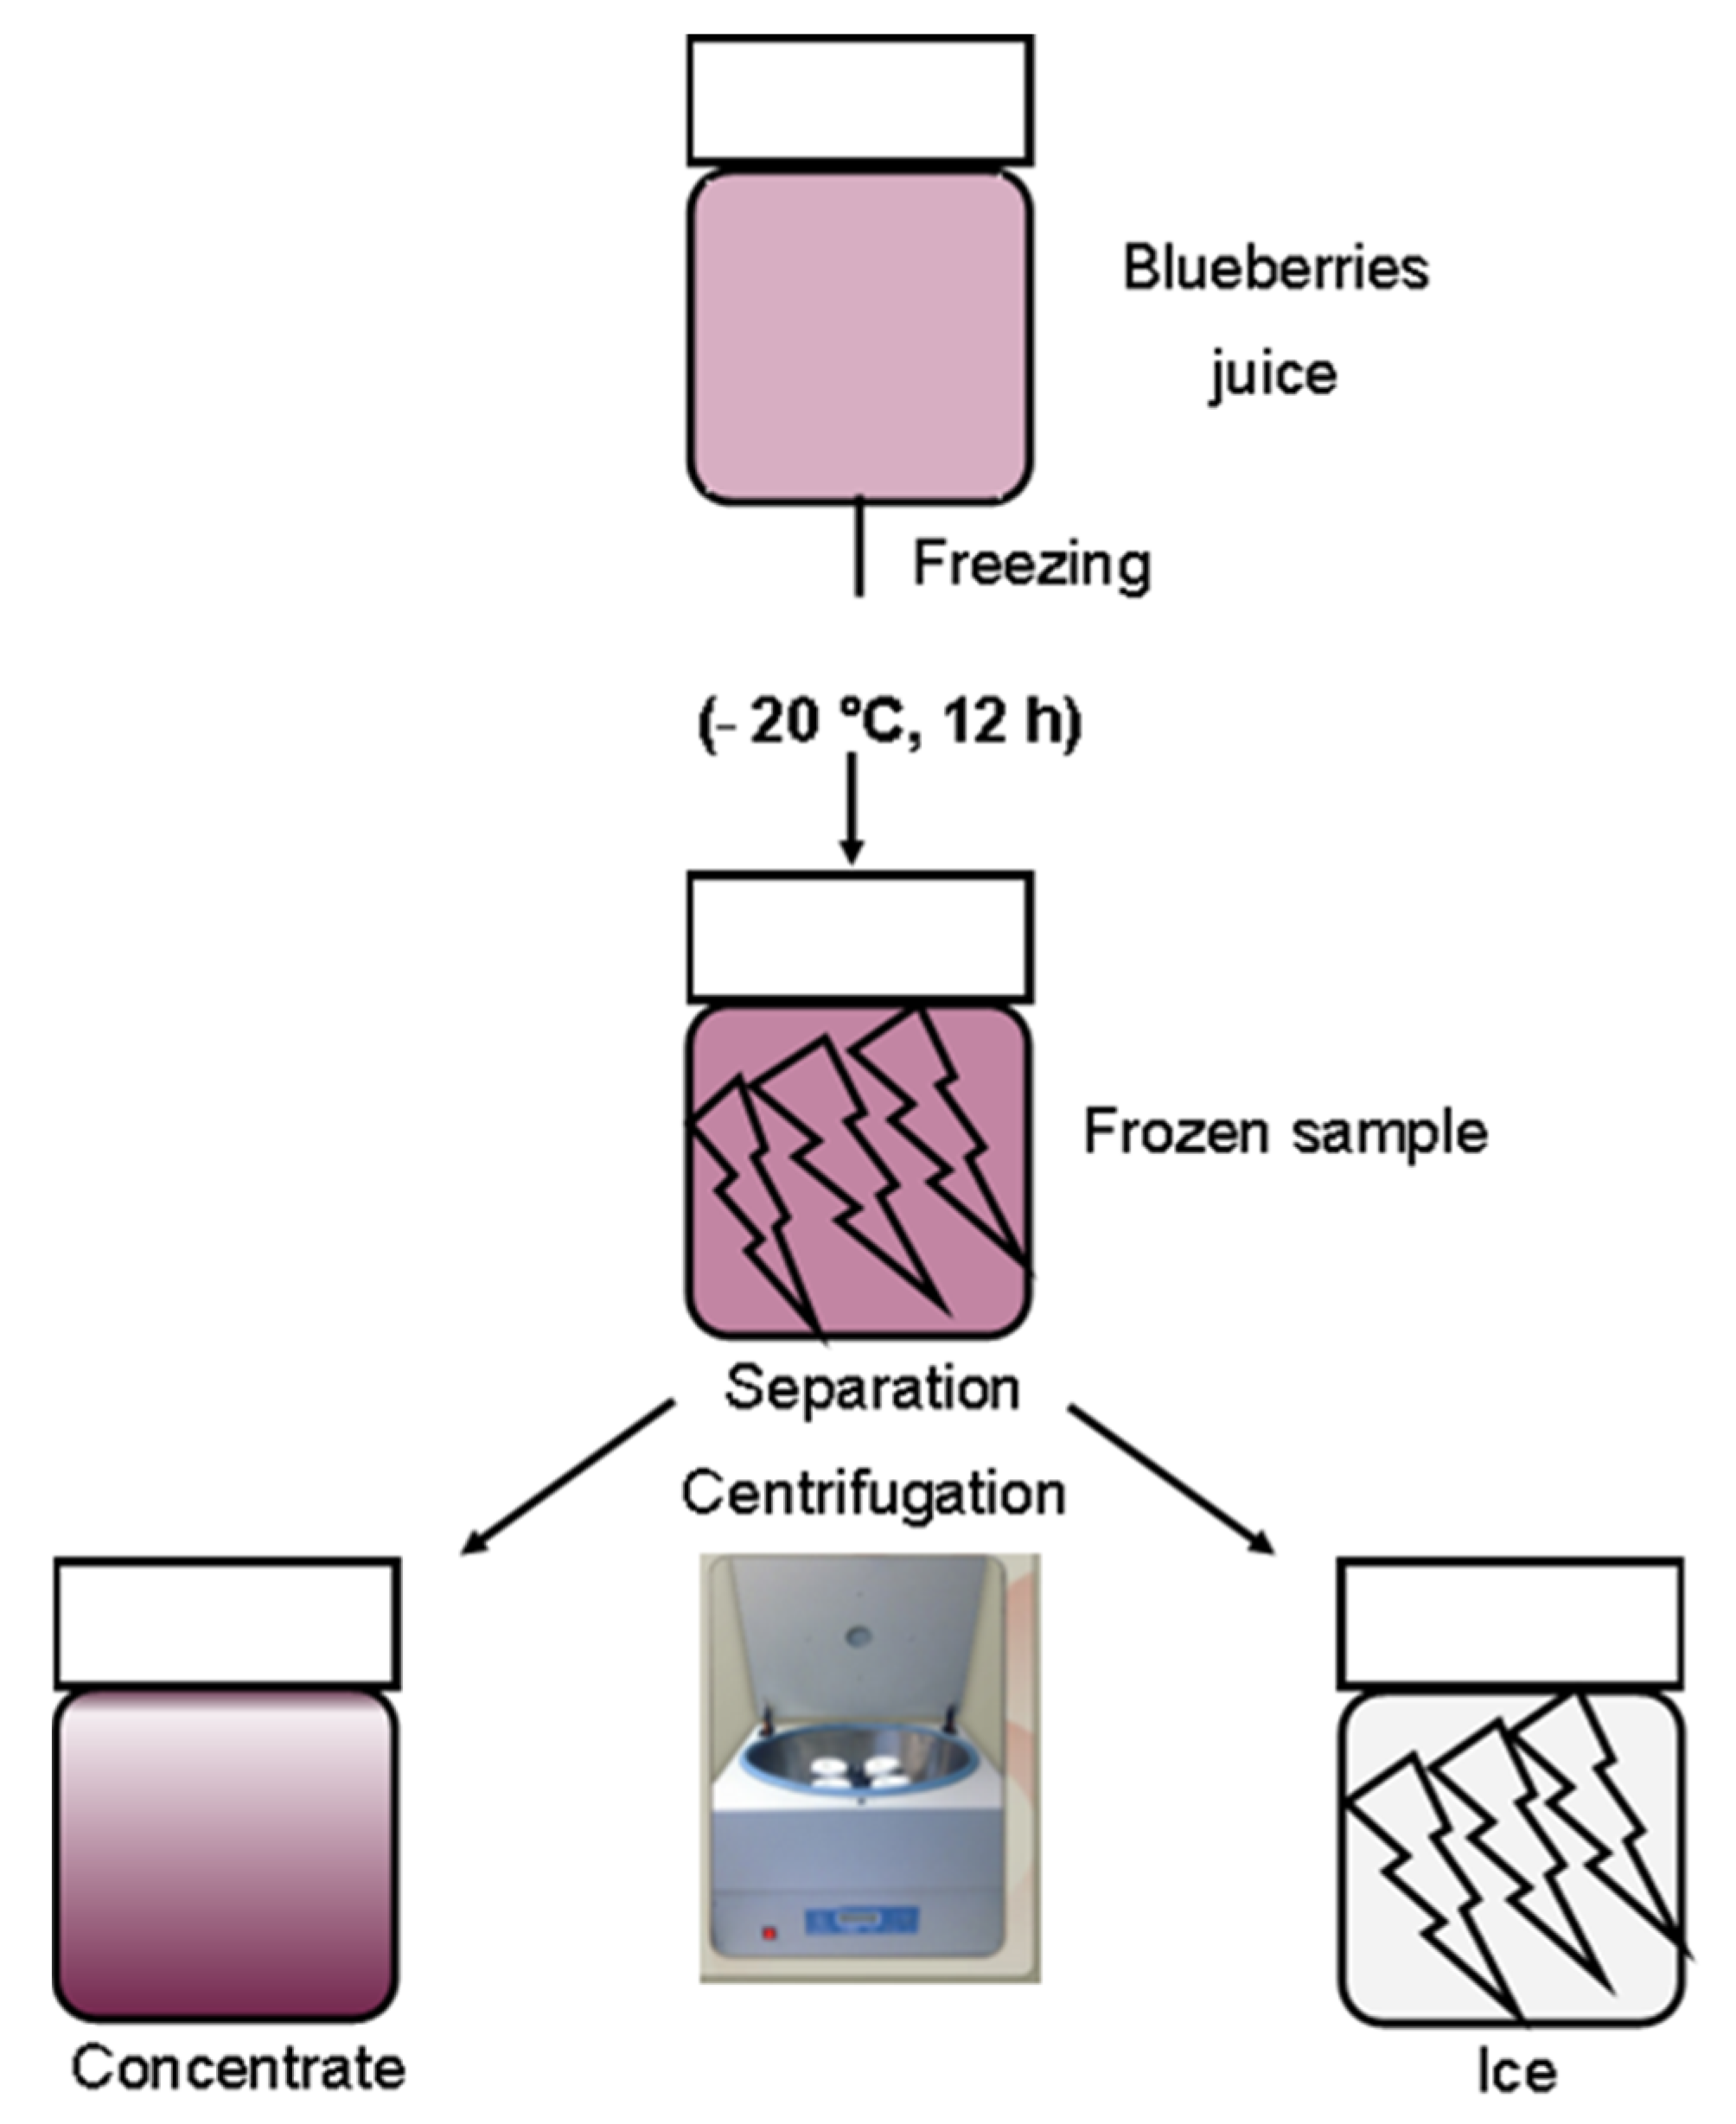
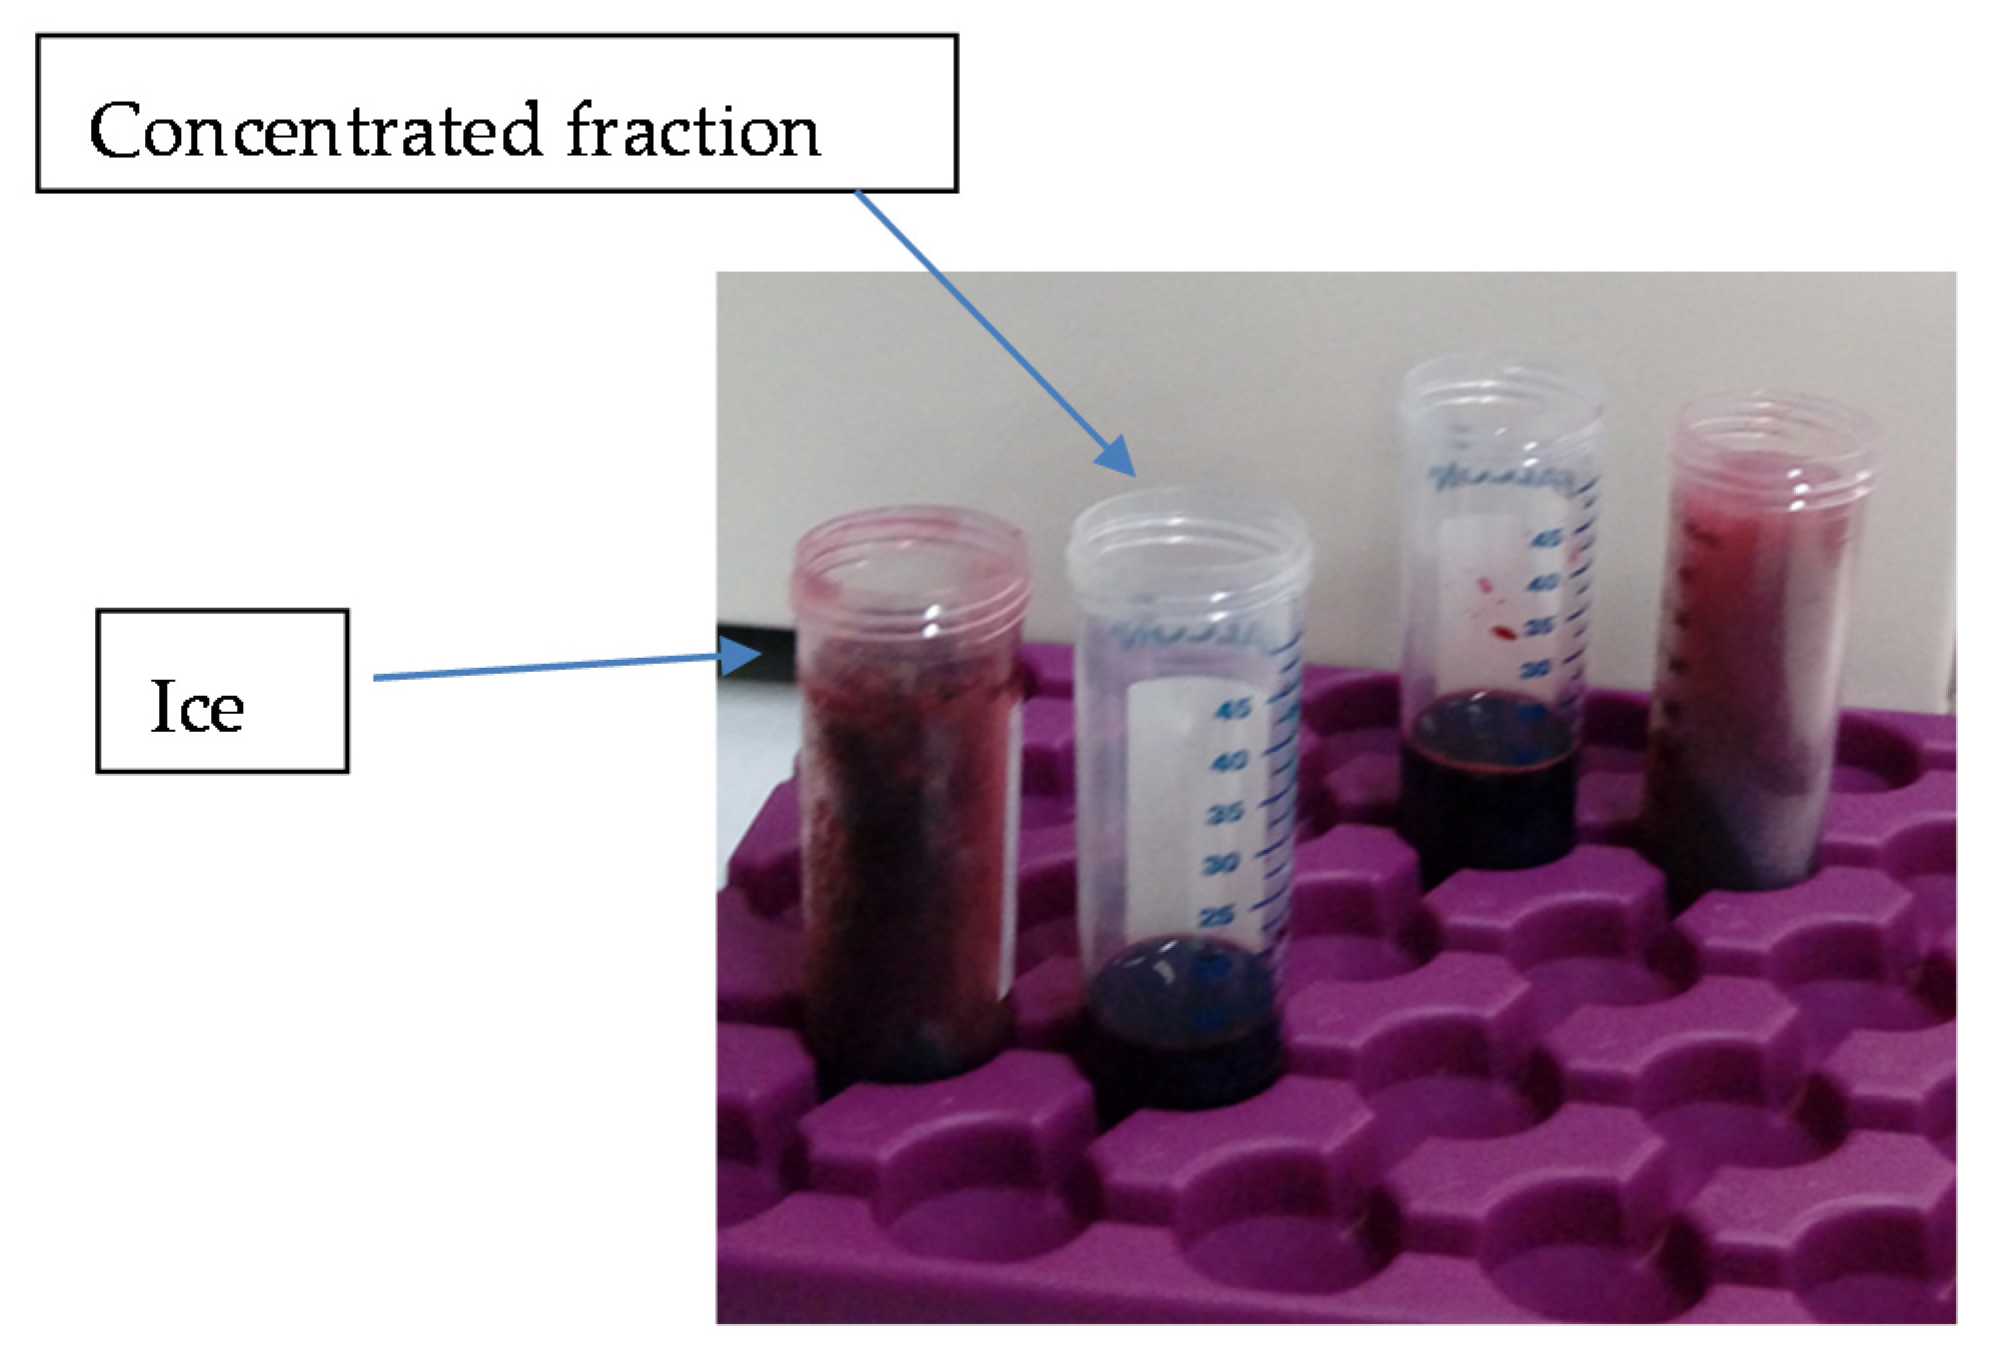
2.2. Experimental Method

A schematic diagram of the experimental method is given in Figure 1. The freeze concentration process was performed through a concentration cycle based on the method of Petzold [23] with modifications. Blueberry juice (45 mL) contained in plastic centrifugal tubes (internal diameter D = 15 mm) was frozen in a static freezer at −20 °C for 12 h. The external surface of the plastic tubes was covered with a thermal insulation made of foamed polystyrene (8 mm thickness, thermal conductivity K = 0.035 Wm 1 K 1). The heat transfers during freezing mainly occurred unidirectionally.
To separate the ice and concentrate, the frozen samples were removed from the freezer and rapidly transferred to a refrigerated centrifuge (centrifuge Hettich model D-7853, Tuttlingen, Germany) operated at 4000 RPM (1878 relative centrifuge force (RCF) and 105 mm rotor radius). The expression used to compute the RCF is given by Equation (1).
R C F = 1.12 r ( R P M 1000 ) 2
where RPM is the revolutions per minute, and r is the radius of the centrifuge rotor (mm).
After centrifugation, the concentrated solution was collected, and the remaining frozen core was thawed such that the soluble solid concentration was determined in both fractions. The concentration of fractions Cf and Cs (solids in the molten frozen phase and solution, respectively) obtained after assaying was analyzed at ambient temperature (22 °C) with an ATAGO refractometer (model PAL-1, Tokyo, Japan) to a precision of ±0.1 °Brix. All measurements were performed in triplicate, and the average values are reported.

2.3. Experimental Design

In this work, a completely randomized 4 × 3 factorial design (one factor at four levels and another factor at three levels) was analyzed. For each experimental treatment, three assays were conducted. The independent variables were the temperature (T) and time (t) of centrifugation, and the dependent variables (response) were the efficiency (ɳ), percentage of concentrate (PC), and solute recovered (Y). The factors and levels of the experimental design are shown in Table 1.

2.4. Calculations

2.4.1. Efficiency of Concentration

The efficiency of each concentration run was defined as the increase in the concentration of the solution relative to the quantity of sugar remaining in the frozen fraction. In theory, the lower the sugar content remaining in the frozen fraction, the more concentrated the solution will be. Equation (2) was used to calculate the efficiency:
η = C s C f C s 100
where cs and cf are the concentrations of solids (°Brix) in the concentrated solution and frozen fraction, respectively.

2.4.2. Percentage of Concentrate

The percentage of concentrate was calculated for each assay with the initial and final weights of the frozen fraction using Equation (3):
P C ( % ) = W i 0 W i t W i 0 100
where W i 0 and W i t are the initial and final weight of the frozen fraction, respectively.

2.4.3. Recovered Solute

The recovered solute represents a ratio of the solid concentration in the concentrated solution to that in the initial solution, Cs/Co, converted into solute yield using Equation (4):
Y = m s m 0
where Y has the unit kg solute/kg initial solute and ms and mo are the solute mass (kg) in the concentrated and initial solution, respectively.

2.5. Statistical Analysis

The results were expressed as the means ± standard deviation. Statistical analyses were performed by analysis of variance (ANOVA) and a least significant difference test (LSD) using the statistical program Statgraphics Centurion XVI (Statgraphics, VA, USA, 2009) with 95% confidence levels (with the significance determined by p ≤ 0.05).

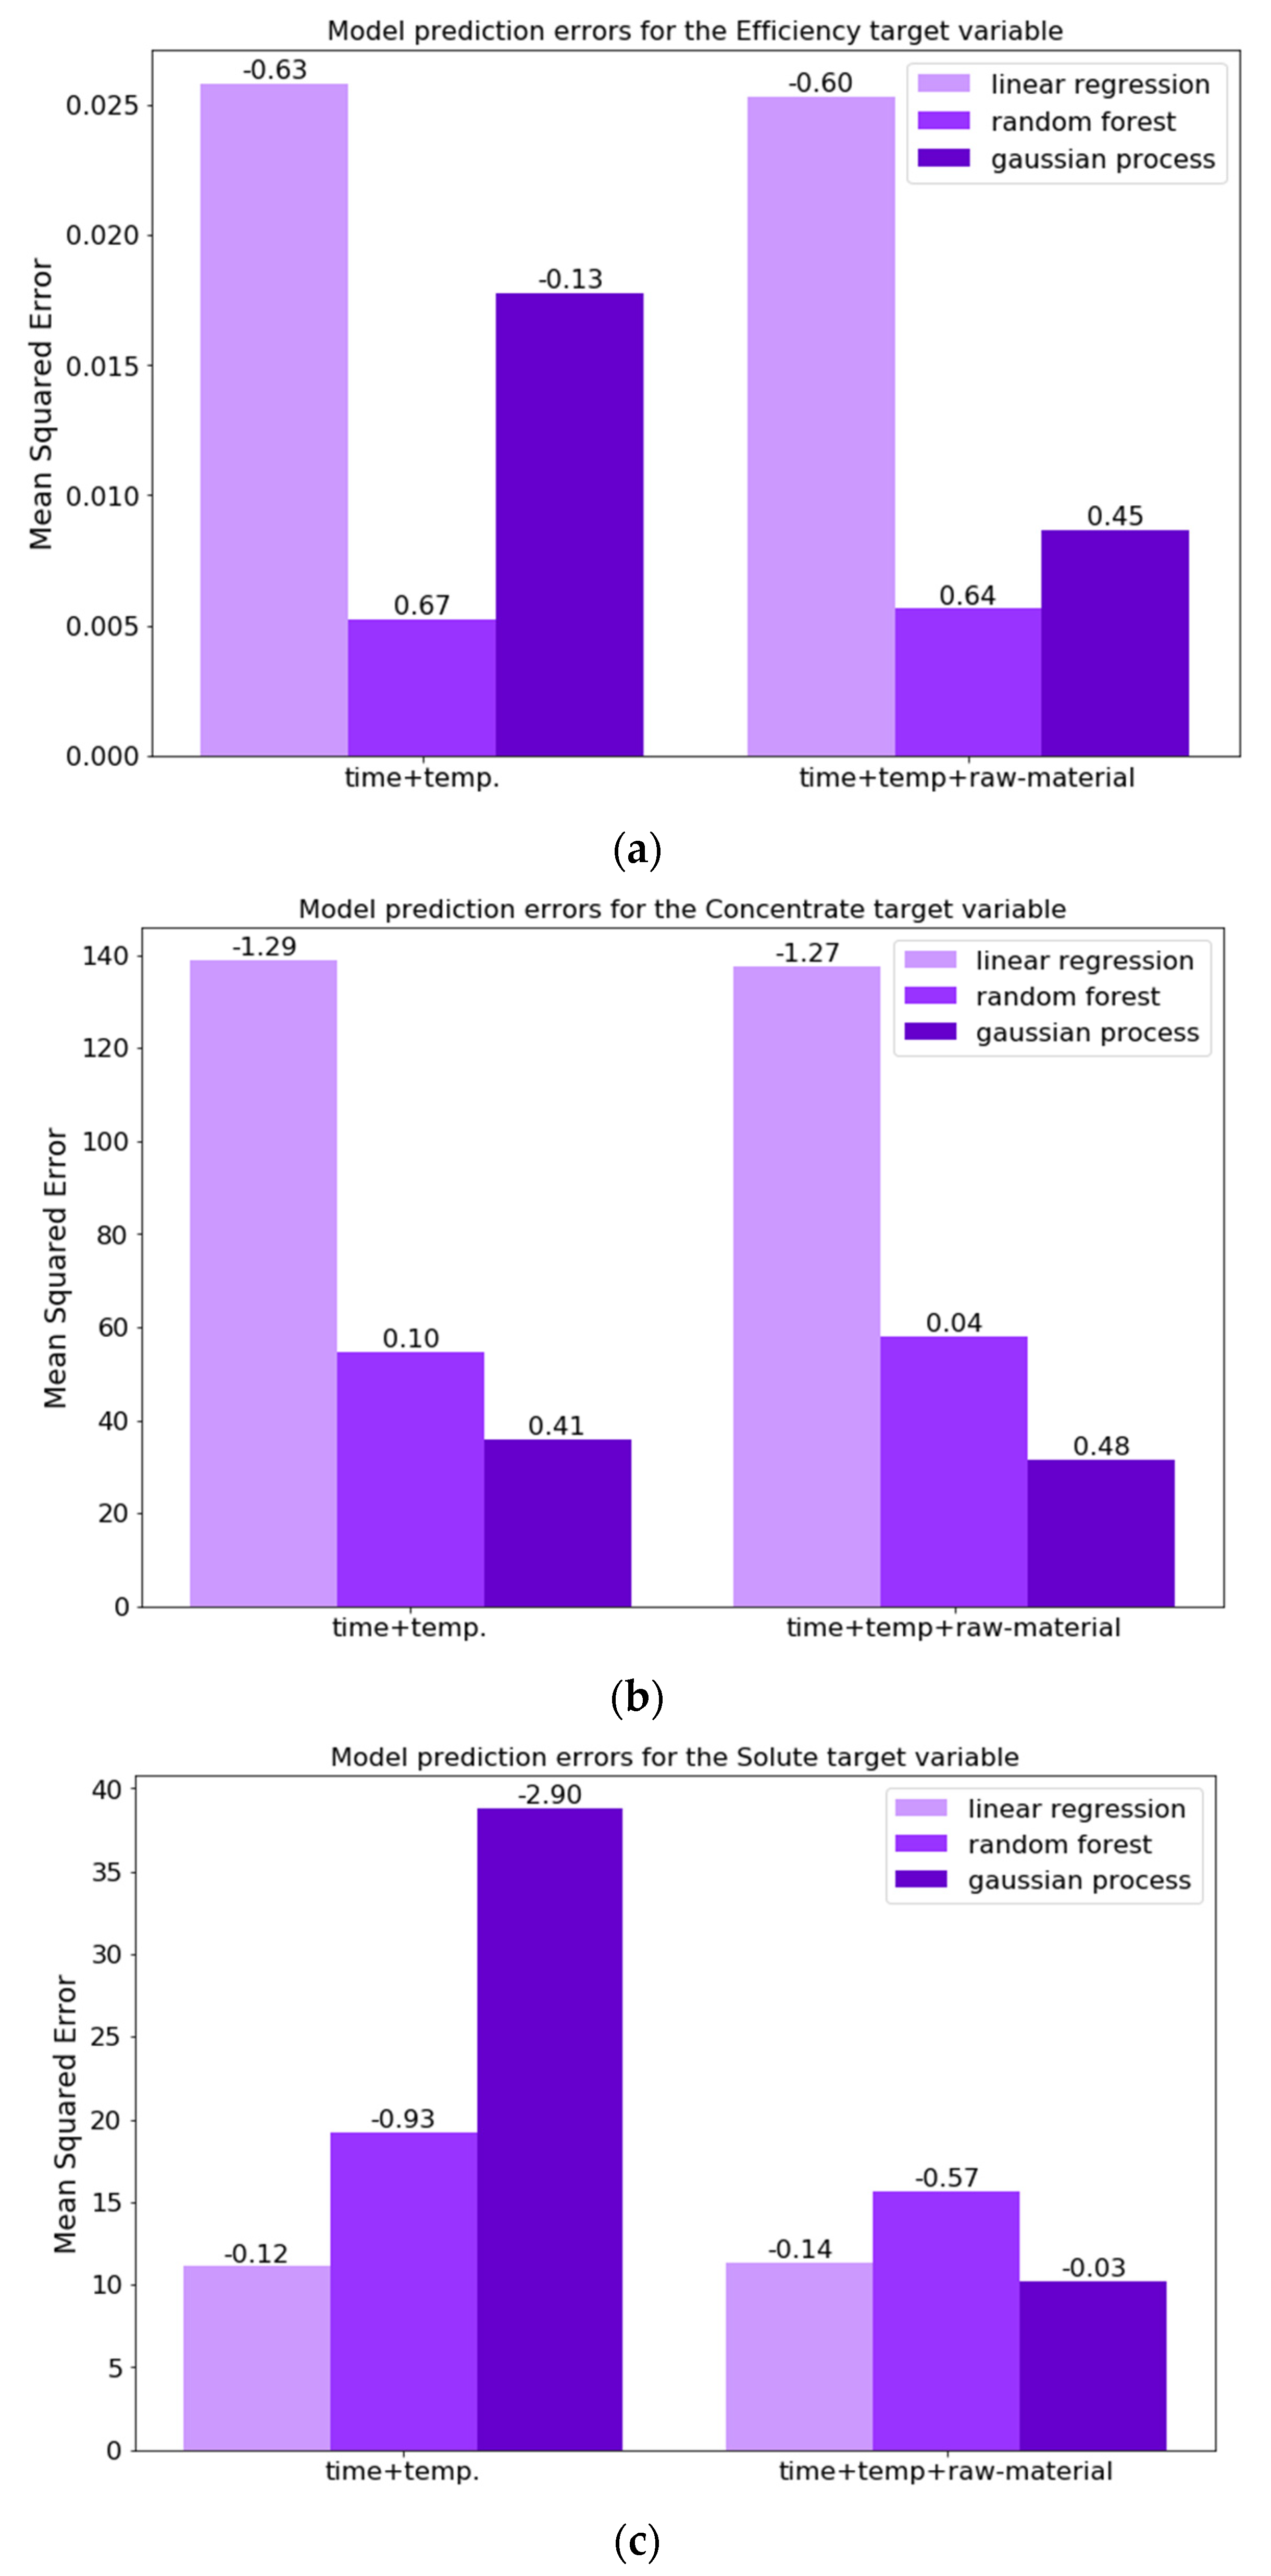
2.6. Predicting the Values of the Response Variables with Regression Models
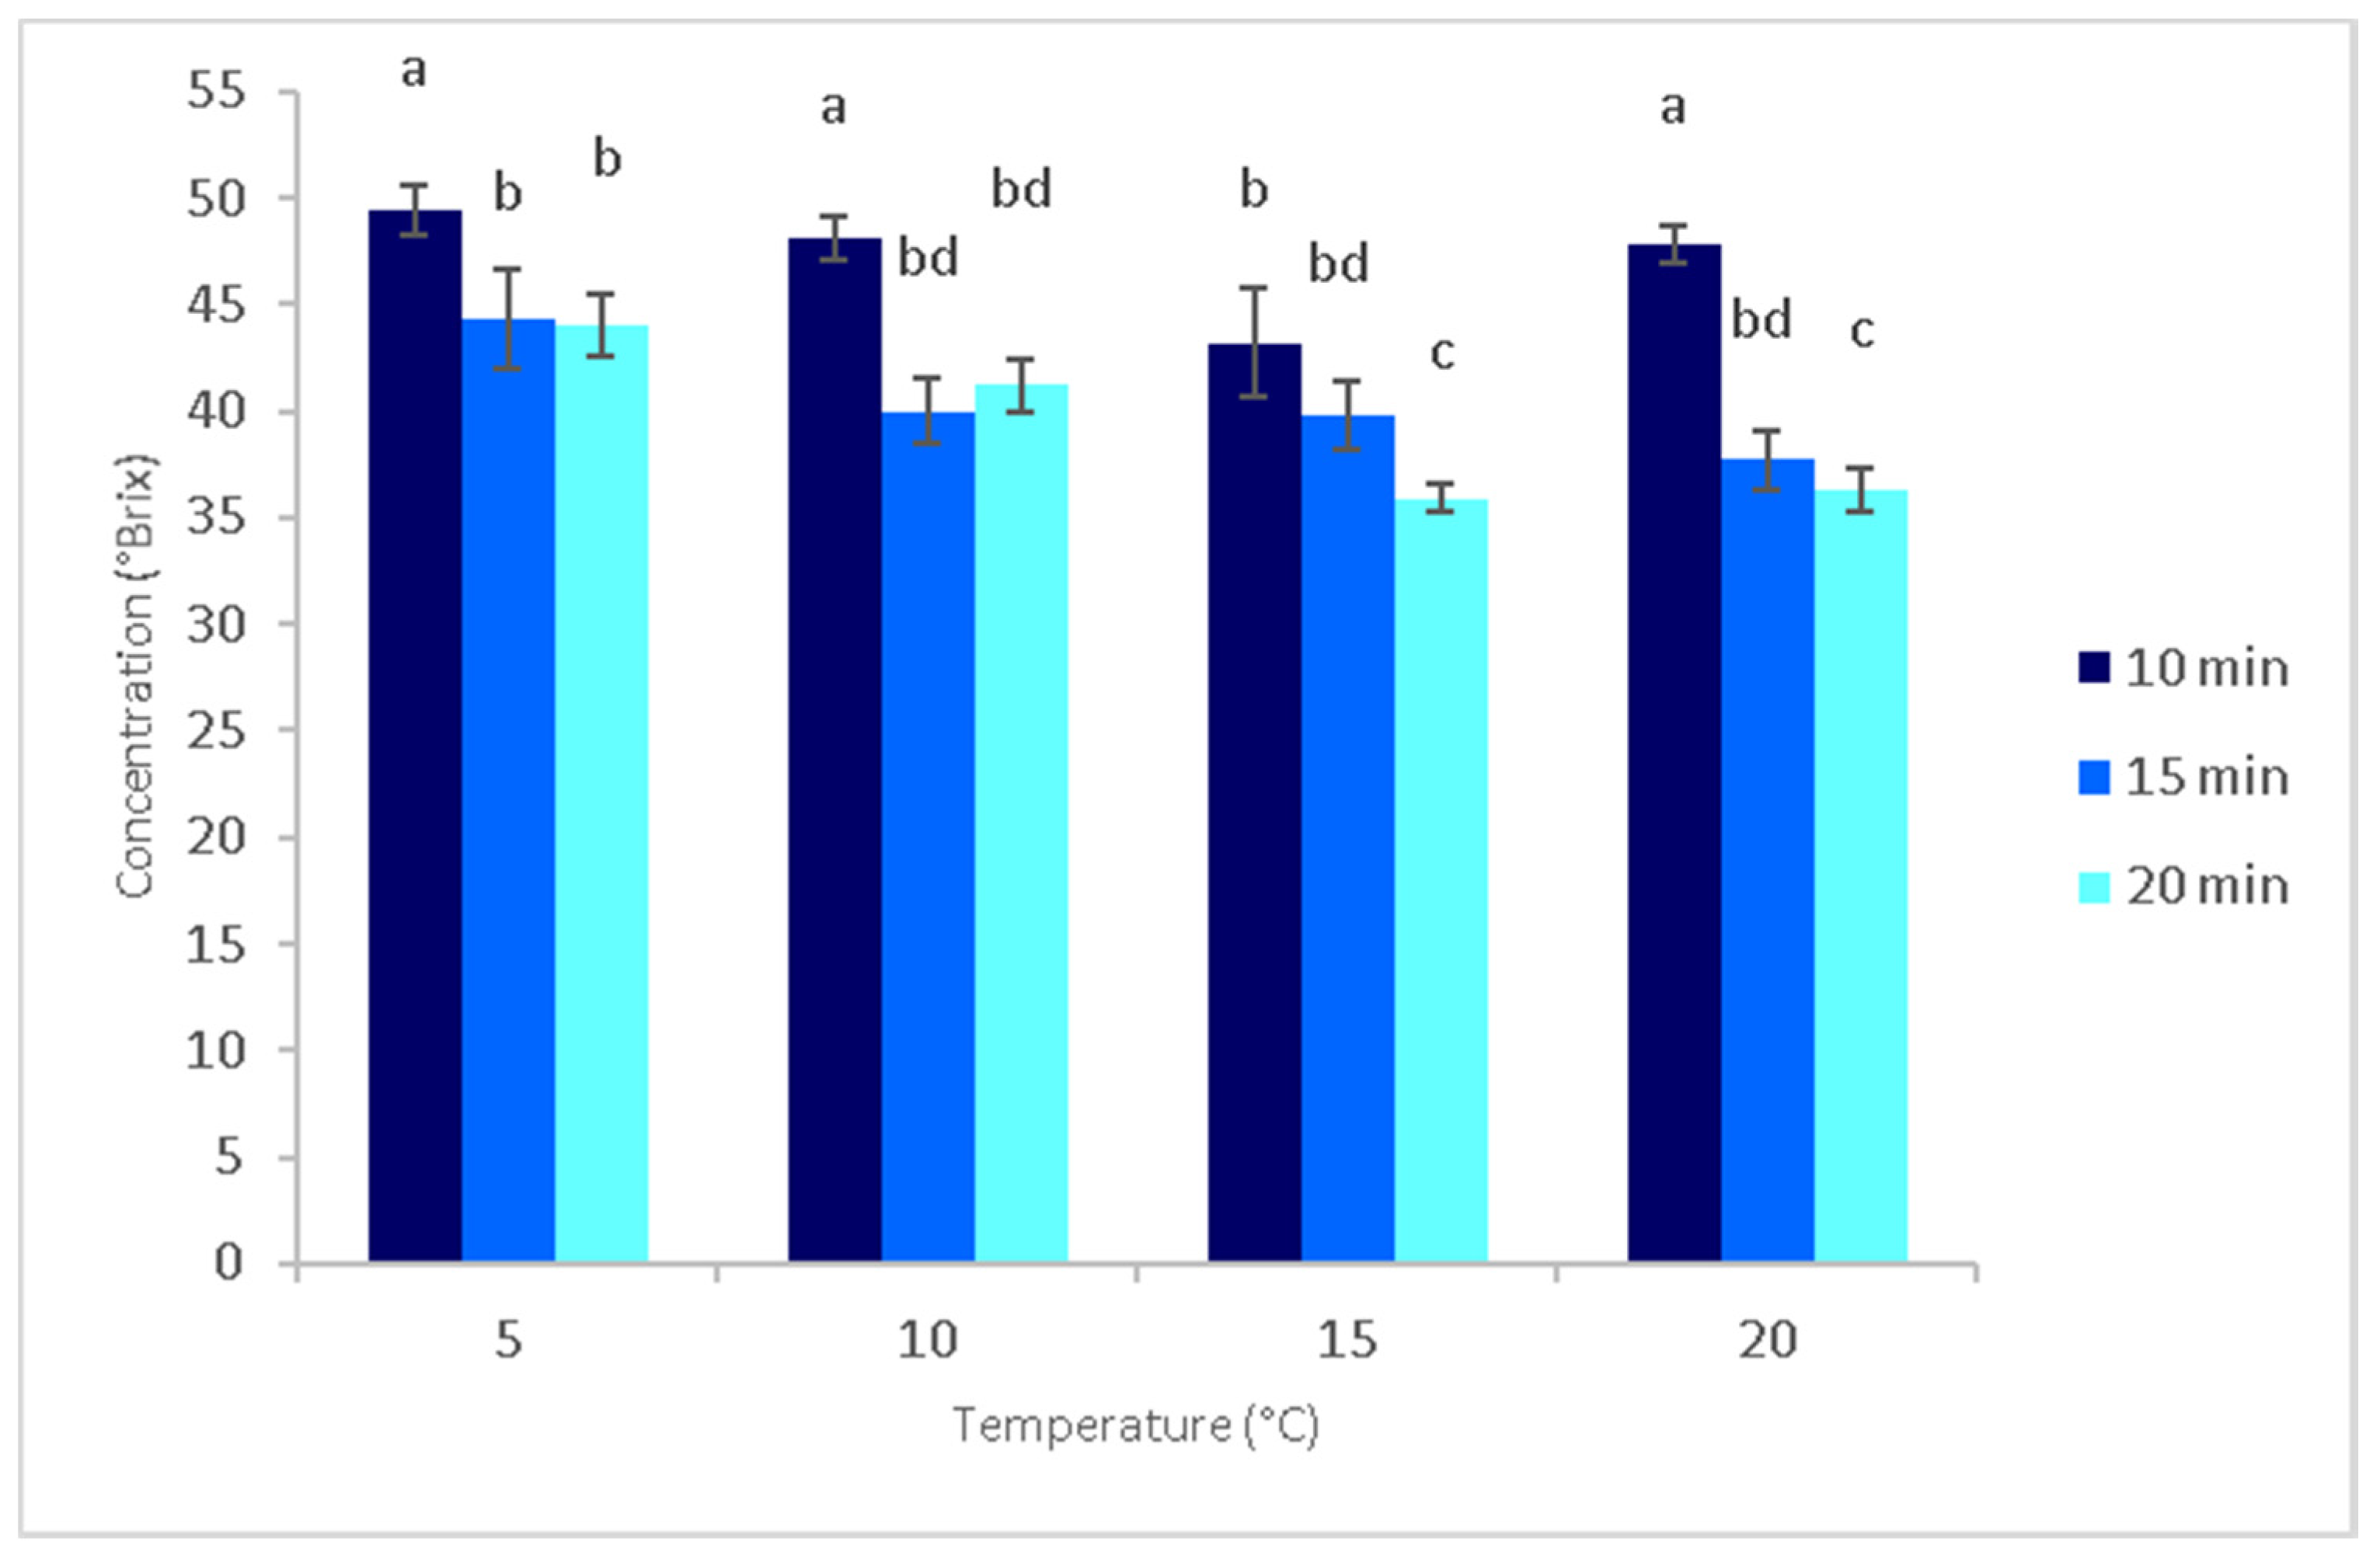
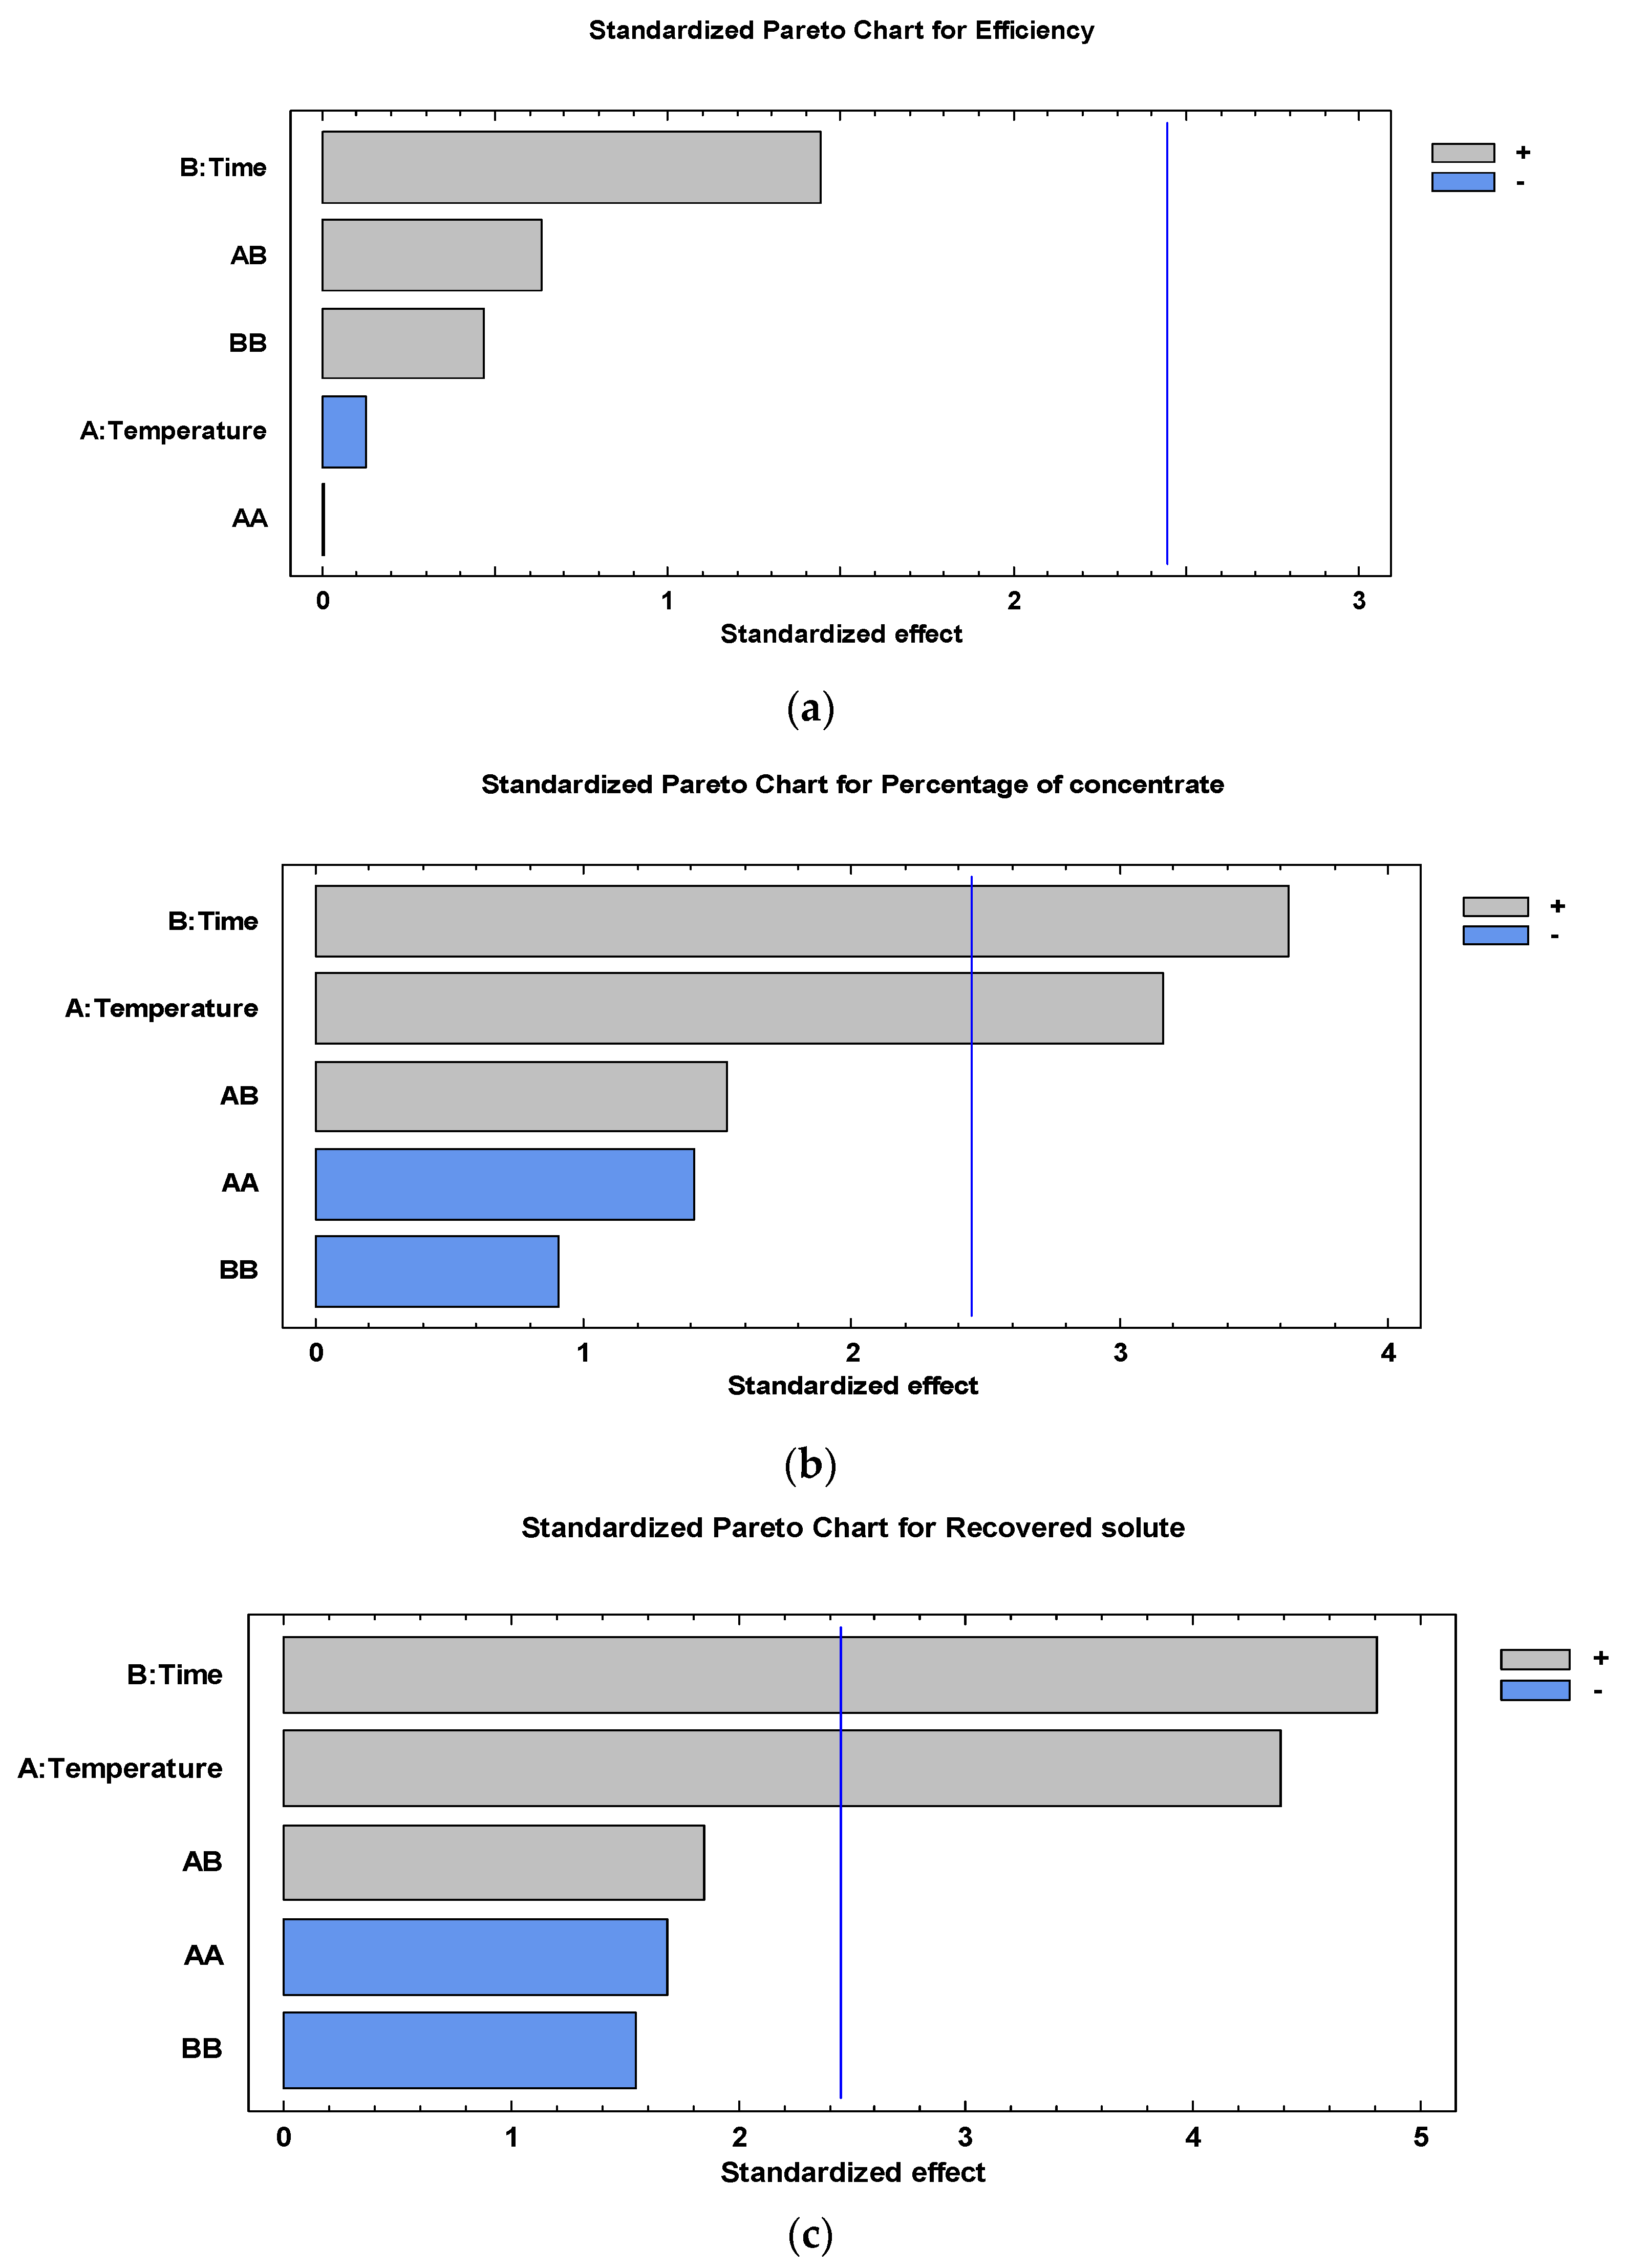
The results of the factorial design were evaluated through multiple linear regression [27,28], random forest regression [29,30] and Gaussian processes [31,32]. The goal was to evaluate how different variables that characterize the process predict the values of the response variables (concentrate, efficiency, and solute). To implement this evaluation, a number of machine learning algorithms were used for the regression. Machine learning algorithms are methods that use data to create models that can be used for prediction.
The multiple linear regression method is the simplest among the algorithms used, and it models the response variable as a linear combination of the predictors. Multiple linear regression serves as a baseline for the comparison of machine learning algorithms. The random forest model is an example of an ensemble method that combines the predictions of several base estimators. In this case, the base estimators corresponded to decision trees that were learned from random subsets of the data. Random forest models can be an appropriate approach to problems with dependencies among predictors, and evaluating whether these dependencies can improve the quality of the predictions is an important question. Finally, Gaussian processes are very powerful models which, by using Gaussian distributions, are able to exploit the interactions among predictors. Furthermore, they can model noisy and stochastic problems, and thus, given the same set of parameters, the target variable can have different values. This is the case for scenarios such as the one considered in this paper, in which for the same setting of the temperature, time and amount of the raw material, the modelled quantity can exhibit variations in different trials due to other factors.
The quality of the predictions was evaluated using the mean squared error (MSE) between the predicted and target value for each data point. If the predictions were perfect, i.e., the predicted value is equal to the real measurement, then the error would be zero. We also computed the R2 statistic that serves as another metric to evaluate the error. R2 is inversely related to the MSE. The three types of models were also compared to each other to determine which model produced the most accurate predictions.
Two different scenarios for the predictor variables were considered. In the first scenario, only two variables were used to predict the target variables: temperature and time. These factors have been reported in previous work as the two most influential variables for the process. In the second scenario, a third predictor variable, namely, the amount of raw material, was added to evaluate whether adding this third variable improved the prediction.

3. Results

Figure 2 shows the results of the concentration of the blueberry juice (in °Brix) after it had been centrifuged at different temperatures and times. As presented in the figure, the highest concentration values were achieved when the time–temperature combination was lower in the first freeze concentration cycle, and this finding is consistent with the literature that demonstrates that the first drops of any thawing process are the richest in solutes [33]. On the other hand, for the lowest temperatures of those studied (5 °C and 10 °C), no significant differences in the concentration results were obtained at 15 and 20 min. However, no significant differences were noted between the treatments corresponding to 10 min and different temperatures, with the exception of the treatment at 15 °C, for which the concentration was the lowest for this time point.
Figure 3 shows the ice fractions and concentrates of two combinations studied. The fractions on the left correspond to the combination of 10 min and 5 °C, which was the treatment that yielded the highest value of the concentrations (49.4 °Brix). However, notably, the solute is retained in the ice; thus, the volume of the concentrate obtained was less than the volume corresponding to the concentrated fraction obtained with the treatment consisting of the combination of 20 min and 15 °C, which is shown on the right. The lowest concentration value (35.9 °Brix) was obtained for this combination.
Table 2 shows the results of the response variables studied, including the efficiency, percentage of concentrate, and solute recovered. Regarding the efficiency (Table 2), no significant differences were noted between treatments. However, regarding the percentage of concentrate and the recovered solute, the highest values were reached with the centrifugation at 15 °C for 20 min for the first cycle of freeze concentration, demonstrating that these conditions represent the optimal experimental conditions to concentrate blueberry juice using the BFC technique.
Figure 4 shows the effects of temperature and time on the three variables studied using Pareto diagrams for each of them. Figure 4a illustrates the effects of time and temperature on efficiency. None of the factors studied affects the efficiency response variable. However, the temperature and time have a positive effect on the percentage of concentrate and recovered solute response variables, as shown in Figure 4b,c.
Figure 5 presents results of the regression models. The graphs illustrate the modelling results; two different scenarios for the predictor variables were considered. In the first scenario, only the temperature and time variables were used to predict target variables. In the second scenario, a third predictor variable, the amount of raw material, was added to determine whether adding this third variable improved the prediction. The quality of the predictions was measured using the MSE (y-axis) and R2 statistics (on top of each bar).
Different insights can be derived from the analysis of Figure 5. The first is that the efficiency, concentrate, and solute target variables are approximated differently by the machine learning algorithms used. Linear regression is a poor approximation for the efficiency and concentrate. For these two quantities, the gains produced by the random forest and Gaussian process models may indicate that interactions among the predictors are important for the approximation. For the solute, the linear model produces the best approximation. When the three factors were considered, the Gaussian process was the best of the three studied models, although the difference between it and the performance of the random forest model was not large.

4. Discussion

The concentration values achieved at 10 min and 5 °C are similar to those reported by Ramos [30] for the cryoconcentration of yacon juice at a centrifuge rotation speed of 4500 rpm and 2 min in the first cycle of freeze concentration. However, these values are higher than those reported by Petzold [23], who obtained 20 °Brix for blueberries and pineapple in the first cryoconcentration cycle at 4600 rpm for 10 min.
The highest achieved result (49.4 °Brix) is approximately two-fold greater than that achieved by Raventós [34] with concentrations of 26.6 °Brix and 27.5 °Brix for the concentration cycle of the cryoconcentration of glucose and fructose, respectively.
An analysis of the results revealed that when the raw material (initial quantity of blueberry juice to concentrate in each trial) was incorporated as a factor in the model, the best predictions achieved by the Gaussian process improved with respect to the first scenario and are clearly more accurate for the concentrate and solute target variables. Regarding the variable of efficiency, the best prediction, which was achieved using the random forest method, is not improved; however, the prediction error is reduced for the other two regression methods considered. The results also show the convenience of considering different machine learning techniques because these methods can provide a wider scope of analysis of the behavior of the process.
Under these conditions and from a practical point of view, the best experimental conditions are 15 °C for 20 min for blueberry juice concentration by BFC. However, new experimental assays are necessary for a more detailed analysis of the nutritional value, sensory elements and stability of the concentrates.
An analysis of the table reveals that the highest values are lower than those reported by Petzold [23] for pineapple juice in the first cycle of freeze concentration. On the other hand, for blueberry juice, the same authors reported values similar to those obtained in this research for the three variables studied. In previous studies using a filter in the centrifugation process, Orellana-Palma et al. [21] obtained higher values for the variables studied. Their results showed that the addition of the filter improved the separation rate in general.

5. Conclusions

The centrifugation-assisted technique effectively removes the concentrated solution from the ice matrix in the freeze concentration of fruit juice. This technique produced high values for the recovered solute (0.66 g solute/g initial solute) and concentrate percentage (39.78%), which were obtained in the first freeze concentration cycle of blueberry juice. The combination of temperature and time affected the concentrate percentage and recovered solute, and the best results were obtained with 20 min of centrifugation at 15 °C. These results point to the importance of evaluating the impact of the different parameters that influence the efficiency of centrifugation-assisted techniques with the goal of identifying the optimal settings. With this purpose, we have also proposed the use of machine learning techniques to predict the quantitative effects of the relevant factors in the response variables of the centrifugation process and demonstrated that the Gaussian process is an effective method for this task. Regarding possible future lines to extend this work, the number of predictors used for the modelling process and the number of measurement intervals will be increased in further studies investigating the centrifugation-assisted process.

Author Contributions

Conceptualization, T.S., J.M. and G.P.; methodology, T.S., G.P.; software, T.S., R.S.; formal analysis, T.S.; investigation, T.S.; writing—original draft preparation, T.S. and G.S.-T.; writing—review and editing, J.M.; project administration, J.M.; funding acquisition, J.M. and R.S. Results were obtained that demonstrate the importance of evaluating the impact of the different parameters that influence the efficiency of techniques assisted by centrifugation in order to identify the optimal settings. All authors have read and agreed to the published version of the manuscript.

Funding

Jorge Moreno and Ricardo Simpson are grateful for the financial support provided by FONDECYT 1160761. Roberto Santana acknowledges support by the Spanish Ministry of Science and Innovation (projects TIN2016-78365-R and PID2019-104966GB-I00), and the Basque Government (projects KK-2020/00049 and IT1244-19, and ELKARTEK program).

Conflicts of Interest

The authors declare that they have no conflicts of interest.

References

  1. Gunathilake, K.D.P.P. Chapter 2: Emerging technologies available for the enhancement of bioactives. In Biotechnological Progress and Beverage Consumption; Academic Press: Cambridge, MA, USA, 2020. [Google Scholar] [CrossRef]
  2. Morison, K.R.; Hartel, R.W. Evaporation and Freeze Concentration. In Handbook of Food Engineering; Heldman, D.R., Lund, D.B., Eds.; CRC Press: New York, NY, USA, 2007; pp. 495–552. [Google Scholar]
  3. Yin, Y.; Yang, Y.; De Lourdes Mendoza, M.; Zhai, S.; Feng, W.; Wang, Y.; Gu, M.; Cai, L.; Zhang, L. Progressive freezing and suspension crystallization methods for tetrahydrofuran recovery from Grignard reagent wastewater. J. Clean. Prod. 2017, 144, 180–186. [Google Scholar] [CrossRef]
  4. Aider, M.; De Halleux, D. Cryoconcentration technology in the bio-food industry: Principles and applications. LWT Food Sci. Technol. 2009, 42, 679–685. [Google Scholar] [CrossRef]
  5. Belén, F.; Sánchez, J.; Hernández, E.; Auleda, J.M.; Raventós, M. One option for the management of wastewater from tofu production: Freeze concentration in a falling-film system. J. Food Eng. 2012, 110, 364–373. [Google Scholar] [CrossRef]
  6. Correa, L.J.; Ruiz, R.Y.; Moreno, F.L. Effect of falling-film freeze concentration on bioactive compounds in aqueous coffee extract. J. Food Process Eng. 2017, 41, 12606. [Google Scholar] [CrossRef]
  7. Zambrano, A.; Ruiz, Y.; Hernández, E.; Raventós, M.; Moreno, F.L. Freeze desalination by the integration of falling film and block freeze-concentration techniques. Desalination 2018, 436, 56–62. [Google Scholar] [CrossRef] [Green Version]
  8. Jin, J.; Yurkow, E.J.; Adler, D.; Lee, T.C. A novel approach to improve the efficiency of block freeze concentration using ice nucleation proteins with altered ice morphology. J. Agric. Food Chem. 2017, 65, 2373–2382. [Google Scholar] [CrossRef]
  9. Yang, Y.; Lu, Y.; Guo, J.; Zhang, X. Application of freeze concentration for fluoride removal from water solution. J. Water Process Eng. 2017, 19, 260–266. [Google Scholar] [CrossRef]
  10. Miyawaki, O.; Kato, S.; Watabe, K. Yield improvement in progressive freeze-concentration by partial melting of ice. J. Food Eng. 2012, 108, 377–382. [Google Scholar] [CrossRef]
  11. Sánchez, J.; Ruiz, Y.; Auleda, J.M.; Hernández, E.; Raventós, M. Freeze concentration in the fruit juices industry. Food Sci. Technol. Int. 2009, 15, 303–315. [Google Scholar] [CrossRef]
  12. Orellana-Palma, P.; Petzold, G.; Pierre, L.; Pensaben, J.M. Protection of polyphenols in blueberry juice by vacuumassisted block freeze concentration. Food Chem. Toxicol. 2017, 109, 1093–1102. [Google Scholar] [CrossRef]
  13. Orellana-Palma, P.; González, Y.; Petzold, G. Improvement of Centrifugal Cryoconcentration by Ice Recovery Applied to Orange Juice. Chem. Eng. Technol. 2019, 42, 925–931. [Google Scholar] [CrossRef]
  14. Jaster, H.; Arend, G.D.; Rezzadori, K.; Chaves, V.C.; Reginatto, F.H.; Cunha Petrus, J.C. Enhancement of antioxidant activity and physicochemical properties of yogurt enriched with concentrated strawberry pulp obtained by block freeze concentration. Food Res. Int. 2017. [Google Scholar] [CrossRef] [PubMed]
  15. Guerra-Valle, M.E.; Moreno, J.; Lillo-Pérez, S.; Petzold, G.; Simpson, R.; Nuñez, H. Enrichment of Apple Slices with Bioactive Compounds from Pomegranate Cryoconcentrated Juice as an Osmodehydration Agent. J. Food Qual. 2018. [Google Scholar] [CrossRef]
  16. Petzold, G.; Orellana, P.; Moreno, J.; Valeria, P. Physicochemical Properties of Cryoconcentrated Orange Juice. Chem. Eng. Trans. 2019, 75, 37–42. [Google Scholar]
  17. Rodrigues de Liza, G.; Verruck, S.; Machado, M.H.; Dantas, A.; Garcia, S.G.; Maran, B.M.; Murakami, F.S.; Prudencio, E.S. Stability of bifidobacteria entrapped in goat’s whey freeze concentrate and inulin as wall materials and powder properties. Food Res. Int. 2020. [Google Scholar] [CrossRef]
  18. Petzold, G.; Aguilera, J.M. Ice morphology: Fundamentals and technological applications in foods. Food Biophys. 2009, 4, 378–396. [Google Scholar] [CrossRef]
  19. Sánchez, J.; Ruiz, Y.; Raventós, M.; Auleda, J.M.; Hernández, E. Progressive freeze concentration of orange juice in a pilot plant falling film. Innov. Food Sci. Emerg. Technol. 2010, 11, 644–651. [Google Scholar] [CrossRef]
  20. Virgen-Ortíz, J.J.; Ibarra-Junquera, V.; Osuna-Castro, J.A.; Escalante-Minakata, P.; Mancilla-Margalli, N.A.; de Ornelas-Paz, J.J. Method to concentrate protein solutions based on dialysis-freezing-centrifugation: Enzyme applications. Anal. Biochem. 2012, 426, 4–12. [Google Scholar] [CrossRef]
  21. Orellana-Palma, P.; Pawan, S.; Takhara, P.S.; Petzold, G. Increasing the separation of block cryoconcentration through a novel centrifugal filter-based method. Sep. Sci. Technol. 2018. [Google Scholar] [CrossRef]
  22. Petzold, G.; Aguilera, J.M. Centrifugal freeze concentration. Innov. Food Sci. Emerg. Technol. 2013, 20, 253–258. [Google Scholar] [CrossRef]
  23. Petzold, G.; Moreno, J.; Lastra, P.; Rojas, K.; Orellana, P. Block freeze concentration assisted by centrifugation applied to blueberry and pineapple juices. Innov. Food Sci. Emerg. Technol. 2015, 30, 192–197. [Google Scholar] [CrossRef]
  24. Jiménez-Carvelo, A.M.; González-Casado, A.; Bagur-González, M.G.; Cuadros-Rodríguez, L. Alternative data mining/machine learning methods for the analytical evaluation of food quality and authenticity—A review. Food Res. Int. 2019, 122, 25–39. [Google Scholar] [CrossRef] [PubMed]
  25. Song, W.; Jiang, N.; Wang, H.; Guo, G. Evaluation of machine learning methods for organic apple authentication based on diffraction grating and image processing. J. Food Compos. Anal. 2020, 88, 103437. [Google Scholar] [CrossRef]
  26. Murphy, K. Machine Learning: A Probabilistic Perspective; MIT Press: Cambridge, MA, USA, 2012. [Google Scholar]
  27. Liaw, A.; Wiener, M. Classification and regression by randomForest. R News 2002, 2, 18–22. [Google Scholar]
  28. Peng, J.; Wei, M.; Hu, Y.; Yang, Y.; Guo, Y.; Zhang, F. Simultaneous Determination of Maltol, Ethyl Maltol, Vanillin, and Ethyl Vanillin in Foods by Isotope Dilution Headspace Solid-Phase Microextraction Coupled with Gas Chromatography-Mass Spectrometry. Food Anal. Methods 2019, 12, 1725–1735. [Google Scholar] [CrossRef]
  29. Williams, C.; Rasmussen, C.E. Gaussian Processes for Machine Learning; MIT Press: Cambridge, MA, USA, 2006; Volume 2. [Google Scholar]
  30. García-Nieto, P.J.; García-Gonzalo, E.; Fernández, J.R.A.; Muñiz, C.D. A New Predictive Model for Evaluating Chlorophyll-a Concentration in Tanes Reservoir by Using a Gaussian Process Regression. Water Resour. Manag. 2020, 34, 4921–4941. [Google Scholar] [CrossRef]
  31. Nakagawa, S.; Schielzeth, H. Repeatability for Gaussian and non-Gaussian data: A practical guide for biologists. Biol. Rev. 2010, 85, 935–956. [Google Scholar] [CrossRef]
  32. Zhang, S.; Tan, Z.; Liu, J.; Xu, Z.; Du, Z. Determination of the food dye indigotine in cream by near-infrared spectroscopy technology combined with random forest model. Spectrochim. Acta Part A Mol. Biomol. Spectrosc. 2020, 227, 117551. [Google Scholar] [CrossRef]
  33. Ramos, J.F.; Huamán, C.L. Crioconcentración del zumo de yacón (Smallantus sonchifolius). Infinitum 2017, 7, 1. [Google Scholar]
  34. Raventós, M.; Hernández, E.; Auleda, J.; Ibarz, A. Concentration of aqueous sugar solutions in a multi-plate cryoconcentrator. J. Food Eng. 2007, 79, 577–585. [Google Scholar] [CrossRef]
Figure 1. Schematic diagram of the experimental protocol.
Applsci 10 09130 g001
Figure 2. Results of concentration (°Brix) at different times and temperatures; a,b,c indicates there are significant differences at p ≤ 0.05, and b,d indicates there are no significant differences at p ≤ 0.05, both according to a least significant difference (LSD) test.
Applsci 10 09130 g002
Figure 3. Ice and concentrate fractions from two of the time–temperature combinations studied. The ice fraction and concentrated fraction at 5 °C for 10 min (left) and the ice fraction and concentrated fraction at 15 °C for 20 min (right).
Applsci 10 09130 g003
Figure 4. Effect of temperature and time on the (a) efficiency, (b) percentage of concentrate and (c) recuperated solute.
Applsci 10 09130 g004
Figure 5. Results of the regression models: (a) efficiency, (b) percentage of concentrate and (c) recuperated solute.
Applsci 10 09130 g005
Table 1. Factors and levels of the experimental design.
FactorsLevels
Temperature (T), °C5101520
Time (t), min101520
Table 2. Results of efficiency, percentage concentrate and recovered solute.
TreatmentTemperature
(°C)
Time
(min)
Efficiency
(%)
Percentage of Concentrate
(%)
Recovered Solute
(g Solute/g Initial of Solute)
1102068.38 ± 2.11 a17.68 ± 3.06 a0.39 ± 0.06 a
2151566.80 ± 1.99 a25.69 ± 3.55 b0.51 ± 0.06 b
3152067.00 ± 2.40 a39.78 ± 2.03 c0.66 ± 0.03 c
451564.76 ± 5.84 a11.55 ± 1.51 d0.26 ± 0.03 d
5101567.29 ± 2.35 a20.63 ± 2.71 e0.44 ± 0.04 e
6201564.58 ± 4.17 a26.45 ± 4.51 b0.52 ± 0.06 b
751066.90 ± 2.06 a9.34 ± 1.13 f0.23 ± 0.03 f
8101066.07 ± 2.46 a8.75 ± 0.36 f0.22 ± 0.01 f
952066.38 ± 2.15 a13.85 ± 2.69 d0.31 ± 0.05 a
10151061.87 ± 7.52 a15.15 ± 4.11 a0.32 ± 0.10 a
11202068.02 ± 2.75 a28.51 ± 1.21 g0.56 ± 0.03 b
12201066.81 ± 1.00 a12.02 ± 0.79 d±0.02 a
Different letters in each column indicate significant differences at p ≤ 0.05, according to a least significant difference (LSD) test.
Publisher’s Note: MDPI stays neutral with regard to jurisdictional claims in published maps and institutional affiliations.

