Article

Pollution Characteristics of Particulate Matter (PM2.5 and PM10) and Constituent Carbonaceous Aerosols in a South Asian Future Megacity

1
Department of Environmental Sciences & Engineering, Government College University Faisalabad, Faisalabad 38000, Pakistan
2
Environmental Science Centre, Qatar University, Doha P.O. Box 2713, Qatar
3
Department of Farm Machinery & Power, Faculty of Agricultural Engineering & Technology, University of Agriculture, Faisalabad 38040, Pakistan
4
Leibniz Institute for Agricultural Engineering and Bioeconomy, Max-Eyth-Allee 100, 14469 Potsdam-Bornim, Germany
*
Author to whom correspondence should be addressed.
Appl. Sci. 2020, 10(24), 8864; https://doi.org/10.3390/app10248864
Submission received: 29 October 2020 / Revised: 6 December 2020 / Accepted: 7 December 2020 / Published: 11 December 2020
(This article belongs to the Special Issue Advances in Air Quality Monitoring and Assessment)

Abstract

:
The future megacity of Faisalabad is of prime interest when considering environmental health because of its bulky population and abundant industrial and anthropogenic sources of coarse particles (PM10) and fine airborne particulate matter (PM2.5). The current study was aimed to investigate the concentration level of PM2.5 and PM10, also the characterization of carbonaceous aerosols including organic carbon (OC), elemental carbon (EC) and total carbon (TC) in PM2.5 and PM10 samples collected from five different sectors (residential, health, commercial, industrial, and vehicular zone). The data presented here are the first of their kind in this sprawling city having industries and agricultural activities side by side. Results of the study revealed that the mass concentration of PM2.5 and PM10 is at an elevated level throughout Faisalabad, with ambient PM2.5 and PM10 points that constantly exceeded the 24-h standards of US-EPA, and National Environment Quality Standards (NEQS) which poses harmful effects on the quality of air and health. The total carbon concentration varied between 21.33 and 206.84 μg/m3, and 26.08 and 211.15 μg/m3 with an average of 119.16 ± 64.91 μg/m3 and 124.71 ± 64.38 μg/m3 for PM2.5 in summer and winter seasons, respectively. For PM10, the concentration of TC varied from 34.52 to 289.21 μg/m3 with an average of 181.50 ± 87.38 μg/m3 (for summer season) and it ranged between 44.04 and 300.02 μg/m3 with an average of 191.04 ± 87.98 μg/m3 (winter season), respectively. No significant difference between particulate concentration and weather parameters was observed. Similarly, results of air quality index (AQI) and pollution index (PI) stated that the air quality of Faisalabad ranges from poor to severely pollute. In terms of AQI, moderate pollution was recorded on sampling sites in the following order; Ittehad Welfare Dispensary > Saleemi Chowk > Kashmir Road > Pepsi Factory, while at Nazria Pakistan Square and Allied Hospital, higher AQI values were recorded. The analysis and results presented in this study can be used by policy-makers to apply rigorous strategies that decrease air pollution and the associated health effects in Faisalabad.

1. Introduction

In many developing countries, increasing industrialization and overpopulation becomes the reason for escalating air pollution [1]. According to various researches conducted in high-income countries situated in the Asian region, the level of many air pollutants is normally beyond the ambient air quality standards and WHO guidelines. In many developing countries, the use of non-renewable fuel like biomass and diesel is associated with the increasing level of air pollution at the regional level. Airborne particulate matter is abundant in the atmosphere and is the foremost indicator of the quality of air in a specified area. Chemical composition, concentration and size of particulate matter varied widely and are delimited universally under acceptable standards built on size elements ranging from PM2.5 to PM10 to Total Suspended Particles (TSP), while PM4 was also identified as the respirable size fraction [2]. Particulate matter instigates from a diversity of anthropogenic (e.g., rapid industrialization, agricultural activities, refineries, waste incineration, biomass burning, motor vehicles, utilities, brick kiln, industrial emissions power plants, factories, large population and heavy traffic) are responsible for bad air quality in the cities due to elevated levels of gaseous and particulate pollutants [3] and natural (e.g., dust storm and sea spray) sources, besides secondary formation processes. However, also mineral dust transport from deserted areas is considered a significant source for regional pollution in Asia [4]. Henceforth, for the air quality management and epidemiological studies, the assessment of the concentration of atmospheric particulate matter (PM) and its associated toxic constituents is a prerequisite [5]. It was consistently confirmed by epidemiological studies that there is a strong association between ambient particulate matter comprising toxic components and cardiovascular- and respiratory-related upsurges in mortality and morbidity, particularly in urban areas [6]. This connection has been revealed to be stronger for PM2.5 rather than for PM10 or total suspended particles since PM2.5 can infiltrate deep into the alveolar areas of the human lungs [6]. The transport and distribution of particulate matter in the atmosphere are distinctly allied with meteorological parameters such as air temperature, relative humidity, atmospheric pressure, wind direction, speed, and rainfall [7]. In various parts of the world, different monitoring programs on atmospheric PM have been directed which exposed varied instabilities and disproportions among the trace element constituents and particulate matter [8].
Components of carbonaceous aerosol, elemental carbon (EC) and organic carbon (OC), account for a large element of atmospheric particulate matter and, on average, subsidize 20–35% of coarse particulate and 20–45% of fine particulate [9]. Carbonaceous aerosols have a chief role in the interactions of light-particles within the atmosphere and are one of the significant components of fine and coarse particulate matter; they are therefore associated with the negative climatic and environmental impacts and the worsening in public health and air quality [10]. Elemental carbon is often used as a substitute for black carbon (BC) and is discharged into the atmosphere mostly through the processes of combustion [11]. Elemental carbon is primarily accountable for the absorption of light in the atmosphere, which sturdily influence the radiative balance of the earth [12]. The six main sources of elemental carbon have been recognized using organic tracers as coal combustion, biomass burning, vehicle exhaust, cigarette smoke, cooking and vegetative detritus [13]. Carbonaceous aerosols were found dominant in PM2.5 (which is attained from agricultural waste and wood-fuel burning) and have a strong effect on the decline in visibility and air-quality and also stimulates radiative forcing on a regional scale [14].
In Pakistan, control of air pollution has not yet become a democratic issue because of a lack of suitable information for policy and decision-makers, though some infrequent reports that identify airborne particulate matter as a great health and environmental concern in urban regions of Pakistan are present [15]. Generally, the concentration of particulate matter is many folds higher than the acceptable limits documented by the World Health Organization (WHO), National Environmental Quality Standards (NEQS) and the United States Environmental Protection Agency (US-EPA). According to the World Bank [16], the annual burden of health because of particulate matter was 1% of the GDP and is accountable for 700 deaths among children and 22,000 premature deaths amongst adults in Pakistan. However, due to the absence of air quality management competencies, the country is suffering from the deterioration of air quality. Evidence from many international bodies and governmental organizations has indicated that air pollution is a momentous risk to the health of residents, environment and quality of life [17]. According to a study directed by the World Health Organization, Bombay, Calcutta and Tehran were found to be the most contaminated cities in Asia [18]. Similarly, Faisalabad (the textile city of Pakistan) is also highlighted to be an extremely polluted city in this study. Due to increased industrialization and construction of commercial zones and rapid urbanization, the atmosphere of the city is getting worst day by day [19]. This state of concern stimulated us to conduct a comprehensive study on the status of air pollution in Faisalabad. As a result of the burning issue of air pollution and associated health impacts, a study was planned to examine the quality of air in Faisalabad city for which 12 different sites were selected and categorized as residential, commercial, industrial, and health centers.
Keeping in view the facts discussed above, the present study was conducted with the following objectives: (a) to measure the quality of air with its allied consequences within varying activity zones of Faisalabad city; (b) to compare the ambient air quality of Faisalabad with air pollution indexes such as NEQS -Pakistan, National Ambient Air Quality Standards (NAAQS)-US-EPA and WHO; and (c) to provide an opportunity to conduct additional studies on source identification, impact assessment, and trend analysis for this zone. It is expected that the current study will be supportive for designing and establishing emission regulations and abatement strategies in the future.

2. Methodology

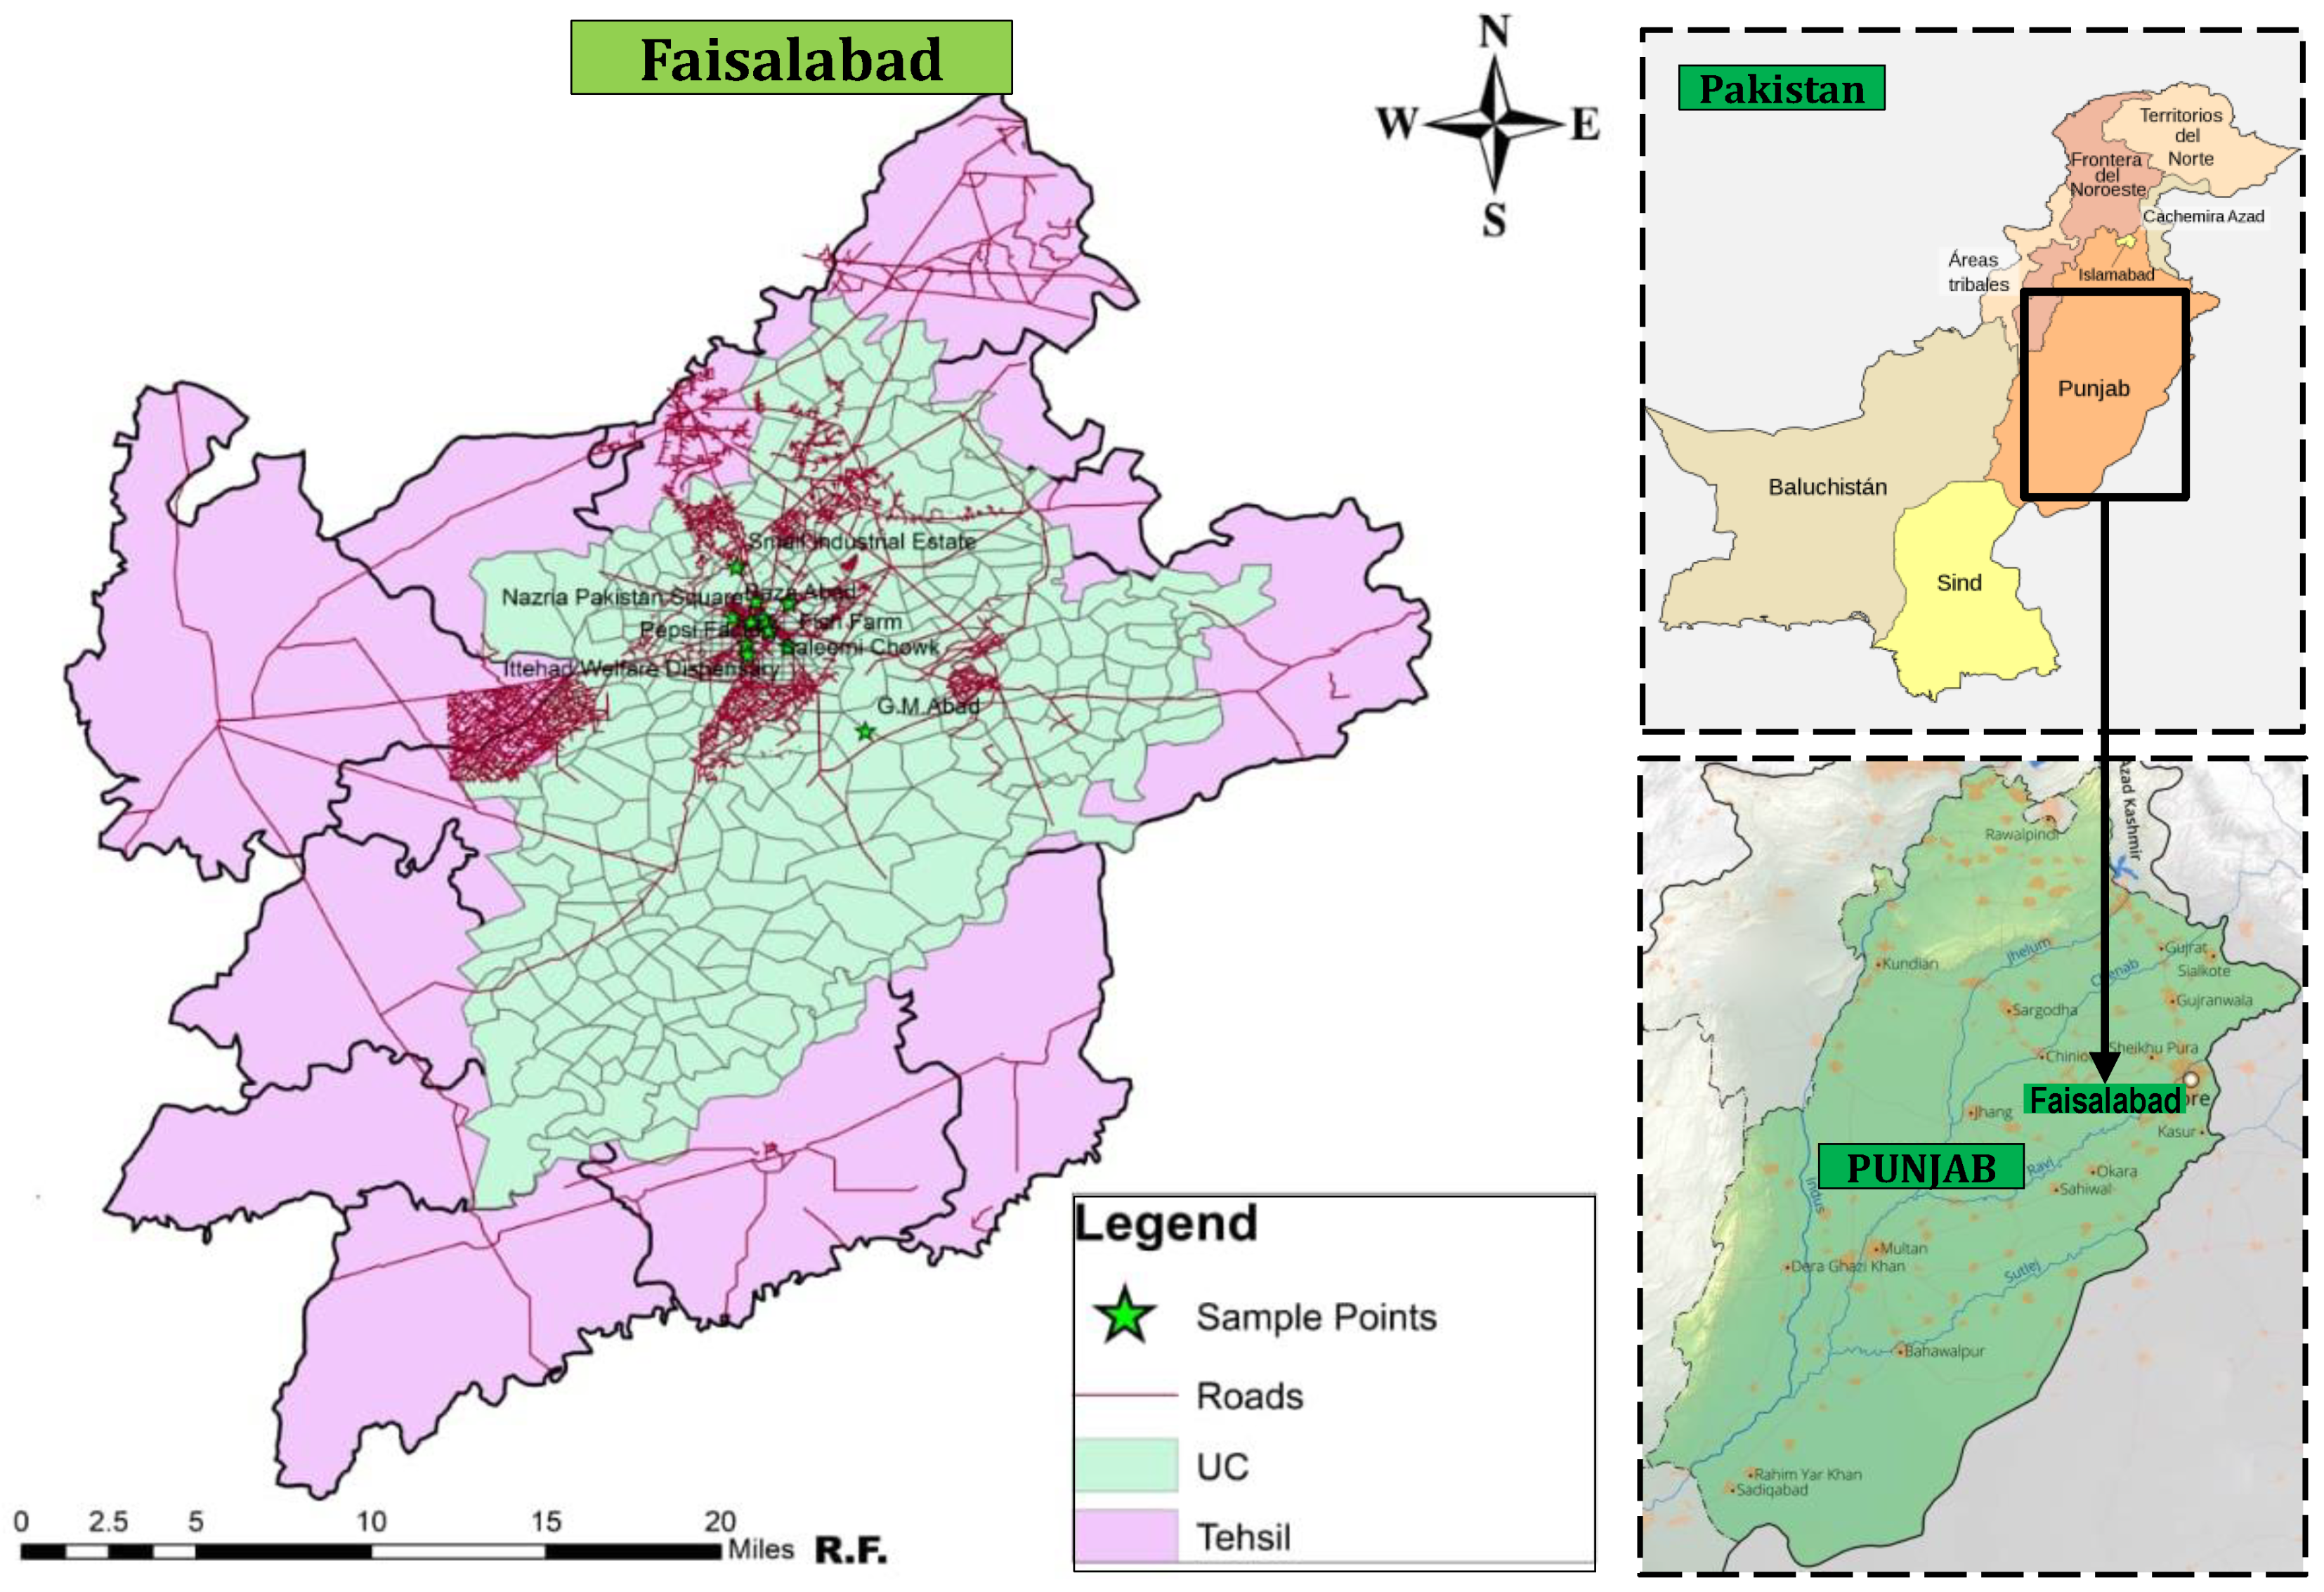
2.1. Study Area and Sampling Sites

Faisalabad is the third-largest city of Pakistan and a major industrial hub (dominated by textile and chemical industries); consequently, the air quality of the city is a major environmental problem. It covers an area of 1230 km2 and is occupied by more than four million people. The summer season is very hot with a humid climate while a cold winter (falls to 0 °C some days) is experienced by the Faisalabad city. The climate of the city touches extreme hotness and humidity during summer and cold during winter. The sampling sites were banquets around Faisalabad and its vicinities. Twelve sampling sites were nominated based on current anthropogenic activities accountable for atmospheric pollution, and the dominant direction of wind for pollutant dispersion and distribution in the area. The locations were selected based on the zones in the city. The selected locations are comprised of medical units, residential areas, commercial areas, industrial areas, and automobiles rich areas. The average wind speed of 3–6 km in winter and 6–13 km in summer was observed. The map showing the locations on the Faisalabad (Figure 1) represents the coordinates of the location within Faisalabad geography.

2.2. Data Collection

Data of meteorological parameters were obtained from Agromet. The PM concentrations were determined by the first author herself. We took the samples from all the locations and then measurements were made in the Lab. We took sample readings sector-wise and readings for all the residential sites were taken at the same time. A similar trend was followed for commercial, industrial, health, and automobile sites. At Provincial and Federal EPAs, Data Logging systems retrieve the data about the quality of ambient air from air monitoring stations with the help of data processing software. The seasonal average was intended to find out the difference in the mass concentration of PM2.5 in summer and winter seasons. For this study, 12 discrete sampling sites under five diverse sectors (residential, health, commercial, industrial, and automobile vehicles) were selected for the evaluation of PM2.5 and PM10 with the help of high air volume sampler. The interpretations were taken at three diverse times (morning, noon, and evening) daily from November 1 to December 31 for winter and from May 1 to June 30 for summer. It should be noted that wind speed and direction influence the rate of diffusion of pollution. The temperature inversion is also directly linked to solar radiation making the air softer, hence the air converts into fog because pollutants and dust are no longer raised from the surface. This can become a problem in metropolises where numerous pollutants exist. The data of temperature and radiation used in this study was collected from the Agricultural Metrological Cell Agromet Bulletin.

2.3. Sample Analysis (Chemical, Gravimetric, and Carbonaceous Aerosols)

After sample collection, the filter papers were kept in exact environmental conditions at a relative humidity of 30–40% and temperature of 20–23 °C for 24 h as per the US-EPA standard. Before mass analysis, the filter paper with fine and coarse particulates samples was equilibrated for 24 h in silica gel desiccators to abolish the effect of humidity and to attain accurate particulate matter measurements. The PM2.5 and PM10 masses of each sample were determined gravimetrically by deducting the initial average mass of the blank filter from the final average mass of the sampled filter. Gravimetric analysis is the determination of particulate concentration based on weight difference. Individual filters (Teflon®, 46.2 mm) were weighed on an electronic micro-balance pre and post field sampling. Particulate matter ˂2.5 µm was collected from ambient air on the filters throughout the sample duration of 24 h. The net variances between pre- and post-sampling filter weights were used to estimate the mass concentration in the ambient air of the city. After post weighing, filters can be stored for a minimum of one year. Using the post-sample and pre-sample filter weights, the total filter mass gain (PM2.5) and the concentration of PM10 were respectively calculated from Equation (1) and Equation (2):
PM2.5 = (MPost − MPre)(103)/MPre
PM10 = (Wf − Wi)(106)/V
Here PM2.5 is the total mass gain in µg, MPost is the post sample filter weight in mg, MPre is the pre-sample filter weight in µg, Wf is the filter paper weight, Wi is the initial mass of filter paper, and V is the total air sampled in m3. In the current study, elemental carbon was determined by a two-step combustion method described by [20]. Filters were heated for 2 h at 340 °C in an oxygen atmosphere to remove organic carbon (OC). The calibration procedure was done using tartaric acid dyed in aluminum foil. While, total carbon was determined by a combustion method, where all material on the filter is combusted in pure oxygen at 1000 °C and the resulting CO2 is measured by non-dispersive IR photometry (NDIR, Maihak) [21].

2.4. Air Quality and Pollution Index

An Air Quality Index is defined as a complete scheme that converts the weighed values of parameters related to individual air pollution (e.g., the concentration of pollutant) into a sole number or set of numbers [22]. Air Quality Index (AQI) is a tool to detect the present scenario of air quality. AQI was calculated based on the arithmetic mean of the ratio of the concentration of pollutants to the standard value of that pollutant such as PM10, PM2.5, NO2, and SO2. The average is then multiplied by 100 to arrive at the AQI index. The pollutant AQI and the pollution index (PI) of the potentially noxious element were respectively derived from Equations (3) and (4):
AQI = W C / Cs
PI = Cn / Bn
where W is the pollutant weighted, C is the observed value (PM2.5, PM10, SO2 and NO2), Cs is the CPCB standard for the residential area [23], Bn is the background concentration, and Cn is the measured concentration of the element. It should be noted that in Pakistan, the National Air Quality Index is followed. Moreover, it should be highlighted that the pollution index of the potentially contaminated elements is the ratio between the concentration of toxic elements and the reference background concentration of the consistent elements obtained from a previous published study [24].

3. Results

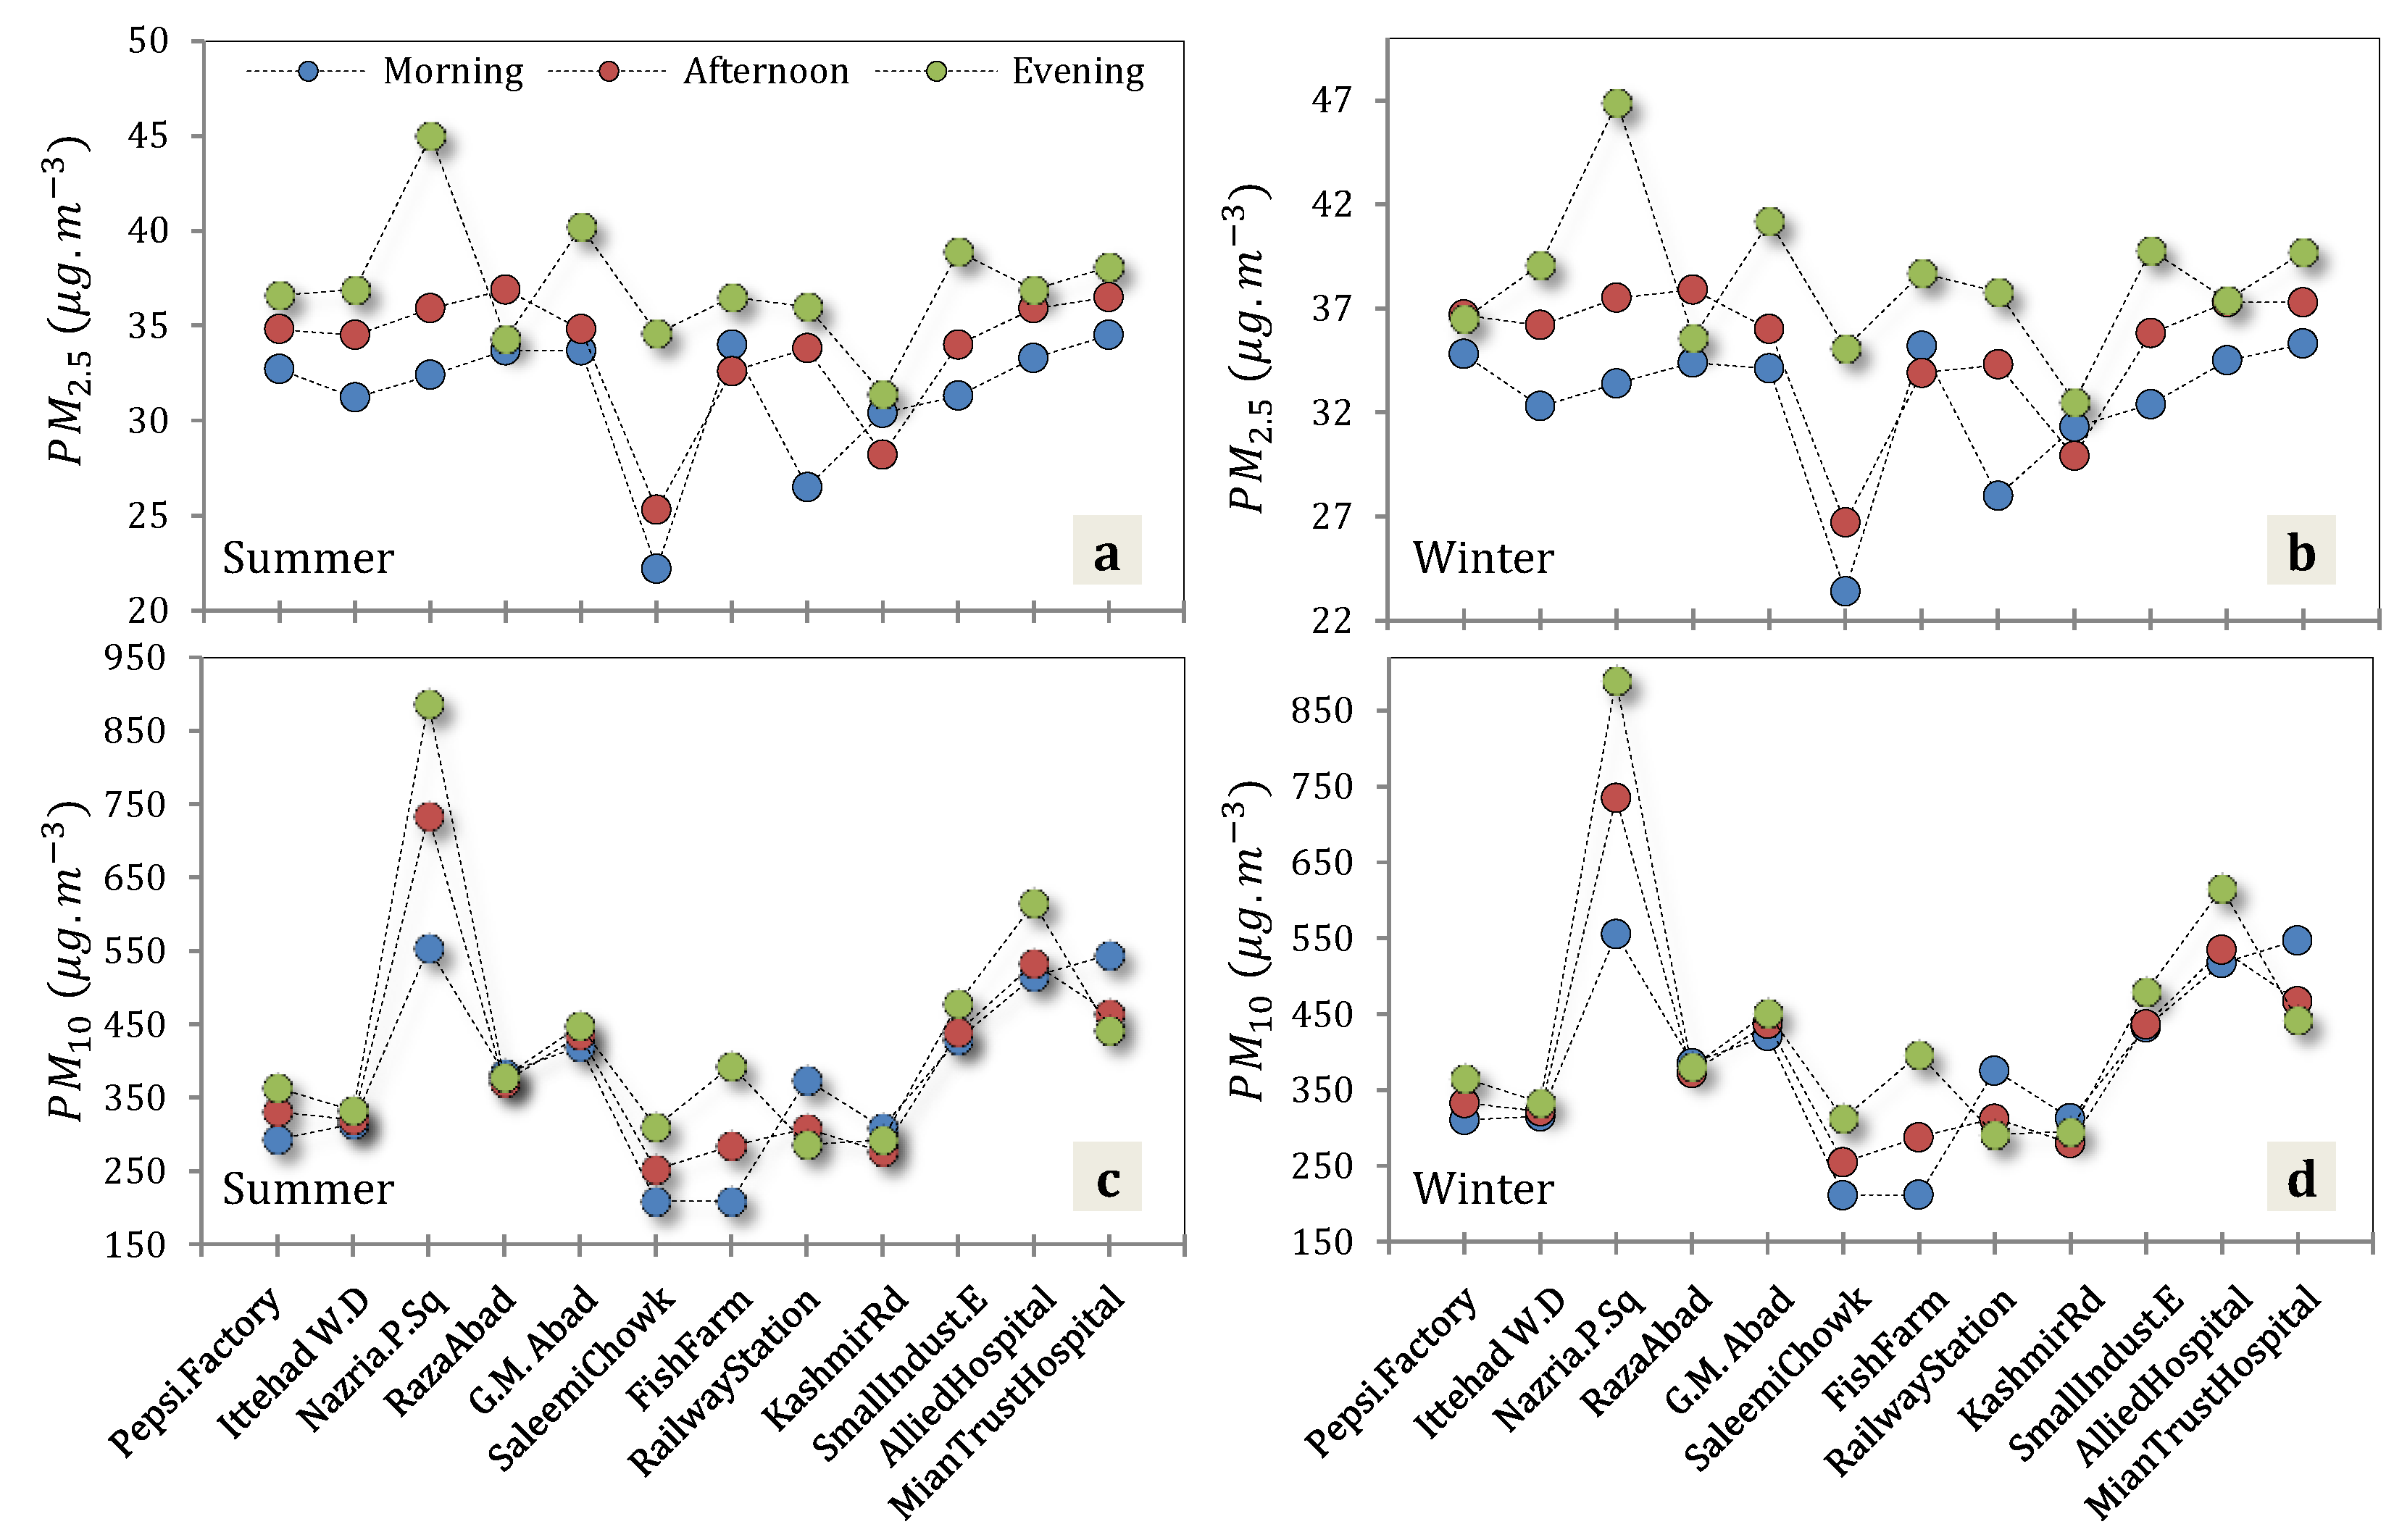
3.1. Mass Concentration of PM2.5 and PM10 in Winter Season

The results of the present investigations in Faisalabad city for which 12 different sites were selected and categorized as residential, commercial, industrial and health centers are presented (Figure 2). The concentration of PM2.5 had the following decreasing order in the air samples collected near medical centers of Mian Trust Hospital (38.50 ± 0.30 μg/m3), Ittehad Welfare Dispensary (37.35 + 0.45 μg/m3), Allied Hospital (36.65 ± 0.27 μg/m3). While, in residential areas, the highest concentration of fine particulate was found in Ghulam Muhammad Abad (39.1 ± 0.50 μg/m3) followed by Raza Abad (35.2 ± 0.23 μg/m3), Saleemi Chowk (33.83 ± 0.74 μg/m3), Kashmir Road (32.25 ± 0.14 μg/m3). In the selected commercial areas, Nazria Pakistan (43.63 ± 0.59 μg/m3) was the most polluted site of the city. The average concentration of PM2.5 in small industrial estate was recorded as (37.93 ± 0.19 μg/m3) followed by Pepsi factory area (37.17 ± 0.62 μg/m3); while in and near transport station (35.08 ± 0.61 μg/m3) was analyzed. In contrast, the highest concentration level of PM10 was found in the samples collected from Nazria Pakistan (800.85 ± 0.93 μg/m3) followed by Mian Trust Hospital (586.6 ± 3.88 μg/m3), Allied Hospital (584.62 ± 3.41 μg/m3), Small Industrial Estate (469.1 ± 0.57 μg/m3) and Ghulam Muhammad Abad (440.2 ± 0.10 μg/m3); while the lowest concentration was analyzed in the ambient air of Saleemi Chowk (280.18 ± 0.12 μg/m3). The average particulate concentration can be compared with guideline values proposed by WHO, US-EPA and NEQS. During the present study, the concentration of PM2.5 was within the guideline value of the US-EPA and NEQS (35 μg/m3) but still higher than the WHO guideline value of 25μg/m3 [25] for 24 h average, while coarse particles were drastically exceeding the safe limits of all the quality standards. The composition of particulate matter is strongly reliant with its sources, i.e., anthropogenic or natural (Figure 2).

3.2. Mass Concentration of PM2.5 and PM10 in Summer Season

Figure 2 shows the mass concentration of fine (PM2.5) and coarse (PM10) particles calculated from the samples collected during the winter (Dec 2016 to Jan 2017) and summer (May to June 2017) seasons from different selected areas of Faisalabad. It was clear from the results that the concentration levels of both particulates were lower in the summer season as compared to the winter season. According to the results, it was cleared that the contamination level that the concentration level of both particulates was lower in the summer season as compared to the winter season. According to the results, the highest concentration of PM2.5 was found in the air samples collected from Nazria Pakistan (42.5 ± 0.57 μg/m3) followed by a Ghulam Muhammad Abad (38.4 ± 0.34 μg/m3), Mian Trust Hospital and Small Industrial Estate air samples (36.9 ± 0.34 μg/m3). While, the mass volume of PM2.5 was lower in the air samples of Station Chowk (33.5 ± 0.35 μg/m3), Raza Abad (34.2 ± 0.28 μg/m3), Saleemi Chowk (31.8 ± 0.94 μg/m3) and Kashmir Road (31.2 ± 0.21 μg/m3) when compared with US-EPA and NEQS guidelines rather than WHO safe limits. The rest of the areas were slightly higher in PM2.5 concentrations than US-EPA and NEQS safe limits but still highly polluted if compared with WHO guidelines. Table 1 represents the concentration values of coarse particles obtained after analysis. The decreasing order was followed as Nazria Pakistan (800.6 ± 2.16 μg/m3), Allied Hospital (477.4 ± 3.7 μg/m3), Mian Trust Hospital (477.3 ± 0.82 μg/m3), Small Industrial Estate (465.4 ± 1.16 μg/m3), Ghulam Muhammad Abad (440.1 ± 0.13 μg/m3), Raza Abad (380.1 ± 0.08 μg/m3) with the lowest value obtained at Kashmir Road (297.3 ± 0.50 μg/m3). According to the results, the mass concentration of PM10 is exceeding the safe guidelines of all the selected air quality standards throughout the study area.

3.3. Seasonal Impact on PM2.5 and PM10 Concentration

Figure 2 represents the average concentration of PM2.5 and PM10 in the long summer and winter seasons during the study period. Figure 2 shows the highest fine particulates concentration in a commercial area on the average 39.18 ± 4.70 µg/m3 and 40.73 ± 2.9 µg/m3 with the lowest obtained concentration in the residential sector ranging from 33.91 ± 3.27 µg/m3 and 35.1 ± 2.93 µg/m3 for summer and winter season, respectively. The WHO safe limit for PM2.5 is 25 µg/m3 and for PM10 is 50 µg/m3 (WHO, 2005). Similarly, the US-EPA and NEQS safe limit for PM2.5 is 35 µg/m3 and PM10 is 150 µg/m3 [26,27]. Coarse particles (PM10) were similar in trend as shown by PM2.5 with decreasing trend as commercial areas, hospital areas, industrial areas, automobile station and residential areas were in the range of 575.19 ± 66.26 μg/m3, 499.81 ± 148.62 μg/m3, 409.63 ± 59.44 μg/m3, 379.63 ± 0.81 μg/m3 and 350.98 ± 74.29 μg/m3 in winter and 573.14 ± 321.64 μg/m3, 427.52 ± 86.30 μg/m3, 405.63 ± 84.49 μg/m3, 349.41 ± 74.48 μg/m3 and 349.46 ± 74.49 μg/m3 in the summer season, respectively. Correspondingly, Figure 2 showed a strong positive correlation between PM2.5 and PM10 in both winter and summer seasons on average.

3.4. Analysis of Carbonaceous Aerosols in fine (PM2.5) and Coarse Particulate (PM10) Samples

The concentration level of carbonaceous aerosols is presented in Figure 3, Figure 4 and Figure 5 for summer and winter seasons. It was clear that concentration of EC and OC was higher in winter (Figure 3 and Figure 4) which was quite similar with previous studies. According to the results, EC was found in low concentration on average in the samples of fine particles collected from Kashmir Road (8.56 ± 1.86 μg/m3) in summer season while highest EC contamination was found in the ambient air of Nazria Pakistan (89.67 ± 1.52 μg/m3). A similar trend was found for OC with the lowest concentration in the PM2.5 samples collected from Kashmir Road (19.93 ± 0.42 μg/m3) categorized as one of the residential sites, while the highest values were obtained in the ambient air of Nazria Pakistan (178.4 ± 3.51 μg/m3) nominated as the busiest commercial zone of Faisalabad with a variety of businesses (Figure 4).
When considering TC for the investigated sites (Figure 5), it was observed that Nazria Pakistan was heavily contaminated (268.08 ± 5.03 μg/m3) followed by Small Industrial Estate (248.23 ± 5.79 μg/m3), Fish Farm (235.68 ± 5.02 μg/m3), Allied Hospital (224.34 ± 3.62 μg/m3), Vehicular station (223.21 ± 3.82 μg/m3), Mian Trust Hospital (202.77 ± 8.42 μg/m3) and Pepsi Factory (184.84 ± 4.27 μg/m3) with positive OC/EC correlation which indicates the common source of emission of TC in these zones. While, residential areas (G.M Abad, Saleemi Chowk, Raza Abad and Kashmir Road) were less contaminated (114.71 ± 2.76 μg/m3; 64.97 ± 3.58 μg/m3; 51.16 ± 3.14 μg/m3; and 28.49 ± 2.27 μg/m3, respectively), as compared to the other sites indicating negative OC/EC correlation. While samples of fine particulates collected in the winter season from the same investigating sites were analyzed for carbonaceous aerosol concentration. The levels of EC and OC were higher in winter as compared to the summer season. This may be due to the more wood and fossil fuel burning to warm up the surroundings as well as extra consumption of diesel and petrol by vehicles to warm up the engines in sizzling cold weather. The concentration of TC was much higher in the ambient air of Nazria Pakistan (277.5 ± 4.9 μg/m3) followed by Small Industrial Estate (262.01 ± 3.68 μg/m3), Fish Farm (248.07 ± 5.28 μg/m3), Allied Hospital (237.13 ± 2.89 μg/m3), Vehicular Station (234.4 ± 4.08 μg/m3), Mian Trust Hospital (215.97 ± 8.82 μg/m3), Pepsi Factory (194.27 ± 4.30 μg/m3) and Ittehad Welfare Dispensary (142.58 ± 7.69 μg/m3). On the other side, mix community of domestic zones showed less concentration of both EC and OC but still falls in contamination categories that are not safe for human health. Kashmir Road was detected with the least concentration of TC (38 ± 3.43 μg/m3) while Ghulam Muhammad Abad was higher in TC (130.04 ± 2.6 μg/m3) concentration in the residential zone. A positive OC/EC correlation was observed in the maximum of the investigating sites in the winter season. Samples of coarse particulate were also analyzed to evaluate the concentration level of carbonaceous aerosols collected from the investigating sites of Faisalabad city for summer and winter seasons, respectively.
We found similar trends of concentration level as experienced with aerosols available in fine particulates but higher in concentration than observed in PM2.5 samples. Commercial areas of Faisalabad were enriched with TC (289.21 ± 2.75 μg/m3 and 300.02 ± 3.25 μg/m3 for Nazria Pakistan and 253.06 ± 5.59 μg/m3 and 264.36 ± 4.16 μg/m3 for Fish Farm) at an elevated level among all the sites. Coarse particulate samples collected from the Small Industrial Estate were also found to be extremely high (267.19 ± 4.28 μg/m3 and 277.28 ± 3.16 μg/m3) after Nazria Pakistan followed by Vehicular Station (243.75 ± 3.66 μg/m3 and 252.85 ± 2.9 μg/m3), Allied Hospital (242.58 ± 5.24 μg/m3 and 251.93 ± 4.44 μg/m3), Mian Trust Hospital (221.4 ± 6.51 μg/m3 and 228.27 ± 5.53 μg/m3) and Ittehad Welfare Dispensary (151.28 ± 12.09 μg/m3 and 167.31 ± 4.57 μg/m3) for summer and winter seasons, respectively. Concentration level of carbonaceous aerosol was higher in Ghulam Muhammad Abad (132.62 ± 3.4 μg/m3 and 142.95 ± 3.65 μg/m3) while considering the residential zone of the city followed by Saleemi Chowk (76.95 ± 4.87 μg/m3 and 76.95 ± 3.9 μg/m3), Raza Abad (61.57 ± 3 μg/m3 and 74.4 ± 2.32 μg/m3) and Kashmir Road (34.52 ± 2.02 μg/m3 and 44.04 ± 1.97 μg/m3) for both the seasons accordingly.

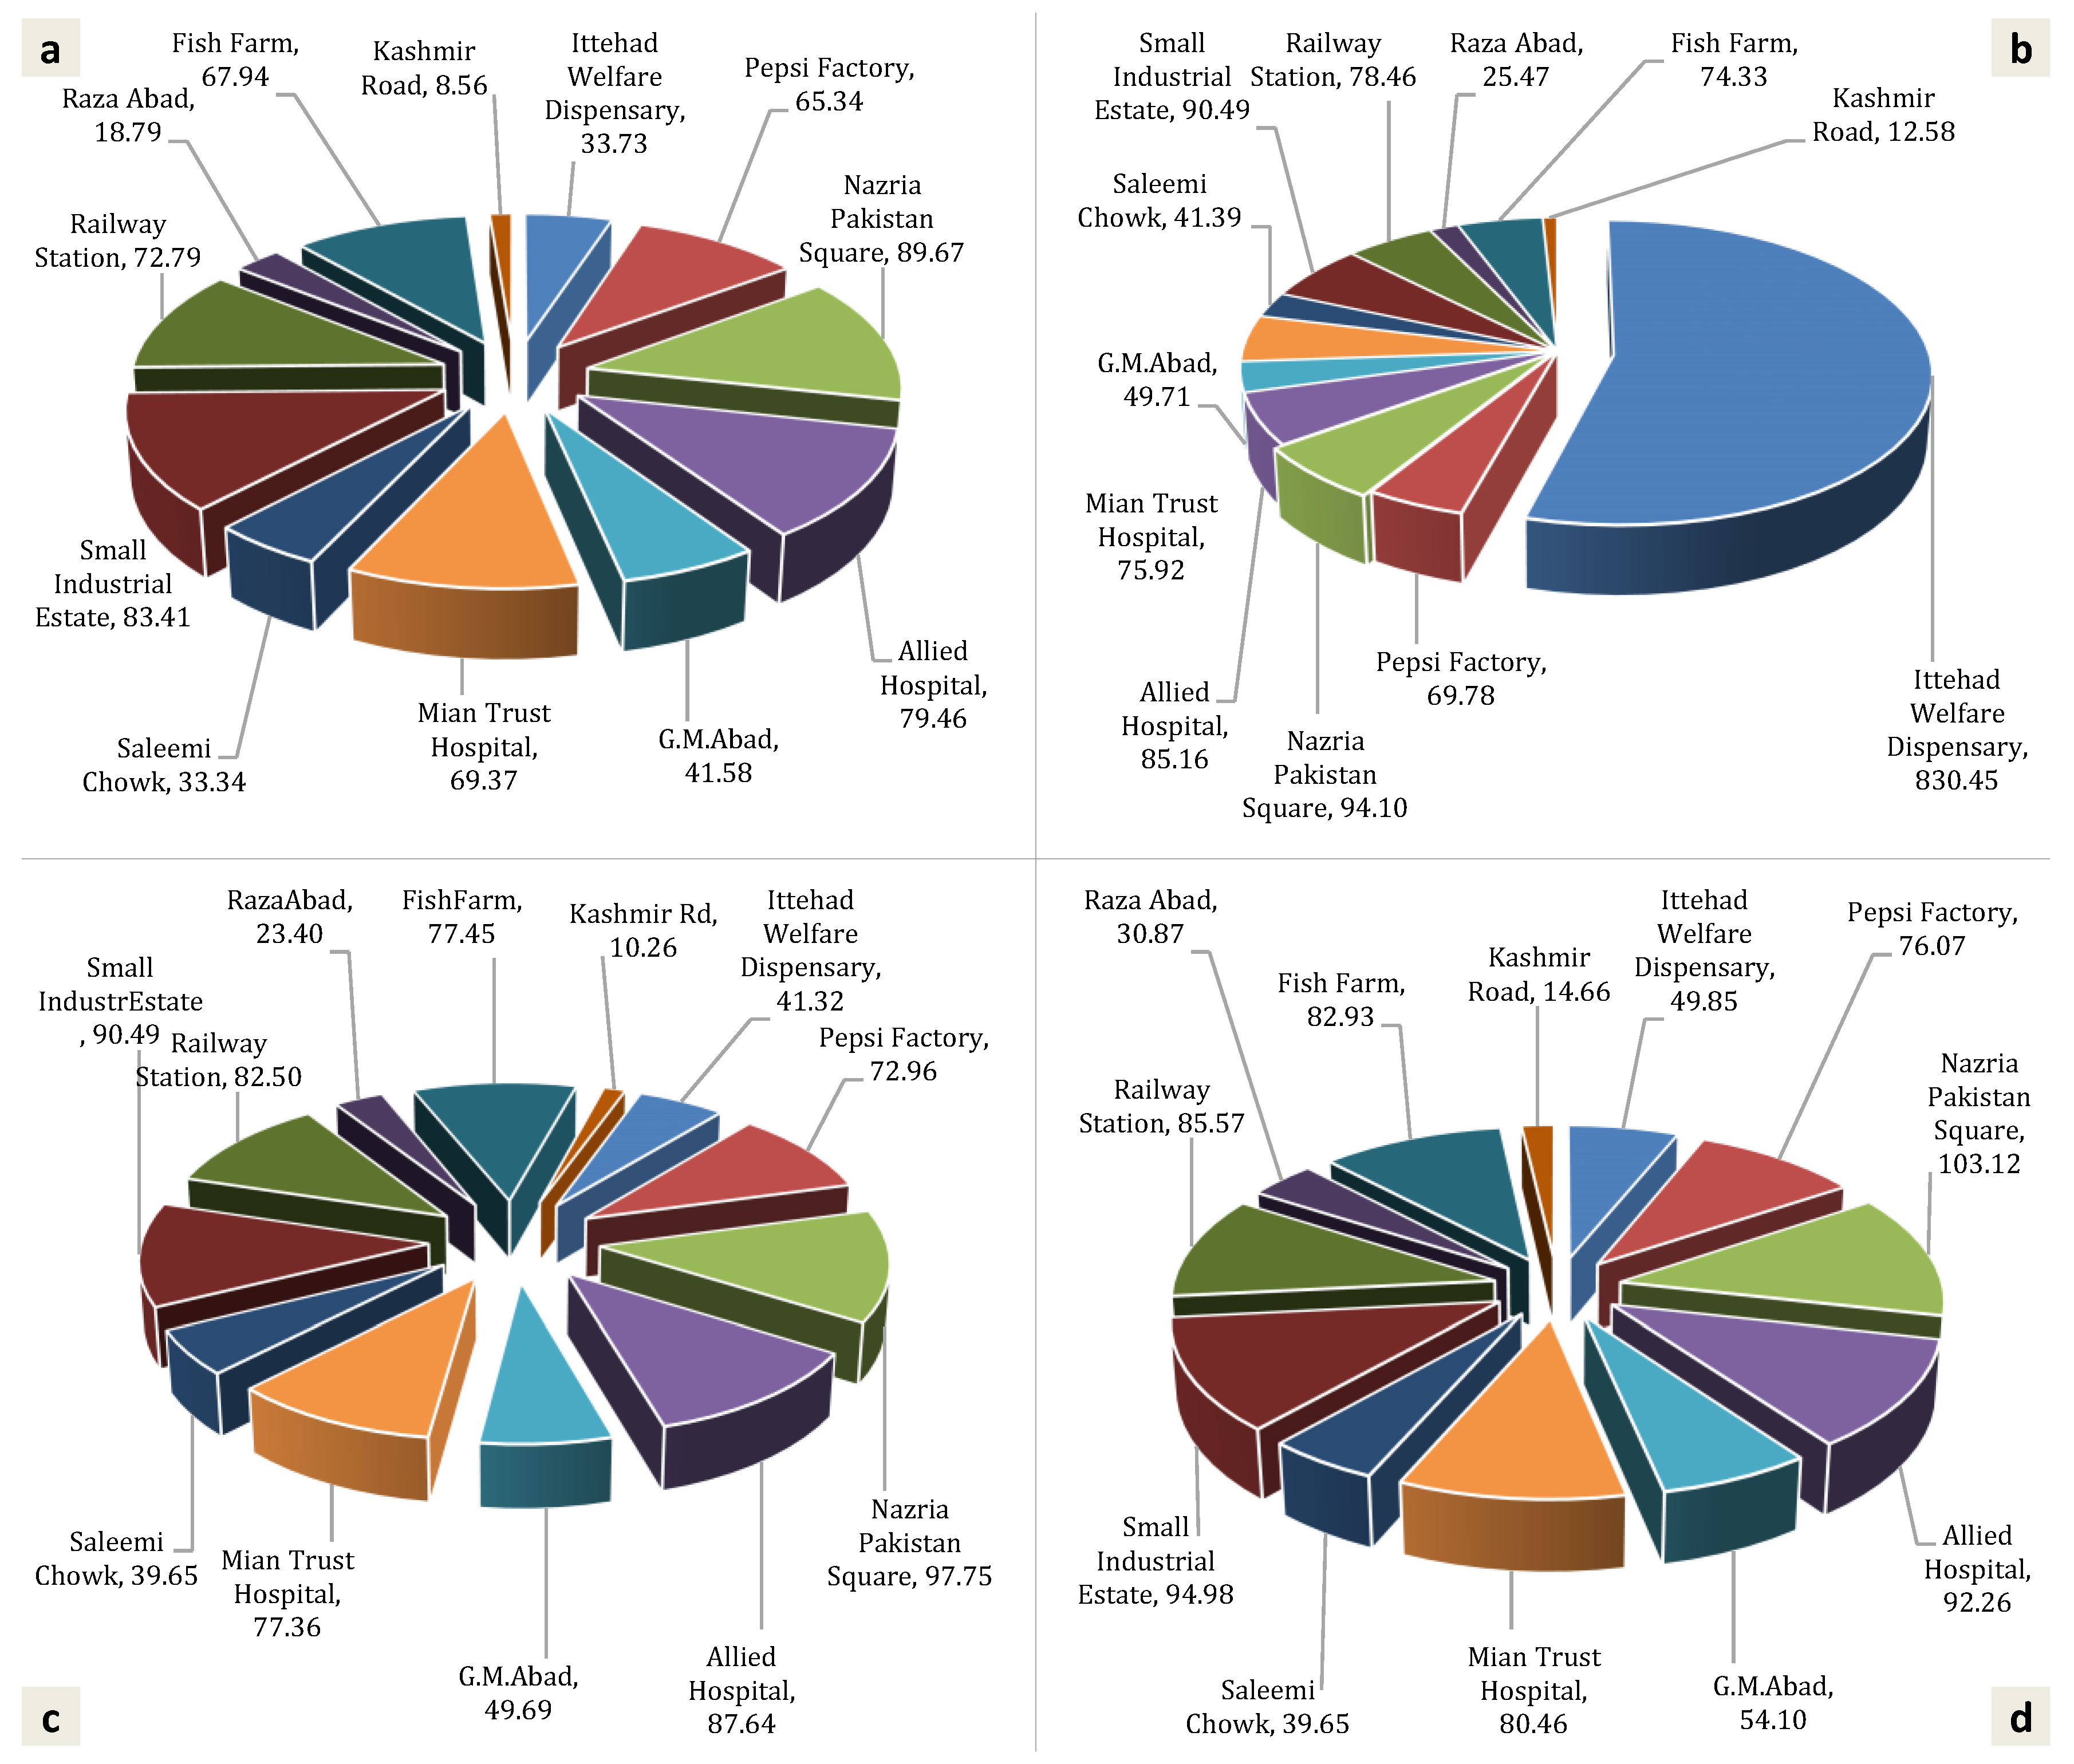
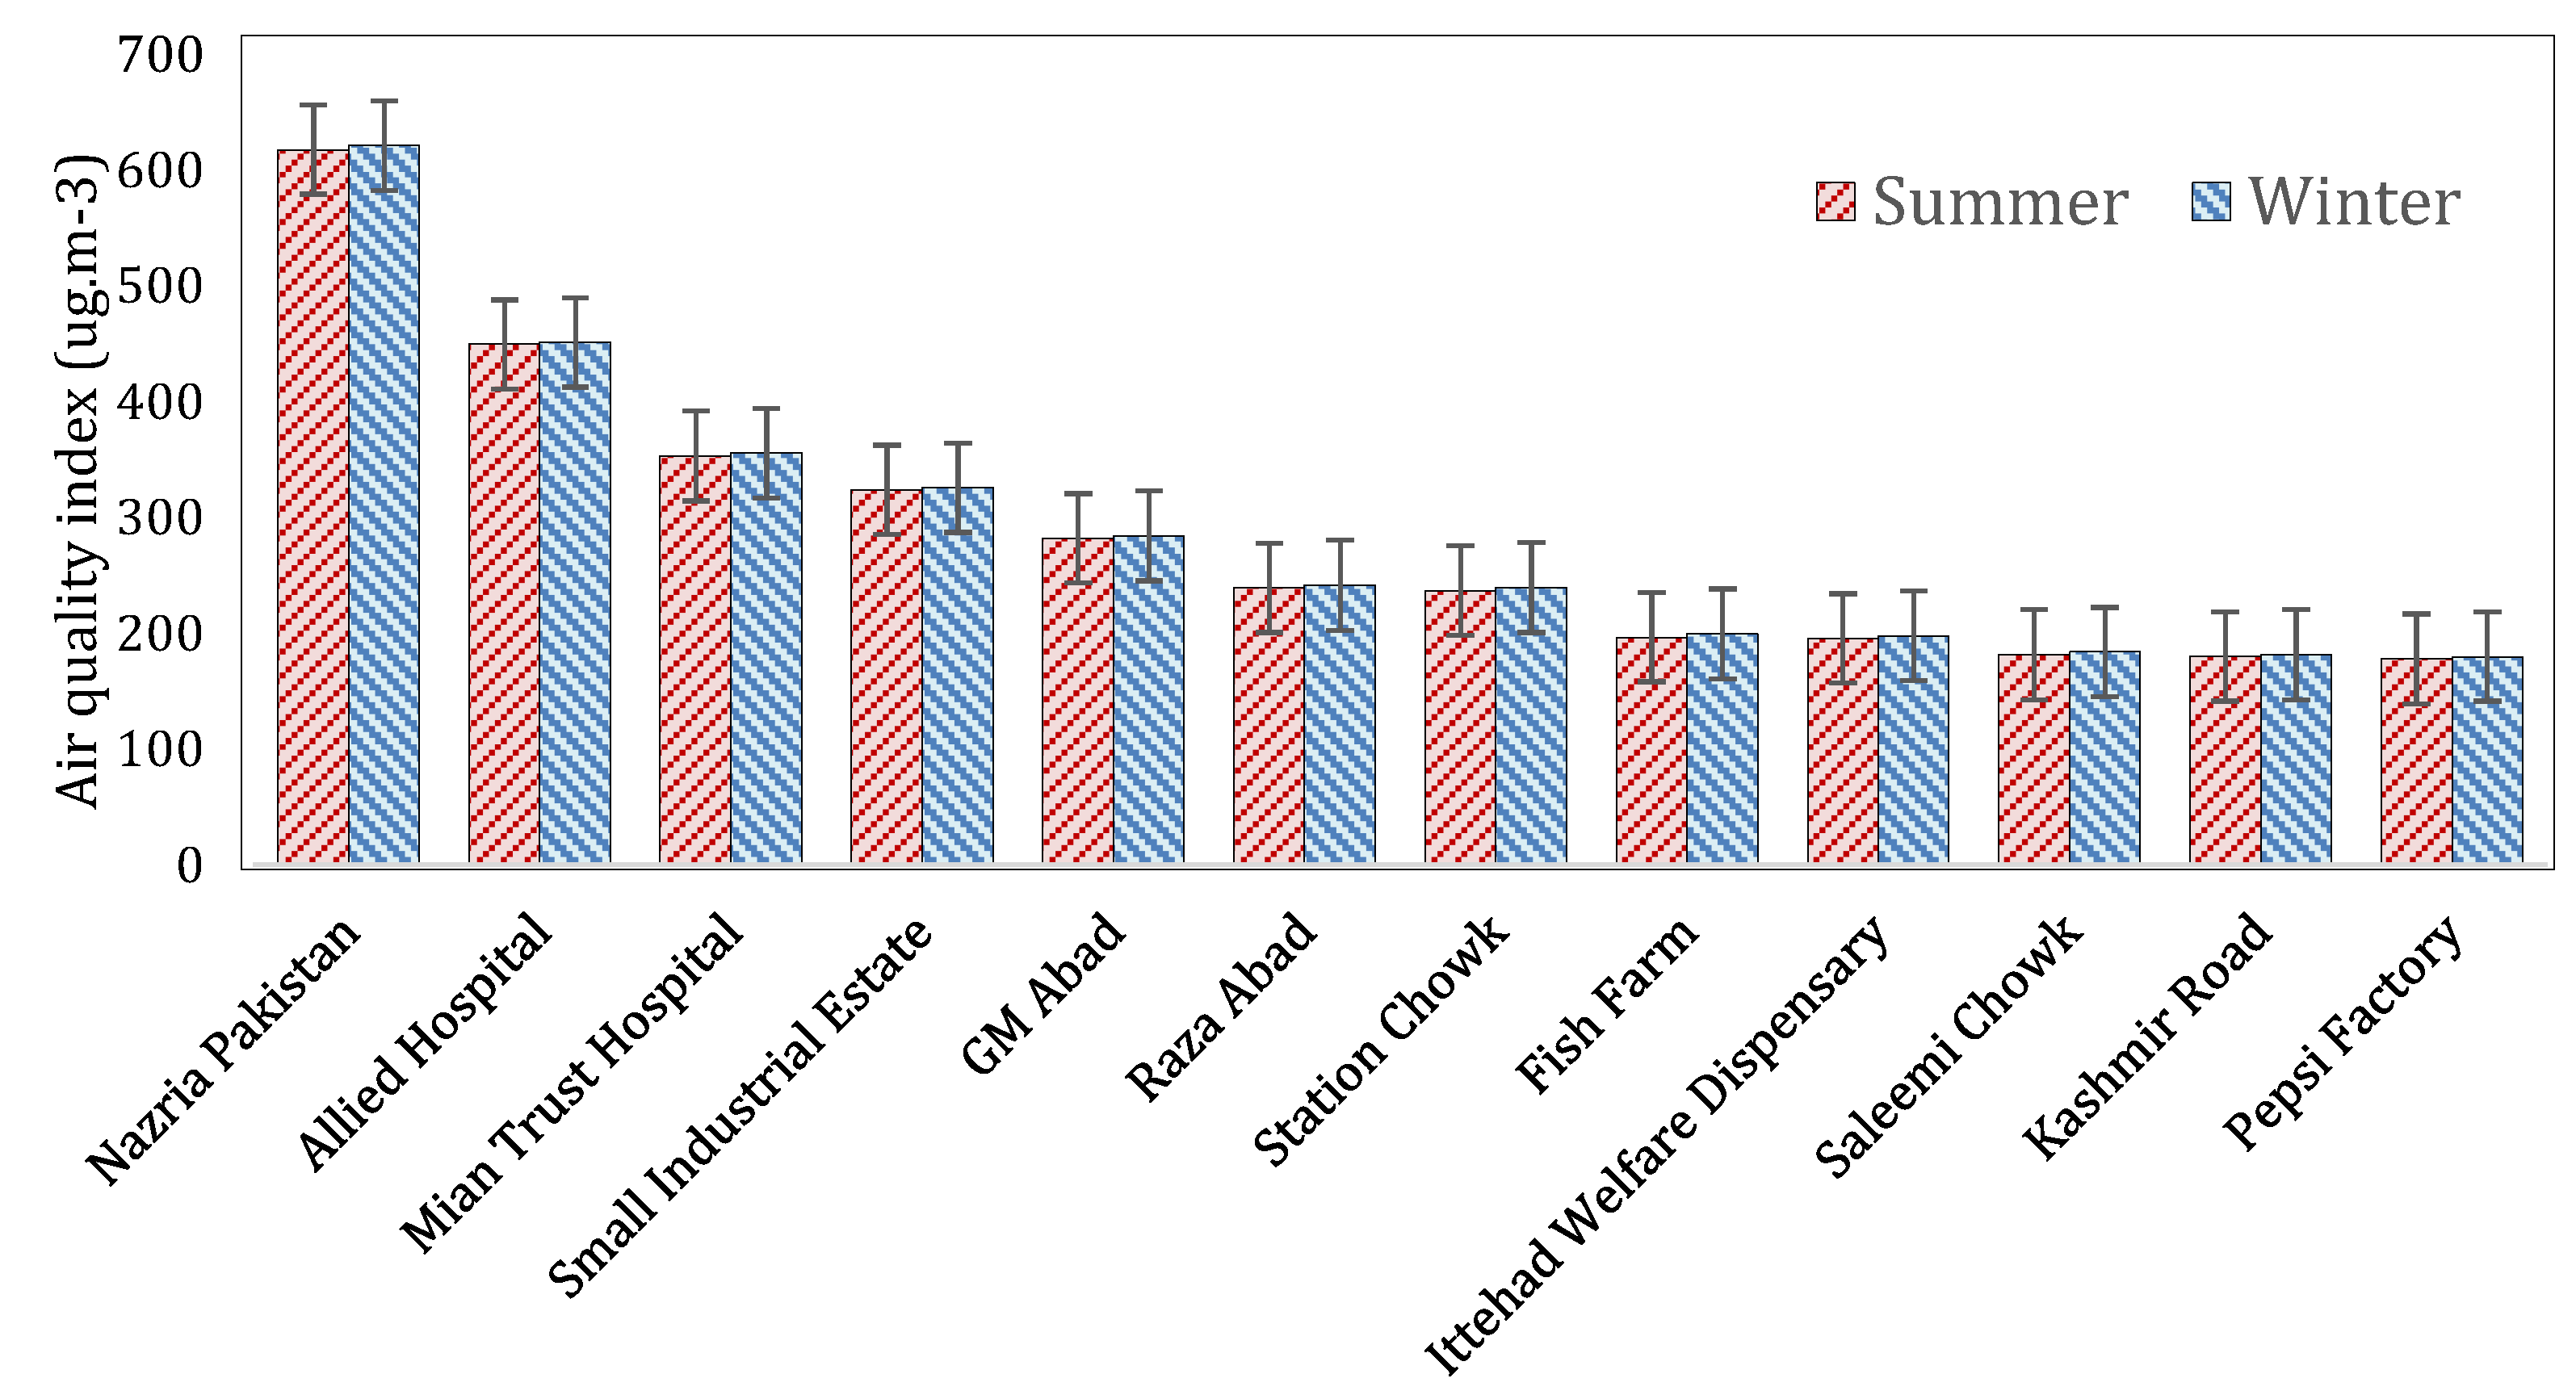
3.5. Air Quality and Pollution Index

The air temperature of the study area fluctuated between 18–25 °C in winter which is considered a typical range while the trend in May–June 2017, as shown in Figure 6, showed an increase to 37.2 °C on average. Figure 6 also demonstrates the trend of relative humidity with a mean value of that varies from 39.45% in summer to 60.4% in winter. Table 1 presented the categories of air quality according to the AQI while Figure 7 illustrates the AQI index of selected sites of Faisalabad city with detrimental outcomes. It was found that the ambient air of Faisalabad city ranges from moderately polluted with the sequence of Ittehad Welfare Dispensary > Saleemi Chowk > Kashmir Road > Pepsi Factory, while severely polluted air was found in the vicinity of Nazria Pakistan Square, followed by Allied Hospital. The air quality of Mian Trust Hospital and the Small Industrial Estate was categorized as very poor besides GM Abad, Raza Abad and Station Chowk where the air quality was poor. The overall air quality of Faisalabad city was not good for health and other activities that require urgent attention from Government institutes and ministries involved in making and implementing policies to safeguard the environment.
The average values of pollution index (PI) for each potential toxic element at selected sites of Faisalabad city for both seasons have been shown in Figure 8. In some residential areas, PI of PM2.5 was found in the average level of pollution. While the PI of PM10 was estimated for the same areas showed a middle level of pollution 1 < PI ≤ 2, and sample site which is located near Nazria Pakistan Square suggested a high level of environmental pollution PI > 4. The PM2.5 concentrations for almost all the sampling sites also showed a low level of environmental pollution of PI ≥ 1. At Saleemi Chowk, Fish Farm, and Kashmir Road, the PI of PM10 showed a low level of environmental pollution PI ≤ 1, while samples collected in the vicinities of Ittehad Welfare Dispensary, Pepsi Factory, Station Chowk, Raza Abad, GM Abad, and Mian Trust Hospital showed the middle level of pollution (2 < PI ≤ 3) in the environment. It should be noted that the samples of Allied Hospital and Nazria Pakistan showed the highest environmental pollution level of 3 < PI < 4. This can be due to the toxic elements in urban dust which accumulate and originate mainly from traffic, paint, and many other nonspecific urban sources in the megacity.
In order to show the difference between the mass concentrations of PM2.5 and PM10 were statistically significant between the 12 locations, four sets of null hypotheses with H0: μ L o c a t i o n 1 = μ L o c a t i o n 2 = = μ L o c a t i o n 12 were tested against the alternative hypotheses that the means of mass concentrations in the 12 locations were not equal. Based on the very small p-value that resulted from the one-way analysis of variance tests (p < 0.0001), all null hypotheses were rejected at any significant level and we concluded that the difference between locations was statistically significant. This result has been also shown in Figure 9 by means of the four scatter plots that demonstrate a visual comparison between the mean values of PM2.5 and PM10 data in the 12 locations with respect to the daytime (morning, afternoon, evening) and season (summer or winter). Taking plot labeled (c) of Figure 9 as an example (mean of PM10 data in summer), the difference between morning concentrations of PM2.5 in the 12 locations is clearly visible. It should be noted that for 61 days of winter the total number of measurements was 549. That is 61 days multiplied by 3 daytime (morning, afternoon, and evening) multiplied by 3 replications for each time.

4. Discussion

Usually, the sources of gaseous pollutants are measured in three categories: natural emission mechanism, combustion sources and industrial manufacturing processes. Industrial sources of particulates, like steel, heavy traffic loads, indiscriminate burning of solid wastes and cement factories are the main sources of PM [2,28] besides gaseous and noise pollutants. The increasing air pollution is, after losses of properties, crops and increased health care costs. Airborne particulate matter is abundant in the atmosphere and varies extensively (temporally and spatially) in size, chemical composition and concentration. Emissions of particulate matter towards air are the focal environmental challenges for the transport and industrial sectors [4]. According to the WHO report, South Asia has developed as one of the most polluted zones in the globe because of its increasing population and rapid industrialization. Acquaintance to PM leads to more appointments to the emergency room or doctor. Health effects include premature deaths with existing lung and heart diseases, lung damage, coughing, aggravated asthma, wheezing and shortness of breath. Specifically, in the dry and cold season in major urban areas of Pakistan, people of almost all ages suffer from throat infections as reported [2,4,17]. In Pakistan, like the other developing countries, the emissions from vehicles have been conquered by emissions from poorly maintained and old vehicles that subsidize to heightened mass concentrations of carbon monoxide and fine particulates [17,28].
The current study focused on particulate volume has reported the highest concentration of PM2.5 and PM10 in a commercial area on the average 39.18 ± 4.70 μg/m3, 573.14 ± 321.64 μg/m3 and 40.73 ± 2.9 μg/m3, 575.19 ± 225.66 μg/m3 for summer and winter, respectively (Figure 2). While, the lowest concentration of PM2.5 and PM10 was obtained in the residential sector ranging (33.91 ± 3.27 μg/m3), (35.1 ± 2.93 μg/m3) and (349.46.75 ± 74.49 μg/m3), (350.98 ± 74.29 μg/m3) for summer and winter season correspondingly with a strong positive correlation between PM2.5 and PM10 in both seasons on average. According to the guidelines, the reference value for PM2.5 and PM10 are WHO (25 µg/m3 and 50 µg/m3) [17,25], NEQS and US-EPA (35 µg/m3, 150 µg/m3) [26,27] and most samples examined in the present study had values higher than the reference values. Elemental carbon is discharged from a variety of ignition procedures, categorized as a short-lived climate forcer that put up to atmospheric warming and also allied with human mortality and morbidity [28]. Common sources of atmospheric primary and secondary organic carbon antecedents are biomass burning, vehicular exhaust, biogenic emission and industrial emissions [29]. During the winter season, a higher level of pollutants especially the mass concentration of PM2.5 persists in the ambient air of Faisalabad, owing to reduced atmospheric dispersion due to high relative humidity. Similarly, it was observed that PM2.5 and PM10 sources were frequently localized as depicted by high concentrations at low wind speeds, mostly by the emissions from road vehicles [2,29]. This demonstrates the fact that PM2.5 and PM10 concentrations were lower in summer than in winter (Figure 2) due to an increase in wind speed and temperature.
Prior studies conducted in the carbonaceous aerosols were assessed to account for about 50–60% of the total mass of PM2.5 in metropolises in Jordan, Israel and Palestine [30]. Not unexpectedly, since production and processing of oil was prevalent transversely in the Middle East, substantial oil burning was valued to contribute 18% to total mass of PM10 and 69% to the total mass of PM2.5 in Jeddah, Saudi Arabia [31]. Likewise, in Faisalabad, Pakistan, the quality of air not only reflects the impact of regional and local dust but also momentous local sources which include numerous industries and a heavy traffic weight. In municipal areas, the higher concentrations of PM2.5 and PM10 are symbolic of the higher density of traffic as presented in the current study (Figure 2 and Figure 4). Additionally, the burden of particulates is higher in the daytime than nighttime one, demonstrating more urban activities throughout day time. In Faisalabad, the textile industry, the topographical configuration and the geographical location make the problem of air pollution so perilous that it is very crucial to study it (Figure 5). The current study aimed at finding out whether or not the situation of air pollution in Faisalabad was previously seriously abundant to warrant the establishment of a regular air quality management system through which intercession measures can be premeditated and executed. The analysis result of ambient air samples of selected sites of Faisalabad city displays that the level of particulate matter in most of the areas of the city is above the indorsed levels of the WHO, NEQS and US-EPA. Most of the city’s commercial and residential areas are within the sensitive zone with the maximum concentrations of PM, which is constant with their proximity to the city’s industrial areas.
When compared with the other studies conducted in other cities, it was found that the PM2.5 level at Industrial Estate I-10 and IJP Road has reached the critical level (>35 μg/m3) whereas at Industrial Estate I-9 it was moderate to the high level (31.9 μg/m3 to 41.1 μg/m3) [27]. While, the mean concentration of PM2.5 and PM10 for Peshawar city during the study period has been calculated to be respectively 172 μg/m3 and 480 μg/m3 [32]. A similar high mass concentration of particulate matter was observed by [33] at Lahore, Pakistan and documented that the average PM2.5 mass was 190 μg/m3, and ranged from 89 μg/m3 to 476 μg/m3, far over US-EPA standards. Much higher PM10 mass concentration was experienced in Faisalabad when compared with other megacities [34], In addition, the PM10 concentrations were quite higher than the annual mean PM10 concentrations in Eastern Mediterranean and Africa [35,36] (WHO. Ambient (outdoor) 2014), Malaysia [34] and Bogota, Egypt, Los Angeles and Mexico [34]. It was also identified that PM10 is the dominant pollutant in the index value [37]. While, according to the results obtained after the analysis of particulate matters samples, the highest concentration of elemental carbon was 103.12 ± 1.46 μg/m3 and the highest concentration of organic carbon was 196.9 ± 1.79 μg/m3. While, 300.02 ± 3.25 μg/m3 was the highest TC concentration found in the samples of coarse particulate matter collected in the vicinity of Nazria Pakistan (Figure 3). When compared, it was found that these concentrations are comparatively higher than in other metropolises in the areas like Punjab, India (116 μg/m3), Hangzhou, China (119 μg/m3), Kolkatta, India (197 μg/m3), New Delhi, India (219 μg/m3) and Lahore, Pakistan (233 μg/m3) [38,39,40]. For elemental carbon, a large number of sources are identified, e.g., biomass and coal-fired power plant, two-stroke vehicles, fossil fuel burning, diesel engines and low burning efficiency. Elemental carbon is also utilized as a tracer for vehicular emission [17,40]. It was stated by [41] that diesel and gasoline motor vehicles and traffic exhaust are key sources of elemental carbon, followed by biomass burning. Organic carbon can be released straight from sources identified as primary carbon as a result of biomass and fossil combustion or can be formed as a result of a chemical reaction recognized as secondary organic carbon [42]. Temperature means are also under the normal limit but the increasing trend shows the alarming state of affairs and the same case is with radiations. Relative humidity has a value that is normal and considered healthy but a decreasing trend precedes the deterioration of ambient air quality. AQI and PI indicated that the ambient air quality of Faisalabad city falls from poor to severely polluted categories which are not safe to breathe and perform our daily activities.

5. Conclusions

Studying particle matters with aerodynamic diameters below 10 μm and 2.5 μm have received research attention for atmospheric pollution characteristics due to their severe effects on the human health issue. In this paper, we studied PM10 and PM2.5 and highlighted that atmospheric pollution has become a significant issue as a result of growing industries in the megacity of Faisalabad, leading to the increased risk factors for chronic respiratory diseases in elderly and accelerated loss of lung function in newborns. To determine the pollution characteristics of particular matter, as well as the source and factors affecting them, we concentrated our study on 12 different sites that were selected and categorized as residential, commercial, industrial and health centers. Results of our study showed that the PM concentrations measured during current study periods (Dec 2016–Jan 2017) at various zones of Faisalabad were surprisingly higher than summer (May–June 2017). The enormous difference between fine (PM2.5) and coarse (PM10) particulate specifies that Faisalabad is inclined by a high loading of “coarse” particulate dust. Commercial areas are heavily polluted with fine and coarse particulate pollution. The average levels of pollution for fine and particulate matter were recorded as 39.18 ± 4.70, 573.14 ± 321.64 and 40.73 ± 2.9, 575.19 ± 225.66 during summer and winter, respectively (values in μg/m3). The average PM2.5 and PM10 concentrations were higher as compared to other major cities like Islamabad, Lahore, and Peshawar. The quality of ambient air of Faisalabad has deteriorated beyond the safe limits set by WHO, US-EPA and NEQS. We also concluded that carbonaceous aerosols are in higher concentration in the air of the study sites. The air quality of Faisalabad city ranges from poor to severely polluted category which is highly unsafe for human health. These demands for an effort to introduce appropriate pollution control and management plans such as plantation and green belts for the betterment of civic life. A sustainable solution to improve air quality in Faisalabad would be to reduce emission by replacing high-energy consuming industries with renewable and clean energy sources, besides other strategies that reduce the use of fossil energy. Future studies may involve the use of wavelet analysis to explore the temporal characteristics of PM2.5 and PM10, or to investigate the relationship between meteorological factors and PM10.

Author Contributions

A.A., M.I., I.S. and A.M. conceived and designed the experiments; A.A., M.T. and A.M. performed the experiments. M.K.I., G., M.Y., M.T. used software; R.R.S. worked on the final review and editing, figures and analysis; A.A., M.T., R.R.S. performed formal analysis and writing the draft; M.I., A.M. and G. did project funding and finding acquisition; M.I., I.S., A.M. and G. performed supervision of the experiments. All authors have read and agreed to the published version of the manuscript.

Funding

This research was funded through HEC-NRPU, grant number 5635 and the data presented here are a part of a Ph.D. thesis at GCUF. The authors further acknowledge the financial support provided by IERI-GIST project.

Acknowledgments

The authors acknowledge the financial support by the Open Access Publication Fund of the Leibniz Association, Germany, the partial research funding and editorial supports from Adaptive AgroTech Consultancy International and the administrative supports from Benjamin Mahns at the Leibniz Institute for Agricultural Engineering and Bioeconomy in Potsdam, Germany.

Conflicts of Interest

The authors declare that the research was conducted in the absence of any commercial or financial relationships that could be construed as a potential conflict of interest.

References

  1. Hamid, A.; Akhtar, S.; Atique, S.A.; Huma, Z.; Mohay Uddin, S.G.; Asghar, S. Ambient air quality & noise level monitoring of different areas of Lahore (Pakistan) and its health impacts. Pol. J. Environ. Stu. 2019, 28, 623–629. [Google Scholar]
  2. Javed, W.; Wexler, A.S.; Murtaza, G.; Iqbal, M.M.; Zhao, Y.; Naz, T. Chemical characterization and source apportionment of atmospheric particles across multiple sampling locations in Faisalabad, Pakistan. Clean Soil Air Water 2016, 44, 753–765. [Google Scholar] [CrossRef] [Green Version]
  3. Gurjar, B.R.; Butler, T.M.; Lawrence, M.G.; Lelieveld, J. Evaluation of emissions and air quality in megacities. Atmos. Environ. 2008, 42, 1593–1606. [Google Scholar] [CrossRef]
  4. Shahid, I.; Kistler, M.; Mukhtar, A.; Ghauri, B.M.; Cruz, C.R.S.; Bauer, H.; Puxbaum, H. Chemical characterization and mass closure of PM10 and PM2.5 at an urban site in Karachi, Pakistan. Atmos. Environ. 2016, 128, 114–123. [Google Scholar] [CrossRef]
  5. Cheng, F.J.; Lee, K.H.; Lee, C.W.; Hsu, P.C. Association between particulate matter air pollution and hospital emergency room visits for pneumonia with septicemia: A retrospective analysis. Aerosol Air Qual. Res. 2019, 19, 345–354. [Google Scholar] [CrossRef]
  6. Correia, A.W.; Pope III, C.A.; Dockery, D.W.; Wang, Y.; Ezzati, M.; Dominici, F. The effect of air pollution control on life expectancy in the United States: An analysis of 545 US counties for the period 2000 to 2007. Epidemiology 2013, 24, 23. [Google Scholar] [CrossRef] [Green Version]
  7. Pakbin, P.; Hudda, N.; Cheung, K.L.; Moore, K.F.; Sioutas, C. Spatial and temporal variability of coarse (PM10−2.5) particulate matter concentrations in the Los Angeles area. Aerosol. Sci. Technol. 2010, 44, 514–525. [Google Scholar] [CrossRef] [Green Version]
  8. Leghari, S.K.; Zaidi, M.A.; Ahmed, M.; Sarangzai, A.M. Assessment of suspended particulate matters level and role of vegetation in ambient air of North-East Balochistan, Pakistan. Fuuast J. Biol. 2013, 3, 37–43. [Google Scholar]
  9. Dinoi, A.; Cesari, D.; Marinoni, A.; Bonasoni, P.; Riccio, A.; Chianese, E.; Tirimberio, G.; Naccarato, A.; Sprovieri, F.; Andreoli, V.; et al. Inter-comparison of carbon content in PM2.5 and PM10 collected at five measurement sites in southern Italy. Atmosphere 2017, 8, 243. [Google Scholar] [CrossRef] [Green Version]
  10. Choomanee, P.; Bualert, S.; Thongyen, T.; Salao, S.; Szymanski, W.W.; Rungratanaubon, T. Vertical variation of carbonaceous aerosols with in the PM2.5 fraction in Bangkok, Thailand. Aerosol. Air Qual. Res. 2020, 20, 43–52. [Google Scholar] [CrossRef] [Green Version]
  11. Ji, D.; Zhang, J.; He, J.; Wang, X.; Pang, B.; Liu, Z.; Wang, L.; Wang, Y. Characteristics of atmospheric organic and elemental carbon aerosols in urban Beijing, China. Atmos. Environ. 2016, 125, 293–306. [Google Scholar] [CrossRef]
  12. Li, C.; Chen, P.; Kang, S.; Yan, F.; Hu, Z.; Qu, B.; Sillanpää, M. Concentrations and light absorption characteristics of carbonaceous aerosol in PM2.5 and PM10 of Lhasa city, the Tibetan Plateau. Atmos. Environ. 2016, 127, 340–346. [Google Scholar] [CrossRef]
  13. Li, Y.C.; Yu, J.Z.; Ho, S.S.; Schauer, J.J.; Yuan, Z.; Lau, A.K.; Louie, P.K. Chemical characteristics and source apportionment of fine particulate organic carbon in Hong Kong during high particulate matter episodes in winter 2003. Atmos. Res. 2013, 120, 88–98. [Google Scholar] [CrossRef]
  14. Bisht, D.S.; Tiwari, S.; Dumka, U.C.; Srivastava, A.K.; Safai, P.D.; Ghude, S.D.; Chate, D.M.; Rao, P.S.; Ali, K.; Prabhakaran, T.; et al. Tethered balloon-born and ground-based measurements of black carbon and particulate profiles within the lower troposphere during the foggy period in Delhi, India. Sci. Total Environ. 2016, 573, 894–905. [Google Scholar] [CrossRef]
  15. Colbeck, I.; Nasir, Z.A.; Ali, Z. The state of ambient air quality in Pakistan-a review. Environ. Sci. Poll. Res. 2010, 17, 49–63. [Google Scholar] [CrossRef] [Green Version]
  16. World Bank and Institute for Health Metrics and Evaluation. The Cost of Air Pollution: Strengthening the Economic Case for Action; World Bank Group: Washington, DC, USA, 2016. [Google Scholar]
  17. Niaz, Y.; Zhou, J.; Iqbal, M.; Nasir, A.; Dong, B. Ambient air quality evaluation: A comparative study in China and Pakistan. Pol. J. Environ. Stu. 2015, 24, 1723–1732. [Google Scholar] [CrossRef]
  18. Gunawardana, C.; Goonetilleke, A.; Egodawatta, P.; Dawes, L.; Kokot, S. Source characterization of road dust based on chemical and mineralogical composition. Chemosphere 2012, 87, 163–170. [Google Scholar] [CrossRef] [Green Version]
  19. Shahid, M.A.K.; Hussain, K.; Awan, M.S. Characterization of Solid Aerosols related to Faisalabad Environment and their probable sources. Coden Jnsmac. 2012, 52, 09–29. [Google Scholar]
  20. Cachier, H.; Bremond, M.P.; Buat Ménard, P. Determination of atmospheric soot carbon with a simple thermal method. Tellus B 1989, 41, 379–390. [Google Scholar] [CrossRef] [Green Version]
  21. Shahid, I.; Kistler, M.; Shahid, M.Z.; Puxbaum, H. Aerosol Chemical Characterization and Contribution of Biomass Burning to Particulate Matter at a Residential Site in Islamabad, Pakistan. Aeros. Air Qual. Res. 2019, 19, 148–162. [Google Scholar] [CrossRef] [Green Version]
  22. Ott, W.R. Environmental Indices: Theory and Practices; Ann Arbor Science Publishers Inc.: Ann Arbor, MI, USA, 1978. [Google Scholar]
  23. Central Pollution Control Board (CPCB). Guidelines for National Ambient Air Quality Monitoring; Series: NAAQM/25/2003- 04; Central Pollution Control Board: Delhi, India, 2009. [Google Scholar]
  24. Chen, T.B.; Zheng, Y.M.; Lei, M.; Huang, Z.C.; Wu, H.T.; Chen, H.; Fan, K.K.; Yu, K.; Wu, X.; Tian, Q.Z. Assessment of heavy metal pollution in surface soils of urban parks in Beijing, China. Chemosphere 2005, 60, 542–551. [Google Scholar] [CrossRef]
  25. World Health Organization. Mental Health: Facing the Challenges, Building Solutions: Report from the WHO European Ministerial Conference; WHO Regional Office Europe: Geneva, Switzerland, 2005. [Google Scholar]
  26. Abbas, M.; Tahira, A.; Jamil, S. Air quality monitoring of particulate matter (PM2.5 & PM10) at Niazi and Daewoo bus station, Lahore. FUUAST J. Biol. 2017, 7, 13–18. [Google Scholar]
  27. Hassan, M.; Malik, A.H.; Waseem, A.; Abbas, M. Air pollution monitoring in urban areas due to heavy transportation and industries: A case study of Rawalpindi and Islamabad. J. Chem. Soc. Pak. 2013, 35, 1623. [Google Scholar]
  28. Huang, X.H.; Bian, Q.J.; Louie, P.K.K.; Yu, J.Z. Contributions of vehicular carbonaceous aerosols to PM2.5 in a roadside environment in Hong Kong. Atmos. Chem. Physics. 2014, 14, 9279–9293. [Google Scholar] [CrossRef] [Green Version]
  29. Weinhold, B. Global bang for the buck: Cutting black carbon and methane benefits both health and climate. Environ. Health Perspect. 2012, 120, A245. [Google Scholar] [CrossRef] [Green Version]
  30. Abdeen, Z.; Qasrawi, R.; Heo, J.; Wu, B.; Shpund, J.; Vanger, A.; Sharf, G.; Moise, T.; Brenner, S.; Nassar, K.; et al. Spatial and temporal variation in fine particulate matter mass and chemical composition: The Middle East consortium for aerosol research study. Sci. World J. 2014, 878704. [Google Scholar] [CrossRef] [Green Version]
  31. Khodeir, M.; Shamy, M.; Alghamdi, M.; Zhong, M.; Sun, H.; Costa, M.; Chen, L.-C.; Maciejczyk, P. Source apportionment and elemental composition of PM2.5 and PM10 in Jeddah City, Saudi Arabia. Atmos. Pollut. Res. 2012, 3, 331–340. [Google Scholar] [CrossRef] [Green Version]
  32. Alam, K.; Rahman, N.; Khan, H.U.; Haq, B.S.; Rahman, S. Particulate matter and its source apportionment in Peshawar, Northern Pakistan. Aerosol Air Qual. Res. 2015, 15, 634–647. [Google Scholar] [CrossRef] [Green Version]
  33. Husain, L.; Dutkiewicz, V.A.; Khan, A.J.; Ghauri, B.M. Characterization of carbonaceous aerosols in urban air. Atmos. Environ. 2007, 41, 6872–6883. [Google Scholar] [CrossRef]
  34. Safar, Z.S.; Labib, M.W. Assessment of particulate matter and lead levels in the Greater Cairo area for the period 1998–2007. J. Advan. Res. 2010, 1, 53–63. [Google Scholar] [CrossRef] [Green Version]
  35. World Health Organization. Ambient (Outdoor) Air Quality and Health; Fact sheet No. 313; 2014; Available online: https://www.who.int/news-room/fact-sheets/detail/ambient-(outdoor)-air-quality-and-health (accessed on 25 April 2020).
  36. Ul-Saufie, A.; Yahya, A.; Ramli, N.; Hamid, H. Future PM10 concentration prediction using quantile regression models. In International Conference on Environmental and Agriculture Engineering; IACSIT Press: Singapore, 2012; Volume 37. [Google Scholar]
  37. Nigam, S.; Rao, B.P.S.; Kumar, N.; Mhaisalkar, V.A. Air quality index-A comparative study for assessing the status of air quality. Res. J. Eng. Technol. 2015, 6, 267–274. [Google Scholar] [CrossRef]
  38. Cao, J.; Shen, Z.; Chow, J.C.; Qi, G.; Watson, J.G. Seasonal variations and sources of mass and chemical composition for PM10 aerosol in Hangzhou, China. Particuology 2009, 7, 161–168. [Google Scholar] [CrossRef]
  39. Awasthi, A.; Agarwal, R.; Mittal, S.K.; Singh, N.; Singh, K.; Gupta, P.K. Study of size and mass distribution of particulate matter due to crop residue burning with seasonal variation in rural area of Punjab, India. J. Environ. Monit. 2011, 13, 1073–1081. [Google Scholar] [CrossRef] [PubMed] [Green Version]
  40. Alam, K.; Mukhtar, A.; Shahid, I.; Blaschke, T.; Majid, H.; Rahman, S.; Khan, R.; Rahman, N. Source apportionment and characterization of particulate matter (PM10) in urban environment of Lahore. Aerosol. Air Qual. Res. 2014, 14, 1851–1861. [Google Scholar] [CrossRef]
  41. Ghauri, B.; Lodhi, A.; Mansha, M. Development of baseline (air quality) data in Pakistan. Environ. Monit. Assess. 2007, 127, 237–252. [Google Scholar] [CrossRef]
  42. Seinfeld, J.H.; Pandis, S.N. Atmospheric Chemistry and Physics: From Air Pollution to Climate Change; John Wiley & Sons: Hoboken, NJ, USA, 2016. [Google Scholar]
Figure 1. Study sites within the Faisalabad city and location of the city within the political map of Pakistan.
Applsci 10 08864 g001
Figure 2. Average mass concentrations of PM2.5 and PM10 in long summer and long winter in Faisalabad city.
Applsci 10 08864 g002
Figure 3. Concentration of carbonaceous species—elemental carbon (EC) in PM2.5 in summer (a); PM2.5 in winter (b); PM10 in summer (c); PM10 in winter (d). All units are expressed in μg/m3.
Applsci 10 08864 g003
Figure 4. Concentration of carbonaceous species—organic carbon (OC) in PM2.5 in summer (a); PM2.5 in winter (b); PM10 in summer (c); PM10 in winter (d). All units are expressed in μg/m3.
Applsci 10 08864 g004
Figure 5. Concentration of carbonaceous species—total carbon (TC) in PM2.5 in summer (a); PM2.5 in winter (b); PM10 in summer (c); PM10 in winter (d). All units are expressed in μg/m3.
Applsci 10 08864 g005
Figure 6. Relation of weather parameters in summer and winter seasons.
Applsci 10 08864 g006
Figure 7. Air Quality Index (AQI) of Faisalabad city after analysis.
Applsci 10 08864 g007
Figure 8. Pollution index flow diagram of PM2.5 and PM10 in Faisalabad.
Applsci 10 08864 g008
Figure 9. A comparison between mean values of PM2.5 and PM10 data with respect to the daytime (morning, afternoon, evening) and season (summer or winter) in the 12 locations for (a): PM2.5 in summer, (b): PM2.5 in winter, (c) PM10 in summer, (d) PM10 in winter.
Applsci 10 08864 g009
Table 1. (National Air Quality Index, CPCB, October 2014).
CategoryRange
Good0–50
Satisfactory51–100
Moderately Polluted101–200
Poor201–300
Very Poor301–400
Severe401–500
Publisher’s Note: MDPI stays neutral with regard to jurisdictional claims in published maps and institutional affiliations.

