Article

Ultrasonic Fatigue Device and Behavior of High-Temperature Superalloy Inconel 718 with Self-Heating Phenomenon

1
Aero-Engine Thermal Environment and Structure Key Laboratory of Ministry of Industry and Information Technology, College of Energy and Power Engineering, Nanjing University of Aeronautics and Astronautics, Nanjing 210016, China
2
Laboratoire Energétique Mécanique Electromagnétisme LEME, EA4416, Université Paris X Nanterre, 50 Rue de Sèvres, 92410 Ville d’Avray, France
*
Author to whom correspondence should be addressed.
Appl. Sci. 2020, 10(23), 8761; https://doi.org/10.3390/app10238761
Submission received: 30 November 2020 / Accepted: 4 December 2020 / Published: 7 December 2020
(This article belongs to the Special Issue Advances in Very-High-Cycle Fatigue)

Abstract

:
Ultrasonic resonance fatigue test method at 20 kHz related to the very high cycle fatigue (VHCF) aims to accelerate a time-consuming experiment. In this paper, an ultrasonic fatigue device with a data acquisition system was improved for monitoring and recording the data from fatigue tests in which self-heating phenomenon exists. Symmetric tension-compression sinusoidal vibrating mode (R = −1) was observed in this study. VHCF behavior and mechanism of Inconel 718 were carried out using this device. It was concluded that more than 99% of fatigue life is consumed in initiation duration. Specimen temperature increase was not a decisive factor in VHCF strength for Inconel 718, as long as it was far less than the design temperature limitation. A single initiation site existed at the subsurface facet or grain cluster, observed from scanning electron microscope (SEM) micrographs. Quasi-cleavage fracture in transgranular ductile mode emerged and then tended to trace grain boundaries in an intergranular manner by cleavage-dominated mixed mode.

1. Introduction

With the development of modern industry, the total life cycle of mechanical components, such as aircraft engines, exceeds already up to 109~1010 during the whole lifetime. Very high cycle fatigue (VHCF) is defined as fatigue after 107 cycles [1]. Most traditional fatigue test machines that work at several hundred hertz are not suitable for experimental investigation of VHCF range due to the limitation of time consumption. Mason introduced ultrasonic resonance fatigue testing at 20 kHz [2]. Afterwards, the ultrasonic methodology was used for exploring fatigue lives [3] and mechanisms [4] at very high cycle domain and for investigating threshold crack propagation behavior [5], which is complicated and time consuming by conventional test machines. However, relative to the standardized low-frequency tests methods, high-frequency fatigue results are influenced by some factors, such as loading mode and frequency, specimen geometry and size, material type and heat treatment, etc. Bathias and Paris [1] analyzed frequency sensitivity for different types of materials. They concluded that frequency effect was much more significant between 0.001 and 10 Hz than between 10 and 20,000 Hz. The insignificant influence of loading frequency was also reported in ferrous-type alloy [6] and nonferrous metals [7,8]. Tridello, Paolino, et al. [9,10,11,12] evaluated the size effect analytically in the VHCF regime and validated on the full-scale specimen. It is important to monitor and record test parameters such as frequency, vibration amplitude, surface temperature of specimen, etc. during the ultrasonic fatigue tests for further analysis.
High-temperature superalloy Inconel 718 is widely used in aeronautic applications, due to its high resistance to corrosion, oxidation, thermal creep deformation, and high mechanical strength at elevated temperatures up to 700 °C [13]. Rotary speed of aeroengine is from tens of thousands to hundreds of thousands of revolutions per minute (rpm), depending on the type and dimension of the engines. Low-amplitude but high-frequency vibration induced by the disturbance could lead to accidental rupture in the aeroengine. Solberg et al. [14,15,16,17] analyzed the high cycle fatigue (HCF) behavior of Inconel 718 in as-built and double-aging conditions at 10 Hz. Zhong et al. [18] compared the HCF performance of solution and aged material using a high-frequency machine at 130 Hz.
However, few results have been presented on the VHCF behavior and crack mechanism of Inconel 718 using ultrasonic loading at 20 kHz to date. Kawagoishi’s team [19,20,21] proved that fatigue strength increases with decrease in grain size. Moreover, the endurance limit under ultrasonic loading is higher than that tested under rotary bending (RB). Shi’s team [22,23] found that failure cycles for a given loading level increased with an increase in loading frequency. In other words, higher frequency results in an upper shift of the stress vs. number of cycles (S-N) curves. There is a transition from fatigue crack multisite initiations at the surface to single initiation in the subsurface with decrease in loading levels. Amanov et al. [24] presented that the improvement in fatigue life is mainly attributed to the induced compressive residual stress in the subsurface. Belan [25,26] found that Inconel 718 can still fracture after exceeding 108 cycles. Both low and high cycle fatigue cracks are initiated at large carbides whose length is greater than 50 μm. Yang et al. [27] indicated that competition between surface and interior crack initiation causes the inflection of S-N curve. Manufacturing defects in the microstructure may act as original fatigue micro-cracks. Texier et al. [28,29] found that the refinement in grain structure and higher Σ3 twin boundary density is associated with substantial reductions in lifetime. Pineau et al. [30] provided the modeling to predict minimum safe operating fatigue lives, the dispersion associated with variance in microstructure, and a component size effect.
The present paper aimed at (1) the development of data acquisition system for monitoring and recording the parameters during fatigue test with self-heating phenomenon and at (2) the VHCF behavior and crack mechanism of high-temperature superalloy Inconel 718.

2. Ultrasonic Fatigue Device and Data Acquisition System Development

Three major components of the test device can be summarized as follows [2].
(1)
Control system: computer with National Instruments® (Austin, TX, USA) PCIe internal card and self-programming VC++ software keeping the initial loading parameters as required.
(2)
Actuation system:
  • Power generator: Branson® (St. Louis, MO, USA) power generator receives the control signal from the NI® PCIe internal card and generates 20 kHz sinusoidal electrical current.
  • Piezoelectric converter: Piezoelectric converter transforms the electrical energy into longitudinal mechanical vibration at the same frequency. The vibration amplitude is very small (several microns).
  • Booster/horn: The role of the booster is to provide a plane for arranging the whole assembly. Due to the small vibration amplitude from the piezoelectric ceramic, the horn (also called a sonotrode) is presented to amplify the value from several to a dozen microns, for obtaining the required vibration corresponding to the specific stress amplitude in the test section of the specimen.
(3)
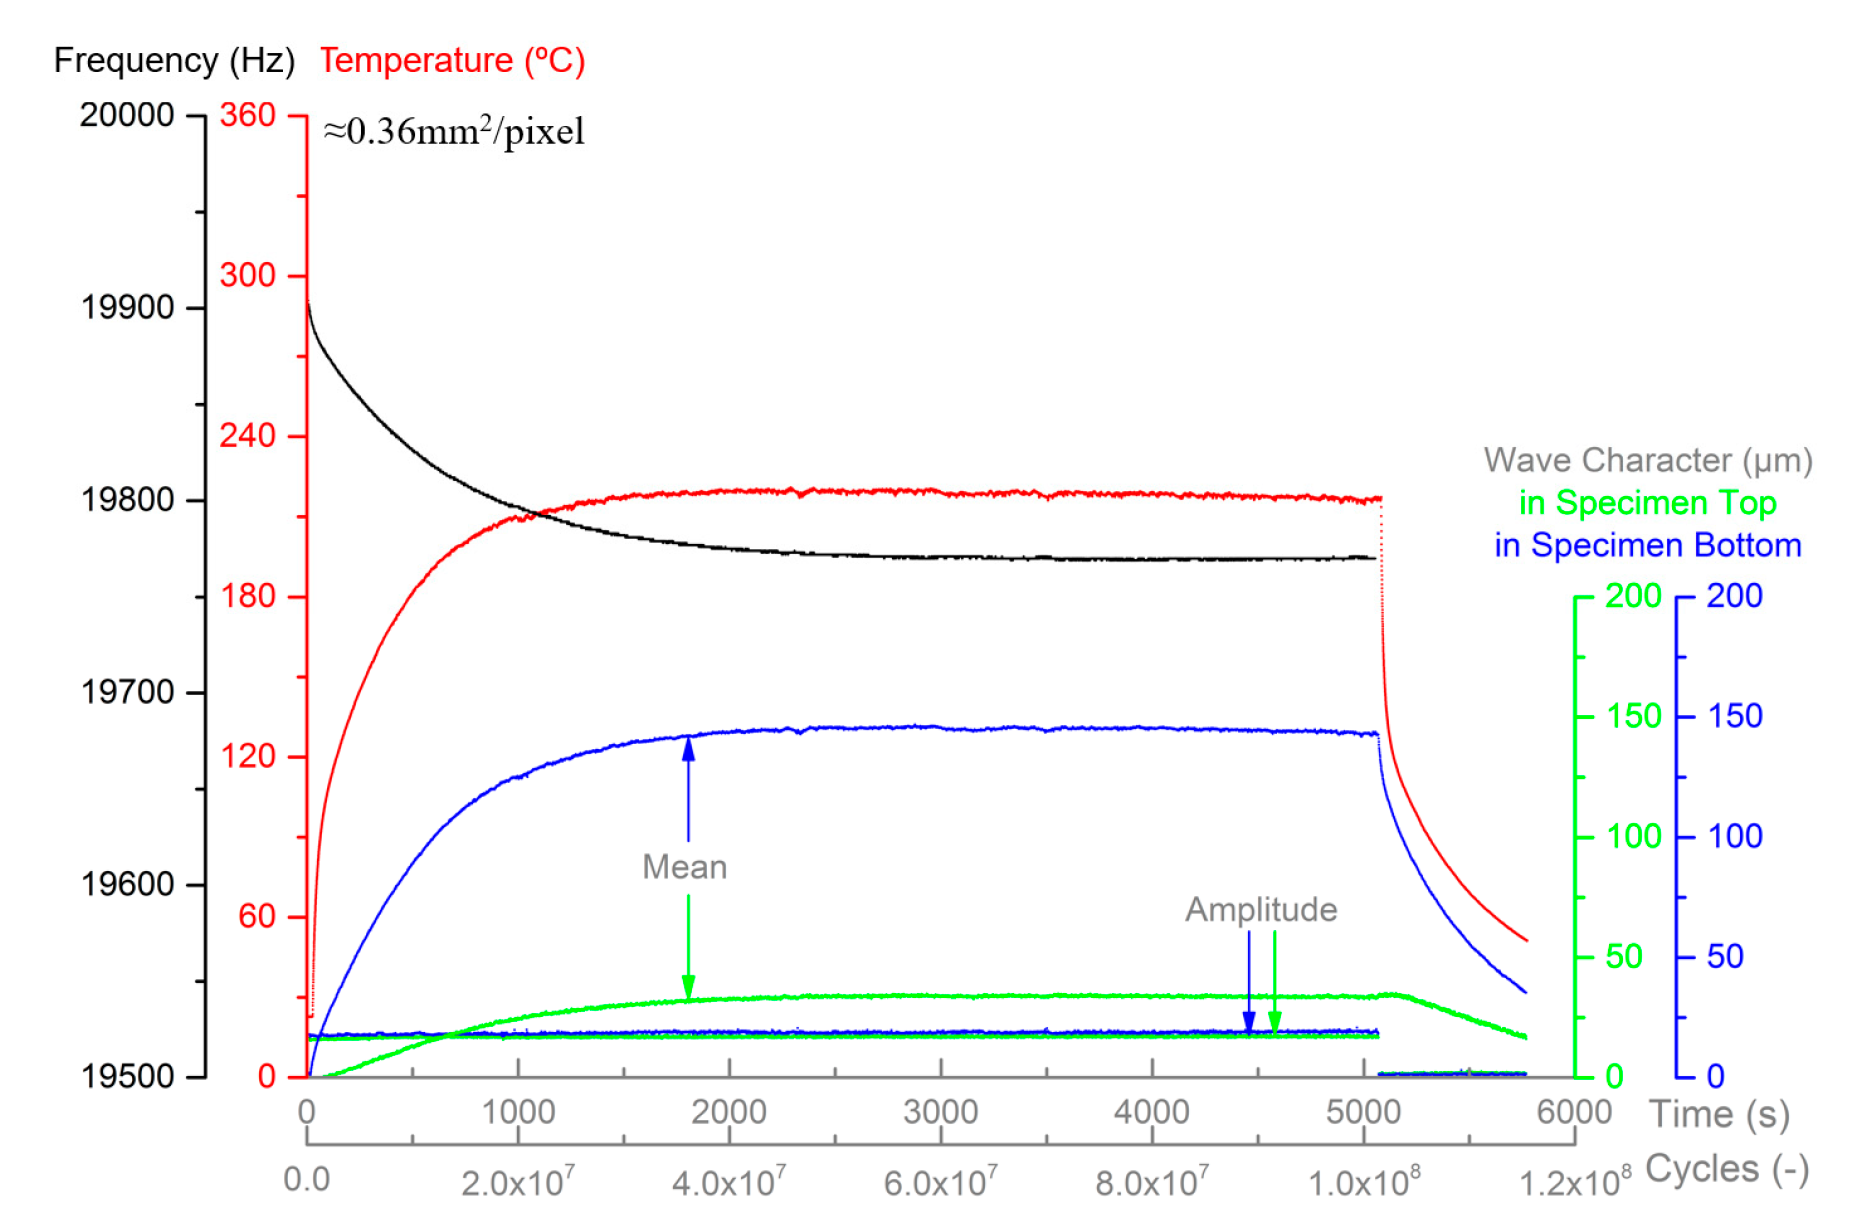
Acquisition system: Keyence® (Osaka, Japan) LK-G5001P laser sensor and Flir® (Wilsonville, OR, USA) A325sc infrared camera were applied to measure and analyze the vibration mode, deformation, and temperature due to the self-heating phenomenon, as shown in Figure 1. NI® 6221 external data acquisition card (DAQ) driven by LabVIEW combined the signals during the test.
Four main parameters were monitored during the test, as shown in Figure 2. Resonance frequency (in black) was converted by the feedback voltage from the power generator. Maximum temperature of the test section of the specimen (in red) was obtained from the infrared image, and it was chosen to be the representative value of the specimen. Amplitude and mean value were calculated from the vibration wave at the top (in green) and bottom (in blue) of the specimen. When the test began, the temperature of the specimen increased due to the self-heating of the material. Therefore, resonance frequency of the assembly (piezoelectric ceramic, booster, horn, and specimen) decreased at the same time. These two values would be steady, after the balance between energy generation and dissipation of the assembly was achieved.
Self-heating caused by the internal friction and microscopic plasticity under high loading frequency is significant during the ultrasonic test. Temperature in the test section of the specimen is up to 300 °C in some cases [31,32]. The emissivity also changes as the specimen surface temperature changes. Conventional optic displacement sensor, which calculates the displacement of reflected light intensity, is not suitable for this kind of test. Contacted strain gauge is also difficult to calibrate for the same reason. The noncontact laser sensor was chosen in this test.
LK-G5001P series sensor with two LK-H022 probes was employed for the test. Sampling rate of 200 kHz was used, taking accuracy and memory consumption into account at the same time. For measured vibration of nearly 20 kHz, there were 10 points to describe one sinusoidal wave on average.
Two probes of the laser sensor were used at the same time for revealing the vibration mode of the specimen. One was set at the bottom of the specimen and the other one was set at the bottom of the horn. The bottom surface of the horn and the top surface of the specimen were considered in the same vibrating situation. The upper probe could be rotated less than 30° due to the geometric obstacle, as shown in Figure 1b. The reading was adjusted through the experimental calibration.
In addition to the amplitude and mean value of vibration shown in the graphical user interface (GUI) in Figure 2, the real vibration waves during the test were also recorded, as shown in Figure 3. The points were detected directly from the sensor probe, and the line was a sinus-fitted curve. Good agreement indicated the steady vibration during the test. Amplitude on the top and bottom were nearly the same, and the opposite phase proved the fully reversed tension-compression mode (R = −1) of the specimen.
Mean value of the wave is the relative distance between the probe and detected surface, which was set to zero before the test. Position of the specimen moved down slightly due to self-heating phenomenon, corresponding to the mean value increase. The difference in mean values between the top and bottom probes allowed us to assess the elongation of the specimen. This value should be the same as the thermal expansion of the specimen.
In addition to the maximum temperature shown in the GUI, the temperature distribution of the specimen surface was also recorded by infrared camera. As mentioned before, elongation of the specimen should be the same as thermal expansion, which was calculated by integration over the specimen. Results of verification in four specific cases are listed in Table 1. The meaning of time corresponds to Figure 2. The difference between thermal expansion and elongation was less than 8%. Good agreement indicated that the infrared camera and laser sensors worked well together during the test.
Moreover, elongation of the specimen remained at about 0.1 mm during the test, while the length of the ultrasonic fatigue specimen was tens of millimeters, in general, regardless of the type of metal. The influence of elongation on resonance was negligible.

3. Experimental Procedures

3.1. Materials

Inconel 718 superalloy is a high-strength, corrosion-resistant, nickel-chromium material used from −250 to +700 °C. It can be fabricated even for complex parts, combining good performance in terms of tensile, fatigue, creep, and rupture strength, which has resulted in its use in a wide range of applications, for example, gas turbine engines, liquid-fueled rockets, and cryogenic tankage [33]. Chemical composition of Inconel 718 analyzed by energy dispersive X-ray spectroscopy (EDS) is listed in Table 2. Density of this batch of raw material was 8180.1 kg/m3.
For most applications, Inconel 718 is used under a precipitation-hardened (aged) condition. This alloy is hardened by the precipitation of secondary phases into the metal matrix [33]. The specific process of direct aging treatment is as follows: solution at 720 °C for 8 h, then furnace cooling at a rate of −50 °C/h for 2 h to 620 °C and aging for another 8 h. The total treatment lasts 18 h, followed by air cooling.
Optical microscope (OM) and scanning electron microscope (SEM) micrographs of Inconel 718 metallographic sample after aged heat treatment are shown in Figure 4. Metallographic sample was polished with SiC paper and diamond paste. It was then etched with Kalling’s II reagent. Twin boundaries could be seen in the micrograph, whose length was less than 20 μm (Figure 4b). Non-strengthened orthorhombic phase δ was incoherent with γ matrix [34]. Lenticular-shaped δ was distributed in the face-centered cubic (FCC) matrix. Lamellar-shaped δ was nucleated in the grain boundary (Figure 4b,d). It was used to control the grain size in wrought materials and also is important for the notch ductility [35]. The diameter of the grains was smaller than 50 μm and the average was 24.6 μm, which was consistent with ASTM 8 [36]. Yield strength σ0.2 of aged Inconel 718 was 1249.3 MPa and ultimate tensile strength σUTS was 1456.7 MPa. Directly aged high-quality (DAHQ) was a special edition developed for advanced turbine discs, and its grain diameter was in the range of 4~10 μm, which is consistent with ASTM 10~12. Specific geometry of Inconel 718 specimen is shown in Figure 5.

3.2. Experimental Test

Fully reversed tension compression loading situation R = −1 by ultrasonic test system was studied in this test. Hourglass axisymmetric profile specimen was chosen for the test, due to its larger stress amplification coefficient. Maximum stress stabilized in the middle test section. For resonance well with the test device, the specimen was designed analytically and then validated numerically using the finite element method (FEM) software ANSYS (Canonsburg, PA, USA). Specific geometry of Inconel 718 specimen is shown in Figure 5.
The self-heating of Inconel 718 specimen caused by internal friction and microscopic plasticity under a high frequency was significant during the test. According to the FEM simulations, natural frequency of specimen decreased by several hundred hertz due to the decrease in the dynamic modulus. However, stress-amplitude coefficient, corresponding to the applied stress in the test section of the specimen, changed less than 5%. Test stress was considered as constant during the self-heating process. It is necessary to point out that the exciting frequency was not set by the user, but was chosen automatically by the Branson® UPS software (St. Louis, MO, USA), according to the minimum total energy consumption, as well as the minimum operating current. This means that specimen did not always vibrate naturally but was forced to vibrate at the frequency suitable for the assembly.
Stress-amplitude relation was also validated by strain gauges. Stress at the test section of the specimen had a linear relationship with the vibration amplitude, since VHCF test was carried out under elastic condition. However, strain gauge did not work in a high level of loading stress due to the temperature increase of the specimen.

4. Results

4.1. S-N Curve

VHCF results of Inconel 718 at 20 kHz are shown in Figure 6. The number of cycles corresponds to the total fatigue lifetime, which was counted from when the test device started until when it stopped due to the frequency loss when fracturing. Surface temperature recording allowed us to determine the transition from initiation to propagation due to the high elevation of thermal dissipation. Crack propagation duration continued from several to tens of seconds depending on the total life and it was always less than 1% of the total fatigue life.
It is clear that Inconel 718 specimen still broke after the traditional endurance limit (107 for ferrous alloys and 108 for nonferrous metals). For age-treated material, fatigue life was sensitive to loading levels. A difference of 100 MPa was found, corresponding to the fatigue life between 106 and 109 cycles, as well as for the DAHQ material. Fatigue life appeared largely scattered. It covered three orders of magnitude at 720 MPa loading stress. Moreover, both DAHQ and aged curves showed a similar slope, which perhaps indicated the same mechanism of fracture. Fatigue strength of the high-quality edition improved 200 MPa more than the common edition, which we treated ourselves.
The scatter of the fatigue test results is now accepted to be an experimental and physical fact [37]. It is generally far too difficult or expensive to entirely remove the experimental error. This is why statistical methods have to be used to experimentally determine the characteristics of the fatigue phenomenon [37]. Basquin model without horizontal asymptote was chosen to fit the test data, as given as Equation (1):
L o g 10 N = a b S
The original Equation (1) is always rewritten as Equation (2) in order to make the loading stress present in ordinate axis Y. Meanwhile, the common logarithm of the fatigue life presents in abscissa axis X.
S = A lg N + B
where S is the loading stress amplitude, N is the number of life cycles to failure, and A and B are fitting constants.
Fitting parameters of the S-N curve of Inconel 718 at 20 kHz are given in Table 3, assuming that the distribution of the loading stress for a given fatigue life cycle follows the normal distribution, also called Laplace Gauss distribution, and the fitting line happens at the 50% probability P of fatigue fracture [38]. Therefore, the prediction of the P-S-N curve (for example, P = 84% and 16%) can be obtained through addition and subtraction of one standard deviation (SD), shown as the dotted line in Figure 6.

4.2. Influence Factor Analysis

Influence factors on the fatigue life, such as loading mode, loading frequency, test temperature, etc., were analyzed by comparing the results with other cases from the literature. Kawagoishi’s team [19,20,21,39,40] investigated the influence of grain size and loading mode on the fatigue properties of Inconel 718. Test results from these articles have been combined with experimental data in this study, as shown in Figure 7. Pulse-pause manner was applied in Kawagoishi’s ultrasonic test to minimize the temperature rise due to the internal friction of the material. This manner is to excite the vibration for a short time and stop for a relative long duration for energy dissipation. Temperature change in the test section of the specimen was controlled below 5~8 °C. Rotary bending (RB) results at 52.5 Hz were marked by the hollow circle. In the VHCF range of 107 to 109 cycles, ultrasonic data were close to our aged material’s data. It was assumed that the loading mode and frequency influenced the VHCF property. Pulse-pause mode or specimen temperature control were not decisive factors for the VHCF fatigue strength of superalloy Inconel 718.
Shi’s team [9,10] compared the very high cycle fatigue behavior of Inconel 718 by ultrasonic tension compression and rotary bending, as shown in Figure 8. Air cooling was applied during the whole process, ensuring the approximate room temperature. Great agreement appeared between two groups of data using ultrasonic loading. It validates the assumption that the temperature increase during the test caused by self-heating was not a significant factor in VHCF range, as long as it was far less than the design temperature limitation of Inconel 718.
Test results by RB were nearly 80 MPa lower. Even if the activation of dislocation for face-centered cubic (FCC) materials after cyclic deformation was less affected by loading frequency, the glide of dislocation was time consuming. RB loading involves more time to damage accumulation than ultrasonic loading for the same fatigue life cycle. This may explain the frequency effect [21]. Energy dissipation is often related to the instability of the microstructure. Temperature increase associated with microstructural transformation seems to be another explanation for the frequency effect in ultrasonic fatigue tests [37].

5. Discussions

5.1. Fracture Morphology

Fracture surface was observed using the OM and SEM. Crack mechanism was disclosed through the feature of fracture morphology. It is necessary to point out that specimen did not break into two parts. In other words, the test device stopped before the crack propagated to all the test section. The cracked specimen was pulled by another tensile fixture.
One, single initiation site existed in all the fractures, regardless of the heat treatment, loading level, or fatigue life. “Fish eye”, which occurs in some VHCF cases [41,42], did not appear in this study. Initiation was situated at the surface or close to the subsurface, as shown in Figure 9. The propagation duration distributed from several to tens of seconds depending on total life, while it was always less than 1% of total fatigue lifetime.
SEM micrographs of the fracture surface of aged Inconel 718 are shown in Figure 10 and Figure 11. It is widely noted that fatigue fracture can be generally divided into several typical areas (Figure 10a): initiation area (I) with a relatively flat surface, propagation area (II) with a distinctly rough area and with radial streaks along the crack propagation direction, and dimples’ zone (III) due to overloading by another tensile grip.
Fine granular area (FGA) [43], also called optical dark area (ODA) [4] and granular bright facet (BGF) [44], indicates the boundary of initiation area I, as marked in Figure 10b. Secondary electrons were excited and emitted from the sample, then entered into the receiver probe inclined to the fracture surface. Thus, the steep surface and radial edge appeared brighter than flat surface FGA (Figure 10b). Murakami [4] assumed that FGA zones are caused by hydrogen embrittlement, in which hydrogen is trapped. Sakai [45] assumed that they are related to the polygonization of microstructure followed by debonding, resulting in crack initiation. Hong [46] proposed that a fine granular layer is observed only when the fatigue testing is conducted under negative load ratios, not under positive ratios.
Crack was initiated at a subsurface smooth facet in the short life case (Figure 10c). The facet had a length of nearly 50 μm and was located at 100 μm from the specimen surface. According to the EDS analysis, the chemical composition of this facet was similar to the surrounding matrix. It was not a precipitation or inclusion. The formation of such facet has not been clearly explained up to now. Some authors [47,48] explained that such a fracture surface pattern comes from the sliding plane, while another author [21,37] proposed a twinning mechanism to explain the very smooth surface. It is supposed that the grain boundary or twin boundary that already existed before the test could explain the very smooth surface in this study.
Propagation area (II) can be divided into several parts according to the difference in the crack growth rate (CGR): near threshold regime, Paris regime, and rapid propagation regime. Quasi-cleavage (or cleavage-like) circumferential beach marks and fine striations appeared (Figure 10d) with the increase in stress intensity factor (SIF), which indicated the stable crack propagation.
For the long-life cases, there was no obvious inclusion or facet in the center of the initiation zone (Figure 11a). It is necessary to point out that secondary crack perpendicular to the main crack significantly improved the fatigue life (Figure 11b). However, the mechanism of the formation of such a secondary crack is still unclear. The presence of a secondary crack maybe the evidence of extensive plastic deformation ahead of the crack tip [49]. Comparison between secondary electrons (SEI) and back-scattered electrons (BSE) mode images of nucleation zone revealed that micro-crack nucleation and growth were not induced by inclusions (Figure 11c,d). It is assumed that the crack nucleated from the persistent slip bands (PSB) in the direction of the maximum shear stress.
Fatigue life of deformation-induced initiation was three orders of magnitude longer than that of facet-induced initiation. Statistical methods should be used to summarize the relationship between initiation type and fatigue life. This part could be explored in the future study.

5.2. Small Crack Growth Mechanism

SEM micrograph of fatigue crack initiation zone for long-life, aged Inconel 718 under a loading of 540 MPa with a total life of 1.57 × 10⁹ cycles is shown in Figure 12. There was no obvious cluster or inclusion in the center of nucleation zone (N). The crack might have nucleated from grain or twin boundary, which always was treated as a weakness to form PSBs, irrespective of cyclic frequency and loading condition. PSB-induced crack was also observed in the RB test using replica technique. It happened in the direction close to the maximum shear stress accumulated near the twin boundary and degenerated into main cracks [8]. Quasi-cleavage fracture emerged initially in transgranular ductile mode in zone (T), with crack extension in a depth of 80 μm from the specimen surface. The trace of gliding occurred at a 45° direction to the main crack. Then the crack tended to trace grain boundaries in an intergranular manner after growing beyond 150 μm by cleavage-dominated mixed mode in zone (I).

6. Conclusions

(1)
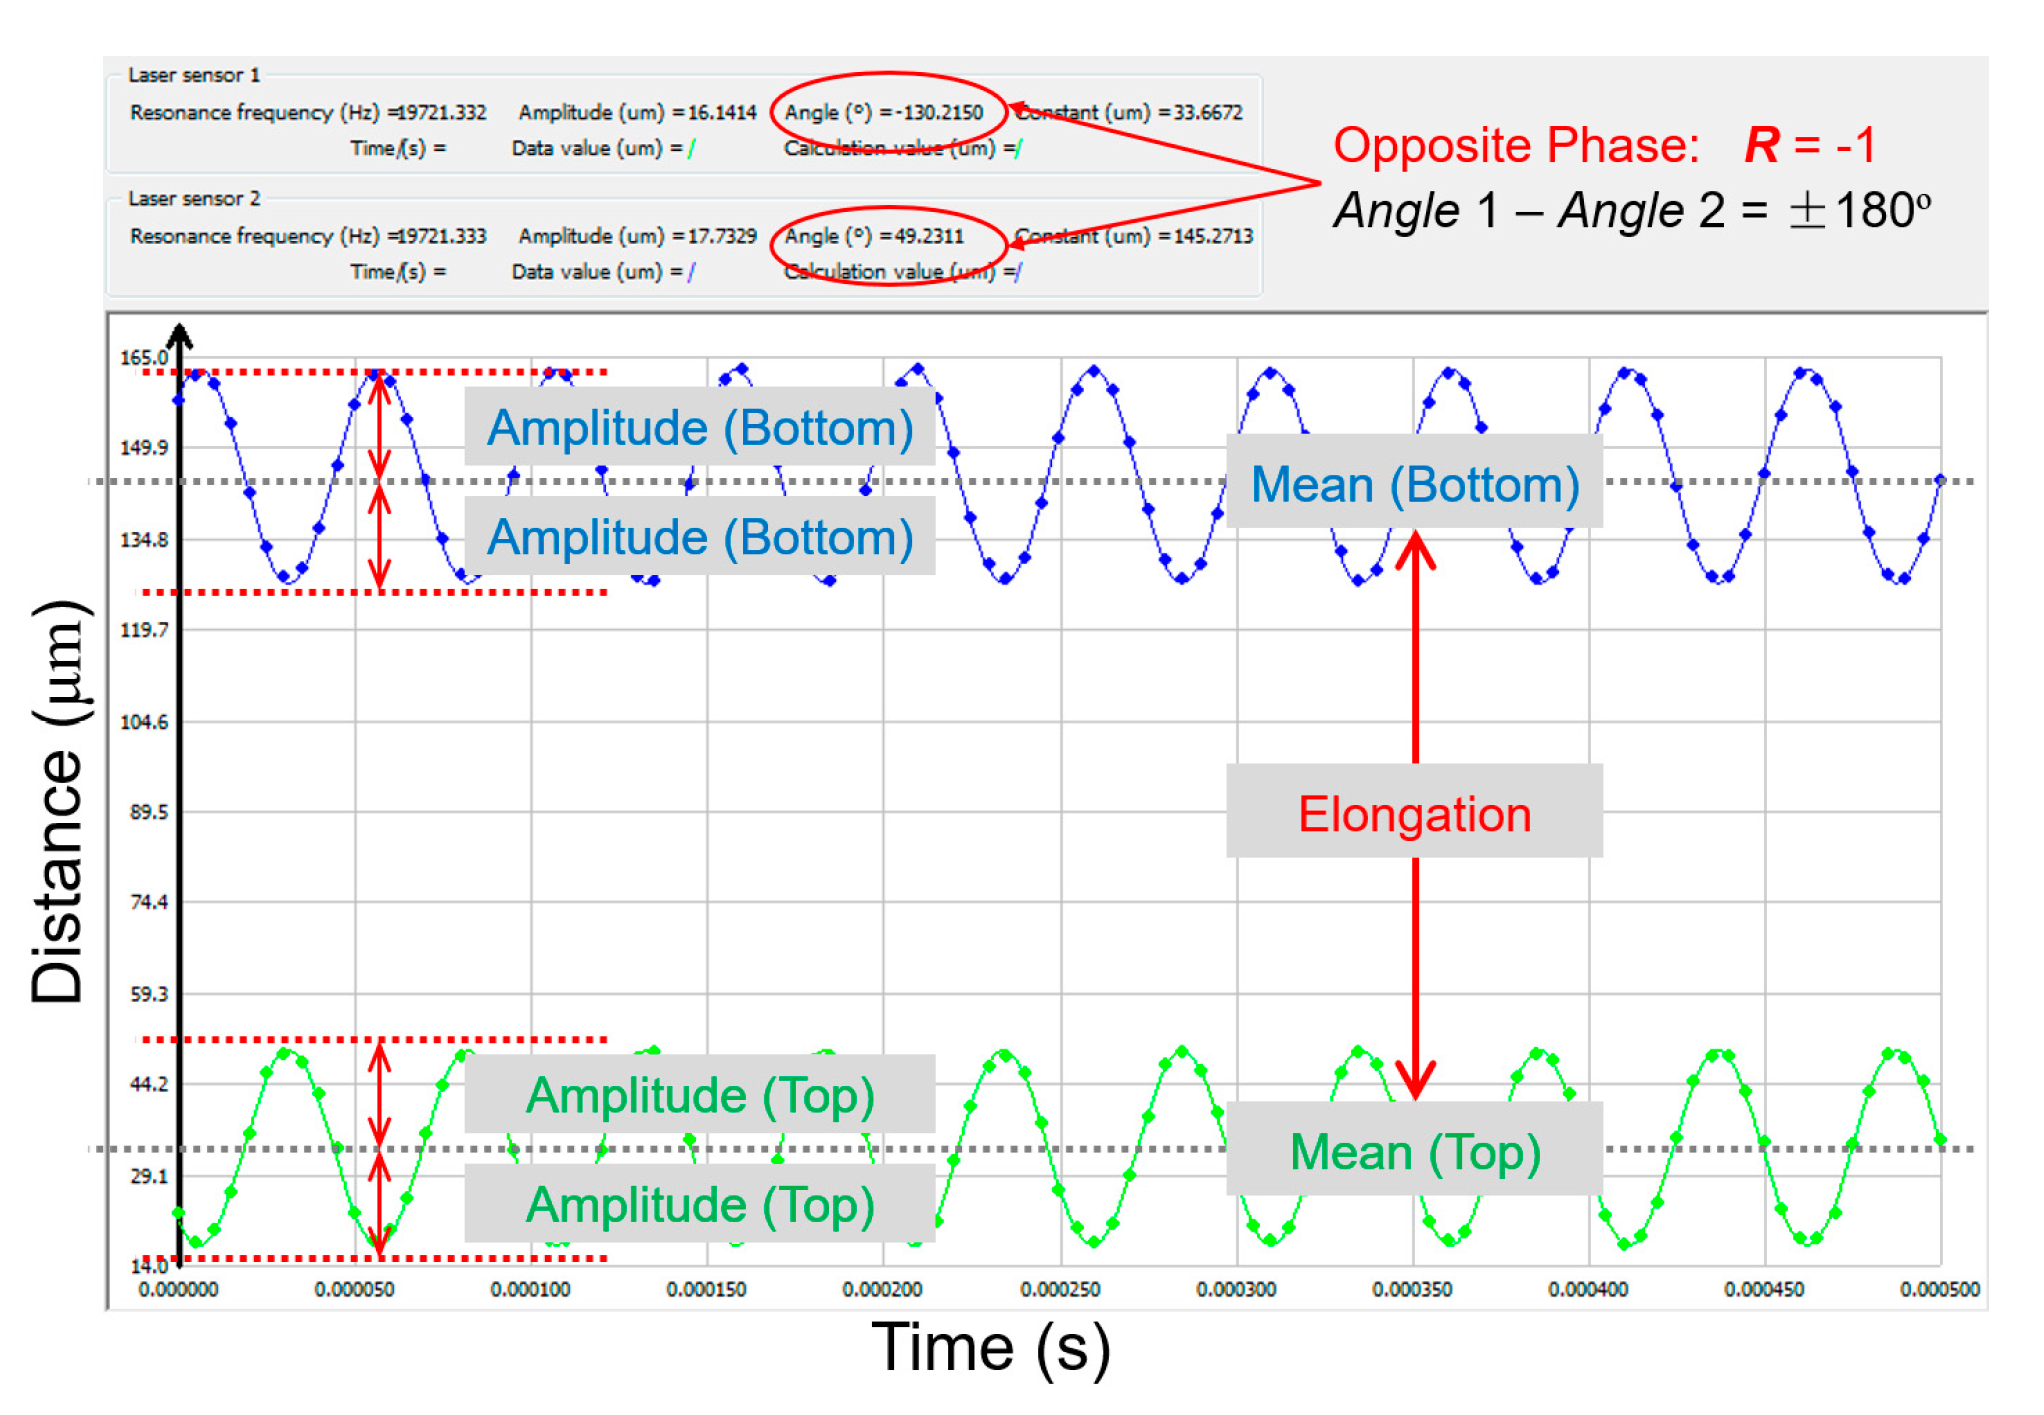
Data acquisition system was improved using NI® LabVIEW for monitoring the frequency, temperature, and displacement during the tests. Fully reversed tension-compression sinusoidal mode (R = −1) at 20 kHz was proved through the opposite phase of vibration on the top and bottom of the specimen. Elongation results obtained by a laser sensor and thermal expansion results calculated by an infrared camera were in good agreement.
(2)
The S-N curve of Inconel 718 in the VHCF regime at 20 kHz with self-heating phenomenon was presented. The propagation duration continued from several to tens of seconds. More than 99% of fatigue life was consumed in initiation. Fatigue life of aged Inconel 718 was sensitive to loading levels. A difference of 100 MPa was found, corresponding to the fatigue life between 106 and 109 cycles.
(3)
Influence factors on VHCF life were analyzed. Good agreement appeared between test data with self-heating phenomenon and others with cooling. Self-heating phenomenon as well as specimen temperature change were not decisive factors on VHCF strength for superalloy Inconel 718, as long as the temperature increase was far less than the design temperature limitation.
(4)
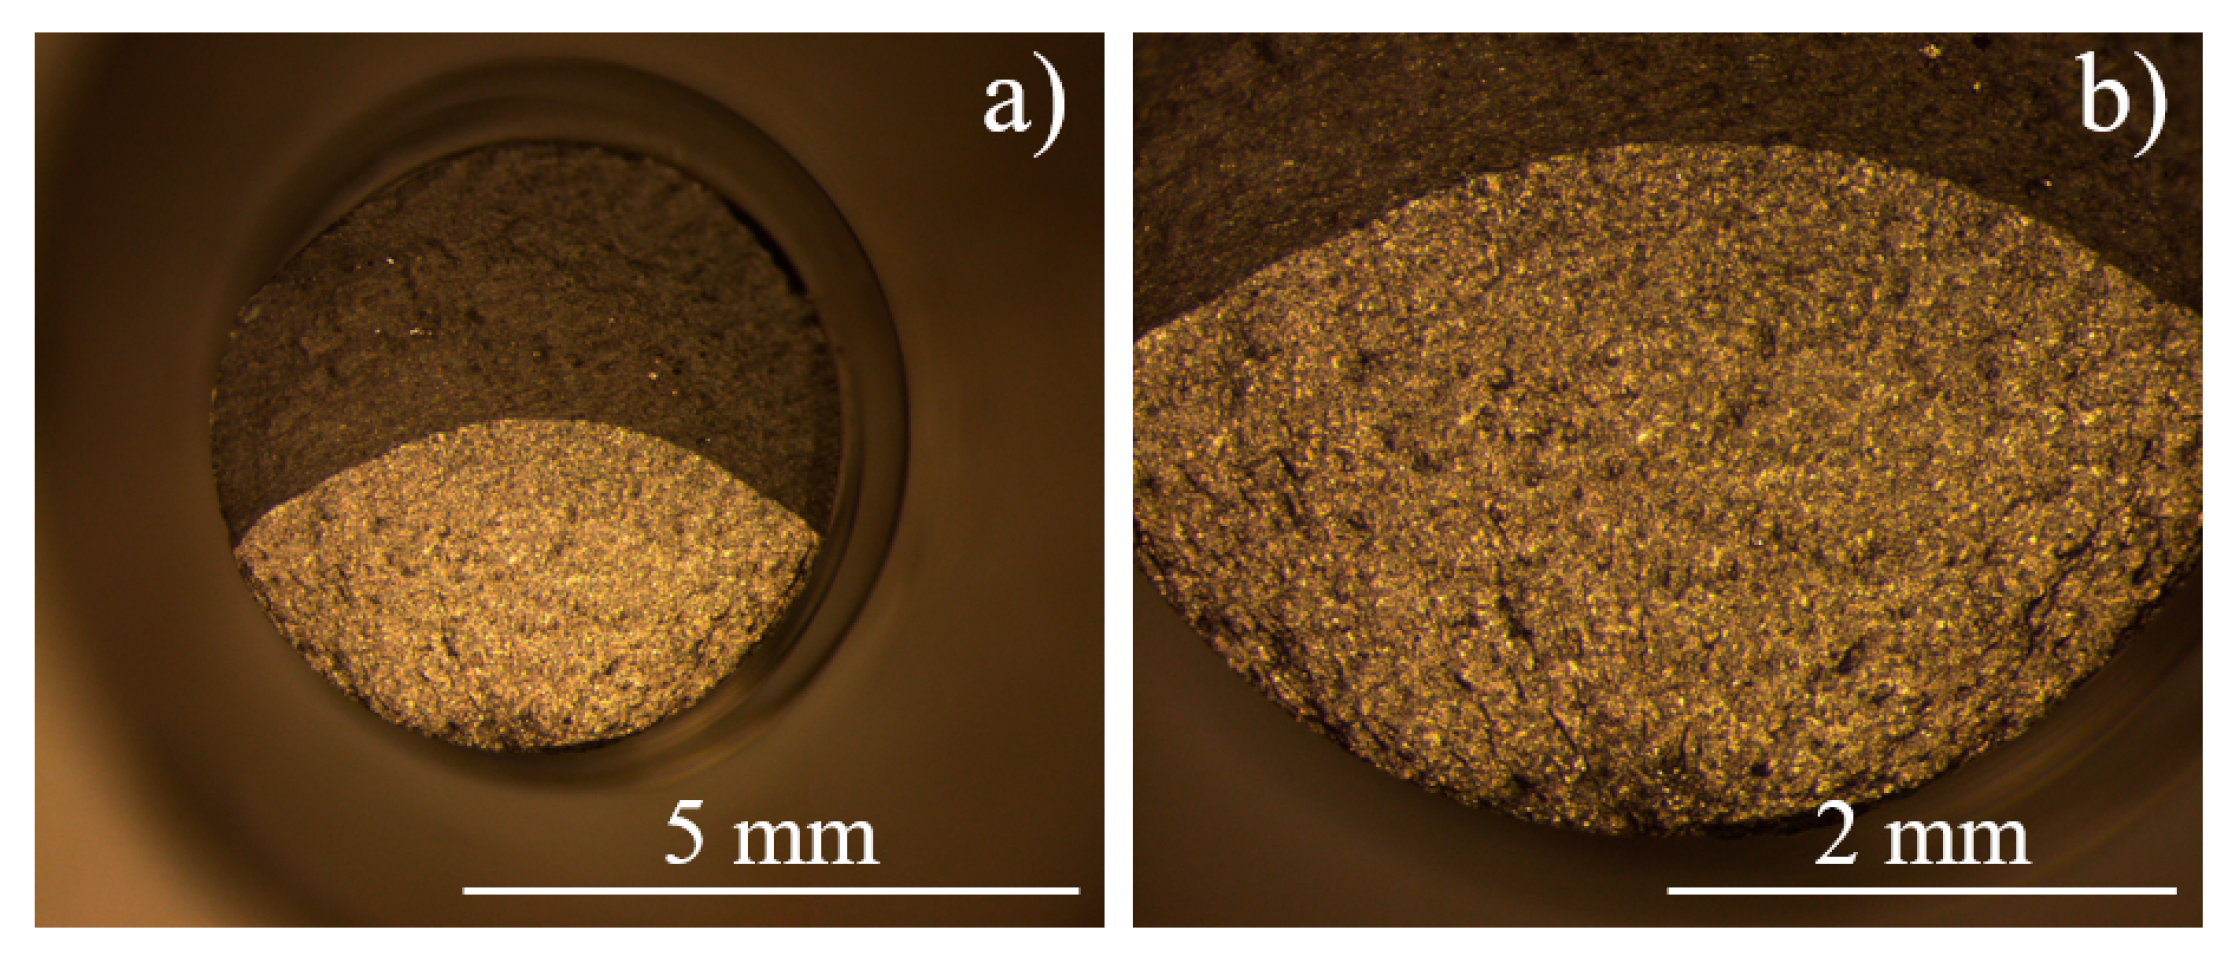
One, single initiation site was observed, regardless of the loading level and total fatigue life cycles. Initiation was situated at the subsurface facet or persistent slip bands in the direction of the maximum shear stress. Quasi-cleavage fracture emerged initially in transgranular ductile mode with crack extension in a depth of 80 μm from the specimen surface. Then the crack tended to trace the grain boundaries in an intergranular manner after growing beyond 150 μm in cleavage-dominated mixed mode.

Author Contributions

Conceptualization—M.Z.; methodology—T.W. and Z.Z.; validation—L.L. and G.L.; supervision—W.C.; writing—original draft preparation, M.Z.; writing—review and editing, T.W. All authors have read and agreed to the published version of the manuscript.

Funding

This research received no external funding.

Acknowledgments

Author Mengxiong Zhao highly appreciates the support of Olivier Polit and Emmanuel Valot from Université Paris X Nanterre for their assistance in fatigue experiments, of Thierry Palin-Luc from Arts et Métiers ParisTech for the profound discussion, and of Vincent Bonnand from Onera for the specimen supply.

Conflicts of Interest

The authors declare no conflict of interest.

Nomenclature

BSEback-scattered electronsCsstress-amplitude coefficient
EDSenergy dispersive X-ray spectroscopyffrequency of loading
FCCface-centered cubicNfnumber of cycles
OMoptical microscopeRstress ratio
PSBpersistent slip bandSstress amplitude
RBrotary bendingσ0.2yield strength
SEIsecondary electronsσUTSultimate strength
SEMscanning electron microscope
SIFstress intensity factor
VHCFvery high cycle fatigue

References

  1. Bathias, C.; Paris, P.C. Gigacycle Fatigue in Mechanical Practice; Informa UK Limited: London, UK, 2004. [Google Scholar]
  2. Bathias, C. Piezoelectric fatigue testing machines and devices. Int. J. Fatigue 2006, 28, 1438–1445. [Google Scholar] [CrossRef]
  3. Bathias, C.; Drouillac, L.; Le François, P. How and why the fatigue S–N curve does not approach a horizontal asymptote. Int. J. Fatigue 2001, 23, 143–151. [Google Scholar] [CrossRef]
  4. Murakami, Y.; Yokoyama, N.N.; Nagata, J. Mechanism of fatigue failure in ultralong life regime. Fatigue Fract. Eng. Mater. Struct. 2002, 25, 735–746. [Google Scholar] [CrossRef]
  5. Stanzl-Tschegg, S.E.; Mayer, H. Fatigue and fatigue crack growth of aluminium alloys at very high numbers of cycles. Int. J. Fatigue 2001, 23, 231–237. [Google Scholar] [CrossRef]
  6. Wang, Q.; Berard, J.; Dubarre, A.; Baudry, G.; Rathery, S.; Bathias, C. Gigacycle fatigue of ferrous alloys. Fatigue Fract. Eng. Mater. Struct. 1999, 22, 667–672. [Google Scholar] [CrossRef]
  7. Furuya, Y.; Matsuoka, S.; Abe, T.; Yamaguchi, K. Gigacycle fatigue properties for high-strength low-alloy steel at 100 Hz, 600 Hz, and 20 kHz. Scr. Mater. 2002, 46, 157–162. [Google Scholar] [CrossRef]
  8. Bayraktar, E.; Garcias, I.; Bathias, C. Failure mechanisms of automotive metallic alloys in very high cycle fatigue range. Int. J. Fatigue 2006, 28, 1590–1602. [Google Scholar] [CrossRef]
  9. Tridello, A.; Paolino, D.; Rossetto, M. Ultrasonic VHCF Tests on Very Large Specimens with Risk-Volume Up to 5000 mm3. Appl. Sci. 2020, 10, 2210. [Google Scholar] [CrossRef] [Green Version]
  10. Paolino, D.S.; Tridello, A.; Fiocchi, J.; Biffi, C.A.; Chiandussi, G.; Rossetto, M.; Tuissi, A. VHCF Response up to 109 Cycles of SLM AlSi10Mg Specimens Built in a Vertical Direction. Appl. Sci. 2019, 9, 2954. [Google Scholar] [CrossRef] [Green Version]
  11. Tridello, A.; Paolino, D.; Chiandussi, G.; Rossetto, M. Analytical Design of Gigacycle Fatigue Specimens for Size Effect Evaluation. Key Eng. Mater. 2013, 369–372. [Google Scholar] [CrossRef]
  12. Paolino, D.S.; Tridello, A.; Chiandussi, G.; Rossetto, M. On specimen design for size effect evaluation in ultrasonic gigacycle fatigue testing. Fatigue Fract. Eng. Mater. Struct. 2014, 37, 570–579. [Google Scholar] [CrossRef] [Green Version]
  13. Chaboche, J.; Nouailhas, D.; Pacou, D.; Paulmier, P. Modeling of the cylic response and ratchetting effects on inconel-718 alloy. Eur. J. Mechan. A Solids 1991, 10, 101–121. [Google Scholar]
  14. Solberg, K.; Wan, D.; Berto, F. Fatigue assessment of as-built and heat-treated Inconel 718 specimens produced by additive manufacturing including notch effects. Fatigue Fract. Eng. Mater. Struct. 2020, 43, 2326–2336. [Google Scholar] [CrossRef]
  15. Berto, F.; Berto, F. The effect of defects and notches in quasi-static and fatigue loading of Inconel 718 specimens produced by selective laser melting. Int. J. Fatigue 2020, 137. [Google Scholar] [CrossRef]
  16. Solberg, K.; Berto, F. Notch-defect interaction in additively manufactured Inconel 718. Int. J. Fatigue 2019, 122, 35–45. [Google Scholar] [CrossRef]
  17. Solberg, K.; Torgersen, J.; Berto, F. Fatigue Behaviour of Additively Manufactured Inconel 718 Produced by Selective Laser Melting. Procedia Struct. Integr. 2018, 13, 1762–1767. [Google Scholar] [CrossRef]
  18. Zhong, L.; Hu, H.; Liang, Y.; Huang, C. High Cycle Fatigue Performance of Inconel 718 Alloys with Different Strengths at Room Temperature. Metals 2018, 9, 13. [Google Scholar] [CrossRef] [Green Version]
  19. Yan, N.; Kawagoishi, N.; Maeda, Y.; Chen, Q. Effect of loading frequency on fatigue properties of Ni-base super alloy Inconel 718. Struct. Longev. 2010, 4, 145–152. [Google Scholar]
  20. Kawagoishi, N.; Maemura, E.; Chen, Q.; Goto, M.; Morino, K. Effect of Grain Size on Ultrasonic Fatigue Properties of Ni-Base Super Alloy Inconel 718. Trans. Jpn. Soc. Mech. Eng. Ser. A 2008, 74, 1000–1005. [Google Scholar] [CrossRef] [Green Version]
  21. Chen, Q.; Kawagoishi, N.; Wang, Q.; Yan, N.; Ono, T.; Hashiguchi, G. Small crack behavior and fracture of nickel-based superalloy under ultrasonic fatigue. Int. J. Fatigue 2005, 27, 1227–1232. [Google Scholar] [CrossRef]
  22. Zhang, Y.; Duan, Z.; Shi, H.-J. Comparison of the very high cycle fatigue behaviors of INCONEL 718 with different loading frequencies. Sci. China Ser. G Phys. Mech. Astron. 2013, 56, 617–623. [Google Scholar] [CrossRef]
  23. Ma, X.-F.; Duan, Z.; Shi, H.-J.; Murai, R.; Yanagisawa, E. Fatigue and fracture behavior of nickel-based superalloy Inconel 718 up to the very high cycle regime. J. Zhejiang Univ. A 2010, 11, 727–737. [Google Scholar] [CrossRef]
  24. Amanov, A.; Pyun, Y.-S.; Kim, J.-H.; Suh, C.-M.; Cho, I.-S.; Kim, H.; Wang, Q.; Khan, M. Ultrasonic fatigue performance of high temperature structural material Inconel 718 alloys at high temperature after UNSM treatment. Fatigue Fract. Eng. Mater. Struct. 2015, 38, 1266–1273. [Google Scholar] [CrossRef]
  25. Belan, J. High frequency fatigue test of IN 718 alloy–microstructure and fractography evaluation. Metalurgija 2015, 54, 59–62. [Google Scholar]
  26. Belan, J. The Fractography Analysis of IN 718 Alloy after Fatigue Test. Key Eng. Mater. 2014, 635, 9–12. [Google Scholar] [CrossRef]
  27. Yang, K.; Huang, Q.; Wang, Q.; Chen, Q. Competing crack initiation behaviors of a laser additively manufactured nickel-based superalloy in high and very high cycle fatigue regimes. Int. J. Fatigue 2020, 136. [Google Scholar] [CrossRef]
  28. Texier, D.; Cormier, J.; Villechaise, P.; Stinville, J.-C.; Torbet, C.J.; Pierret, S.; Pollock, T.M. Crack initiation sensitivity of wrought direct aged alloy 718 in the very high cycle fatigue regime: The role of non-metallic inclusions. Mater. Sci. Eng. A 2016, 678, 122–136. [Google Scholar] [CrossRef]
  29. Texier, D.; Stinville, J.-C.; Echlin, M.P.; Pierret, S.; Villechaise, P.; Pollock, T.M.; Cormier, J. Short crack propagation from cracked non-metallic inclusions in a Ni-based polycrystalline superalloy. Acta Mater. 2019, 165, 241–258. [Google Scholar] [CrossRef] [Green Version]
  30. Pineau, A.; Antolovich, S.D. Probabilistic approaches to fatigue with special emphasis on initiation from inclusions. Int. J. Fatigue 2016, 93, 422–434. [Google Scholar] [CrossRef]
  31. Pu, X.; Petit, J.; Darbord-Ranc, I.; Wagner, D. Thermal response of iron and C-Mn steels with different ferrite/pearlite phase fraction under ultrasonic fatigue loading. Mater. Sci. Eng. A 2019, 749, 96–105. [Google Scholar] [CrossRef]
  32. Bathias, C. Coupling effect of plasticity, thermal dissipation and metallurgical stability in ultrasonic fatigue. Int. J. Fatigue 2014, 60, 18–22. [Google Scholar] [CrossRef]
  33. Inconel 718 Handbook. Available online: https://www.specialmetals.com/assets/smc/documents/alloys/inconel/inconel-alloy-718.pdf (accessed on 20 October 2020).
  34. Huang, R.; Sun, Y.; Xing, L.; Song, G.; Liu, W.; Li, Q. Effect of gradient microstructure pinned by δ phase on elevated temperature performances of GH4169. Mater. Sci. Eng. A 2020, 774. [Google Scholar] [CrossRef]
  35. Radavich, J. The Physical Metallurgy of Cast and Wrought Alloy 718. In Conference Proceedings on Superalloys; The Minerals, Metals & Materials Society: Pittsburgh, PA, USA, 1989; pp. 229–240. [Google Scholar] [CrossRef]
  36. ASTM Standard. ASTM E112-10: Standard Test Methods for Determining Average Grain Size; ASTM International: West Conshohocken, PA, USA, 2010. [Google Scholar]
  37. Bathias, C. Influence of the metallurgical instability on the gigacycle fatigue regime. Int. J. Fatigue 2010, 32, 535–540. [Google Scholar] [CrossRef]
  38. Bathias, C.; Pineau, A. Fatigue of Materials and Sructures: Fundamentals; Wiley Online Library: Hoboken, NJ, USA, 2010. [Google Scholar]
  39. Yan, N.; Kawagoishi, N.; Chen, Q.; Wang, Q.Y.; Nisitani, H.; Kondo, E. Fatigue Properties of Inconel 718 in Long Life Region at Elevated Temperature. Key Eng. Mater. 2003, 243, 321–326. [Google Scholar] [CrossRef]
  40. Kawagoishi, C. Nisitani Fatigue strength of Inconel 718 at elevated temperatures. Fatigue Fract. Eng. Mater. Struct. 2000, 23, 209–216. [Google Scholar] [CrossRef]
  41. Nguyen, H.; Gallimard, L.; Bathias, C. Numerical simulation of fish-eye fatigue crack growth in very high cycle fatigue. Eng. Fract. Mech. 2015, 135, 81–93. [Google Scholar] [CrossRef]
  42. Nguyen, H.; Gallimard, L.; Bathias, C. Numerical simulation of the coupling between thermal dissipation and fish-eye crack growth in very high cycle fatigue regime. Fatigue Fract. Eng. Mater. Struct. 2012, 36, 450–461. [Google Scholar] [CrossRef] [Green Version]
  43. Sakai, T. Review and Prospects for Current Studies on Very High Cycle Fatigue of Metallic Materials for Machine Structural Use. J. Solid Mech. Mater. Eng. 2009, 3, 425–439. [Google Scholar] [CrossRef] [Green Version]
  44. Shiozawa, K.; Morii, Y.; Nishino, S. Subsurface Crack Initiation and Propagation Mechanism under the Super-Long Fatigue Regime for High Speed Tool Steel (JIS SKH51) by Fracture Surface Topographic Analysis. JSME Int. J. Ser. A 2006, 49, 1–10. [Google Scholar] [CrossRef] [Green Version]
  45. Sakai, T.; Oguma, N.; Morikawa, A. Microscopic and nanoscopic observations of metallurgical structures around inclusions at interior crack initiation site for a bearing steel in very high-cycle fatigue. Fatigue Fract. Eng. Mater. Struct. 2015, 38, 1305–1314. [Google Scholar] [CrossRef]
  46. Hong, Y.; Liu, X.; Lei, Z.; Sun, C. The formation mechanism of characteristic region at crack initiation for very-high-cycle fatigue of high-strength steels. Int. J. Fatigue 2016, 89, 108–118. [Google Scholar] [CrossRef] [Green Version]
  47. Yi, J.; Torbet, C.; Feng, Q.; Pollock, T.; Jones, J. Ultrasonic fatigue of a single crystal Ni-base superalloy at 1000 °C. Mater. Sci. Eng. A 2007, 443, 142–149. [Google Scholar] [CrossRef]
  48. Andersson, H. In-situ SEM study of fatigue crack growth behaviour in IN718. Int. J. Fatigue 2004, 26, 211–219. [Google Scholar] [CrossRef]
  49. Pineau, A.; Benzerga, A.A.; Pardoen, T. Failure of metals I: Brittle and ductile fracture. Acta Mater. 2016, 107, 424–483. [Google Scholar] [CrossRef] [Green Version]
Figure 1. Schema of ultrasonic fatigue test device: (a) test device with data acquisition system, (b) laser sensor probes’ arrangement.
Applsci 10 08761 g001
Figure 2. Data acquisition interface (R = −1, f = 20 kHz, Nf = 1 × 10⁸, no crack).
Applsci 10 08761 g002
Figure 3. Original vibration wave obtained from laser sensor (R = −1, f = 20 kHz).
Applsci 10 08761 g003
Figure 4. Optical microscope (OM) and scanning electron microscope (SEM) micrographs of aged Inconel 718: (a,b) optical micrographs; (c,d) scanning electron micrographs.
Applsci 10 08761 g004
Figure 5. Specific geometry of Inconel 718 specimen tested at 20 kHz.
Applsci 10 08761 g005
Figure 6. Very high cycle fatigue (VHCF) behavior of Inconel 718 with self-heating (R = −1, f = 20 kHz).
Applsci 10 08761 g006
Figure 7. VHCF property comparison with Kawagoishi’s team [19,20,21,39,40].
Applsci 10 08761 g007
Figure 8. VHCF property comparison with Shi’s team [22,23].
Applsci 10 08761 g008
Figure 9. OM fracture images of aged Inconel 718 (R = −1, f = 20 kHz): (a) low zoom, (b) high zoom.
Applsci 10 08761 g009
Figure 10. SEM micrographs of fracture surface of aged Inconel 718 (σa = 600 MPa, Nf = 1.58 × 10⁶ cycles): (a) fatigue fracture, (b) initiation, (c) nucleation, (d) propagation.
Applsci 10 08761 g010
Figure 11. SEM micrographs of fracture surface of aged Inconel 718 (σa = 540 MPa, Nf = 1.57 × 10⁹ cycles): (a) fatigue fracture, (b) initiation, (c,d) nucleation.
Applsci 10 08761 g011
Figure 12. SEM micrograph of aged Inconel 718 (R = −1, f = 20 kHz, σa = 540 MPa, Nf = 1.57 × 10⁹).
Applsci 10 08761 g012
Table 1. Elongation verification of Inconel 718 with self-heating at 20 kHz.
Case300 s500 s1000 s5000 s
Thermal expansion (µm)85.50104.3117.3121.2
Elongation (µm)86.5996.44110.1113.8
Table 2. Chemical composition of raw Inconel 718.
ElementNiCrFeNbMoTiAl
wt.%51.1019.6220.284.782.521.140.56
Table 3. Fitting parameters of stress vs. number of cycles (S-N) curve.
ABSD (MPa)
DAHQ−19.52872,3021.12
Aged−23.93755,2215.32
Publisher’s Note: MDPI stays neutral with regard to jurisdictional claims in published maps and institutional affiliations.

