Article

Extended Use for the Frequency Response Analysis: Switching Impulse Voltage Based Preliminary Diagnosis of Potential Sources of Partial Discharges in Transformer

by
Kamalaselvan Arunachalam
1,
Balasubramanian Madanmohan
1,
Rajesh Rajamani
1,
Natarajan Prabaharan
1,*,
Hassan Haes Alhelou
2,* and
Pierluigi Siano
3,*
1
Department of EEE, School of Electrical & Electronics Engineering, SASTRA Deemed University, Tamilnadu 613401, India
2
Department of Electrical Power Engineering, Faculty of Mechanical and Electrical Engineering, Tishreen University, Lattakia 2230, Syria
3
Department of Management and Innovation Systems, University of Salerno, 84084 Salerno, Italy
*
Authors to whom correspondence should be addressed.
Appl. Sci. 2020, 10(22), 8283; https://doi.org/10.3390/app10228283
Submission received: 13 October 2020 / Revised: 12 November 2020 / Accepted: 19 November 2020 / Published: 22 November 2020

Abstract

:
The Frequency Response Analysis approach (FRA) is useful in the fault diagnosis of transformers. However, its usefulness in diagnosing any potential sources of Partial Discharge (PD) in transformers has not been thoroughly investigated so far. In this work, the use of Impulse voltage-based FRA (IFRA) in diagnosing inter-turn shorts and potential sources of PD were investigated on a 315 kVA, 11 kV/433 V transformer. Inter-turn shorts and PD sources were emulated and the usefulness of IFRA in their diagnosis was investigated while using switching impulse voltage at different magnitude levels as the test signals. For emulating the inter-turn shorts and the PDs, special tappings were provided on one of the 11 kV windings through the low capacitance bushings. Low voltage impulse was successful in diagnosing the inter-turn shorts, but unsuccessful in identifying the sources of PDs. During the test condition, the test voltage was adjusted with the presence of artificially created PD sources. The frequency response of the transformer before and after the inception of PD was observed and analyzed in this article. The FRA results demonstrated that the switching impulse voltage based IFRA approach at moderate voltages could be useful in diagnosing the presence of the potential sources of PDs.

1. Introduction

The Frequency Response Analysis (FRA) approach has been effectively used for mechanical, electrical, and magnetic core fault diagnosis purposes, such as axial and radial displacements/deformations, loosening of clamping pressure, inter-turn shorts, grounding issues, and core saturation problems, as per standards, working group recommendations, and literature [1,2,3,4,5,6]. They used a broad spectrum of frequency components, contained either a sweep sinusoidal signal of constant magnitude or lightning/switching impulses [1,4]. Several simulations and real-time researches were carried out and reported so far, in order to demonstrate the usefulness of FRA approach in fault diagnosis and condition monitoring of transformers and other power system equipments [7,8]. Rami Kahoul et al. used frequency response plots in their behavioural modeling works of electromagnetic interference (EMI) and electromagnetic compatibility (EMC) of DC machines, and demonstrated the usefulness of the frequency domain analysis in performance characteristic analysis [9,10].
Literature also reports on the factors influencing the sensitivity of FRA, different transfer function approaches, and comparison between Lightning impulse voltage-based Frequency Response Analysis (LFRA) and Sweep sinusoidal voltage-based Frequency Response Analysis (SFRA) [11,12,13]. The SFRA approach is standardized, so that most of the recent works were carried out based on the sweep frequency response approach with different transfer functions [14,15,16]. However, for Impulse-based Frequency Response Analysis (IFRA), the same methodology and transformer connections can be applied, as explained in literature [14]. The conventional SFRA and LFRA approaches use the test signals of a low magnitude that are found to be sufficient for the diagnosis of mechanical displacement of windings, inter-turn shorts, and magnetic core issues. As per IEC 60270(2000), partial discharge (PD) is a localized electrical discharge that only partially bridges the insulation. In general, Partial discharges are a consequence of local electrical stress concentrations in the insulation [17]. Across a potential source of PD (like Void, air or oil bubble contained inside transformer insulation), a discharge can happen when the potential across the same in the form of alternating/direct/impulse voltage exceeds the discharge inception level. Several literature are available for the diagnosis of PD, such as power frequency-based PD test, the ultrahigh frequency (UHF) method, acoustic emission (AE) method, and dissolved gas analysis (DGA). Most of the conventional tests use power frequency as the test signal. For example, Gyung-Suk Kil et al. demonstrated the PD diagnosis in insulating oil across needle-plane, plane-plane and wire wire electrodes through frequency analysis of the acoustic signal [18]. However, for the diagnosis of the voltage-dependent problems, like PD, the conventional low magnitude SFRA and LFRA are not suitable.
In the motivating work of R.Malewski and B.Poulin, on the electrical faults diagnosis through the lightning impulse voltage, PD was artificially emulated with the help of ‘Diacs’ in an ‘un-tanked disc winding assembly’, and its diagnosis was successfully demonstrated [19]. Xuanrui Zhang et al. discussed the usefulness of the test results in the frequency domain with oscillating impulses, during the detection of the partial discharges within transformer insulation [20]. Marek Florkowski discussed the effect of impulse voltage on the PD parameters [21]. From the above mentioned experimental works, it is clearly evident that the sources of PD offer the loading effects.Various simulation and experimental investigations were attempted for detecting the PD with non-conventional approaches [22,23,24]. Simulated and real-time winding models of transformers/rotating machines and un-tanked transformer windings were used as the test specimens. In these works, PD test at power frequency was not focused. Instead, Square/Chirp pulses, impulses, and PD pulses from PD calibrators were injected purposefully, as the test signals into the transformer windings (which are viewed as PD pulse equivalents for experimental purpose) [22,23,24]. The travelling wave-based approach was investigated in both the time domain and frequency domain. It has been used in order to identify the single/multiple PD diagnosis and PD location. Under emulated PD conditions, the test specimen was found to offer a change in its responses to such test signals. However, these works were carried out on the transformer winding models. The influences of core, tank, full sets of LV and HV windings, and bushings in a practical transformer on the wave shape and frequency components of the test signal were not considered.
From the literature, it understood that the implementation of IFRA with a proper magnitude of voltage and a broad frequency spectrum could be useful for diagnosing PD in transformer. To check the viability of IFRA in PD diagnosis, an experimental work has been carried out at the HV lab of SASTRA, on a three-phase, 315 kVA, 11 kV/433 V, Dyn 11, Oil Natural Air Natural (ONAN) distribution transformer. This transformer has tappings on one of its 11 kV disc windings. These tappings are available at the sidewalls of the tank for external connections through the suitable low capacitance bushings, which is not altering the transformer electrical circuitry. During earlier research works, preliminary experiments have been conducted before and after the inclusion of these bushings. It has been confirmed that their loading effects during the impulse voltage performance of the transformer were negligible [25]. Inter-turn shorts and PDs can be artificially created using these tappings of the transformer winding without causing any permanent damage to the insulation.
In the present work, some inter-turn shorts and potential sources of PD are artificially emulated whlie using these externally brought tappings of the winding. The inter-turn short is modelled by connecting a low ohmic resistor across the tappings. For the PD diagnostic tests, the PD source is modelled while using an oil gap of 2 mm, such that the loading effect during its discharge-free condition on the impulse response of the transformer is negligible. For the diagnosis of full transformer, the windings in the HV side/LV side needs to be tested one by one. The present work is only focused on the testing methodology. The faults are only emulated on the (1U-1V) winding. The circuit connections and test procedures are explained in the methodology section. Switching impulse voltage is injected as the test signal at the ‘1U’ terminal of the transformer winding and the voltage transferred to the other end of the winding is observed as the response. For the diagnosis of inter-turn shorts, tests are conducted at low voltages. For analyzing the usefulness of IFRA in diagnosing the presence of potential sources of PD, the inter-turn shorts are removed and the PD model is included. The tests for PD diagnosis are started with low voltages and then the voltage is gradually increased until the inception of discharge across the emulated PD source. The responses of the transformer before and after the inception of the PD are observed and analyzed in order to ascertain the usefulness of IFRA in diagnosing the potential sources of PD across the transformer insulation.
The input and response waveforms for all these cases are observed while using a 2.5 G. Sa/second, 200 MHz Digital Storage Oscilloscope (DSO). The conventional FRA approaches were concentrated on the frequency response up to 10 MHz only [4,6,12,13,14]. Hence, the present work focuses on the frequency components up to 10 MHz only. The input and response waveforms are observed after fixing the DSO settings appropriately (time scale of 500 μs, 25 M·sa, 125 k points record length), so that the Fast Fourier Transform data (FFT) could be available directly from the DSO up to 12.5 MHz. The End to End Voltage Transfer Function (EEV TF) approach is used in the experimentation, which is convenient for both the delta and star connected windings of any practical transformer. Three Statistical parameters ‘Comparative Standard Deviation (CSD), Min-Max ratio (MM), and Absolute Difference (DABS)’ are used for further analysis and interpretation of the frequency response data. The analysis of the results confirms that the IFRA with the switching impulse response approach at moderately-high voltages can be useful in the preliminary diagnosis of the potential sources of PDs.
The work becomes significant, as it offers insight into the technical aspects of extending the use of IFRA from inter-turn short diagnosis up to the preliminary diagnosis of the sources of PDs. A step by step procedure that can be followed for extending the IFRA based diagnostic process up to the PD diagnosis is also proposed in the discussion section.

2. Methodology

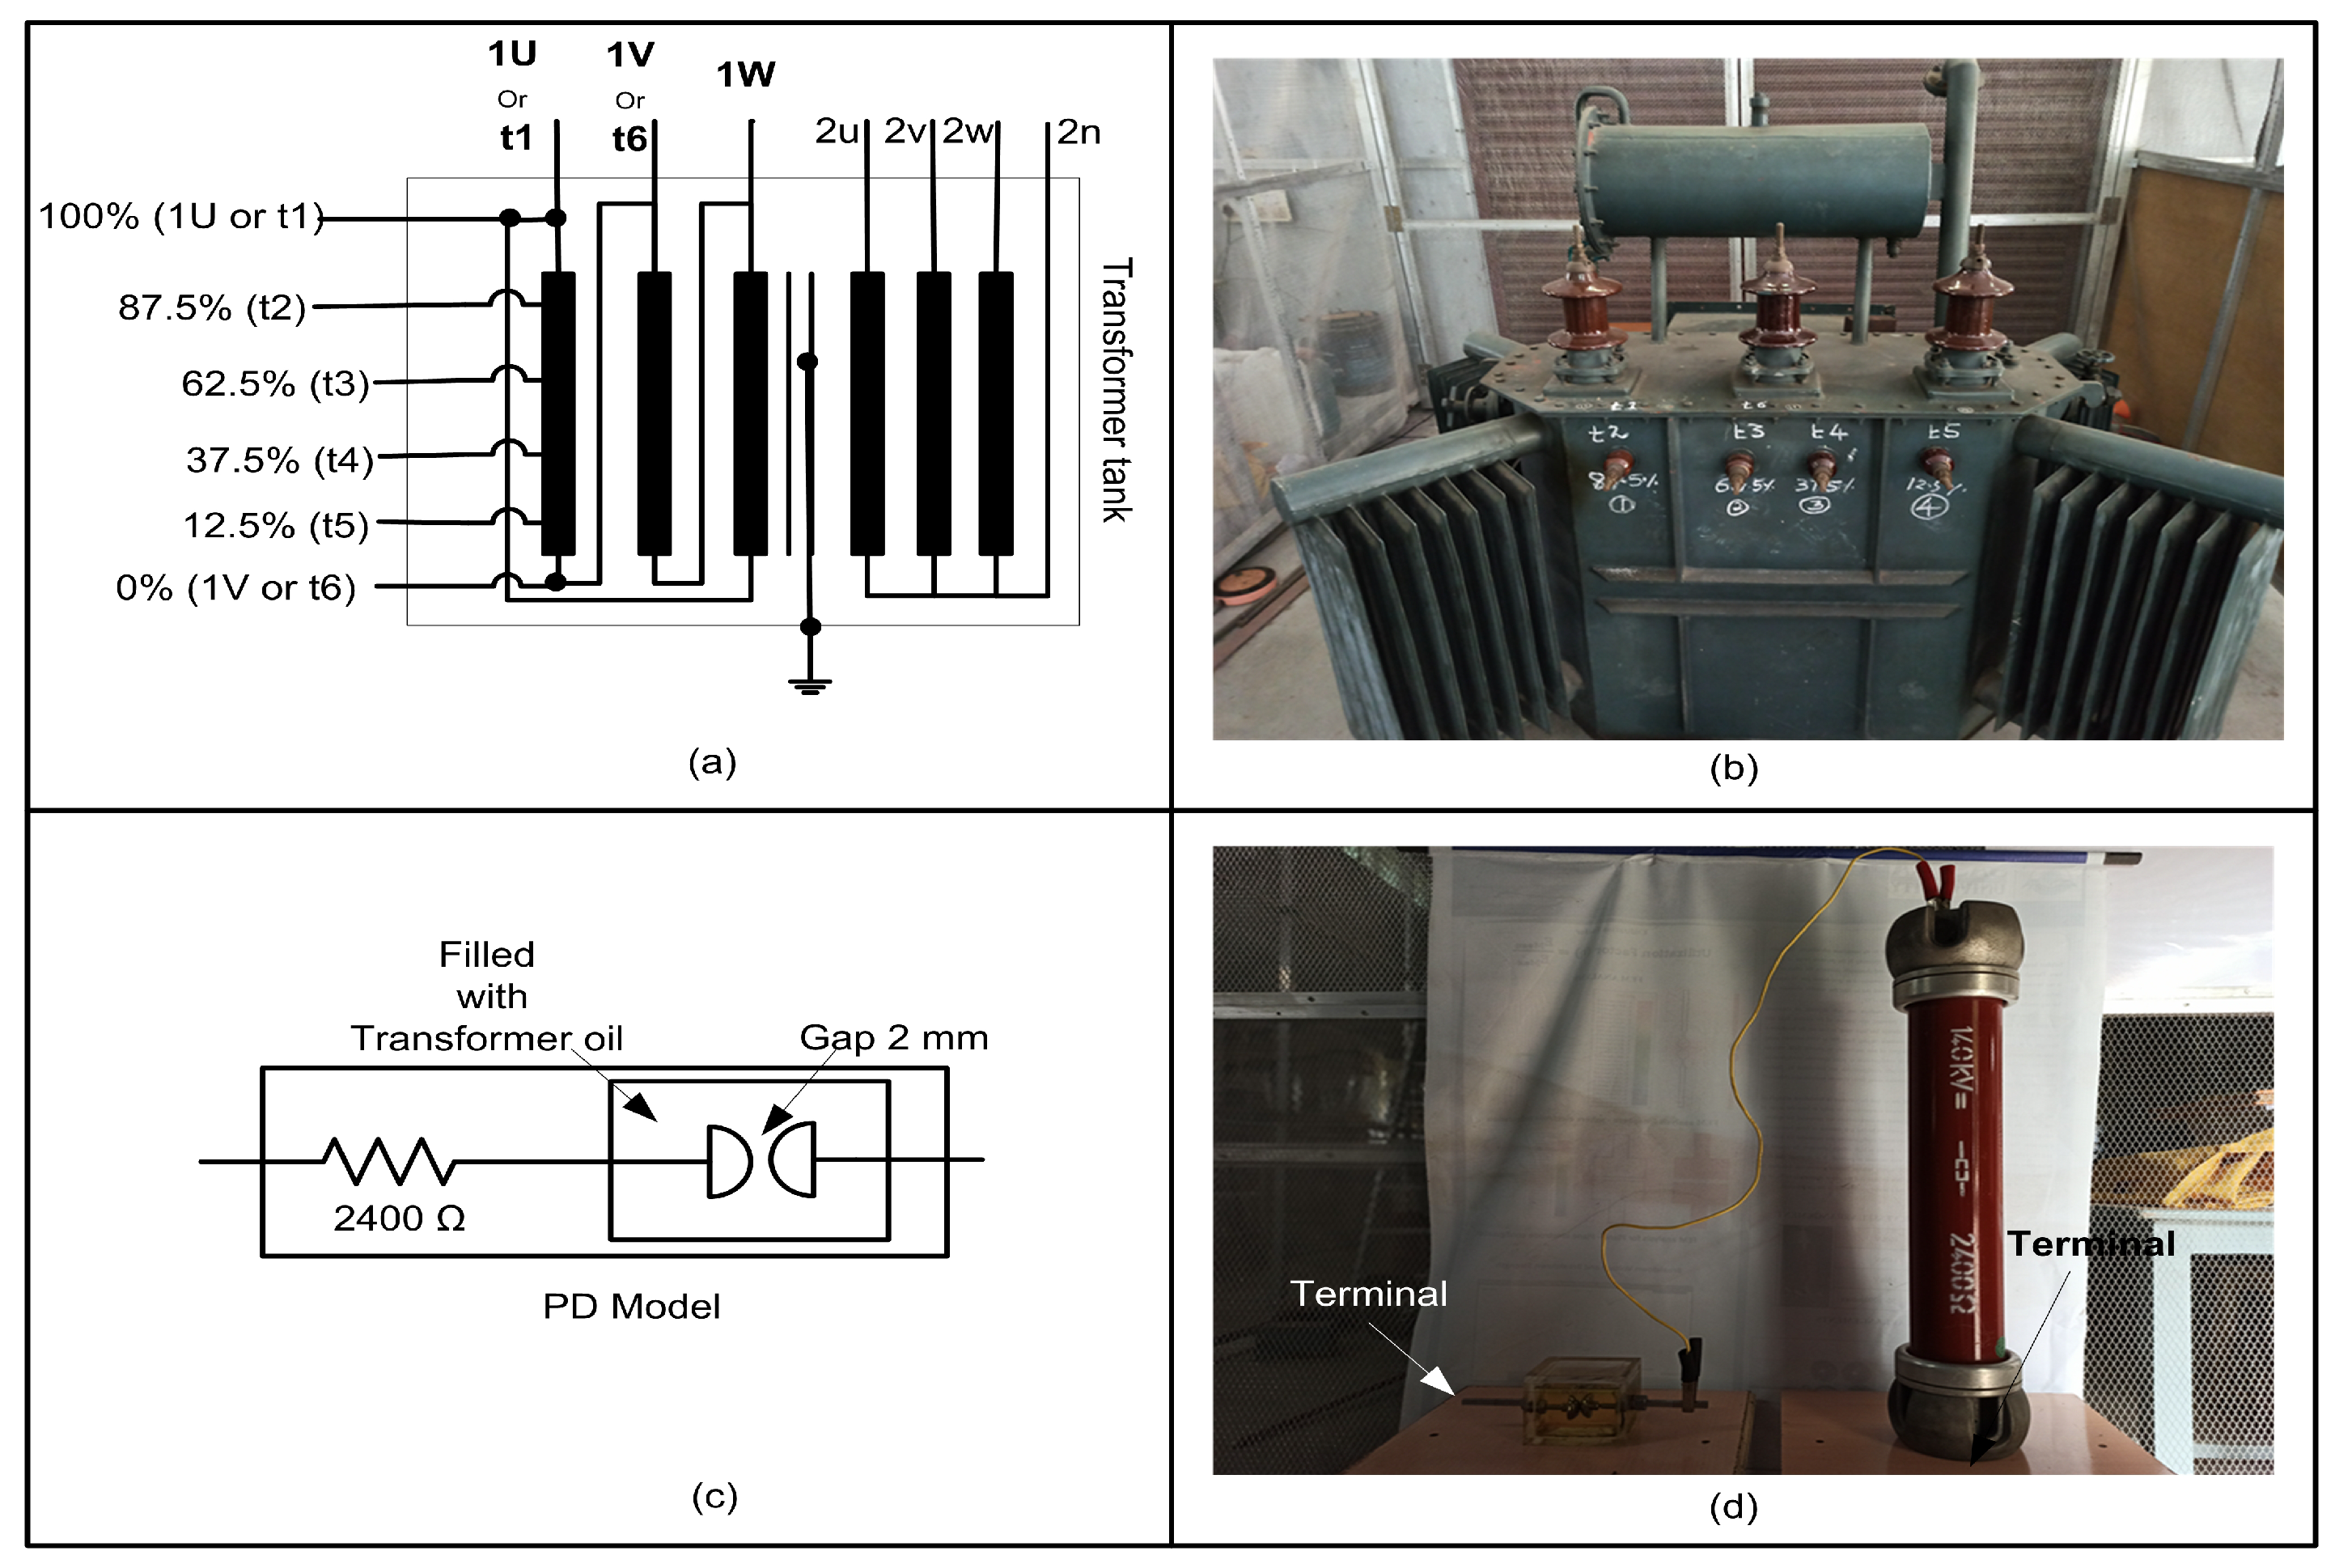
2.1. Details of the Test Specimen

A 315 kVA, 11 kV/ 433 V, Dyn11, ONAN, three-phase distribution transformer, available at the HV laboratory of SASTRA, was used in this work [25]. The length, height and width of the transformer tank are 70 cm, 150 cm and 45 cm, respectively. The oil volume is 500 L, weight of the laminated core is 470 kg, and winding with insulation is 220 kg. The 11 kV windings are made up of eight discs that are in series-connected. The end connections between adjacent discs on one of its high voltage windings (1U-1V) were utilized for bringing out four special tappings. Figure 1a,b shows the winding terminals and the special tappings which were artificially created at 87.5%, 62.5%, 37.5%, and 12.5% locations (referred from ‘1V’ terminal to ‘1U’ terminal as tappings as t2, t3, t4, and t5, respectively). Terminals ‘1U’ and ‘1V’ at 100% and 0% location are referred to as t1 and t6, respectively. The special tappings in the winding were carefully brought out through the sidewall of the tank with suitable low capacitive bushings. This arrangement enables external access to the tappings in the winding, during any research works. The technical details of the transformer are available in the literature [25]. The insulation between the turns/discs within the winding is referred to as minor insulation and the insulation between the windings and earthed tank is referred to as major insulation.

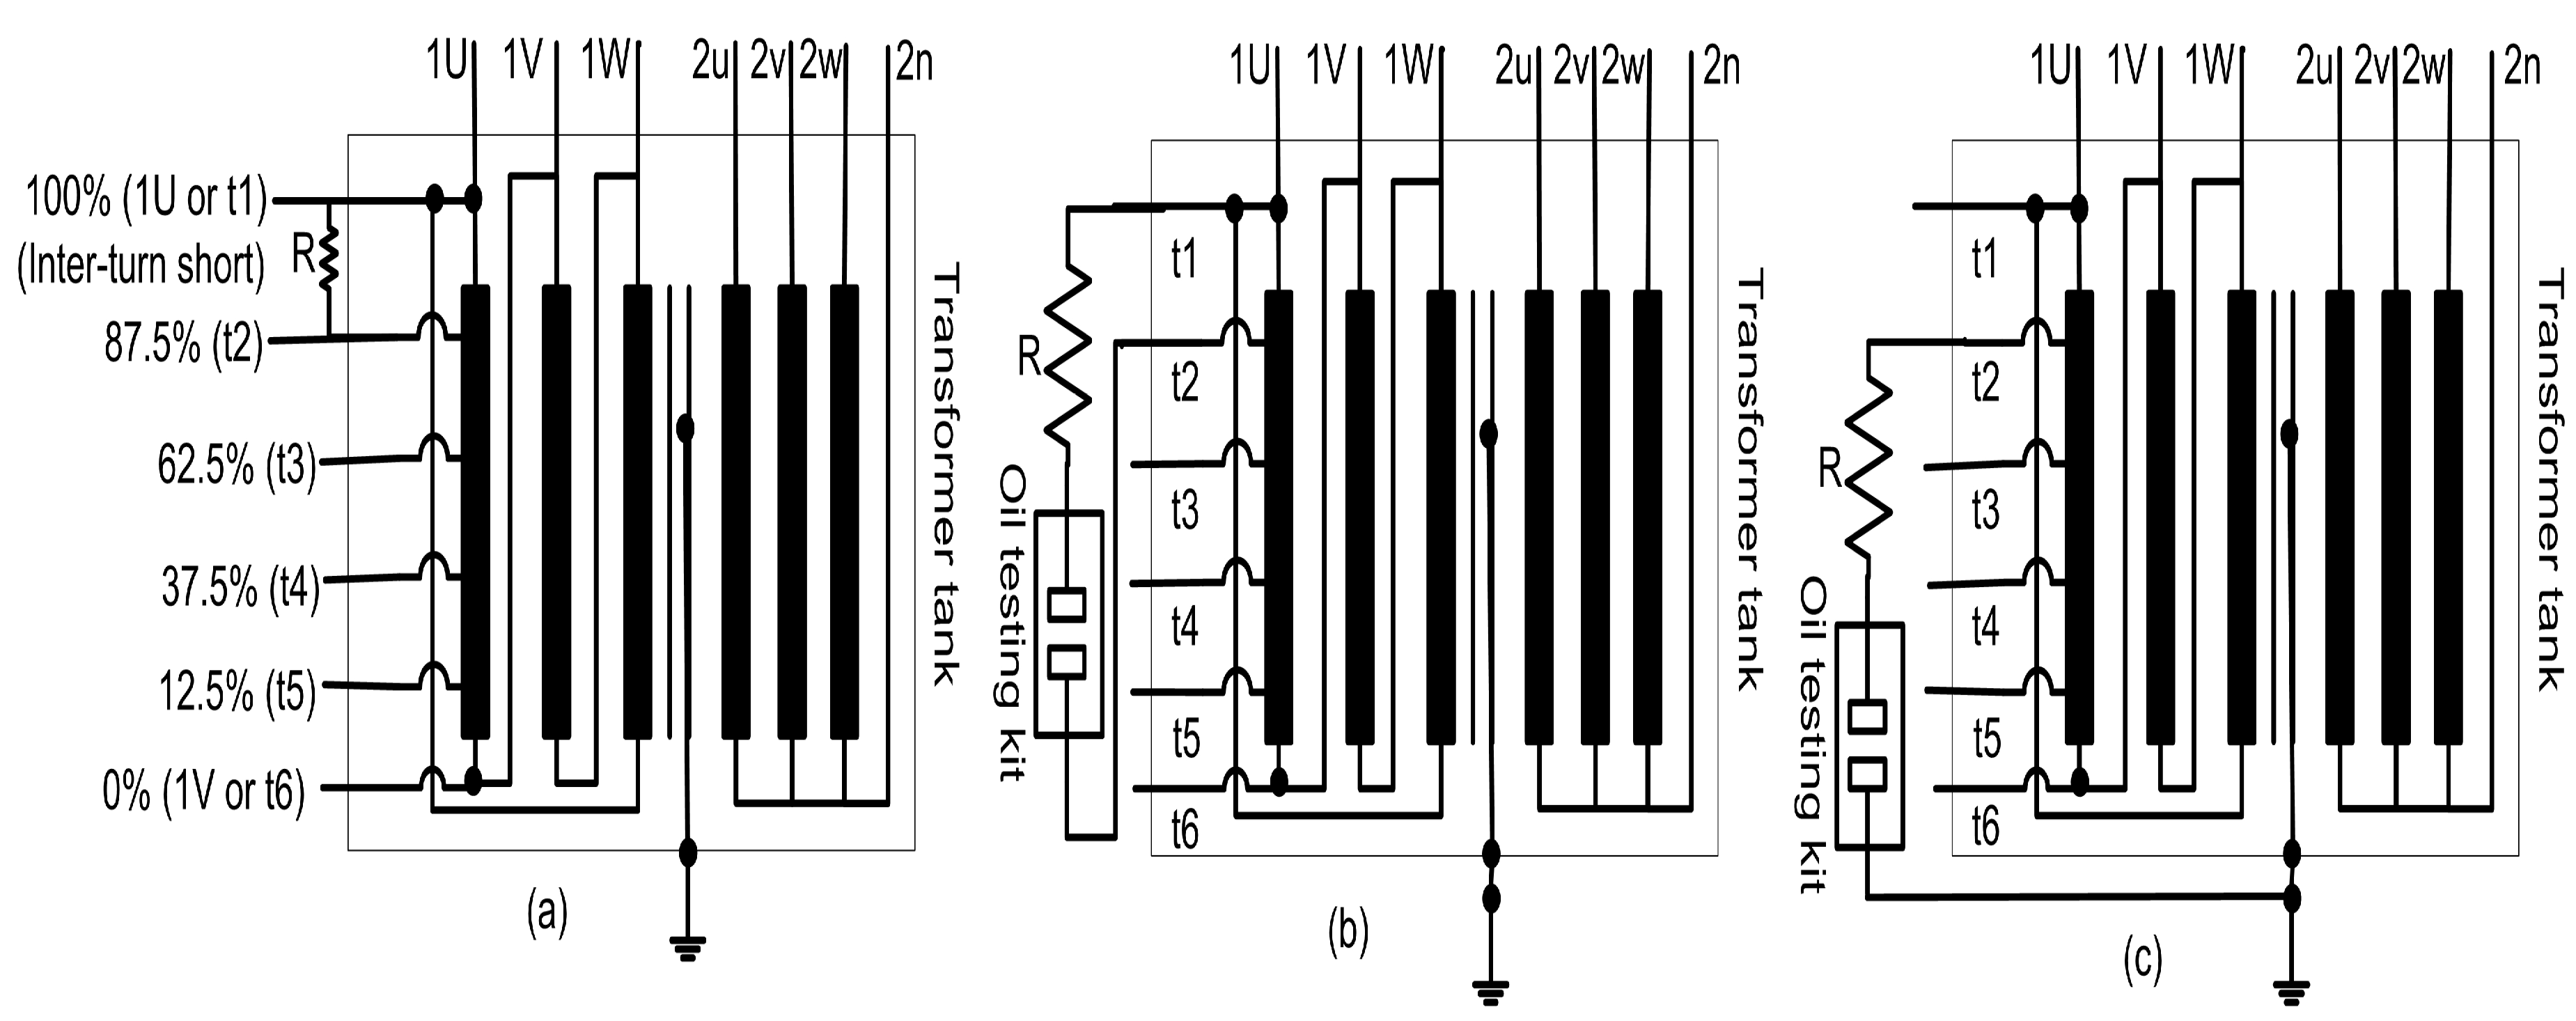
2.2. Details of Inter-Turn Shorts and PD Models

Table 1 shows the details of various cases investigated and the notations that were used for referring the same. Two cases of Inter-turn shorts within the (1U-1V) winding were experimented by connecting a 2400 Ω resistor between the tappings; first, between the tappings t1 and t2 and, next, between the tappings t2 and t3. They are referred to as Sh-1 and Sh-2, respectively.
Partial Discharges (PDs) are possible in both the solid and oil insulation portions of the insulation. Modelling of such PDs was done by several researchers in the form of the air gap and oil gap contained between point/plane/hemispherical/spherical electrodes [26,27,28]. In the present work, a potential source of PD was artificially emulated while using a series combination of oil gap of 2 mm across hemispherical electrodes and a 2400 Ω resistor (hereafter referred as PD model). The oil gap was fixed at 2 mm, so that the discharge across the same can be incepted with switching impulses of moderate magnitude (around 30 kV). The 2400 Ω resistor is purposefully included in the test circuitry in order to limit the impulse current and avoid any permanent damage to the transformer windings. Thus the PD model represents a practical and developing stage PD in the major insulation.
Four PD cases were emulated during the work in order to check the usefulness of the switching impulse voltage based IFRA in diagnosing the PD. Their locations were also varied to check whether the IFRA approach could discriminate the PD location.
The presence of the potential source of PD was emulated, first, by inserting the PD model between the tappings within the winding and, then, between the tappings and the grounded tank. In total, four PD cases were investigated. Two PD cases were emulated across the minor insulation of the transformer; first, by connecting the PD model across the tappings t1 and t2 and, next, by connecting the PD model across the tappings t2 and t3. They are referred as PD-1-minor and PD-2-minor, respectively. Similarly, two PD cases were emulated across the major insulation of the transformer; first, by connecting the PD model across the tappings t2 and the grounded tank and next, by connecting the PD model across the tappings t3 and the grounded tank. They are referred to as PD-3-major and PD-4-major, respectively.
Figure 1a shows the circuit that represents the terminals and special tappings of the transformer. Figure 1b shows the photograph of the same. Figure 1c shows the circuit representation of the PD model. Figure 1d shows its photographic view. The oil-gap of the PD model was transparent. Hence, the occurrence of any PD during experimentation could be cross verified through visual observation of a spark across the electrodes.

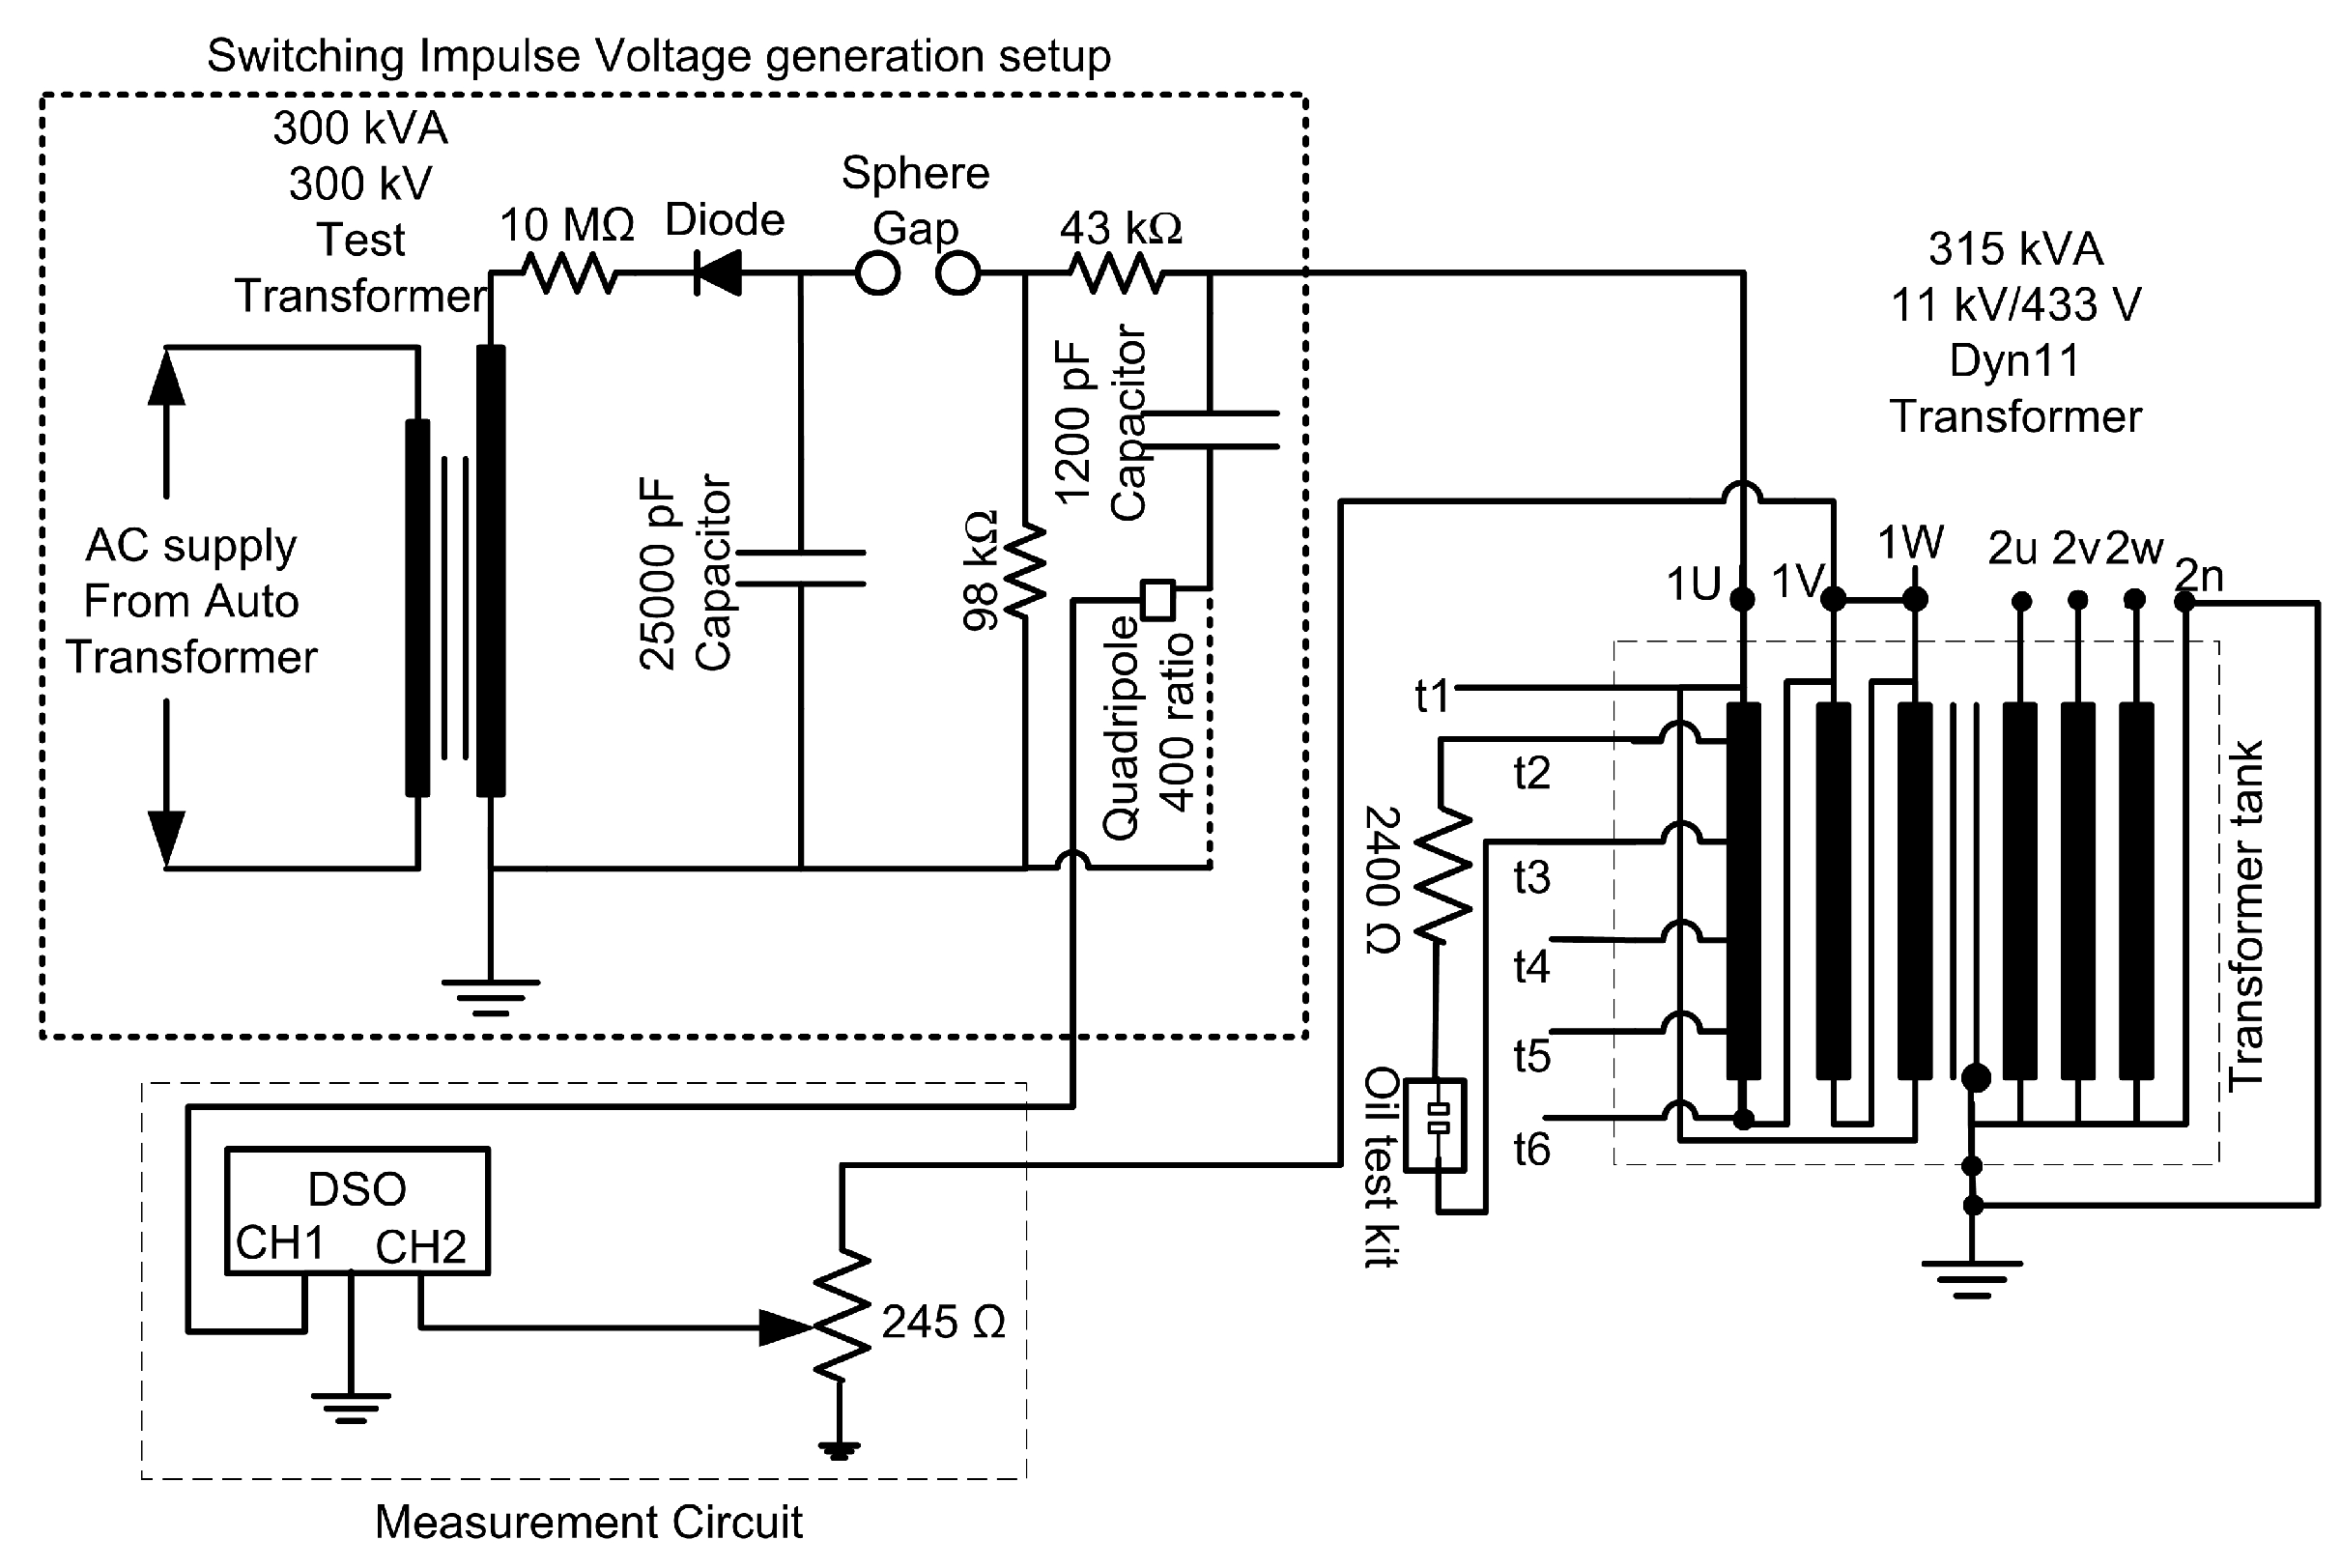
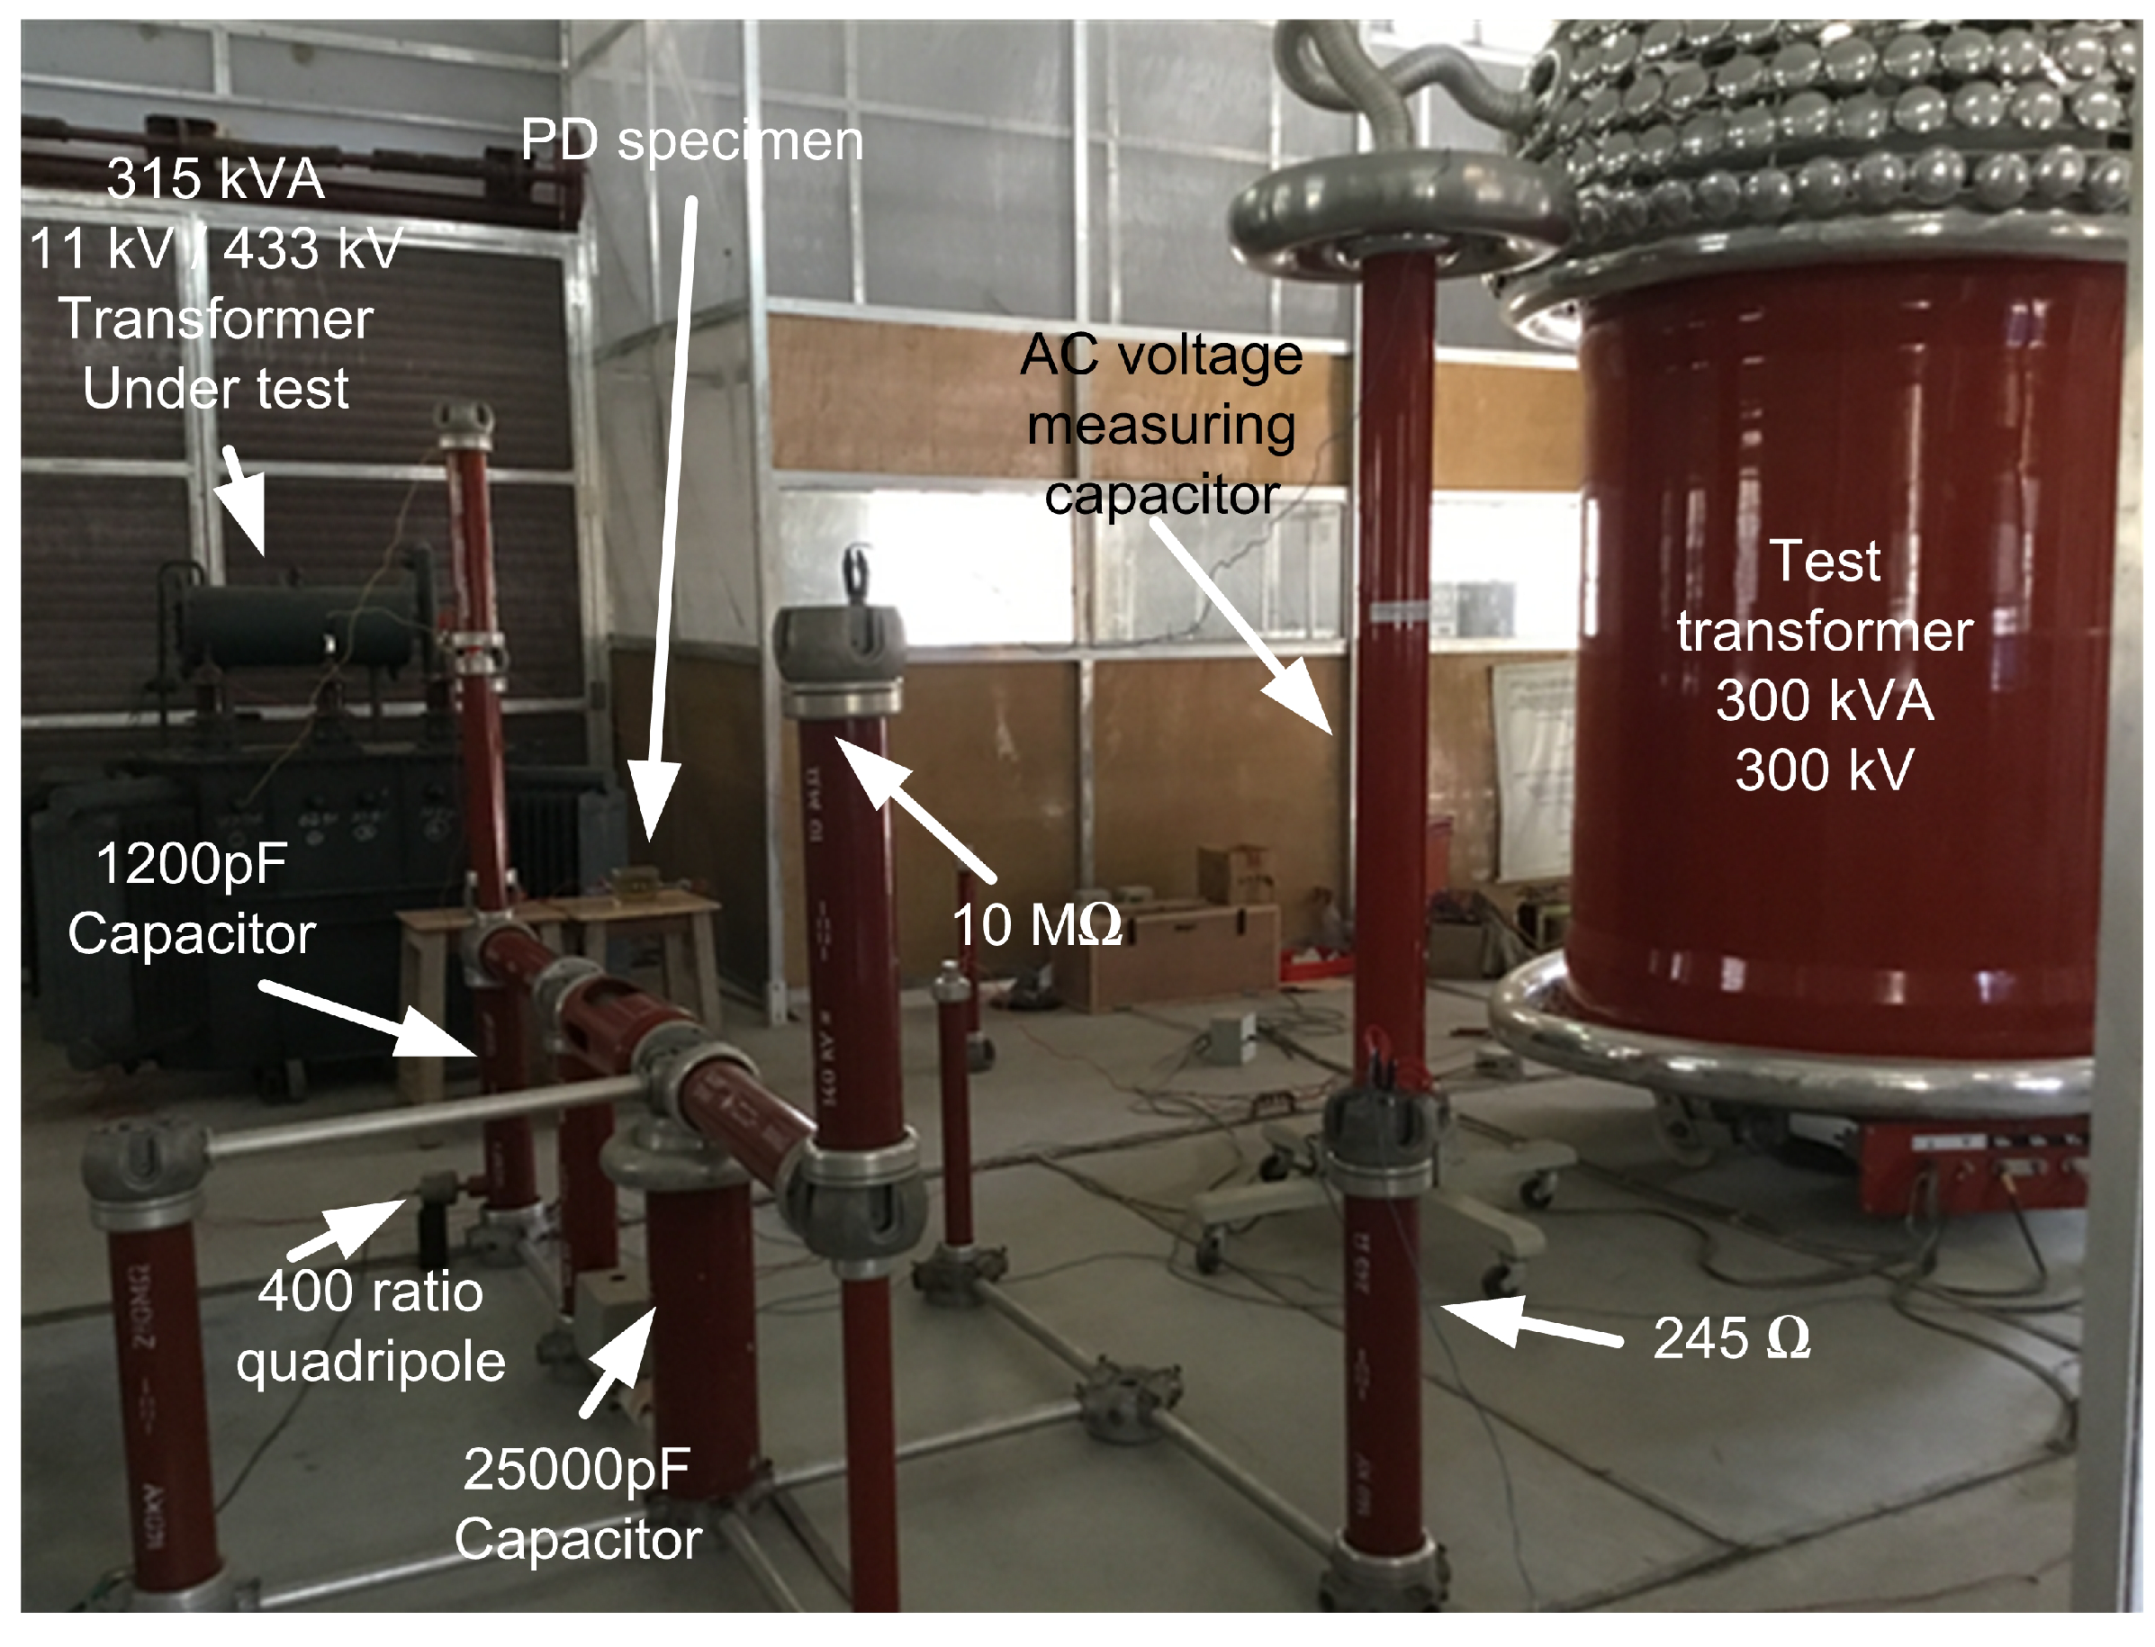
2.3. Experimental Setup

A switching impulse voltage generator available at the High Voltage laboratory of SASTRA was used to inject the switching impulse voltage into (1U) terminal of the delta connected HV winding. The other terminals of the delta windings (1V & 1W) were shorted and grounded through a low ohmic resistor (245 Ω in this case). The core, tank, and neutral terminal (2n) of the LV winding were grounded. The terminals (2u, 2v, and 2w) of the LV windings were kept floating [29,30]. Inter-turn shorts were emulated by connecting the 2400 Ω resistor between the tappings, and the four PD cases were emulated by connecting the PD model (the series combination of the oil gap and a 2400 Ω resistor (as referred in Table 1).
Input (V1) and Response (V2) voltage waveforms were measured while using a DSO. The FFT function of the DSO was used to obtain the magnitudes of the various frequency components of (V1) and (V2).
Figure 2 shows how the connections can be made at the special tappings of the transformers for the emulation of the inter-turn shorts and the PD sources across the minor and major insulation. All of the inter-turn shorts and PD cases listed in Table 1 were emulated in a similar manner.
Figure 3 shows the experimental setup of one of the cases (PD sources across the minor insulation of the tested winding). Figure 4 shows the experimental setup photograph.

2.4. Experimental Procedure

Throughout the investigation (i.e., during the Normal case, inter-turn short cases and the four PD cases), the impulse generator available in the laboratory was used for injecting the switching impulse voltage as a test signal (input) at the ‘1U’ terminal of the high voltage winding (1U-1V). The voltage that was received at the other end (1V) of the winding was observed as the response.
The switching impulse voltage generator is of standard design. It can develop a 250 μs/2500 μs switching impulse with a peak value up to 140 kV, with the tolerances for front, tail & peak values within the permissible tolerances of the standards [29,30] C1 & C2 values are of 25,000 pF & 1200 pF, respectively. The wave shaping resistors R1 & R2 are 43 kΩ & 98 kΩ, respectively.
As the impulse generator is of low capacity (rating: 0.245 kJ, 140 kV, single-stage with a 1200 pF terminal capacitor), the loading effects of the transformer on impulse generator is unavoidable. The wave shape of the input switching impulse voltage and magnitudes of its different frequency components get altered [29,30]. FRA is on analyzing the frequency response over a wide frequency spectrum and, not on testing the dielectric integrity with standard impulses, such alterations in the shape of the impulse is acceptable. FRA requires the presence of a broad spectrum of frequency components within the test signal. In our case, this distorted switching impulse contained more high-frequency components than the standard switching impulse and enabled the frequency response analysis up to 10 MHz.
It can be noted that the effect of the fault can be felt only when it alters the impedance that is offered by the tested winding. Inter-turn shorts can influence on the impedance of the winding at all voltage levels and, therefore, detection of the same is possible, even with low voltage switching impulse. Therefore, in the present work, the experimental work for diagnosis of inter-turn shorts (Sh-1 and Sh-2) were conducted while using the switching impulses of 5 kV peak magnitudes.
However, the influence of a potential PD source present in the insulation is found to be voltage-dependent. At low voltages, the frequency response is not getting altered just by the presence of a PD source. The presence of a potential source of PD can influence the effective impedance of the winding only when it offers a low ohmic discharge path across the by-passed portion of the insulation. As long as the switching impulse voltage is below the inception level of PD, the potential sources of PDs offer high ohmic path and, hence, their loading effects are negligible.
In our case, the PD was modelled with 2 mm oil gap in series with a 2400 Ω resistance, so that its ohmic opposition is very high during its discharge-free condition. For conducting the experimental investigations, the PD model was connected to the transformer by using the tappings t1, t2, and t3. Thus, the presence of the potential sources of the four PD cases (PD-1-minor, PD-2-Minor, PD-3-major, and PD-4-major) was artificially achieved, one-by-one, as referred in Table 1.
For understanding the loading effects of the PD model at different voltage levels, preliminary tests were conducted for all these four cases by varying the peak voltage of the input (switching impulse) from 5 kV up 40 kV, in steps of 5 kV. The input and response voltage waveforms were captured at all of these voltage levels along with a check for any visual discharge across the oil gap. Rough comparisons were made between these different cases by observing their corresponding input and output waveforms and their frequency components. Discharges across the PD model were found to incept at four different voltages for the four different cases emulated. But, in all the four cases, the inception happened only above 30 kV, and there were differences in waveforms and their frequency components.
All of these preliminary investigations have led to the following decisions on the magnitude of the test voltage to be followed during various investigations: (1) as the influence of inter-turn shorts is detectable at all voltage levels, the test voltage for the diagnosis of inter-turn short was fixed at 5 kV (peak). (2) Because the presence of the modelled PD source is undetectable at 5 kV, the frequency response of the transformer under its inter-turn short free condition at this voltage level, can be directly used for the development of the signature FRA of the transformer in its discharge free condition. This can be referred as the response of the transformer under its normal condition (or) Normal case FRA. (3) Because the PD incepts above 30 kV for all the four emulated PD cases, the test voltage to be used for diagnosing any potential source of PD can be fixed at 37.5 kV (which is 125% of the 30 kV).
Switching impulse voltage magnitudes were fixed, as per these decisions and followed throughout the experimental investigations.
The details of the test circuit connections (cables, sources, measuring circuits, and DSO settings) were documented, and the same procedures were followed during the experimentation of the normal case and various emulated faulty cases. For ensuring the reliability of the test results, each case was tested five times and the average value of the data sets was considered to be representative for further analysis.
The input impulse voltage was measured through the low voltage arm of the terminating capacitor (1200 pF) of the impulse generator. After the voltage drop across the winding, only a low voltage could reach as the response at the terminal (1 V). As this terminal was grounded through the low ohmic (245 Ω) resistor, the voltage across the same represented the response received at (1 V).
The input voltage and the response voltage were observed in Channel-1 and Channel-2 of the Digital Storage Oscilloscope (DSO), respectively. Channel-1 was used to observe the scaled-down version of the actual input voltage through the low voltage arm of the 1200 pF capacitor of the impulse generator. The response voltage (V2) was observed through the low voltage arm of the resistive divider (245 Ω).
For comparison of different cases, first, these time-domain waveforms were directly analyzed. For further analysis in the frequency-domain (that was in terms of the frequency components of the input and response waveforms), the inbuilt FFT function of the DSO was used [31]. EEV TF plots of different cases were obtained from the FFT data after incorporating suitable correction factors.

2.5. Procedure for Developing the EEV TF Plots

The voltages observed through the DSO channels 1 & 2 represent the scaled version of the input voltage (V1) and the voltage transferred to the terminal (V2).
The EEV TF magnitudes were calculated in two steps: in the first step, the FFT feature of the DSO was used to obtain the dB magnitudes of various frequency components of the input and response voltage from the scaled-down value of (V1) and actual value of (V2). In the second step, the corresponding actual magnitudes of EEV TF at various frequency components were calculated by adding a correction factor (CF). The correction factor was calculated in terms of the scaling factor (400:1) of the capacitive divider. Thus, the actual EEV TF magnitudes for the different frequency components were calculated, as per Equation (1)
Actual EEV TF Magnitude ( dB ) = 20 log 10 ( V 1 Actual V 2 Actual ) = EEV TF magnitude from DSO + CF = 20 log 10 ( V 1 Observed V 2 Observed ) + 20 log 10 ( 400 ) = 20 log 10 ( V 1 Observed * 400 V 2 Observed )
EEV TF plots were developed by taking these magnitudes (dB) in Y-axis against their corresponding frequencies in X-axis.

2.6. Statistical Investigation Procedure

Statistical parameters were used by researchers in order to reduce difficulties in the interpretation of IFRA results [32,33,34,35]. Features can be extracted from the FRA data of two cases investigated and, thus, comparison can be made between them at various sub-bands of the FRA spectra. The use of more than one statistical parameter was also suggested by researchers to improve reliability [32,34].
Based on the literature, a comparison of FRA results was carried out while using three statistical parameters on sub-band basis. The total frequency spectrum was split up and considered as three sub-bands (i.e., 1 kHz–100 kHz, 100 kHz–1 MHz and 1 MHz–10 MHz).
When the two compared cases are similar, the statistical parameter value is ideal [32]. Any deviation of the estimated statistical parameter from its ideal values that are presented in Table 2 shows that the two cases are distinguishable at the corresponding sub-band frequency responses.

3. Results and Discussion

The results that were obtained through the experimentations were grouped into three categories for further analysis: (1) as input and response voltage waveforms, (2) as EEV TF plots and, thirdly, (3) as statistical parameter values estimated from the EEV TF data (two different cases considered at a time). They are referred as per the notations that are listed in the Table 1.

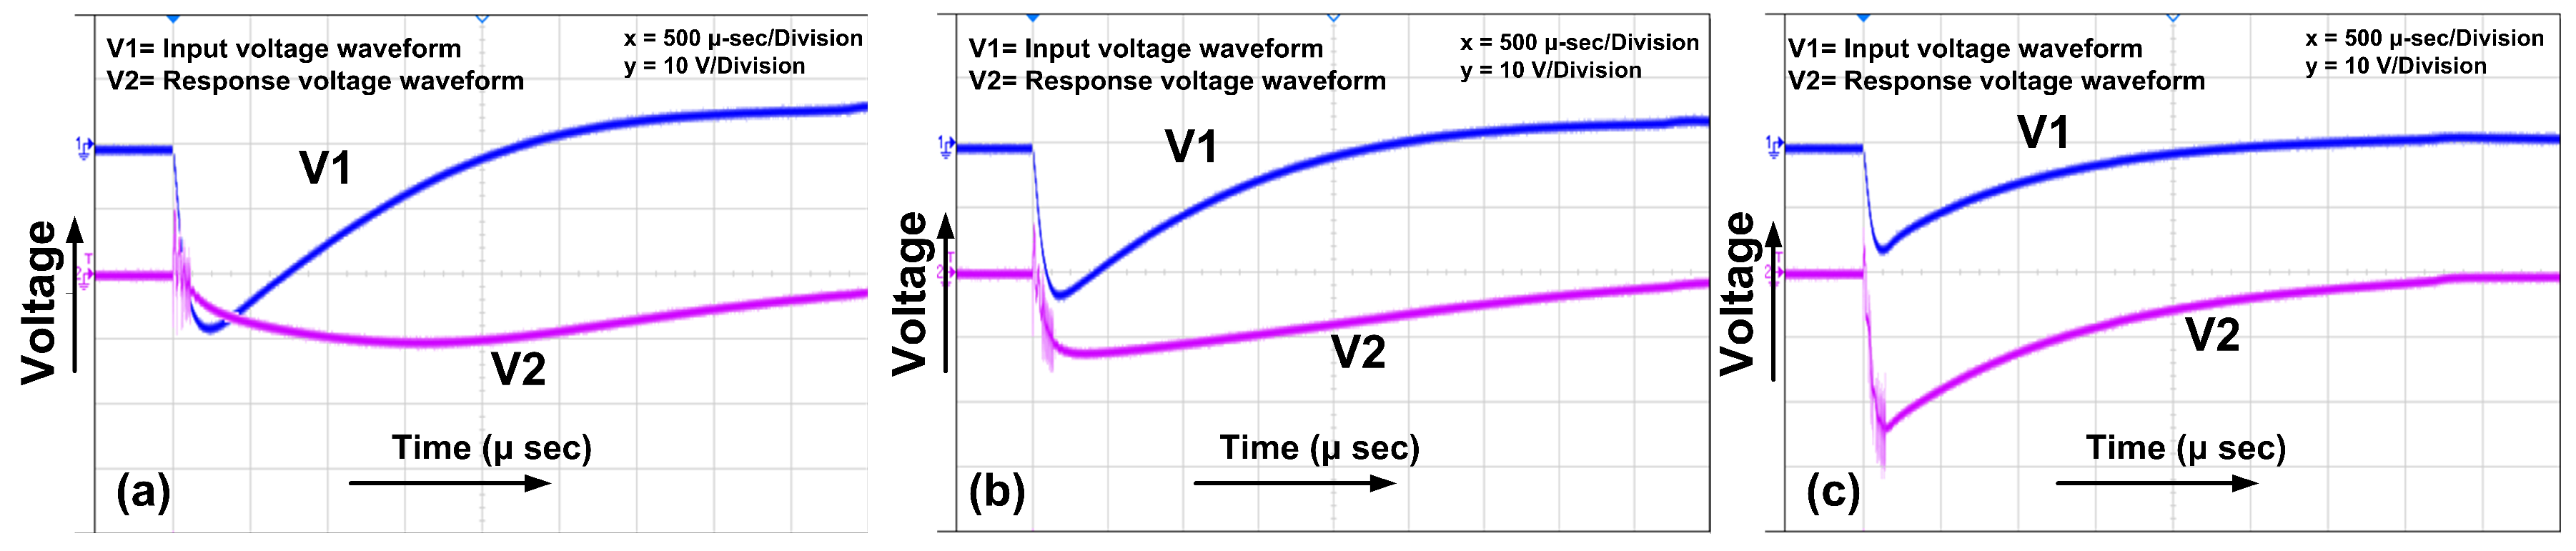
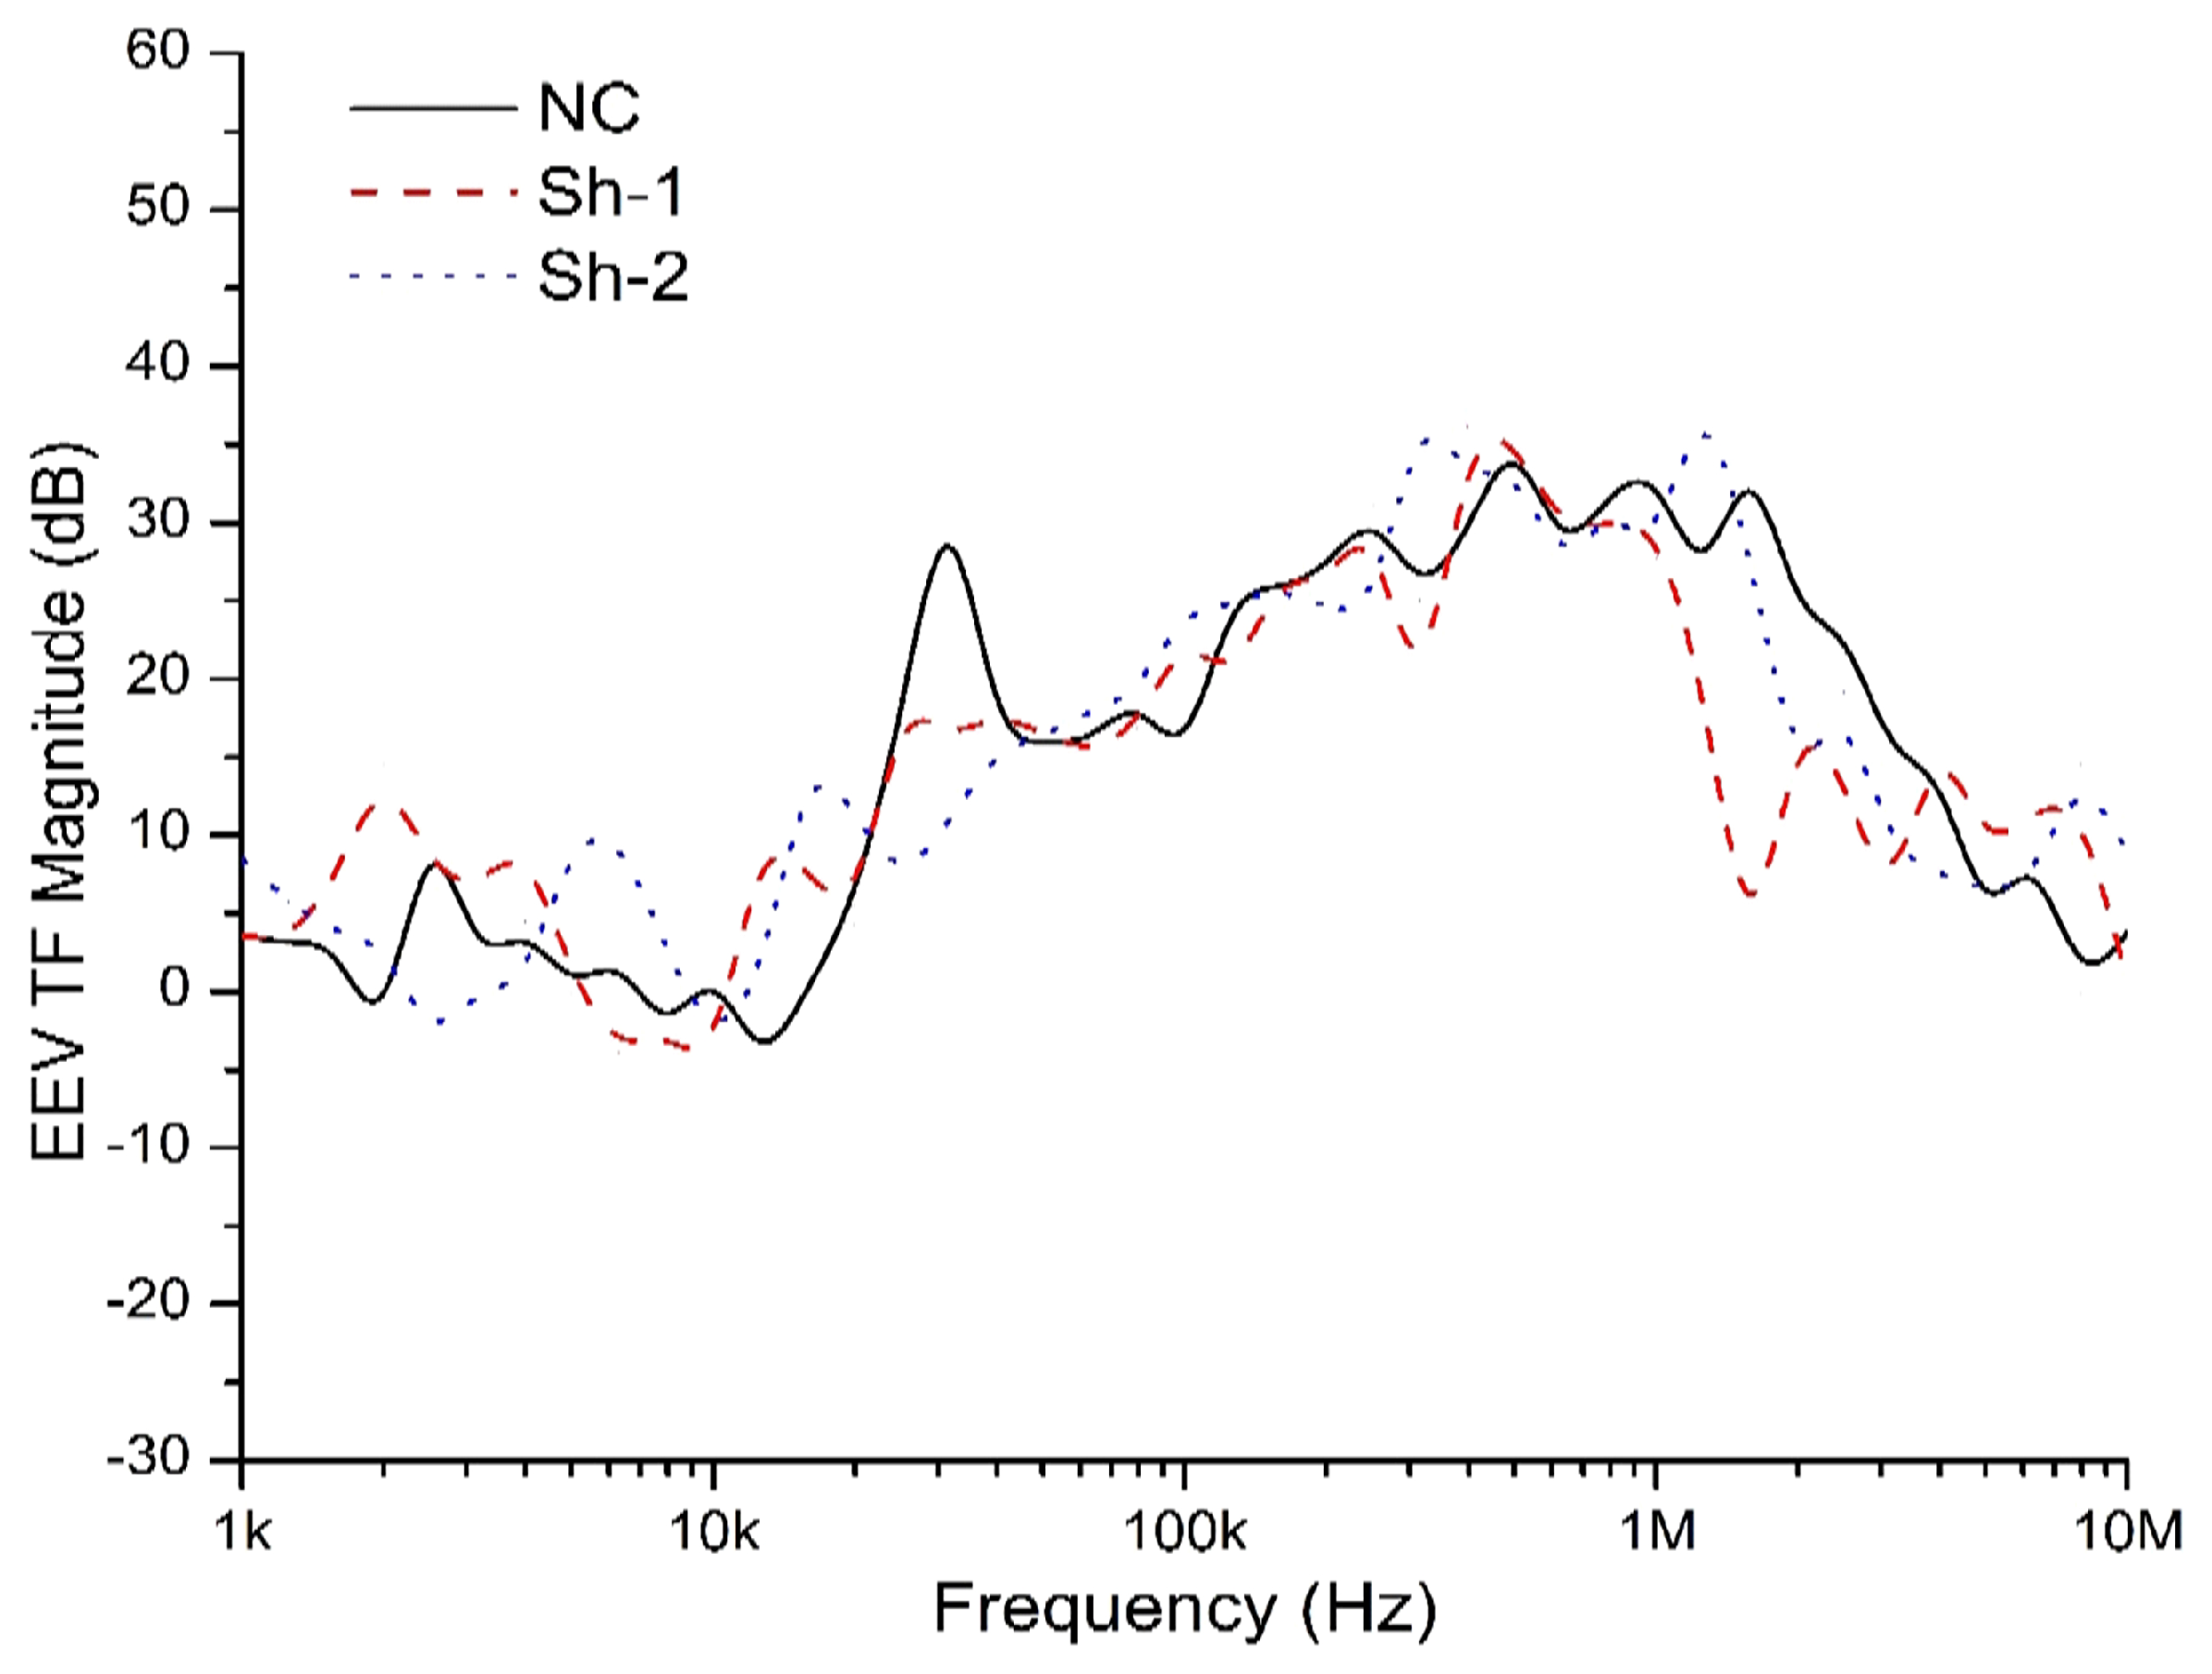
3.1. Diagnosis of the Inter-Turn Shorts

Figure 5 shows the input (V1) and response (V2) voltage waveforms of various cases investigated for diagnosis of inter-turn shorts. The tests were conducted by applying a switching impulse voltage of magnitude 5 kV (peak) as the input. The waveforms were observed before and after emulating the inter-turn shorts. Figure 5a shows the voltage waveforms when the 2400 Ω was not included between the tappings and it represents the signature pattern of the transformer under its healthy condition. Figure 5b shows the waveform when the inter-turn short (Sh-1) was emulated by inserting the 2400 Ω between the tappings t1 and t2. Figure 5c shows the waveform when the inter-turn short (Sh-2) was emulated by inserting the 2400 Ω between the tappings t2 and t3. Because of the inter-turn shorts, there were some changes in the shapes of (V1) and (V2). Simultaneously, sparks was also visible across the electrodes of the PD model and confirmed the occurrence of PD.
EEV TF magnitudes for different frequency components were calculated from the FRA data, as per the Equation (1). By taking these magnitudes (dB) in Y-axis and their corresponding frequency in X-axis, the EEV TF plots for the various cases are listed in Table 1.
Figure 6 shows the EEV TF plots developed for analyzing the usefulness of IFRA approach in the diagnosis of inter-turn shorts. The spikes (dips and ups) and changes in the magnitudes of EEV TF throughout the frequency spectra, which indicates that the FRA conducted at low test voltage level itself is capable of detecting the presence of inter-turn shorts.

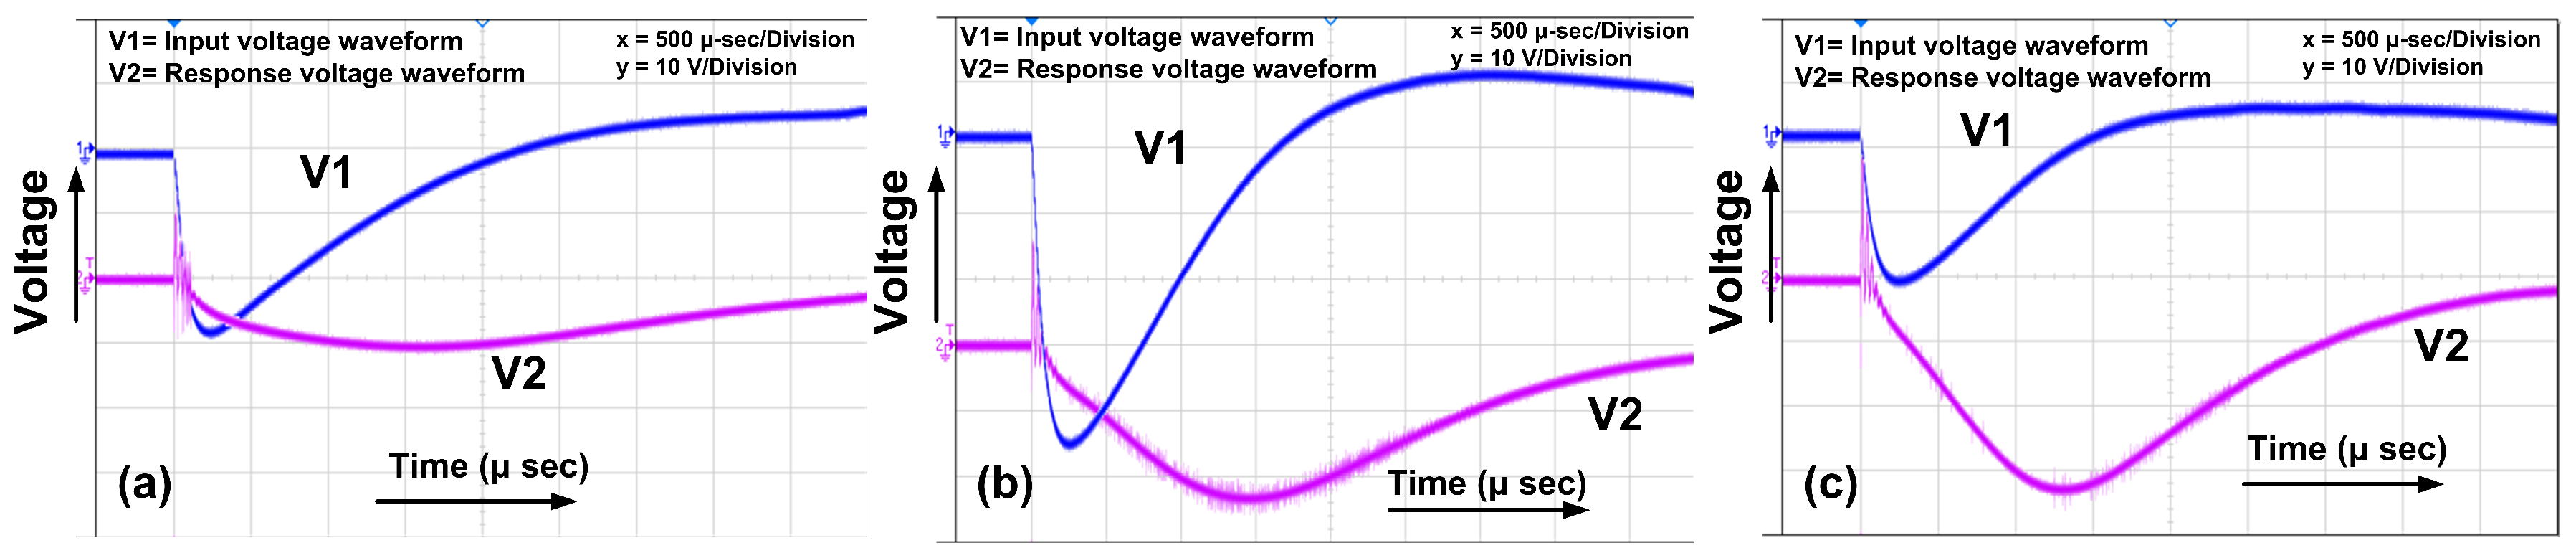
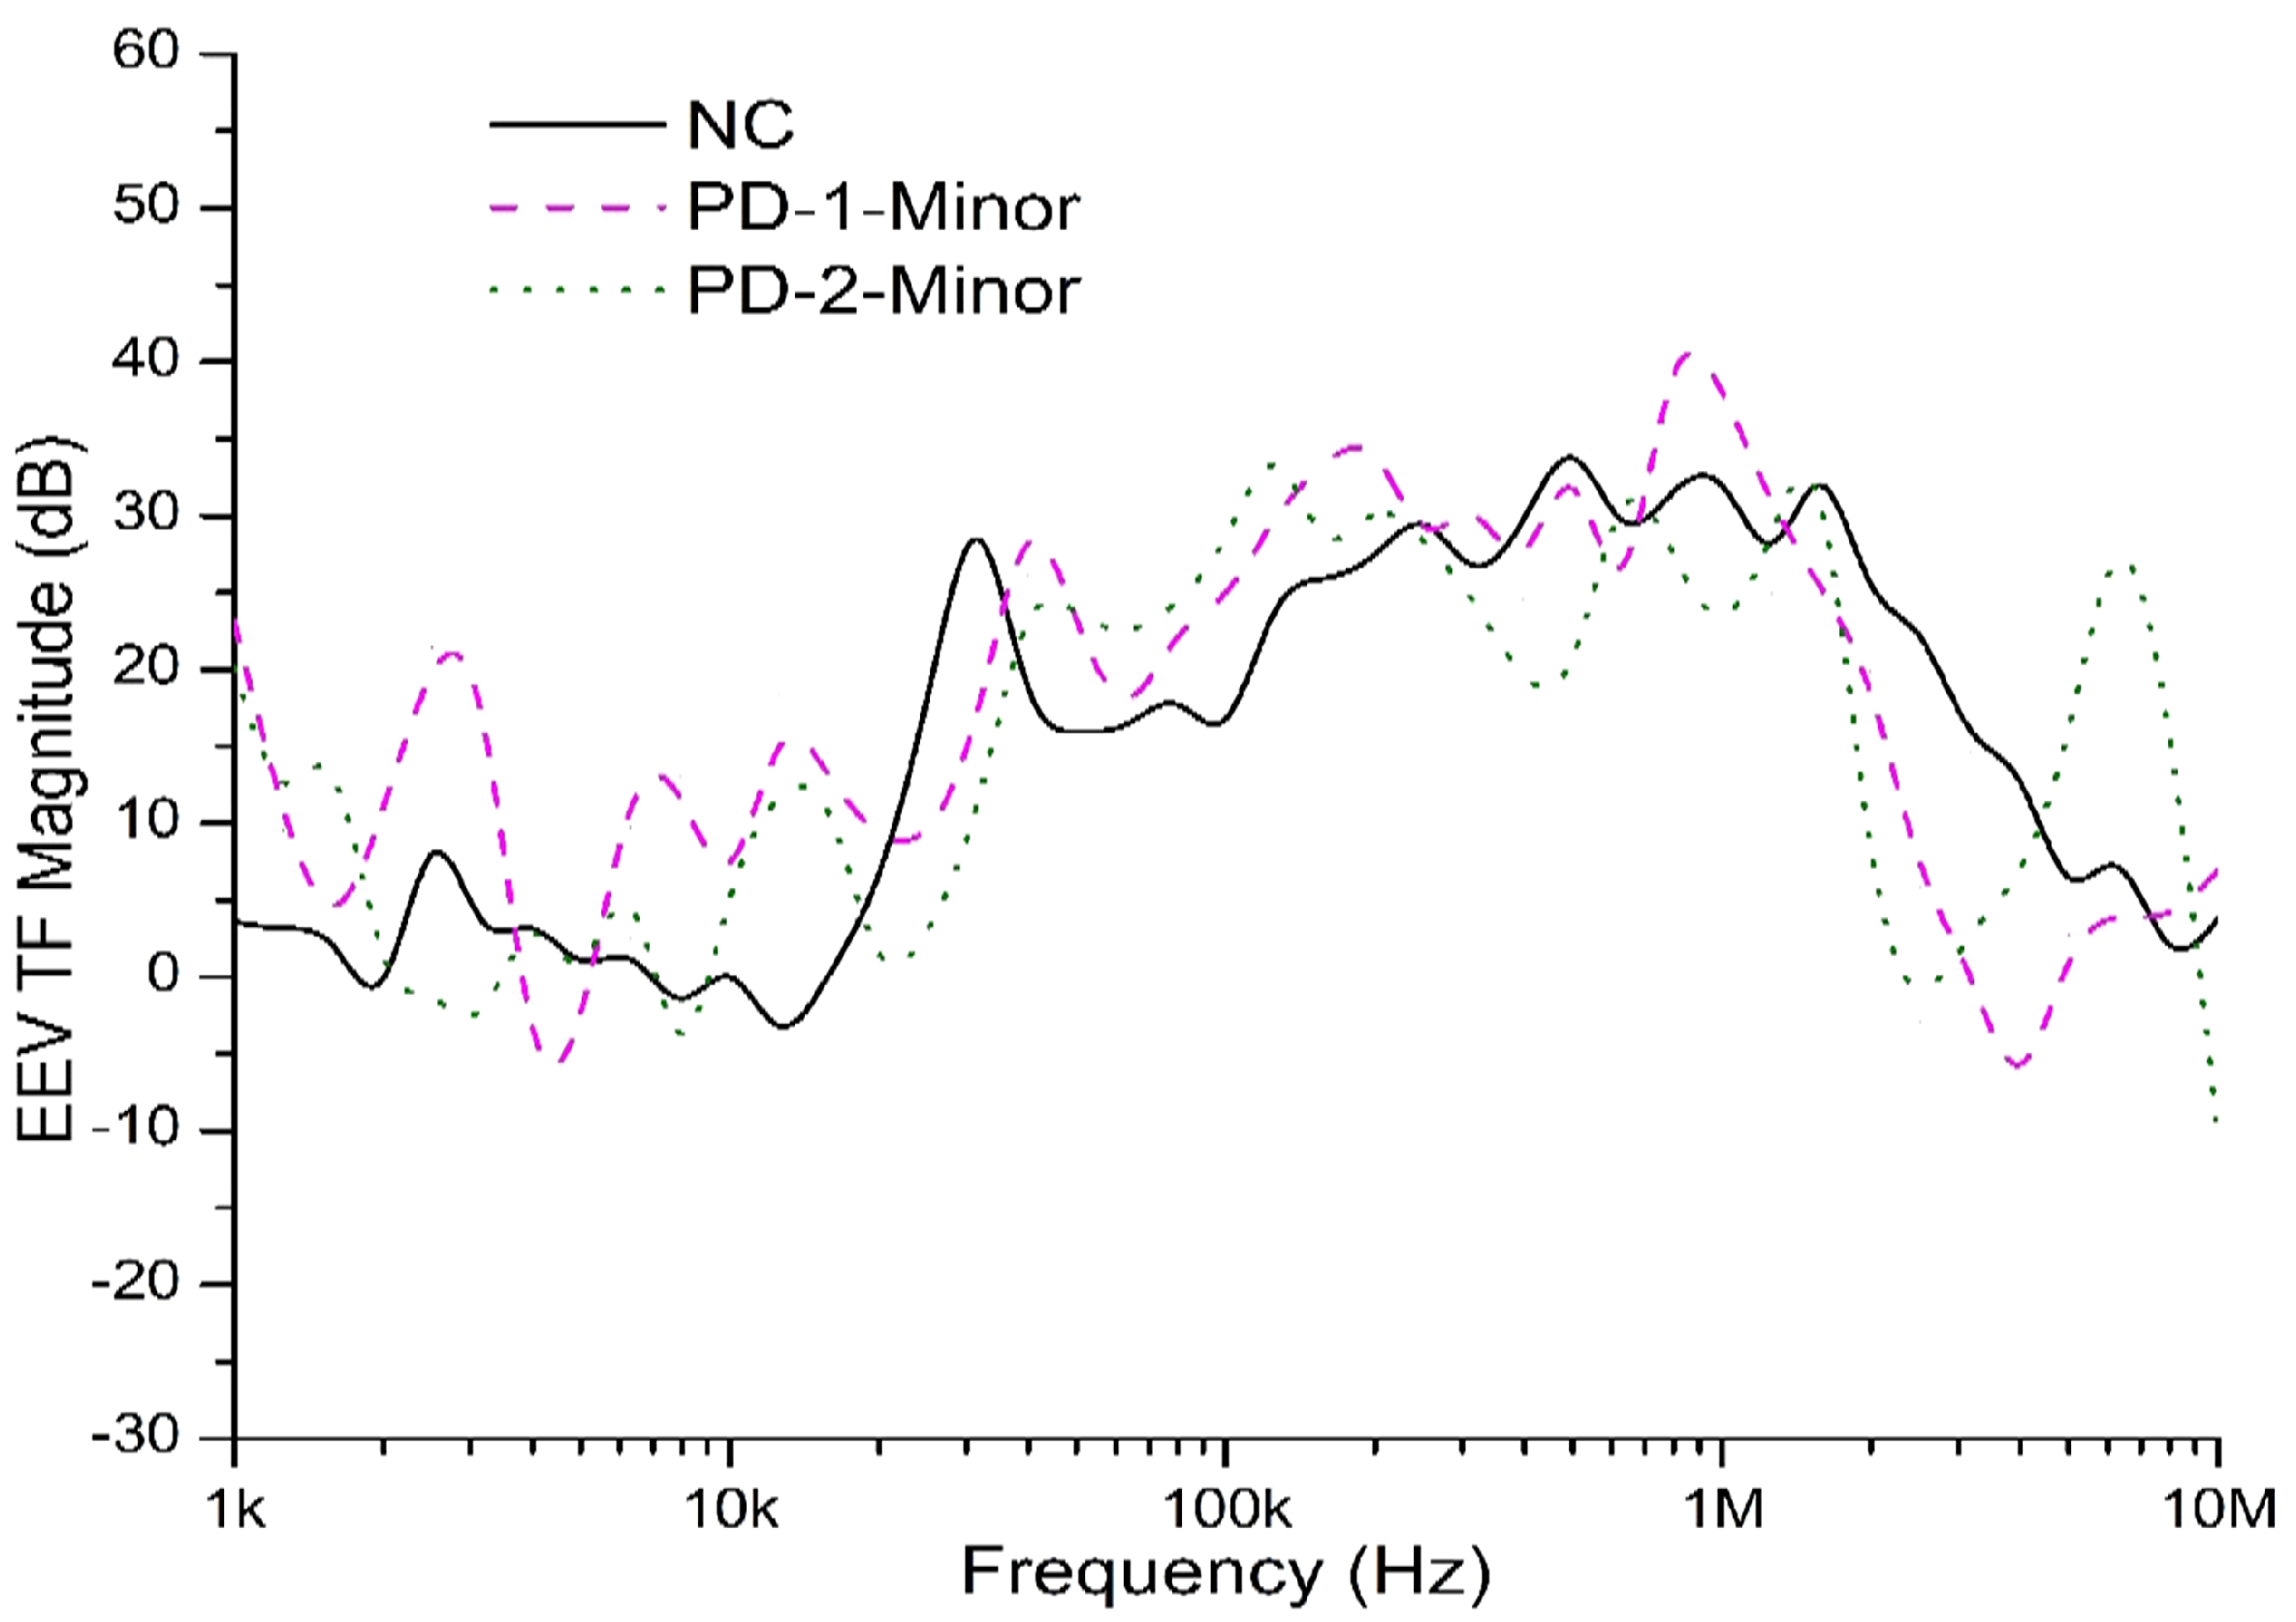
3.2. Diagnosis of the Potential Sources of PD across the Minor Insulation

Figure 7 shows the voltage waveforms of various cases investigated for diagnosis of PD sources across the minor-insulation. It can be recalled that a thorough investigation of the modelled PD cases (listed in Table 1) at different voltage levels was conducted in order to analyze the loading effects of the PD model, under their discharge free conditions and discharge incepted conditions. As the loading effect was found to be negligible up to 30 kV, the same normal case plot Figure 5a, obtained under inter-turn free and discharge-free condition), was retained as the signature plot of the transformer and reproduced, as in Figure 7a. The tests for diagnosis of the PD cases (PD-1-minor and PD-2-minor) were conducted by applying a switching impulse voltage of 37.5 kV and the voltage waveforms are shown in Figure 7b,c, respectively.
The changes in the shape of voltage and the disturbances appearing in the form of spikes/pulses presented in Figure 7b,c indicated that the response of transformer to the switching impulses after the inception of PDs, which is different from its normal response. These changes were also distinguishable from the changes due to the presence of internal shorts Figure 5b,c. With mere waveform observation, it is difficult to discriminate between the two cases of PDs. Hence, it becomes necessary to go for the other comparative approaches, like transfer function plots and statistical parameters.
Figure 8 shows the EEV TF plots developed for analyzing the usefulness of the FRA approach in the diagnosis of PD-1-minor and PD-2-minor. Variations appearing in the form of spikes and the changes in the magnitudes of EEV TF that are spreading throughout the frequency spectra indicate that FRA conducted at the 37.5 kV (test voltage) is capable of detecting the presence of the potential source of PD.

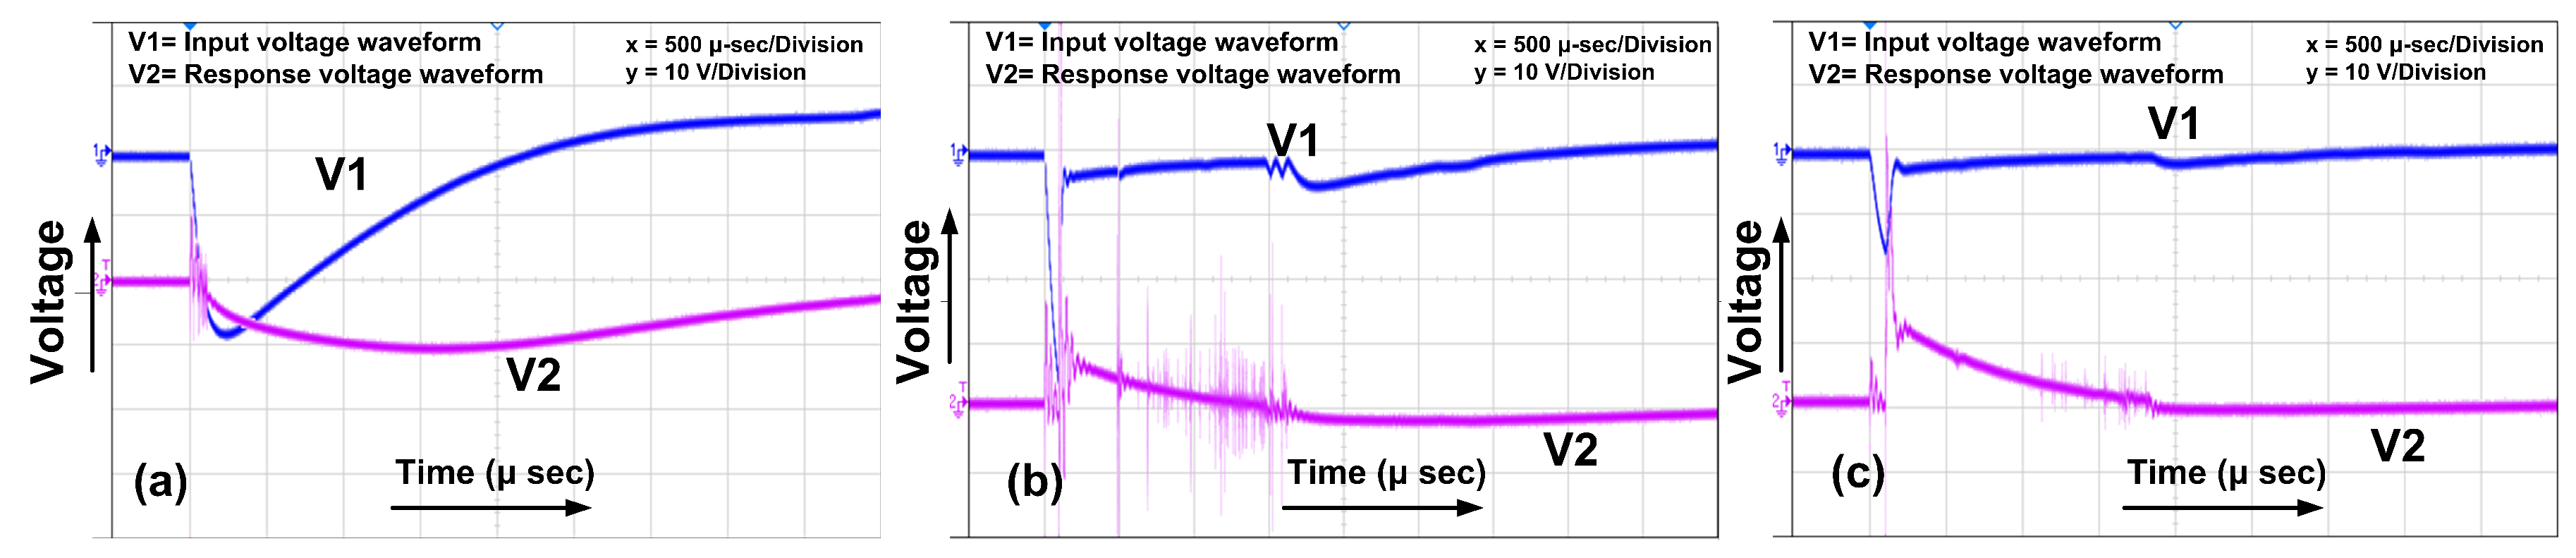
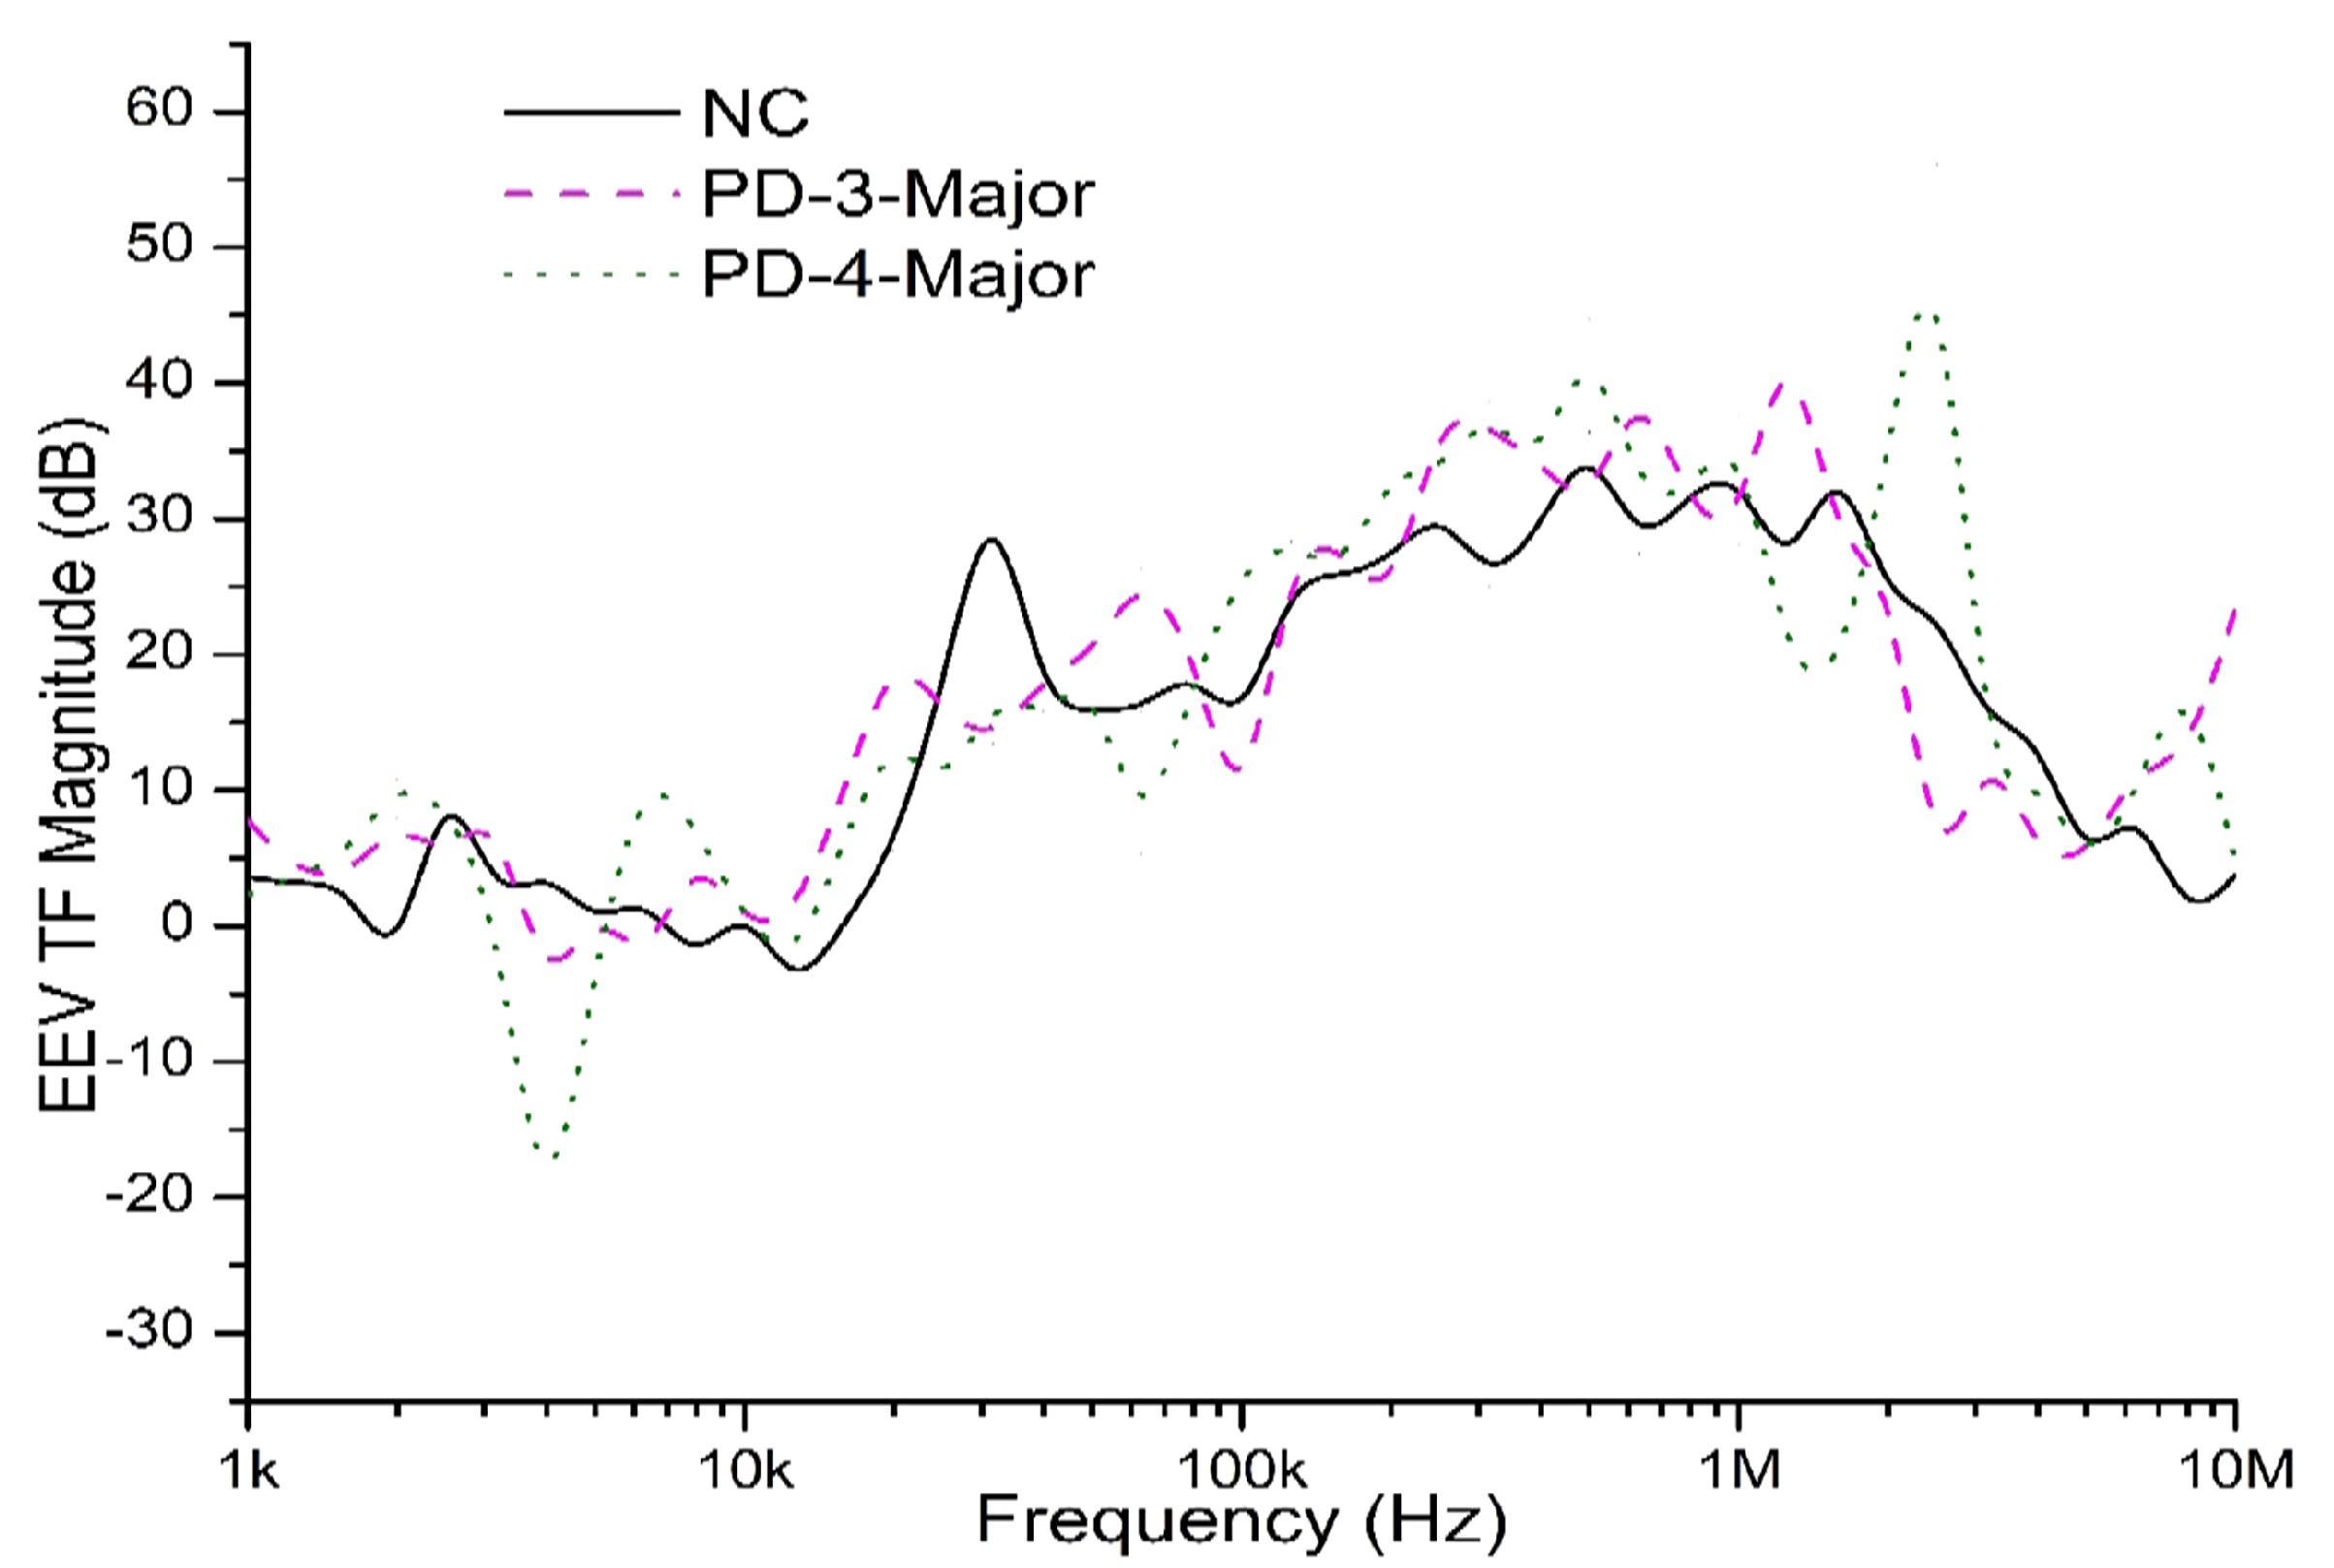
3.3. Diagnosis of the Potential Sources of PD across the Major Insulation

Figure 9 shows the voltage waveforms of various cases investigated for diagnosis of PD sources across the major-insulation. The same normal case plot (Figure 5a), which was obtained under inter-turn free and discharge-free condition), was retained as the signature plot of the transformer and reproduced as Figure 9a. The tests for diagnosis of PD cases (PD-3-major and PD-4-major) were conducted by applying a switching impulse voltage of 37.5 kV and the corresponding waveforms were obtained and are shown in Figure 9b,c, respectively.
The following observations were made from the Figure 9. Firstly, the presence of a potential PD source across major insulation of transformer winding is identifiable when the magnitude switching voltages are sufficient to incept the discharges: there were distortions like chopping in the waveform, pulses appearing over the base impulse waveform and the swings in response voltage (V2) to the opposite polarity. These changes were distinguishable from the changes due to the presence of internal shorts (Figure 5b,c). Sparks was also visible across the electrodes of PD model and confirmed the occurrence of PD.
Secondly, the peak magnitude of the chopped waves is lower when the PD location (87.5% tapping) is near the impulsed end and comparatively higher for PD location (62.5% tapping) situated away from the impulsed end. The difference indicates that the identification of the occurrence of PD and its location is possible with the switching impulse voltage response.
Figure 10 shows the EEV TF plots that were developed for analyzing the usefulness of IFRA approach in the diagnosis of the potential sources of PD across the major insulation.
Figure 10 shows a comparison between the ’Normal case’ and the two PD cases (PD-3-major and PD-4-major). The following observations were made in the transfer function plots as shown in Figure 10. In the EEV TF plots of the PD cases, many changes were observed at different frequencies in the form of alterations in the magnitudes and locations of spikes (Ups & Dips). There was a disappearance of spikes and appearance new spikes. These changes demonstrate that the transfer function plots developed with IFRA can be useful in PD identification, location and discrimination.
Though these differences are differently unique for different PD cases, they are available all along with the low-, mid-, and high-frequency ranges, and it should be carefully interpreted. Capitalizing such variations in TF plots for PD location and discrimination requires experience. Hence, further investigations with feature extraction through statistical parameter were carried out for the interpretation of experimental results.

3.4. Comparison of the Frequency Responses through the Statistical Parameters

The difficulties in getting conclusions from the FRA results can be minimized using the statistical parameters. Accordingly, an additional comparison was made between the EEV TF data of the various cases [32,33,34,35]. The statistical parameters ‘CSD, DABS and MM ratio (absolute)’ were estimated from the EEV TF magnitudes, by comparing two different cases at a time. Thus, the normal case frequency response (EEV TF data) was compared with the responses of various faulty cases by considering them one by one. Table 2 refers the statistical parameters used, their notations, formula, and the ideal values expected (when the two cases compared are similar).
Table 3 shows the comparisons that were made through the statistical parameters. The total frequency spectrum was divided into three sub-bands and comparisons were made between the EEV TF data within the corresponding sub-bands.
For any pair of cases compared, the highest magnitude of variations can happen at some specific and unique sub-band. With careful segmentation of the total frequency spectrum into sub-bands, the difference between any two cases can be easily distinguished. Table 3 shows the comparison that was made though the statistical parameters on sub-band basis with three different objectives. First, the EEV TF magnitudes of Normal case and the inter-turn short cases were compared. The parametric values were shown in the column 3 & 4. Subsequently, comparisons were made between Normal case and the PD cases across minor insulation and presented in column 5 & 6. Finally, comparisons were made between Normal case and the PD cases across major insulation and shown in column 7 & 8. The EEV TF data for the cases NC, Sh-1, and Sh-2 were collected through low voltage FRA with the switching impulse voltage at 5 kV (peak). The data for the voltage-dependent faulty cases PD-1-minor, PD-2-minor, PD-3-major, and PD-4-major were collected through the FRA test at 37.5 kV levels, which was much above their corresponding discharge inception voltages.
The highest deviations of statistical parameters from ideal values are highlighted in Table 3 for easy reference (bold and coloured). The corresponding sub-band indicates the most sensitive sub-band frequency of the total frequency spectrum, which can show the maximum difference between the compared cases.
The following conclusions were drawn from Table 3. The three statistical parameters CSD, DABS and MM ratio (absolute) deviated widely from their ideal values and, thus, capable of distinguishing the faulty case from the normal case. The numerical values highlighted in the Table 3 indicates that their sensitivity in discriminating a faulty case from the normal case is found to be high at some sub-bands. For different faulty cases (which were compared one by one with the Normal case), the numerical values varied to a different extent at same sub-bands, as shown in Table 3. All of these variations indicated that the frequency response of the faulty cases was different from the frequency response of a normal transformer and, thus, switching impulse voltage-based FRA conducted at appropriate test voltages is capable of diagnosing faults.
Thus, the observations and analysis on results in the three forms (i.e., input and response waveforms in the time domain, EEV TF plots, and statistical parameters estimated in the frequency domain) indicated that, with careful selection of the test voltage, the switching impulse voltage based frequency response approach can become useful in diagnosing the potential sources of PD across the minor and major insulations of the transformer winding.
It can be noted that the impulse with a 37.5 kV peak was used in order to diagnose the PD sources which were emulated near the impulse injected end and whose inception voltage was less than the test voltage. If this PD source is near the other end of the winding (near tappings t4 or t5), diagnosis is still possible at 37.5 kV, by reversing the test connections. In such a case, the impulse can be applied at ‘1 V’, and the response voltage can be measured the terminals ‘1U and 1W’, by grounding them through the 245 Ω resistor. For the PD sources requiring still higher voltages for inception, the diagnosis may not be possible with 37.5 kV level, and the test voltage may need to be increased further, gradually up to the Basic Impulse Insulation Level (BIL). Even for such PD sources, the IFRA based approach is advantageous, as it can additionally cover the diagnosis of a wide range of faults, like mechanical displacements, core magnetization issues, and inter-turn shorts. The pros and cons of the proposed approach need to be further explored and compared with other PD diagnostic techniques before generalization.
Based on the severity of suspected faults, the following sequence of steps can be suggested for the experimental investigation, so that IFRA can be extended, even for some preliminary diagnosis of sources of PDs.
  • Step 1: Get/Develop (i) the signature pattern FRA, which can represent the transformer in its fault-free condition (Normal (or) Healthy condition) and (ii) Get the BIL value of the winding under investigation V B I L .
  • Step 2: Start the FRA investigation at a low voltage level (for example, at 5% BIL of the tested winding).
  • Step 3: Compare FRA results with the signature FRA.
  • Step 4: If there are abnormalities, try to correlate with FRA guidelines/standards, declare the type of the fault (for example “inter-turn fault”) and, ‘stop’.
  • Step 5: If no abnormalities are observed in FRA, increase the test voltage magnitude by (∆V) such that V N e w = V O l d + ∆V. (For example, ∆V can be set at 5% of BIL)
  • Step 6: Compare V N e w with V B I L . If V N e w < V B I L , go to ‘step 7’. If V N e w V B I L , go to ‘step 11’.
  • Step 7: Repeat FRA investigations. Observe voltage waveforms in the time domain and develop corresponding FRA Plot.
  • Step 8: Compare the FRA plot at the new test voltage V N e w , with the Signature FRA plot. While comparing, check whether there are any abnormalities like: (i) additional contributions at high-frequency components in the FRA Plot. (Additionally, traces of ‘very short duration pulses’ on the impulse voltage waveforms can also be observed).
  • Step 9: If ‘Yes’, (abnormalities referred in ‘step 8’ are present) declare: “A potential source of PD may be present! Confirmation test recommended!”. Stop the test.
  • Step10: If ‘No’, (abnormalities referred in ‘step 8’ are not present) go to step 6.
  • Step 11: Declare “No Faults are observed through FRA investigation!”. Stop the test.
The focus of the present work was mainly on the methodology, i.e., to check the usability of frequency response approach (FRA), whether the switching impulse voltage-based frequency response approach can be extended to cover up to the preliminary diagnosis of PD sources. The results observed with the modelled PDs have demonstrated the FRA’s usefulness in PD diagnosis.

4. Conclusions

The usefulness of the IFRA in diagnosing the inter-turn shorts and potential sources of partial discharges in the transformer winding was investigated on a 315 kVA, 11 kV/433 V, Dyn 11, ONAN distribution transformer. Inter-turn shorts and Partial discharges were emulated while using the special tappings in one of the HV windings.
Low magnitude switching impulse was found to be effective in diagnosing the inter-turn shorts, but, due to its magnitude being insufficient in incepting the discharge, ineffective in diagnosing the potential sources of partial discharges. Further tests were conducted by gradually increasing the switching impulses. For the emulated PD source, discharges got incepted, with impulses of around 37.5 kV peak magnitudes. Analysis of the frequency response of the transformer containing the potential sources of the PDs, in its normal, discharge-free condition and PD incepted conditions were done while using the EEV TF plots and statistical parameters. The variation found between the frequency responses of different cases demonstrates that the IFRA approach, with switching impulse voltages of a magnitude that is sufficient enough to incept the discharge, is useful in diagnosing the partial discharges within transformers.
In this work, the focus was only given to analyze the extended usability of the FRA approach and, hence, experiments were only limited with the switching impulse voltages and with the PD source artificially included through the special tappings in the transformer winding. A step-by-step procedure for extending the use of the IFRA extended up to the preliminary diagnosis of potential sources of PDs was also suggested. For getting more insight into the practical constraints of the IFRA, further works can be carried out with different types of PDs and with short duration impulses containing more high-frequency contents.

Author Contributions

Conceptualization, K.A., and B.M., Methodology, K.A., B.M., and R.R., Writing—Original draft Preparation, K.A., Supervision, B.M., and N.P. Writing—Review and Editing, B.M., R.R., N.P., H.H.A., and P.S. All authors have read and agreed to the published version of the manuscript.

Funding

This research received no external funding.

Acknowledgments

The authors thank the management of SASTRA Deemed to be University and DST-FIST (sanction order ref: SR/FST/ETI-338/2013(C) dated 10 September 2014) for their motivation, financial support for creating the facilities at HV lab of SASTRA with which, the experimental works were carried out.

Conflicts of Interest

The authors declare no conflict of interest.

References

  1. Rahimpour, E.; Christian, J.; Feser, K.; Mohseni, H. Transfer function method to diagnose axial displacement and radial deformation of transformer windings. IEEE Trans. Power Deliv. 2003, 18, 493–505. [Google Scholar] [CrossRef]
  2. Mahvi, M.; Behjat, V. Localising low-level short-circuit faults on the windings of power transformers based on low-frequency response measurement of the transformer windings. IET Electr. Power Appl. 2015, 9, 533–539. [Google Scholar] [CrossRef]
  3. Abeywickrama, N.; Serdyuk, Y.V.; Gubanski, S.M. Effect of Core Magnetization on Frequency Response Analysis (FRA) of Power Transformers. IEEE Trans. Power Deliv. 2008, 23, 1432–1438. [Google Scholar] [CrossRef]
  4. IEEE. IEEE Guide for the Application and Interpretation of Frequency Response Analysis for Oil-Immersed Transformers; IEEE Std C57.149-2012; IEEE: New York, NY, USA, 2013; pp. 1–72. [Google Scholar] [CrossRef]
  5. IEC. Power Transformers—Part 18: Measurement of Frequency Response; IEC 60076:18; IEC: Geneva, Switzerland, 2012. [Google Scholar]
  6. CIGRE. Mechanical Condition Assessment of Transformer Windings Using Frequency Response Analysis (FRA); WG A2.26; CIGRE: Paris, France, 2008; pp. 1–67. [Google Scholar]
  7. Florkowski, M.; Furga, J. Detection of winding faults in electrical machines using the frequency response analysis method. Meas. Sci. Technol. 2004, 15, 2067–2074. [Google Scholar] [CrossRef]
  8. Florkowski, M.; Furga, J. Detection of transformer winding deformations based on the transfer function—Measurements and simulations. Meas. Sci. Technol. 2003, 14, 1986–1992. [Google Scholar] [CrossRef] [Green Version]
  9. Kahoul, R.; Azzouz, Y.; Ravelo, B. Modelling of DC Motors Conducted Low Frequency EMI/EMC Disturbance for Automotive Applications. Eur. J. Sci. Res. 2011, 63, 368–386. [Google Scholar]
  10. Kahoul, R.; Azzouz, Y.; Ravelo, B.; Mazari, B. New Behavioral Modeling of EMI for DC Motors Applied to EMC Characterization. IEEE Trans. Ind. Electron. 2013, 60, 5482–5496. [Google Scholar] [CrossRef]
  11. Reykherdt, A.A.; Davydov, V. Case studies of factors influencing frequency response analysis measurements and power transformer diagnostics. IEEE Electr. Insul. Mag. 2011, 27, 22–30. [Google Scholar] [CrossRef]
  12. Behjat, V.; Vahedi, A.; Setayeshmehr, A.; Borsi, H.; Gockenbach, E. Identification of the most sensitive frequency response measurement technique for diagnosis of interturn faults in power transformers. Meas. Sci. Technol. 2010, 21, 075106. [Google Scholar] [CrossRef]
  13. Tenbohlen, S.; Ryder, S. Making frequency response analysis measurements: A comparison of the swept frequency and low voltage impulse methods. In XIII International Symposium on High Voltage Engineering; Millpress: Rotterdam, The Netharlands, 2003; pp. 1–4. [Google Scholar]
  14. Yang, Q.; Su, P.; Chen, Y. Comparison of Impulse Wave and Sweep Frequency Response Analysis Methods for Diagnosis of Transformer Winding Faults. Energies 2017, 10, 431. [Google Scholar] [CrossRef]
  15. Khanali, M.; Hayati-Soloot, A.; Høidalen, H.K.; Jayaram, S. Study on locating transformer internal faults using sweep frequency response analysis. Electr. Power Syst. Res. 2017, 145, 55–62. [Google Scholar] [CrossRef]
  16. Jiang, J.; Zhou, L.; Gao, S.; Li, W.; Wang, D. Frequency Response Features of Axial Displacement Winding Faults in Autotransformers With Split Windings. IEEE Trans. Power Deliv. 2018, 33, 1699–1706. [Google Scholar] [CrossRef]
  17. IEC Standard High-Voltage Test Techniques-Partial Discharge Measurements; IEC Std 60270:2000; IEC: Geneva, Switzerland, 2000; pp. 1–51.
  18. Kil, G.S.; Kim, I.K.; Park, D.W.; Choi, S.Y.; Park, C.Y. Measurements and analysis of the acoustic signals produced by partial discharges in insulation oil. Curr. Appl. Phys. 2009, 9, 296–300. [Google Scholar] [CrossRef]
  19. Malewski, R.; Poulin, B. Impulse testing of power transformers using the transfer function method. IEEE Trans. Power Deliv. 1988, 3, 476–489. [Google Scholar] [CrossRef]
  20. Zhang, X.; Shi, M.; He, C.; Li, J. On Site Oscillating Lightning Impulse Test and Insulation Diagnose for Power Transformers. IEEE Trans. Power Deliv. 2020, 35, 2548–2550. [Google Scholar] [CrossRef]
  21. Florkowski, M. Accumulative effect of partial discharges at impulse voltage wave tail. IET Sci. Meas. Technol. 2020, 14, 505–513. [Google Scholar] [CrossRef]
  22. Mondal, M.; Kumbhar, G.B. A technique based on an archimedean copula for the localization of partial discharge in a transformer winding. IEEE Trans. Dielectr. Electr. Insul. 2016, 23, 2908–2916. [Google Scholar] [CrossRef]
  23. Rahman, M.S.A.; Lewin, P.L.; Rapisarda, P. Autonomous localization of partial discharge sources within large transformer windings. IEEE Trans. Dielectr. Electr. Insul. 2016, 23, 1088–1098. [Google Scholar] [CrossRef]
  24. Jeyabalan, V.; Usa, S. Frequency domain correlation technique for PD location in transformer winding. IEEE Trans. Dielectr. Electr. Insul. 2009, 16, 1160–1167. [Google Scholar] [CrossRef]
  25. Rajamani, R.; Rajappa, M.; Madanmohan, B. Sweep frequency response analysis based diagnosis of shorts within transformer windings. IET Gener. Transm. Distrib. 2017, 11, 4274–4281. [Google Scholar] [CrossRef]
  26. Li, J.; Si, W.; Yao, X.; Li, Y. Measurement and simulation of partial discharge in oil impregnated pressboard with an electrical aging process. Meas. Sci. Technol. 2009, 20, 105701. [Google Scholar] [CrossRef]
  27. Hao, L.; Lewin, P.L. Partial discharge source discrimination using a support vector machine. IEEE Trans. Dielectr. Electr. Insul. 2010, 17, 189–197. [Google Scholar] [CrossRef]
  28. Zhao, X.F.; Yao, X.; Guo, Z.F.; Wang, Y.Y.; Li, J.H.; Li, Y.M. Partial discharge characteristics and mechanism in voids at impulse voltages. Meas. Sci. Technol. 2011, 22, 035704. [Google Scholar] [CrossRef]
  29. IEC. Power Transformers—Part 4: Guide to the Lightning Impulse and Switching Impulse Testing Power Transformers and Reactors; IEC 60076-4; IEC: Geneva, Switzerland, 2002. [Google Scholar]
  30. IEEE. IEEE Guide for Transformer Impulse Tests; IEEE Std C57.98; IEEE: New York, NY, USA, 2011. [Google Scholar]
  31. Datasheet. Manual of Yokogawa DLM2022 DSO. Available online: https://cdn.tmi.yokogawa.com/IM710105-03E.pdf (accessed on 21 November 2020).
  32. Sant’Ana, W.C.; Salomon, C.P.; Lambert-Torres, G.; da Silva, L.E.B.; Bonaldi, E.L.; de Lacerda de Oliveira, L.E.; da Silva, J.G.B. A survey on statistical indexes applied on frequency response analysis of electric machinery and a trend based approach for more reliable results. Electr. Power Syst. Res. 2016, 137, 26–33. [Google Scholar] [CrossRef]
  33. Badgujar, K.P.; Maoyafikuddin, M.; Kulkarni, S.V. Alternative statistical techniques for aiding SFRA diagnostics in transformers. IET Gener. Transm. Distrib. 2012, 6, 189–198. [Google Scholar] [CrossRef]
  34. Behjat, V.; Mahvi, M. Statistical approach for interpretation of power transformers frequency response analysis results. IET Sci. Meas. Technol. 2015, 9, 367–375. [Google Scholar] [CrossRef]
  35. Secue, J.; Mombello, E. New methodology for diagnosing faults in power transformer windings through the Sweep Frequency Response Analysis (SFRA). In Proceedings of the 2008 IEEE/PES Transmission and Distribution Conference and Exposition: Latin America, Bogota, Colombia, 13–15 August 2008; pp. 1–10. [Google Scholar] [CrossRef]
Figure 1. (a) Circuit representation of the Transformer. (b) Photograph of the transformer (c) Circuit representation of the Partial Discharge (PD) model. (d) Photograph of the PD model.
Applsci 10 08283 g001
Figure 2. Circuit connections for emulation of faults: (a) Inter-turn short (Sh-1). (b) PD source across minor insulation (PD-1-minor) (c) PD source across major insulation (PD-3-major).
Applsci 10 08283 g002
Figure 3. Circuit for the diagnosis of the source of PD across the minor.
Applsci 10 08283 g003
Figure 4. Photograph of the experimental setup.
Applsci 10 08283 g004
Figure 5. Comparison of the input and response voltage waveforms for the inter-turn short diagnosis: (a) Normal case (b) Sh-1 (c) Sh-2.
Applsci 10 08283 g005
Figure 6. Comparison of End to End Voltage Transfer Function (EEV TF) plots for the inter-turn short diagnosis: Normal case (vs) Sh-1 (vs) Sh-2.
Applsci 10 08283 g006
Figure 7. Comparison of the input and response voltage waveforms for the diagnosis of sources of PDs across minor insulation (a) Normal case (b) PD-1-minor (c) PD-2-minor.
Applsci 10 08283 g007
Figure 8. Comparison of EEV TF plots for the diagnosis of sources of PDs across minor insulation: Normal case (vs) PD-1-minor (vs) PD-2-minor.
Applsci 10 08283 g008
Figure 9. Comparison of the input and response voltage waveforms for the diagnosis of sources of PDs across major insulation (a) Normal case (b) PD-3-major (c) PD-4-major.
Applsci 10 08283 g009
Figure 10. Comparison of EEV TF plots for the diagnosis of sources of PDs across major insulation: Normal case (vs) PD-3-major (vs) PD-4-major.
Applsci 10 08283 g010
Table 1. Details of the investigations and their notations.
S.NoDescription of InvestigationsNotations
1Developing the signature FRA pattern-for Transformer under the normal condition
(No inter-turn short and discharge free condition across a Potential source of PD)
Normal case
2Diagnosis of Inter-turn short between tappings t1 and t2Sh-1
3Diagnosis of Inter-turn short between tappings t2 and t3Sh-2
4Diagnosis of the presence of a potential source of PD between tappings t1 and t2PD-1-minor
5Diagnosis of the presence of a potential source of PD between tappings t2 and t3PD-2-minor
6Diagnosis of the presence of a potential source of PD between tappings t2 and the grounded tankPD-3-major
7Diagnosis of the presence of a potential source of PD between tappings t3 and the grounded tankPD-4-major
Table 2. Statistical parameters, notations, formula, and their ideal values.
S.NoStatistical ParametersFormula UsedIdeal Value Expected
(When Two Cases Compared Are Similar)
1CSD [32,33] C S D x , y = i = 1 N x i x ¯ 2 y i y ¯ 2 N 1 0
2DABS [32,34] D A B S x , y = i = 1 N y i x i N 0
3MM ratio [35]
(absolute)
M M x , y = i = 1 N m i n x i y i i = 1 N m a x x i y i 1
Note: x i and y i indicate i t h values of the two cases compared. x ¯ and y ¯ indicate their respective absolute values. x ¯ and y ¯ indicate their average values and ’N’ indicates number of frequencies within a sub-band.
Table 3. Comparison between the normal and various faulty cases on statistical parameter basis.
Statistical Parameter Values Calculated during Different Comparisons
Frequency
Sub-band
Comparisons made for the purpose of the diagnosis of Inter-turn shorts and PD sources
Inter-turn shortsPD sources within minor insulationPD sources within major insulation
NC
vs.
Sh-1
NC
vs.
Sh-2
NC
vs.
PD-1-Minor
NC
vs.
PD-2-Minor
NC
vs.
PD-3-Major
NC
vs.
PD-4-Major
CSD
1 kHz-10 kHz8.849.9711.0610.908.6910.38
100 kHz-1 MHz5.266.296.579.977.414.67
1 MHz-10 MHz12.398.869.9815.9113.1513.80
DABS
1 kHz-10 kHz5.386.7010.699.556.887.05
100 kHz-1 MHz3.874.366.467.756.205.24
1 MHz-10 MHz8.687.488.4613.679.829.35
MM RATIO (absolute)
1 kHz-10 kHz0.650.520.450.410.550.53
100 kHz-1 MHz0.870.860.800.750.800.84
1 MHz-10 MHz0.550.640.640.460.570.60
Publisher’s Note: MDPI stays neutral with regard to jurisdictional claims in published maps and institutional affiliations.

