Article

Thermal Investigations on Carbon Nanotubes by Spectroscopic Techniques

by
Maria Teresa Caccamo
,
Giuseppe Mavilia
and
Salvatore Magazù
*
Department of Mathematical and Computer Sciences, Physical Sciences and Earth Sciences, University of Messina, 98166 Messina, Italy
*
Author to whom correspondence should be addressed.
Appl. Sci. 2020, 10(22), 8159; https://doi.org/10.3390/app10228159
Submission received: 22 October 2020 / Revised: 9 November 2020 / Accepted: 12 November 2020 / Published: 18 November 2020
(This article belongs to the Special Issue Applications and Advancements of Spectroscopy)

Abstract

:
Carbon nanotubes (CNTs) thanks to their unique physical properties have been employed in several innovative applications particularly for energy storage applications. Certain technical features of carbon nanotubes, such as their remarkable specific surface, mechanical strength, as well as their electron and thermal conductivity are suitable for these applications. Furthermore, in order to produce a device, thermal treatment is needed and for this reason the trend of thermal decomposition of the tubes plays a key role in the integration process. The main purpose of this work was to characterize the thermal behavior of CNTs. In particular, we show the findings of an experimental study on CNTs performed by means of Fourier Transform InfraRed and Raman spectroscopy investigations. The collected FTIR and Raman spectra were analyzed by using two innovative procedures: spectral distance (SD) and wavelet cross correlation (XWT). From both analyses, a relaxation temperature value emerged of T = 206 °C, corresponding to a relaxation inflection point. Such a system relaxation phenomenon, occurring in the fiber CNTs, could be connected with the decay of the mechanical properties due to a decrease in the alignment and compaction of the fibers.

1. Introduction

The growing request for renewable energy sources has accelerated the development of novel techniques used to produce new devices for energy thermal storage. Nanotechnology can represent an important solution to these problems, as it can instigate the synthesis of advanced materials with improved performances, to be used in various applications, such as energy storage, molecular biology, and water treatment. Carbon nanotubes (CNTs) are considered to be among the most important nanostructured materials due to their particular chemical composition: indeed, they show a high correlation between structure and properties, that holds for different structures [1,2]. Since their discovery in the early 1990s, the electro-mechanical properties of carbon nanotubes have been extensively studied. Thanks to their important properties (such as good elasticity and mechanical strength, good electronic and thermal properties, and high specific surface), CNTs have been used effectively for numerous applications such as energy storage devices, photovoltaic devices, chemical sensors, and actuators [3,4,5,6]. CNTs represent monodimensional carbon allotropic forms, in which the carbon atoms present are arranged in such a way as to create a cylindrical shape. Carbon materials can be divided based on their atomic bond (sp, sp2, and sp3 hybridizations) [7,8,9].
Furthermore, as regards the preparation of CNTs, among the numerous synthesis methods developed [10,11,12,13,14,15,16], laser ablation and graphite arc discharge are those most used to produce CNTs from the vapor phase. The carbon nanotubes obtained from these two synthesis methods have good characteristics but are characterized by the presence of defects linked to impurities. The problem of the synthesis methods is related to the high temperatures used [17,18], which result in considerable production costs. In order to solve this problem, chemical vapor deposition (CVD) techniques have been used to obtain the growth of CNTs on various substrates [19,20,21,22,23,24]. The different properties of the carbon nanotubes CNTs, determined both experimentally and with computational methods, are shown in Table 1; carbon nanotubes and graphene are among the most mechanically resistant materials because of the presence of strong covalent links (C=C) between carbon atoms with sp2 hybridization. In fact, the carbon nanotubes CNTs have a high mechanical tensile strength (150 GPa): this value is about 20 times higher than that of steel although CNTs are five times lighter [25,26]. On the other hand, as regards the thermal properties of CNTs, they show high values of thermal conductivity, whose value at room temperature is equal to 3500 W/(mK). This value is highly dependent on the quality and alignment of the carbon nanotubes. In addition to high thermal conductivity, CNTs show high thermal stability in air. Therefore, thanks to these very important thermal properties such as high thermal stability and excellent thermal conductivity, carbon nanotubes-based materials (CNTs) can be effectively used for energy thermal storage applications. Furthermore, the electromechanical properties of the CNTs have been assessed using both theoretical and experimental methods: in this sense, computational method has proved fundamental for the characterization and design of the CNTs [27,28,29,30]. Moreover, the different forms of CNTs can be grouped both as metallic and semiconductor materials and in relation to the arrangement of the hexagonal rings in an armchair, zigzag or chiral position. As regards the number of walls, they can be divided into single-walled (SWCNTs), double-walled (DWCNTs), and multi-walled (MWCNTs). The disposition of carbon atoms in the structure of CNTs and the presence of defects strongly influence the mechanical strength of the carbon nanotubes [31,32].
In addition to the property, the range of experimental measurements and the computational calculations, the table reports the unit of measurement of each property. In particular, GigaPascal [GPa] is the unit of measurement of the tensile strength, TeraPascal [TPa] is the unit of measurement of the tensile strength Young’s Modulus. Siemens/meter [S/m] represents the unit of measurement of the Electrical Conductivity while Watt/meter Kelvin [W/mK] is the unit of measurement the thermal conductivity. The degree Celsius [°C] is associated to the charge mobility. The unit of measurement of Charge Mobility is [cm2/V∙s] where V is volt and s represents the second, finally the unit of measurement of the surface area is [m2/g] where m is the meter ang is the gram.
In order to improve the electronic properties of CNTs, different methods of functionalization of carbon nanotubes have recently been developed by replacing the carbon atoms on the walls with other elements such as nitrogen N [33,34,35,36] and boron B [37,38,39,40,41].
It is well known that because of their properties, such as high flexibility, mechanical strength, aspect ratio, as well as high thermal and high electrical conductivity, CNTs are employed for many applications, to mention a few; CNTs catalyst supports, CNTs conductive properties and CNTs energy storage. Regarding this latter application, thanks to their intrinsic properties, CNTs are the favorite materials for electrodes in batteries and capacitors and find applications in various fuel cell components [42]. Furthermore, due to the high capacity of heat and electrical conductivity and mechanical properties, CNTs are considered to be efficient electron field-emitters. As for the techniques concerned for these systems, both the FTIR method and Raman spectroscopy have been employed [43,44,45,46,47]. It is well known that FTIR and Raman techniques are non-destructive and not invasive. In particular, FTIR allows nanoscale structure changes to be revealed while Raman spectroscopy obtains information about their interaction with adsorbate molecules.
For the characterization of CNTs thermal properties, two innovative methods have been applied. The first, Spectral Distance, refers to the deviation from the spectrum at the lowest temperature, of T = 25 °C [48,49]. The second method, Cross Correlation Wavelet (XWT) by means of the coefficient of XWT ( r X W T ), is based on the similarity degree of several spectra, taking as reference spectrum at the lowest temperature, of T = 25 °C [50,51,52]. Both the procedures reveal the same result.

2. Materials and Methods

The investigated materials were the CNTs, purchased from Sigma Aldrich, held at different temperatures. More specifically, the CNTs were placed with a metal spatula inside glass containers, which in turn were placed on a heating plate. They were heated, by means of an electric hot plate, to T = 25 °C, 50 °C, 100 °C, 150 °C, 200 °C, 250 °C, 300 °C, 350 °C, 400 °C, and 450 °C.

2.1. Experimental Section

The Fourier Transform InfraRed (FTIR) method allows the analysis of vibrational and rotational movements of molecules [53,54,55,56,57,58,59,60,61,62,63]. This method enables analysis of the 14,000–10 cm−1 range of the electromagnetic spectrum, which contains the Near-IR (4000–14,000 cm−1), the Mid-IR (400–4000 cm−1), and the Far-IR (10–400 cm−1).
Such a technique turns out to be a complementary technique to other methods such as Raman spectroscopy and other neutron-based spectroscopies [64,65,66,67,68,69,70]. In this experimental work, CNTs spectra were registered by means of an ATR-FTIR Vertex 70 V spectrometer (Bruker Optics, Ettlingen, Germany) equipped with a platinum diamond ATR, working in the Mid-IR range from 4000 to 400 cm−1 and in the temperature range of 25–450 °C.
The main characteristic of the employed VERTEX 70v spectrometer (Bruker Optics, Ettlingen, Germany) is the RockSolidTM interferometer (Bruker Optics, Ettlingen, Germany), equipped with gold-coated optics and a 30° angle of incidence in order to maximize efficiency and sensitivity and to minimize polarization effects.
For each spectrum, in order to obtain a good signal-to-noise ratio, 64 repetitive scans were accumulated with an average resolution of 4 cm−1, in the 400–4000 cm−1 spectral range. As far as the Raman spectroscopy was concerned, Raman spectra were obtained by means of the Spectrometer BRAVO (Bruker Optics, Ettlingen, Germany); the laser source delivers two different excitation wavelengths, i.e., 785 nm and 1064 nm. Such a characteristic is especially important since, due to fluorescence, the analysis of raw materials by Raman spectroscopy is often difficult. The BRAVO spectrometer manages the Sequentially Shifted Excitation (SSETM) procedure, a patented fluorescence moderation process which allows a broad range of raw materials to be measured.
The investigated spectral range was 300–3200 cm−1 in the temperature range of 25–450 °C; spot size value was 10–15 µm at a magnification value of 10× lens.
Concerning the interpretation of spectra and the data analysis, preprocessing of the data was performed by means of the Bruker OPUS software. The following processing steps were performed:
-
baseline treatment to decrease the differences between the spectra due to the shift of the baseline
-
smoothing treatment to reduce instrument noise
-
first derivative treatment to correct baseline shift
-
second derivative to better distinguish the spectral characteristics
-
spectra normalization to correct the path length dissimilarity and to diminish the disparities among single measurements.
Then, the data were processed by means of Matlab environment.

2.2. Spectral Distance

For the Spectral Distance evaluation, we consider the following expression (1):
S D = [ A ( ω , T ) A ( ω , T r ) ] · Δ ω
Here, A ( ω ) is the absorbance at frequency ω ; T r represents room temperature that coincides with the reference temperature, that is the lowest value of temperature, i.e., T = 25 °C and finally Δ ω is the frequency resolution. This formula furnishes the value of the deviation from the reference spectrum (T = 25 °C) for each investigated temperature. Since the data points arrange themselves in a sigmoidal trend, the following model fit (2) was adopted:
I C N T ( T ) = A ( 1 1 1 + e B ( T T 0 ) ) + ( C D T )
Here A is the sigmoidal amplitude, B denotes the steepness, T 0 represents the temperature value at the point of inflection, and CDT indicates a linear background contribution [71,72]. This approach was applied both on registered IR and Raman spectra.

2.3. Wavelet Cross-Correlation

To evaluate the similarity that exists among the collected spectra at different temperatures, r X W T was measured. Such a method has found many applications in different fields, such as meteorology, neutron spectroscopy, financial science, and also in geological and geophysical sciences [73,74,75,76]. In general, Wavelet Transform (WT) breaks down a signal y ( t ) as sum of the scaled (through the positive parameter s ) and shifted (through the parameter u ) mother wavelets Ψ s , u by the following Equation (3):
W T = W 1 ( s , u ) Ψ s , u * d u
and, from this latter, one can express the Wavelet Spectrum (WS) by means of the following Equation (4):
W S = 1 2 + | W ( s , u ) | 2 d u
Then, starting from these two equations, we can define the Wavelet Cross-Correlation ( r X W T ) as follows by means of Equation (5):
r X W T = ( W T 1 ( s , u ) W T 2 * ( s , u ) d u ( W S 1 ( s ) W S 2 ( s ) ) 1 / 2 )
where W T 1 ( s , u ) and W T 2 * ( s , u ) represent, respectively, the Wavelet Transform of the first and second spectrum and * is the complex conjugate, while W S 1 and W S 2 are the first and the second wavelet spectrum. The value of r X W T is between −1 and +1 which signifies that there is either a negative or a positive correlation [77,78]. Also in this case, from the evaluation of r X W T for each temperature, there results sigmoidal behaviour that can be analyzed with the model fit of Equation (2).

3. Results and Discussion

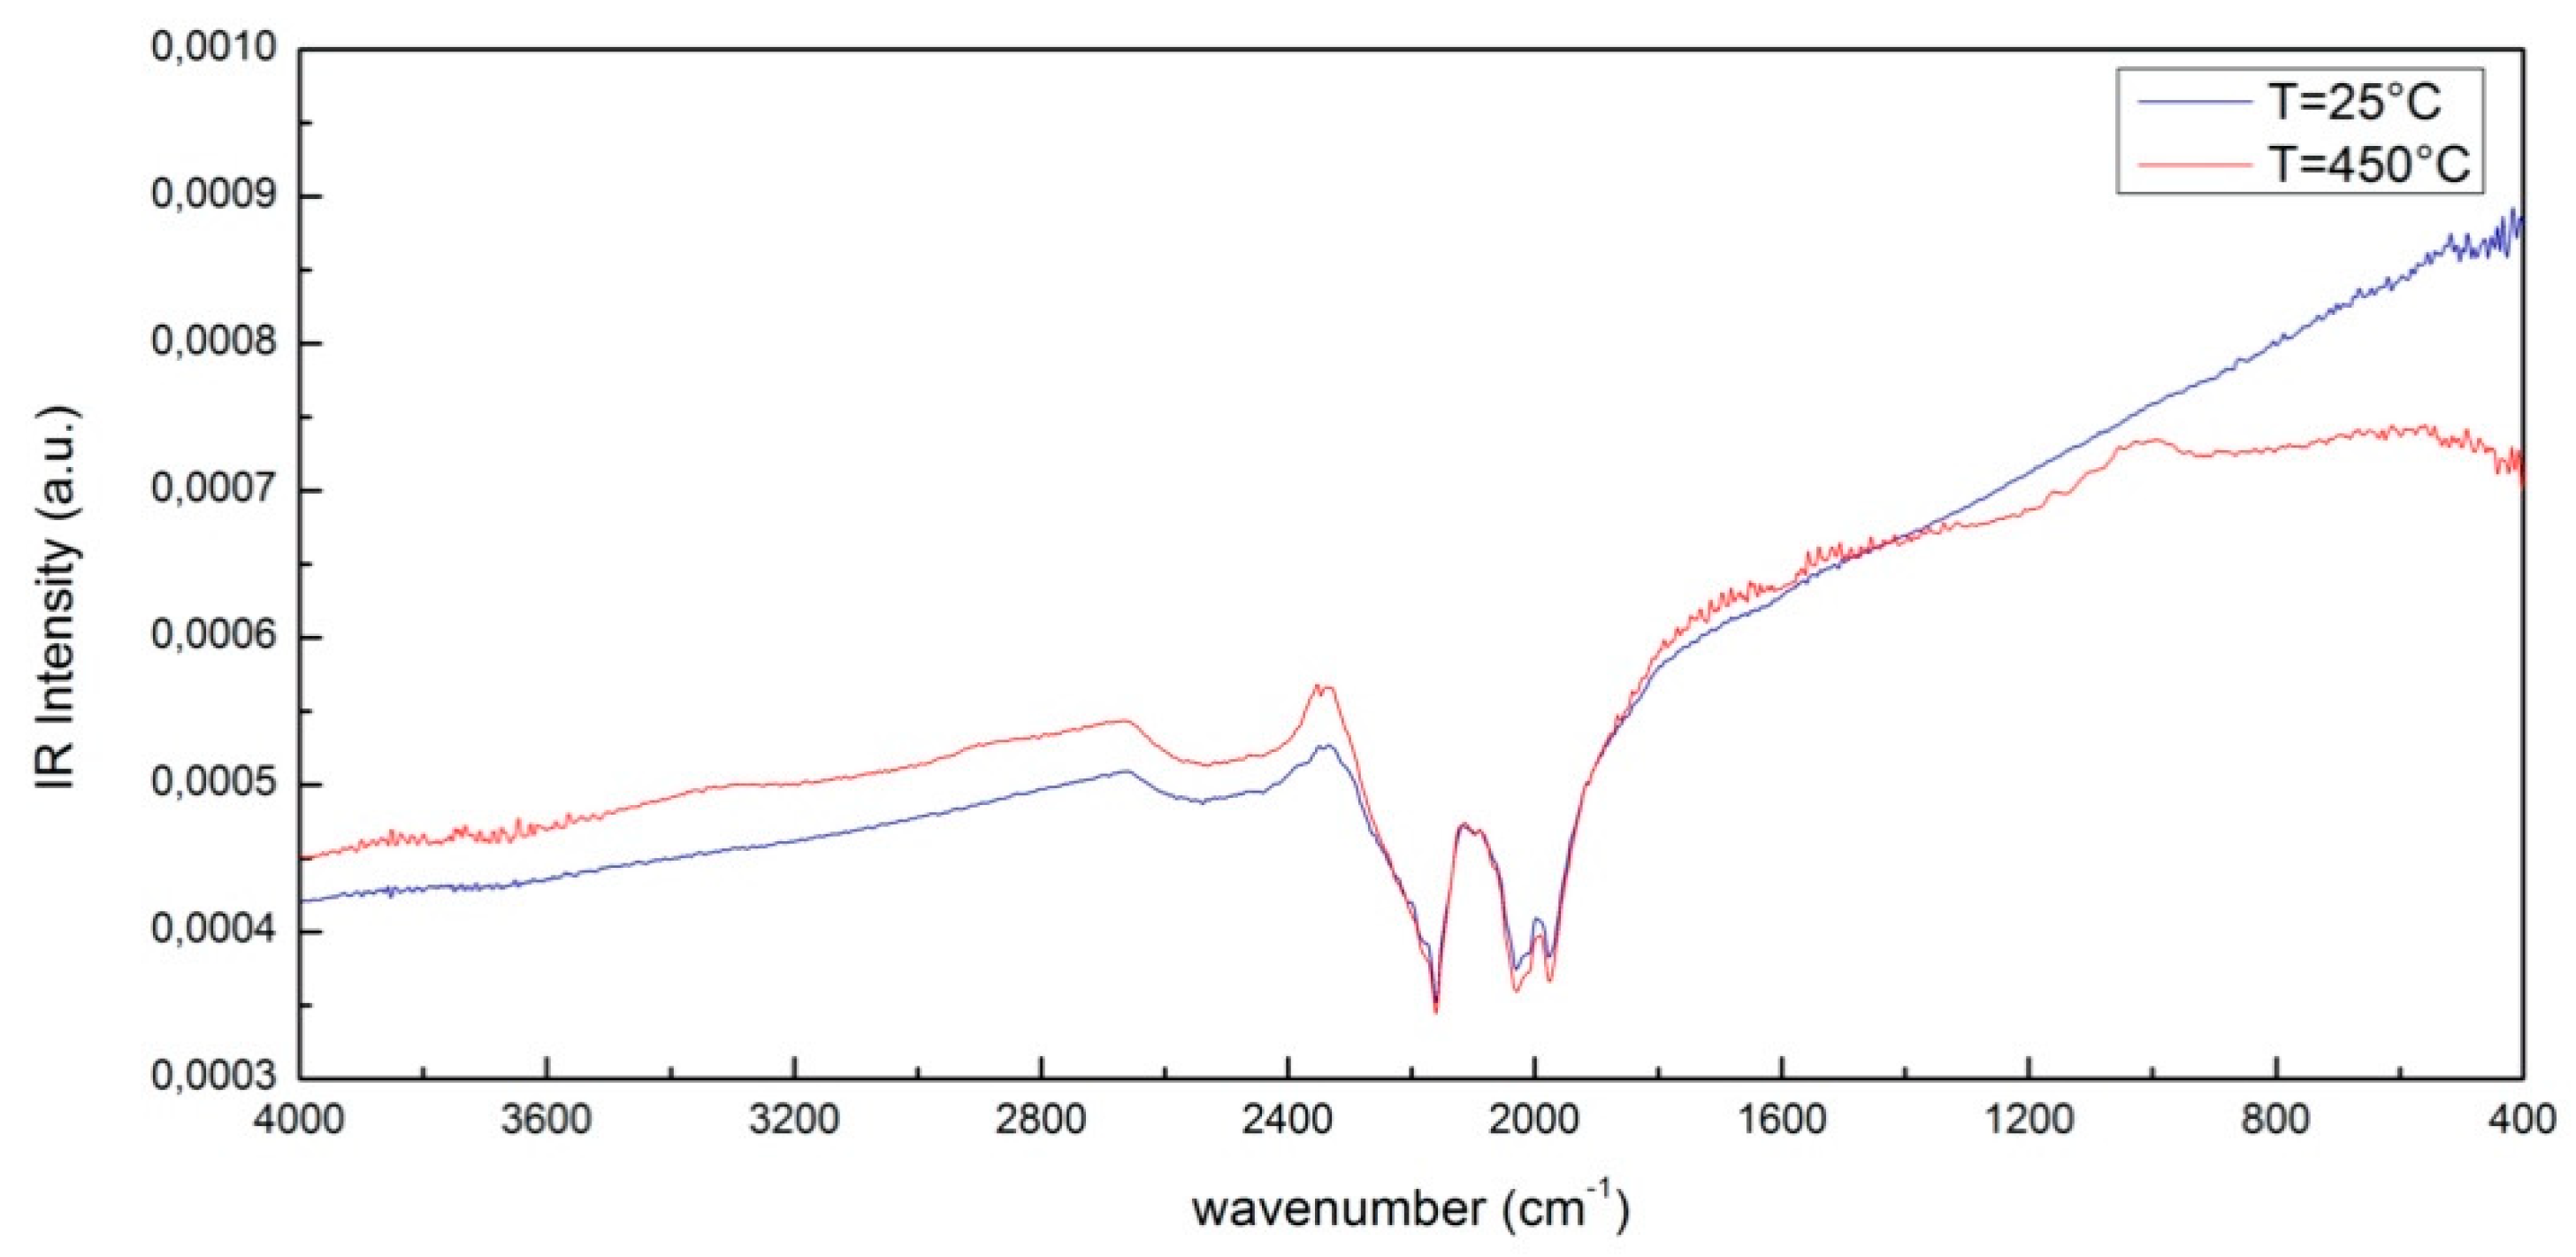
3.1. Fourier Transform Infrared Spectroscopy

Figure 1 shows, as an example, a comparison between the IR intensity as a function of wavenumber of CNT at T = 25 °C and at T = 450 °C in the Mid-IR spectral range, i.e., 400–4000 cm−1. The characteristic peaks are induced by S–H bonds that are centered around 2327 cm−1 and 2113 cm−1. As can be seen, by increasing the temperature, these characteristic peaks do not change significantly while in the right-hand side region of the infrared spectrum, called the fingerprint region, which covers the spectral range 1450–500 cm−1, there are some relevant changes. In particular, a peak around 1143 cm−1 and 868 cm−1 appears that can be attributed to C–O stretching and C–C stretching.

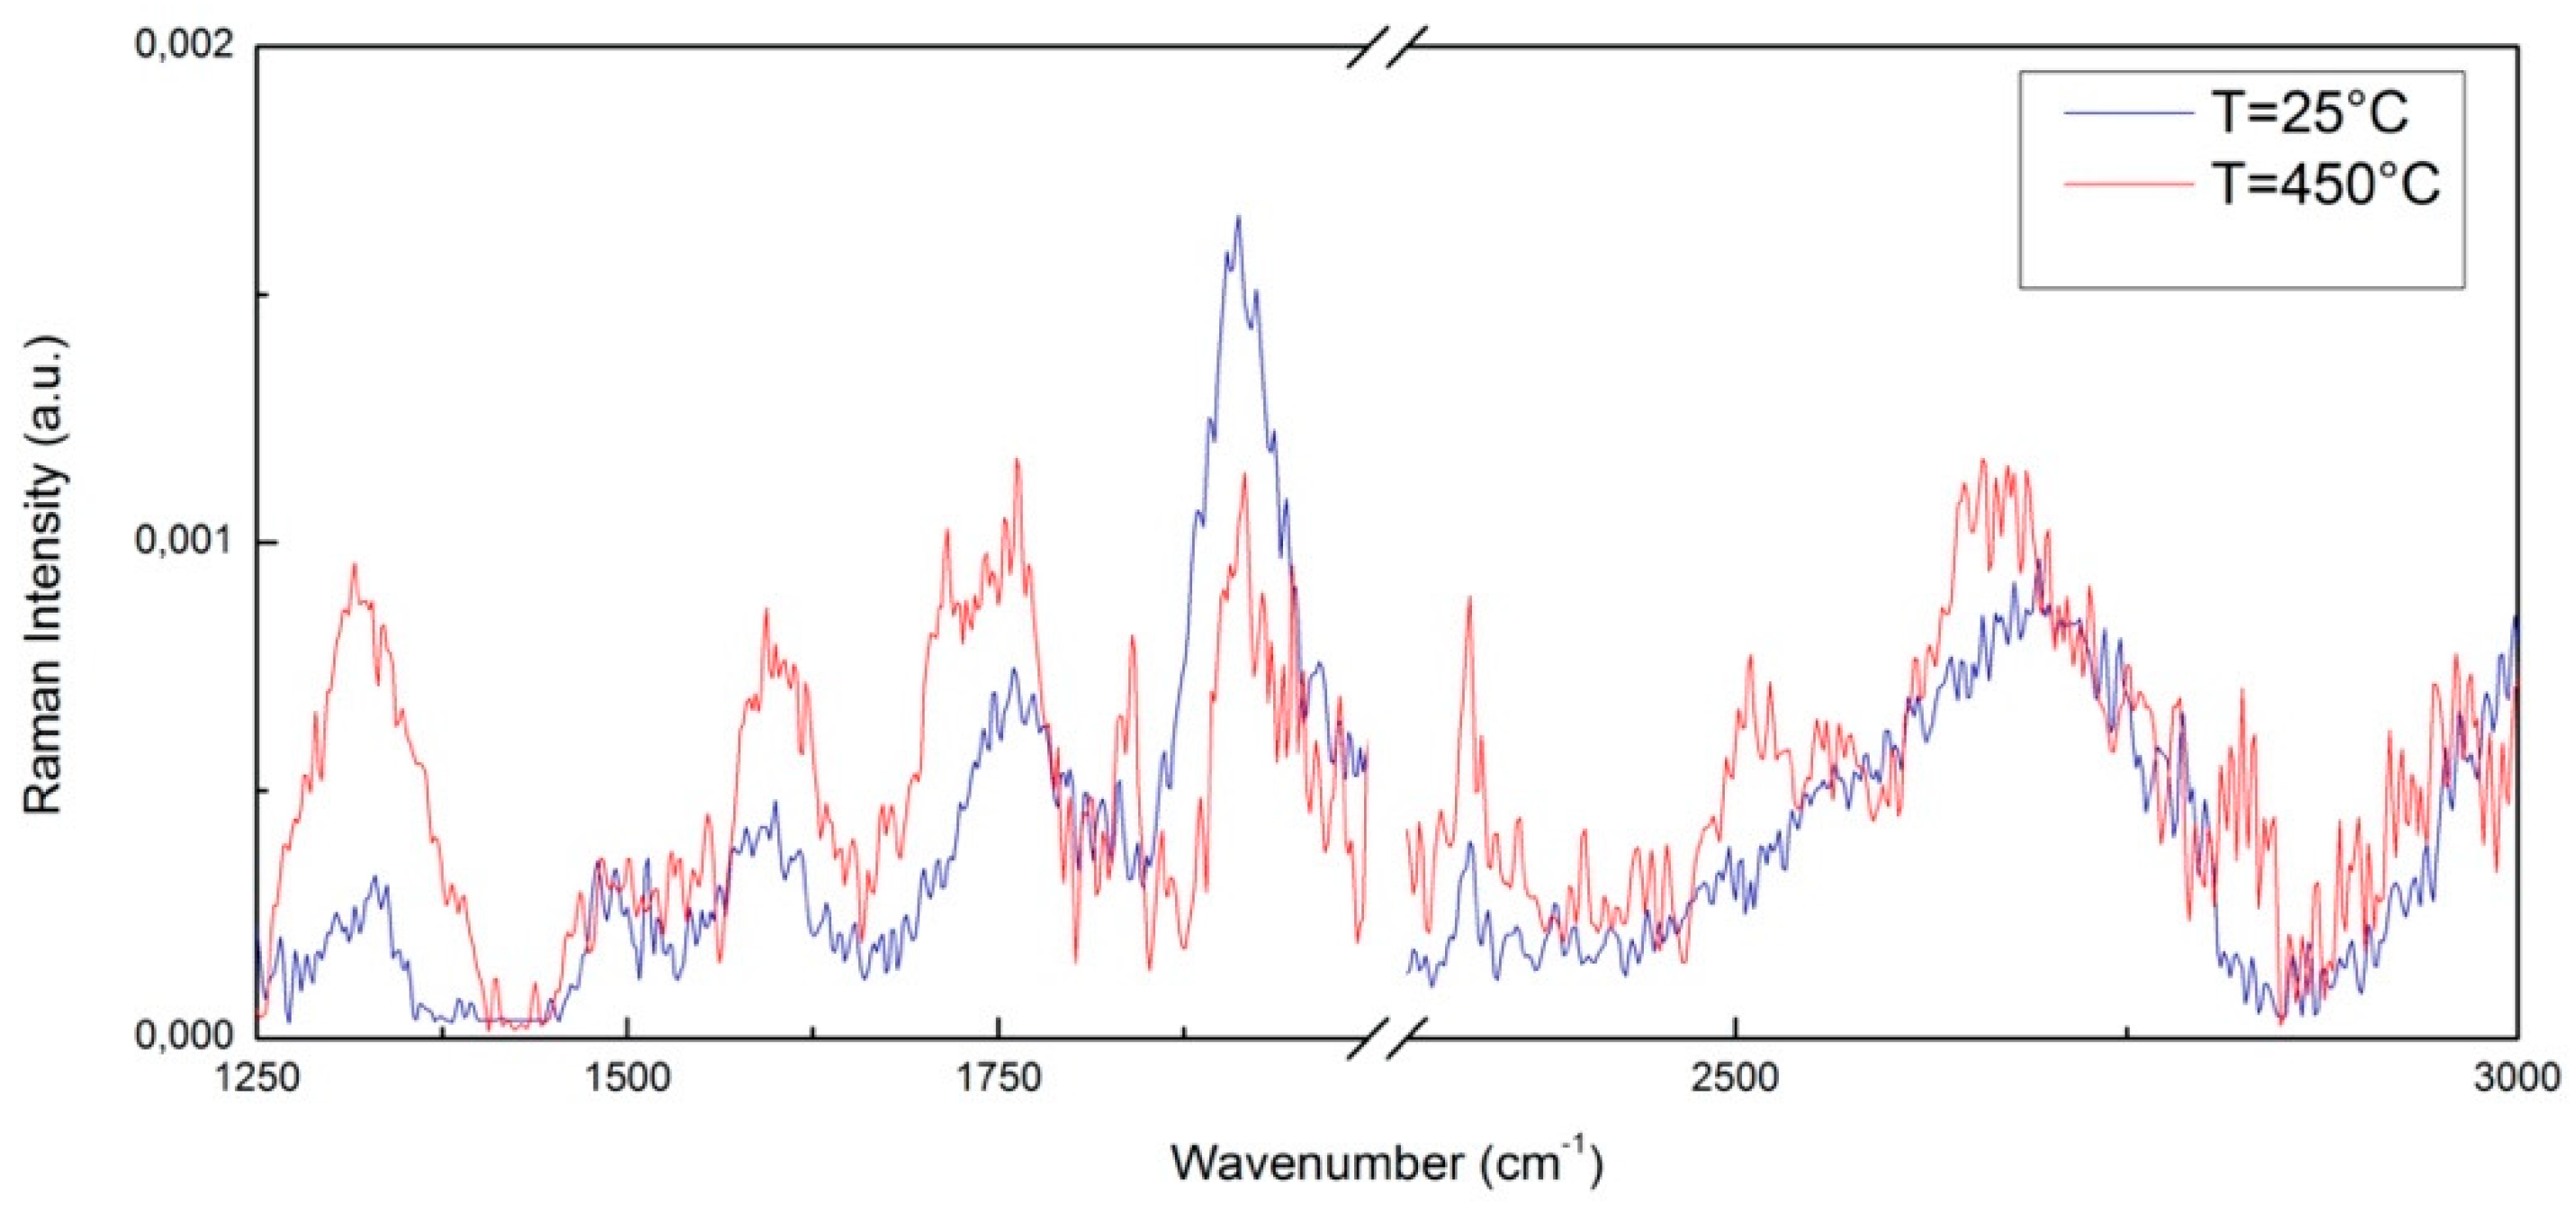
3.2. Raman Spectroscopy

The Raman spectrum of pure CNTs has several characteristic bands such as the D band at 1300 cm−1 which can be attributed to the presence of defects in the structure of the CNTs, and the G band at 1575 cm−1 which originated from tangential vibration modes of the bonds in carbon atoms with sp2 hybridization. The D and G bands are typical Raman peaks of CNTs and the peak at 2668 cm−1 represents the 2D band of carbon nanotubes (CNTs) [79,80]. The G band at 1575 cm−1 represents the phase vibration of the graphite lattice and the D band at about 1300 cm−1 is related to the disorder of the graphite edges. The G band is composed only of sp2 type C–C bonds, corresponding to the concentric cylinders of the graphene layers, while the D band is attributed to vibrations of carbon atoms with dangling bonds in the graphite structure (carbon atoms having sp3 hybridization similar to diamond) [81,82,83]. Figure 2 shows, as an example, a comparison between Raman intensity versus wavenumber for the two investigated samples, i.e., CNT at T = 25 °C and CNT at T = 450 °C in the range 1250–3000 cm−1. As above mentioned, the characteristic bands of CNT are present. As can be seen, by increasing the temperature up to T = 450 °C, several changes occur in the spectrum, expecially in the 2500–2750 cm−1 region.

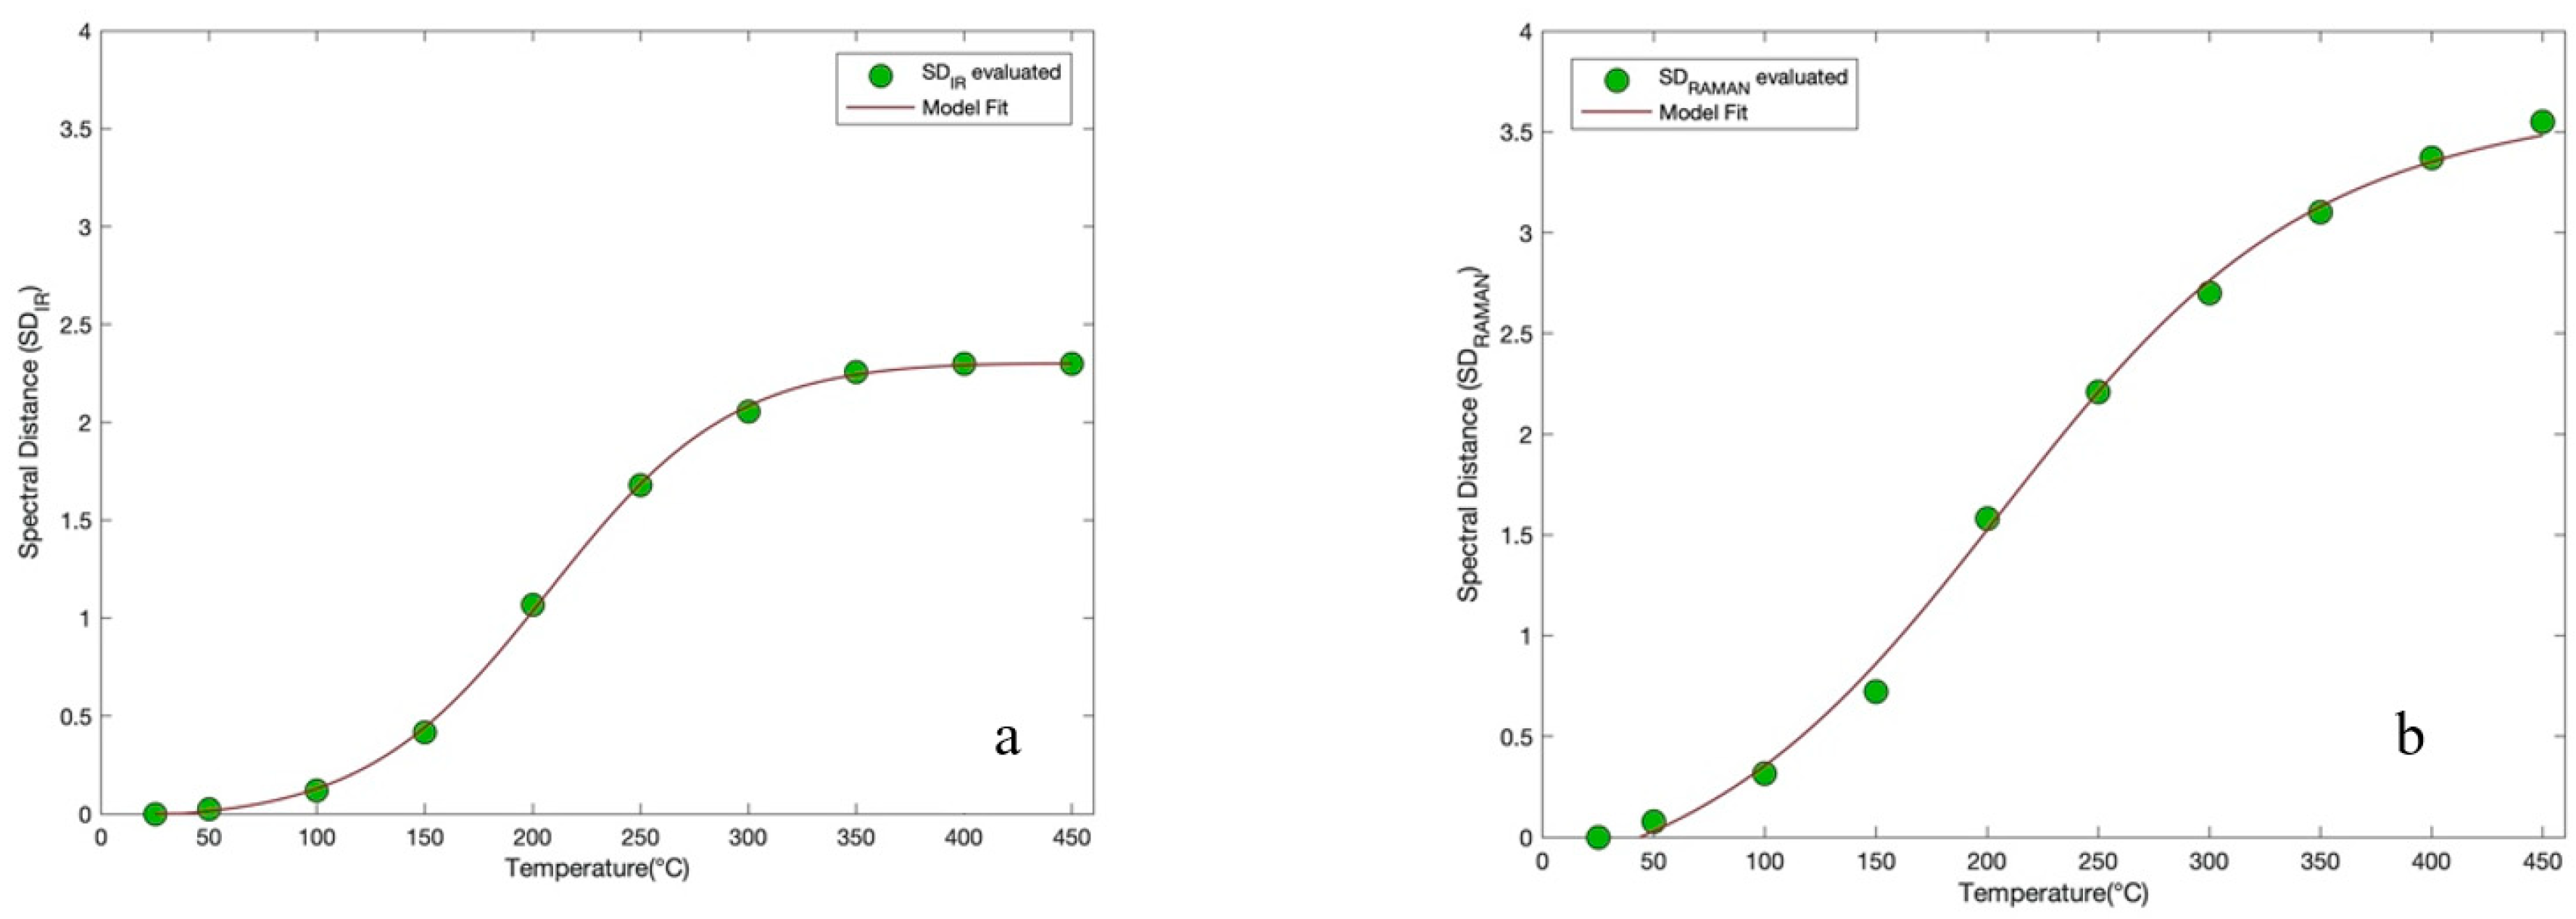
3.3. Spectral Distance Evaluation

Figure 3a,b shows the spectral distance (SD) behavior with respect to temperature for CNTs, respectively for the recorded IR and Raman spectra, together with the fit of the model (brown line). The SD analysis procedure was applied to the whole investigated spectral range for each temperature spectrum.
Each data point represents the value of the deviation of the spectrum at a given investigated temperature from the respective spectrum measured at 25 °C. From the evaluation of the SD applied for each spectrum as a function of temperature an increasing sigmoidal trend was obtained. In order to extract quantitative information, a curve fit through Equation (2) was performed for the two profiles. From this analysis it emerged that the curve, for the IR spectra, presents a point of inflection equal to T 0 = 206.55 °C and for the Raman spectra presents a point of inflection equal to T 0 = 206.28 °C. Such a method furnishes the same value of inflection point for both the spectroscopic techniques employed.

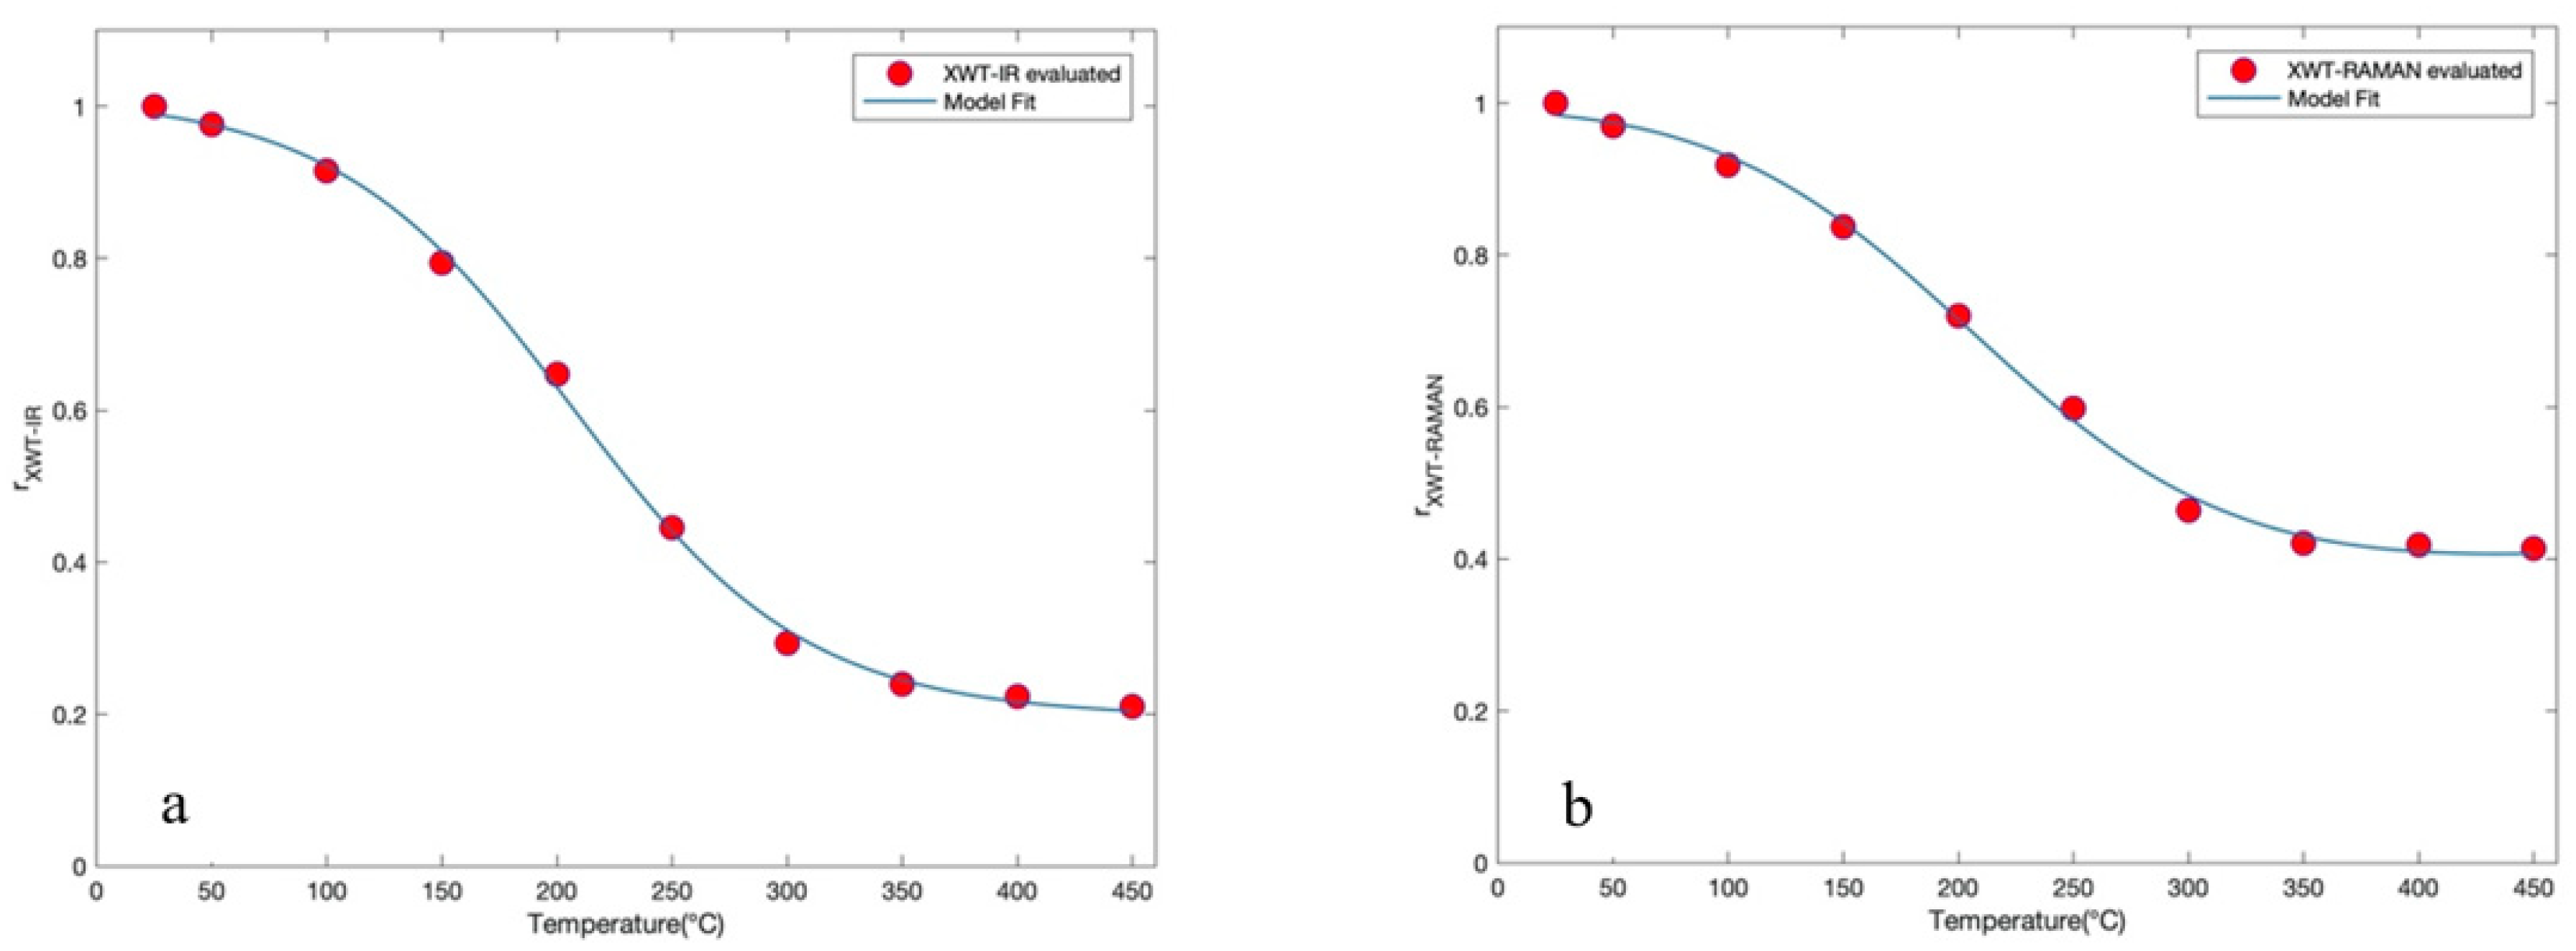
3.4. Wavelet Cross-Correlation Analysis

From the value of r X W T , by means of Equation (5), for each investigated temperature of the registered IR and Raman spectra, it emerges that the values arrange themselves in decreasing sigmoidal behavior. In this case, a curve fit model based on Equation (2) was also employed for the two profiles and an inflection point at 206.19 °C for the IR spectra and an inflection point at 206.15 °C for the Raman spectra were obtained. Figure 4a,b reports the trend of XWT versus temperature for CNTs, respectively of the recorded IR and Raman spectra, in the temperature interval from 25 °C to 450 °C together with the model fit of Equation (2) (blue line). This approach, like the previous one, provides the same value of inflection point for both the spectroscopic techniques employed.
From the performed SD analysis, both for the IR and Raman obtained spectra, it emerges that the obtained relaxation temperature values, i.e., the T 0 value of Equation (2), are very close for the two techniques. This value detects the decay of the mechanical properties and coincides with the oxidation of amorphous carbonate. Furthermore, one should also take into account that the tubes begin to oxidize at 200 °C under partial oxygen and that a greater quantity of oxygen increases the reaction rate at lower temperatures and causes oxidation of amorphous carbon at 200 °C.
Although the obtained relaxation temperature values are similar, the SD fit curve rises to ~2.3 in Figure 3a, while to ~3.5 in Figure 3b. A specular behavior is registered in Figure 4, where the fit curve drops to ~0.2 in Figure 4a, while to ~0.4 in Figure 4b. The amplitude difference can be attributed to the different technique sensitivities; in particular IR and Raman techniques couple with a different system quantity, i.e., dipole moment and polarizability tensor, respectively.
In this experimental work, the investigation of thermal behavior for CNTs was evaluated by means of Fourier Transform Infrared analysis and then continued by means of two innovative approaches, i.e., SD and XWT. From both techniques, a relaxation temperature value of about T = 206 °C was obtained, corresponding to the inflection point of the curves. Such a value was obtained both for the IR and Raman data. This relaxation temperature can be linked to the same relaxation phenomenon, which generally occurs in fiber CNTs. This relaxation process is connected with decay of the mechanical properties and is due to a decrease in the alignment and compaction of the fibers. Furthermore, the value obtained coincided with the oxidation of the tubes that occurred at 200 °C. This took place because the amount of oxygen present allowed the speed rate to be increased at the lowest temperature, thus causing oxidation of the amorphous carbonate at 200 °C even though the greatest loss occurred above 420 °C.

4. Conclusions

The paper displays the findings of experimental research on CNTs performed by means of FTIR and Raman investigations. The collected FTIR and Raman spectra were analyzed by means of two innovative procedures: Spectral Distance and Wavelet Cross Correlation. The first method, i.e., the SD approach, makes reference to spectral deviation at the lowest temperature, T = 25 °C. The second method, i.e., the XWT is based on the evaluation of the similarity degree of the spectra, always taking as reference spectrum the lowest temperature, as T = 25 °C. From both these two analyses, a relaxation temperature value emerges, corresponding to the relaxation inflection point, of T = 206 °C for the IR and Raman spectra. More precisely, the two innovative methods, SD and XWT, show not only the presence of a relaxation temperature occurring in the fiber CNTs and which identifies the decay of the mechanical properties, but also the obtained value of 206 °C coincides with the oxidation of the amorphous carbonate.

Author Contributions

The authors all contributed equally: Conceptualization, Methodology, Investigation, Writing—review draft preparation and editing, M.T.C., G.M., S.M. All authors have read and agreed to the published version of the manuscript.

Funding

This research received no external funding.

Acknowledgments

M.T.C. thanks the “AIM: Attraction and International Mobility” project. (D.D. n. 407 27.02.2018—PON Ricerca e Innovazione 2014–2020, Azione I.2.).

Conflicts of Interest

The authors declare no conflict of interest.

References

  1. Kumar, S.; Nehra, M.; Kedia, D.; Dilbaghi, N.; Tankeshwar, K.; Kim, K.Y. Carbon nanotubes: A potential material for energy conversion and storage. Prog. Energy Combust. Sci. 2018, 64, 219–253. [Google Scholar] [CrossRef]
  2. Iijima, S. Helical microtubules of graphitic carbon. Nature 1991, 354, 56–58. [Google Scholar] [CrossRef]
  3. Pyatkov, F.; Futterling, V.; Khasminskaya, S.; Flavel, B.S.; Hennrich, F.; Kappes, M.M.; Krupke, R.; Pernice, W.H.P. Cavity-enhanced light emission from electrically driven carbon nanotubes. Nat. Photonics 2016, 10, 420–427. [Google Scholar] [CrossRef]
  4. Segawa, Y.; Ito, H.; Itami, K. Structurally uniform and atomically precise carbon nanostructures. Nat. Rev. Mater. 2016, 1, 15002. [Google Scholar] [CrossRef]
  5. Wen, L.; Li, F.; Cheng, H.M. Carbon nanotubes and graphene for flexible electro-chemical energy storage: From materials to devices. Adv. Mater. 2016, 28, 4306–4337. [Google Scholar] [CrossRef] [PubMed]
  6. Zeevi, G.; Shlafman, M.; Tabachnik, T.; Rogachevsky, Z.; Rechnitz, S.; Goldshtein, I.; Shlafman, S.; Gordon, N.; Alchanati, G.; Itzhak, M.; et al. Automated circuit fabrication and direct characterization of carbon nanotube vibrations. Nat. Commun. 2016, 7, 12153. [Google Scholar] [CrossRef] [Green Version]
  7. Sun, D.M.; Timmermans, M.Y.; Tian, Y.; Nasibulin, A.G.; Kauppinen, E.I.; Kishimoto, S.; Mizutani, T.; Ohno, Y. Flexible high-performance carbon nanotube integrated circuits. Nat. Nano Technol. 2011, 6, 156–161. [Google Scholar] [CrossRef]
  8. Badenhorst, H. A review of the application of carbon materials in solar thermal energy storage. Sol. Energy 2019, 192, 35–68. [Google Scholar] [CrossRef]
  9. Gogotsi, Y. Carbon Nanomaterials. In Advanced Materials and Technologies; Gogotsi, Y., Presser, V., Eds.; CRC Press: Boca Raton, FL, USA, 2006. [Google Scholar]
  10. Fang, X.; Shashurin, A.; Teel, G.; Keidar, M. Determining synthesis region of the single wall carbon nanotubes in arc plasma volume. Carbon 2016, 107, 273–280. [Google Scholar] [CrossRef] [Green Version]
  11. Yang, F.; Wang, X.; Zhang, D.; Yang, J.; Luo, D.; Xu, Z.; Peng, F.; Li, X.; Li, R.; Li, Y.; et al. Chirality-specific growth of single-walled carbon nanotubes on solid alloy catalysts. Nature 2014, 510, 522–524. [Google Scholar] [CrossRef]
  12. Lim, H.E.; Miyata, Y.; Kitaura, R.; Nishimura, Y.; Nishimoto, Y.; Irle, S.; Warner, J.H.; Kataura, H.; Shinohara, H. Growth of carbon nanotubes via twisted graphene nanoribbons. Nat. Commun. 2013, 4, 2548. [Google Scholar] [CrossRef] [PubMed]
  13. Li, X.; Cao, A.; Jung, Y.J.; Vajtai, R.; Ajayan, P.M. Bottom-up growth of carbon nanotube multilayers: Unprecedented growth. Nano Lett. 2005, 5, 1997–2000. [Google Scholar] [CrossRef] [PubMed]
  14. Li, J.; Papadopoulos, C.; Xu, J. Nanoelectronics: Growing Y-junction carbon nano-tubes. Nature 1999, 402, 253–254. [Google Scholar] [CrossRef]
  15. Tang, T.; Chen, X.; Meng, X.; Chen, H.; Ding, Y. Synthesis of multiwalled carbon nanotubes by catalytic combustion of polypropylene. Angew. Chem. Int. Ed. 2005, 44, 1517–1520. [Google Scholar] [CrossRef]
  16. Krasheninnikov, A.V.; Banhart, F. Engineering of nanostructured carbon materials with electron orion beams. Nat. Mater. 2007, 6, 723–733. [Google Scholar] [CrossRef]
  17. Seo, J.W.T.; Yoder, N.L.; Shastry, T.A.; Humes, J.J.; Johns, J.E.; Green, A.A.; Hersam, M.C. Diameter refinement of semiconducting arc discharge single-walled carbon nanotubes via density gradient ultracentrifugation. J. Phys. Chem. Lett. 2013, 4, 2805–2810. [Google Scholar] [CrossRef]
  18. Araromi, O.A.; Rosset, S.; Shea, H.R. High-resolution, large-area fabrication of compliant electrodes via laser ablation for robust, stretchable dielectric elastomer actuators and sensors. Appl. Mater. Interfaces 2015, 7, 18046–18053. [Google Scholar] [CrossRef]
  19. Huang, L.; Cui, X.; White, B.; O’Brien, S.P. Long and oriented single-walled carbon nanotubes grown by ethanol chemical vapor deposition. J. Phys. Chem. B 2004, 108, 16451–16456. [Google Scholar] [CrossRef]
  20. Bhanjana, G.; Dilbaghi, N.; Kim, K.H.; Kumar, S. Carbon nanotubes as sorbent material for removal of cadmium. J. Mol. Liq. 2017, 242, 966–970. [Google Scholar] [CrossRef]
  21. Chen, Y.; Zhang, J. Chemical vapor deposition growth of single-walled carbon nanotubes with controlled structures for nano device applications. Acc. Chem. Res. 2014, 47, 2273–2281. [Google Scholar] [CrossRef]
  22. Seah, C.M.; Chai, S.P.; Mohamed, A.R. Synthesis of aligned carbon nanotubes. Carbon 2011, 49, 4613–4635. [Google Scholar] [CrossRef]
  23. Yang, R.X.; Chuang, K.H.; Wey, M.Y. Carbon nanotube and hydrogen production from waste plastic gasification over Ni/Al-SBA-15 catalysts: Effect of aluminum content. RSC Adv. 2016, 6, 40731–40740. [Google Scholar] [CrossRef]
  24. Kumar, R.; Singh, R.K.; Singh, D.P. Natural and waste hydrocarbon precursors for the synthesis of carbon-based nanomaterials: Graphene and CNTs. Renew. Sustain. Energy Rev. 2016, 58, 976–1006. [Google Scholar] [CrossRef]
  25. Yu, M.F.; Lourie, O.; Dyer, M.J.; Moloni, K.; Kelly, T.F.; Ruoff, R.S. Strength and breaking mechanism of multiwalled carbon nanotubes under tensile load. Science 2000, 287, 637–640. [Google Scholar] [CrossRef] [Green Version]
  26. Demczyk, B.G.; Wang, Y.M.; Cumings, J.; Hetman, M.; Han, W.; Zettl, A.; Ritchie, R.O. Direct mechanical measurement of the tensile strength and elastic modulus of multi-walled carbon nanotubes. Mater. Sci. Eng. A 2002, 334, 173–178. [Google Scholar] [CrossRef]
  27. Laurent, C.; Flahaut, E.; Peigney, A. The weight and density of carbon nanotubes versus the number of walls and diameter. Carbon 2010, 48, 2994–2996. [Google Scholar] [CrossRef] [Green Version]
  28. Arnold, M.S.; Green, A.A.; Hulvat, J.F.; Stupp, S.I.; Hersam, M.C. Sorting carbon nanotubes by electronic structure using density differentiation. Nat. Nanotechnol. 2006, 1, 60–65. [Google Scholar] [CrossRef]
  29. Devi, R.; Sood, J.; Srivastava, S.; Tankeshwar, K. Diffusion of fluid confined to nanotube with rectangular cross section. Microfluid Nanofluid 2010, 9, 737–742. [Google Scholar] [CrossRef]
  30. Aggarwal, N.; Sood, J.; Tankeshwar, K. Anisotropic diffusion of a fluid confined to different geometries at the nanoscale. Nanotechnology 2007, 18, 335707. [Google Scholar] [CrossRef]
  31. Gogotsi, Y. How safe are nanotubes and other nanofilaments? Mater. Res. Innov. 2003, 7, 192–194. [Google Scholar] [CrossRef]
  32. Jensen, B.D.; Wise, K.E.; Odegard, G.M. Simulation of the elastic and ultimate tensile properties of diamond, graphene, carbon nanotubes, and amorphous carbon using a revised ReaxFF parametrization. J. Phys. Chem. A 2015, 119, 9710–9721. [Google Scholar] [CrossRef] [PubMed]
  33. Muhulet, A.; Miculescu, F.; Voicu, S.I.; Schütt, F.; Thakur, V.K.; Mishra, Y.K. Fundamentals and scopes of doped carbon nanotubes towards energy and biosensing applications. Mater. Today Energy 2018, 9, 154–186. [Google Scholar] [CrossRef]
  34. Yu, W.; Wang, V.; Qi, Y.; Chen, L.; Wang, L.; Xie, H. The influence of nitrogen doping on thermal conductivity of carbon nanotubes. Thermochim. Acta 2015, 617, 163–168. [Google Scholar] [CrossRef]
  35. Shao, X.; Li, D.; Cai, J.; Luo, H.; Dong, C. First-principles study of structural and work function properties for nitrogen-doped single-walled carbon nanotubes. Appl. Surf. Sci. 2016, 368, 477–482. [Google Scholar] [CrossRef]
  36. Lee, R.S.; Kim, H.J.; Fischer, J.E.; Thess, A.; Smalley, R.E. Conductivity enhancement in single-walled carbon nanotube bundles doped with K and Br. Nature 1997, 388, 255–257. [Google Scholar] [CrossRef]
  37. Shao, C.; Xia, J.; Zhang, J.; Shao, Q. Effects of B-N co-doping into the ultra-small diameter zigzag single-walled carbon nanotubes: A density functional theory study. Phys. E Low Dimens. Syst. Nanostruct. 2014, 59, 88–92. [Google Scholar] [CrossRef]
  38. Rezania, H. The effects of boron doping on the optical absorption of carbon nanotubes. Opt. Int. J. Light Electron. Opt. 2015, 126, 1918–1922. [Google Scholar] [CrossRef]
  39. Xie, K.; Yang, F.; Ebbinghaus, P.; Erbe, A.; Muhler, M.; Xia, W. A reevaluation of the correlation between the synthesis parameters and structure and properties of nitrogen-doped carbon nanotubes. J. Energy Chem. 2015, 24, 407–415. [Google Scholar] [CrossRef]
  40. Korusenko, P.M.; Bolotov, V.V.; Nesov, S.N.; Povoroznyuk, S.N.; Khailov, I.P. Changes of the electronic structure of the atoms of nitrogen in nitrogen-doped multiwalled carbon nanotubes under the influence of pulsed ion radiation. Nucl. Instrum. Methods Phys. Res. Sect. B Beam Interact. Mater. Atoms 2015, 358, 131–135. [Google Scholar] [CrossRef]
  41. Kumar, R.; Singh, R.K.; Tiwari, R.S. Growth analysis and high-yield synthesis of aligned-stacked branched nitrogen-doped carbon nanotubes using sesame oil as a natural botanical hydrocarbon precursor. Mater. Des. 2016, 94, 166–175. [Google Scholar] [CrossRef]
  42. Tyagi, B.; Chudasama, C.D.; Jasra, R.V. Determination of structural modification in acid activated montmorillonite clay by FT-IR spectroscopy. Spectrochim. Acta A 2006, 64, 273–278. [Google Scholar] [CrossRef] [PubMed]
  43. Her, S.C.; Lai, C.Y. Dynamic Behavior of Nanocomposites Reinforced with Multi-Walled Carbon Nanotubes (MWCNTs). Materials 2013, 6, 2274–2284. [Google Scholar] [CrossRef] [PubMed] [Green Version]
  44. Caccamo, M.T.; Cannuli, A. PEG acoustic levitation treatment for historic wood preservation investigated by means of FTIR spectroscopy and wavelets. Curr. Chem. Biol. 2019, 13, 60–72. [Google Scholar] [CrossRef]
  45. Ghann, W.; Kang, H.; Rahman, A.K.; Rahman, A.; Ali, M.M.; Uddin, J. Terahertz Reflectometry Imaging of Carbon Nanomaterials for Biological Application. J. Nanomed. Nanotechnol. 2019, 10, 535. [Google Scholar] [CrossRef] [PubMed]
  46. Magazù, S.; Calabrò, E.; Caccamo, M.T. Experimental study of thermal restraint in bio-protectant disaccharides by FTIR spectroscopy. Open Biotechnol. 2018, 12, 123–133. [Google Scholar] [CrossRef]
  47. Abbasian, M.; Fathi, S.Y. A convenient method for preparation of polystyrene-single-walled carbon nanotubes by metal-catalyzed living radical polymerization method. J. Polym. Eng. 2013, 33, 463–469. [Google Scholar] [CrossRef]
  48. Caccamo, M.T.; Zammuto, V.; Gugliandolo, C.; Madeleine-Perdrillat, C.; Spanò, A.; Magazù, S. Thermal restraint of a bacterial exopolysaccharide of shallow vent origin. Int. J. Biol. Macromol. 2018, 114, 649–655. [Google Scholar] [CrossRef]
  49. Caccamo, M.T.; Lombardo, D.; Magazù, S. Spectral distance numerical approach for thermal behaviour characterization of albumen-based painting components. AAPP Atti della Accademia Peloritana dei Pericolanti Classe di Scienze Fisiche Matematiche e Naturali 2019, 97, A30. [Google Scholar]
  50. Banfi, F.; Ferrini, G. Wavelet cross-correlation and phase analysis of a free cantilever subjected to band excitation. Beilstein J. Nanotechnol. 2012, 3, 294–300. [Google Scholar] [CrossRef]
  51. Mizuno-Matsumoto, Y.; Ukai, S.; Ishii, R.; Date, S.; Kaishima, T.; Shinosaki, K.; Shimojo, S.; Takeda, M.; Tamura, A.; Inouye, T. Wavelet-Crosscorrelation Analysis: Non-Stationary Analysis of Neurophysiological Signals. Brain Topogr. 2005, 17, 237–252. [Google Scholar] [CrossRef]
  52. Caccamo, M.T.; Magazù, S. Tagging the oligomer-to-polymer crossover on EG and PEGs by infrared and Raman spectroscopies and by wavelet cross-correlation spectral analysis. Vib. Spectrosc. 2016, 85, 222–227. [Google Scholar] [CrossRef]
  53. Migliardo, F.; Magazù, S.; Caccamo, M.T. Infrared, Raman and INS Studies of Poly-Ethylene Oxide Oligomers. J. Mol. Struct. 2013, 1048, 261–266. [Google Scholar] [CrossRef]
  54. Strangman, G.; Boas, D.A.; Sutton, J.P. Non-invasive neuroimaging using near-infrared light. Biol. Psych. 2002, 52, 679–693. [Google Scholar] [CrossRef]
  55. Villringer, A.; Chance, B. Non-invasive optical spectroscopy and imaging of human brain function. Trends Neurosci. 1997, 20, 435–442. [Google Scholar] [CrossRef]
  56. Doménech Carbó, M.T.; Bosch Reig, F.; Gimeno Adelantado, J.V.; Periz Martínez, V. Fourier transform infrared spectroscopy and the analytical study of works of art for purposes of diagnosis and conservation. Anal. Chim. Acta 1996, 330, 207–215. [Google Scholar] [CrossRef]
  57. Rohman, A.; Che Man, Y.B. Analysis of cod-liver oil adulteration using Fourier transform infrared (FTIR) spectroscopy. J. Am. Oil Chem. Soc. 2009, 86, 1149–1153. [Google Scholar] [CrossRef]
  58. Coates, J. Interpretation of infrared spectra, a practical approach. Encycl. Anal. Chem. 2006, 10815–10837. [Google Scholar]
  59. Deepa, M.; Sharma, N.; Agnihotory, S.A.; Chandra, R. FTIR investigation on ion-ion interaction in liquid and gel polymeric electrolytes-LiCF3SO3-PC-PMMA. J. Mater. Sci. 2001, 37, 1759–1765. [Google Scholar] [CrossRef]
  60. Suthanthiraraj, S.A.; Kumar, R.J.; Paul, B. Vibrational spectroscopic and electrochemical characteristics of Poly (Propylene Glycol)-silver triflate polymerelectrolyte system. Ionics 2009, 16, 145–151. [Google Scholar] [CrossRef]
  61. Winie, T.; Arof, A.K. FT-IR studies on interactions among components in hexanoyl chitosan-based polymer electrolytes. Spectrochim. Acta A 2006, 63, 677–684. [Google Scholar] [CrossRef]
  62. Duval, M.; Gross, E. Degradation of poly (ethylene oxide) in aqueous solutions by ultrasonic waves. Macromolecules 2013, 46, 4972–4977. [Google Scholar] [CrossRef]
  63. Magazù, S. NMR, static and dynamic light and neutron scattering investigations on polymeric aqueous solutions. J. Mol. Struct. 2000, 523, 47–59. [Google Scholar] [CrossRef]
  64. Polik, W.F.; Burchard, W. Static light scattering from aqueous poly (ethylene oxide) solutions in the temperature range 20–90 °C. Macromolecules 1983, 16, 978–982. [Google Scholar] [CrossRef]
  65. Iguchi, C.Y.; dos Santos, W.N.; Gregorio, R., Jr. Determination of thermal properties of pyroelectric polymers, copolymers and blends by the laser flash technique. Polym. Test. 2007, 26, 788–792. [Google Scholar] [CrossRef]
  66. Magazù, S.; Migliardo, F.; Benedetto, A. Elastic Incoherent Neutron Scattering Operating by Varying Instrumental Energy Resolution: Principle, Simulations and Experiments of the Resolution Elastic Neutron Scattering (RENS). Rev. Sci. Instrum. 2011, 82, 105115. [Google Scholar] [CrossRef]
  67. Migliardo, F.; Caccamo, M.T.; Magazù, S. Elastic Incoherent Neutron Scatterings Wavevector and Thermal Analysis on Glass-forming Homologous Disaccharides. J. NonCryst. Solids 2013, 378, 144–151. [Google Scholar] [CrossRef]
  68. Cannuli, A.; Caccamo, M.T.; Castorina, G.; Colombo, F.; Magazù, S. Laser Techniques on Acoustically Levitated Droplets. EPJ Web Conf. 2018, 167, 05010. [Google Scholar] [CrossRef] [Green Version]
  69. Magazù, S.; Migliardo, F.; Benedetto, A.; Calabrò, E.; La Torre, R.; Caccamo, M.T. “Bioprotective Effects of Sucrose and Trehalose on Proteins” in “Sucrose Properties, Biosynthesis and Health Implications”. In Food Science and Technology; Nova Science Publishers, Inc.: Hauppauge, NY, USA, 2013; ISBN 978-162417984-6. [Google Scholar]
  70. Lacerda, G.B.; Junior, G.A.; Miranda Rocco, M.L.; Lavall, R.L.; Matencio, T.; Rezende Calado, H.D. Development of a new hybrid CNT-TEPA@poly (3,4-ethylenedioxythiophene-co-3-(pyrrol-1-methyl) pyridine) for application as electrode active material in supercapacitors. Polymer 2020, 194, 122368. [Google Scholar] [CrossRef]
  71. Caccamo, M.T.; Gugliandolo, C.; Zammuto, V.; Magazù, S. Thermal properties of an exopolysaccharide produced by a marine thermotolerant Bacillus licheniformis by ATR-FTIR spectroscopy. Int. J. Biol. Macromol. 2020, 145, 77–83. [Google Scholar] [CrossRef]
  72. Caccamo, M.T.; Magazù, S. Thermal restraint on PEG-EG mixtures by FTIR investigations and wavelet cross-correlation analysis. Polym. Test. 2017, 62, 311–318. [Google Scholar] [CrossRef]
  73. Grinsted, A.; Moore, J.C.; Jeverejeva, S. Application of the cross wavelet transform and wavelet coherence to geophysical time series. Nonlinear Process. Geophys. 2004, 11, 561–566. [Google Scholar] [CrossRef]
  74. Naresh, G.J.; Deepak, W.P. Investigation on Selection of Optimal Mother Wavelet in Mode Shape based Damage Detection Exercise. Proc. Eng. 2017, 181, 531–537. [Google Scholar]
  75. Caccamo, M.T.; Cannuli, A.; Magazù, S. Wavelet analysis of near-resonant series RLC circuit with time-dependent forcing frequency. Eur. J. Phys. 2018, 39, 4. [Google Scholar] [CrossRef]
  76. Torrence, C.; Compo, G.P. A Practical Guide to Wavelet Analysis. Bull. Am. Meteorol. Soc. 1998, 79, 61–67. [Google Scholar] [CrossRef] [Green Version]
  77. Caccamo, M.T.; Magazù, S. Multiscaling Wavelet Analysis of Infrared and Raman Data on Polyethylene Glycol 1000 Aqueous Solutions. Spectrosc. Lett. 2017, 50, 130–136. [Google Scholar] [CrossRef]
  78. Sobecki, P.; Białasiewicz, J. Cross-correlation of bio-signals using continuous wavelet transform and genetic algorithm. J. Neurosci. Methods 2015, 247, 13–22. [Google Scholar]
  79. Dhand, V.; Hong, S.K.; Li, L.; Kim, J.M.; Kim, S.H.; Rhee, K.Y.; Lee, H.W. Fabrication of robust, ultrathin and light weight, hydrophilic, PVDF-CNT membrane composite for salt rejection. Compos. Part B 2019, 160, 632–643. [Google Scholar] [CrossRef]
  80. Zhang, H.; Zhang, J. The preparation of novel polyvinyl alcohol (PVA)-based nanoparticle/carbon nanotubes (PNP/CNTs) aerogel for solvents adsorption application. J. Colloid Interface Sci. 2020, 569, 254–266. [Google Scholar] [CrossRef]
  81. Ferreira, F.V.; Wesley, F.; Menezes, B.R.C.; Brito, F.S.; Coutinho, A.S.; Cividanes, L.S.; Coutinho, A.R.; Thim, G.P. Correlation of surface treatment, dispersion and mechanical properties of HDPE/CNT nanocomposites. Appl. Surf. Sci. 2016, 389, 921–929. [Google Scholar] [CrossRef]
  82. Elashmawi, I.S.; Gaabour, L.H. Raman, morphology and electrical behavior of nanocomposites based on PEO/PVDF with multi-walled carbon nanotubes. Results Phys. 2015, 5, 105–110. [Google Scholar] [CrossRef] [Green Version]
  83. Khoshnevis, H.; Tran, T.Q.; Mint, S.M.; Zadhoush, A.; Duong, H.M.; Youssefi, M. Effect of alignment and packing density on the stress relaxation process of carbon nanotube fibers spun from floating catalyst chemical vapor deposition method. Colloids Surf. A 2018, 558, 570–578. [Google Scholar] [CrossRef]
Figure 1. A comparison between the IR spectrum of CNTs at T = 25 °C and at T = 450 °C.
Applsci 10 08159 g001
Figure 2. A comparison between the Raman spectrum of CNTs at T = 25 °C and at T = 450 °C.
Applsci 10 08159 g002
Figure 3. (a) Spectral Distance (SD) behavior with respect to temperature for CNTs, for the recorded IR spectra, together with the fit of the model (brown line); (b) Spectral Distance behavior with respect to temperature for CNTs, for the recorded IR spectra, together with the fit of the model (brown line) in the temperature range from 25 °C to 450 °C.
Applsci 10 08159 g003
Figure 4. (a) Wavelet cross correlation (XWT) versus temperature for CNTs, for the recorded Raman spectra, together with the fit of the model (blue line) in the temperature interval (25–450 °C); (b) XWT versus temperature for CNTs, for the recorded Raman spectra, together with the fit of the model (blue line) in the temperature interval (25–450 °C).
Applsci 10 08159 g004
Table 1. Properties of carbon nanotubes (CNTs).
PropertyExperimental MeasurementsComputational Calculations
Tensile Strength [GPa]150300
Young’s Modulus [TPa]2.8–3.61.5–5
Electrical Conductivity [S/m]6.6 × 1031 × 107
Thermal Conductivity [W/mK]350080–9500
Thermal Stability in air [°C]420750
Charge Mobility [cm2/V∙s]1 × 1031.2 × 105
Surface Area [m2/g]619.150–1315
Publisher’s Note: MDPI stays neutral with regard to jurisdictional claims in published maps and institutional affiliations.

