Fluidization Dynamics of Hydrophobic Nanosilica with Velocity Step Changes


Abstract
:1. Introduction
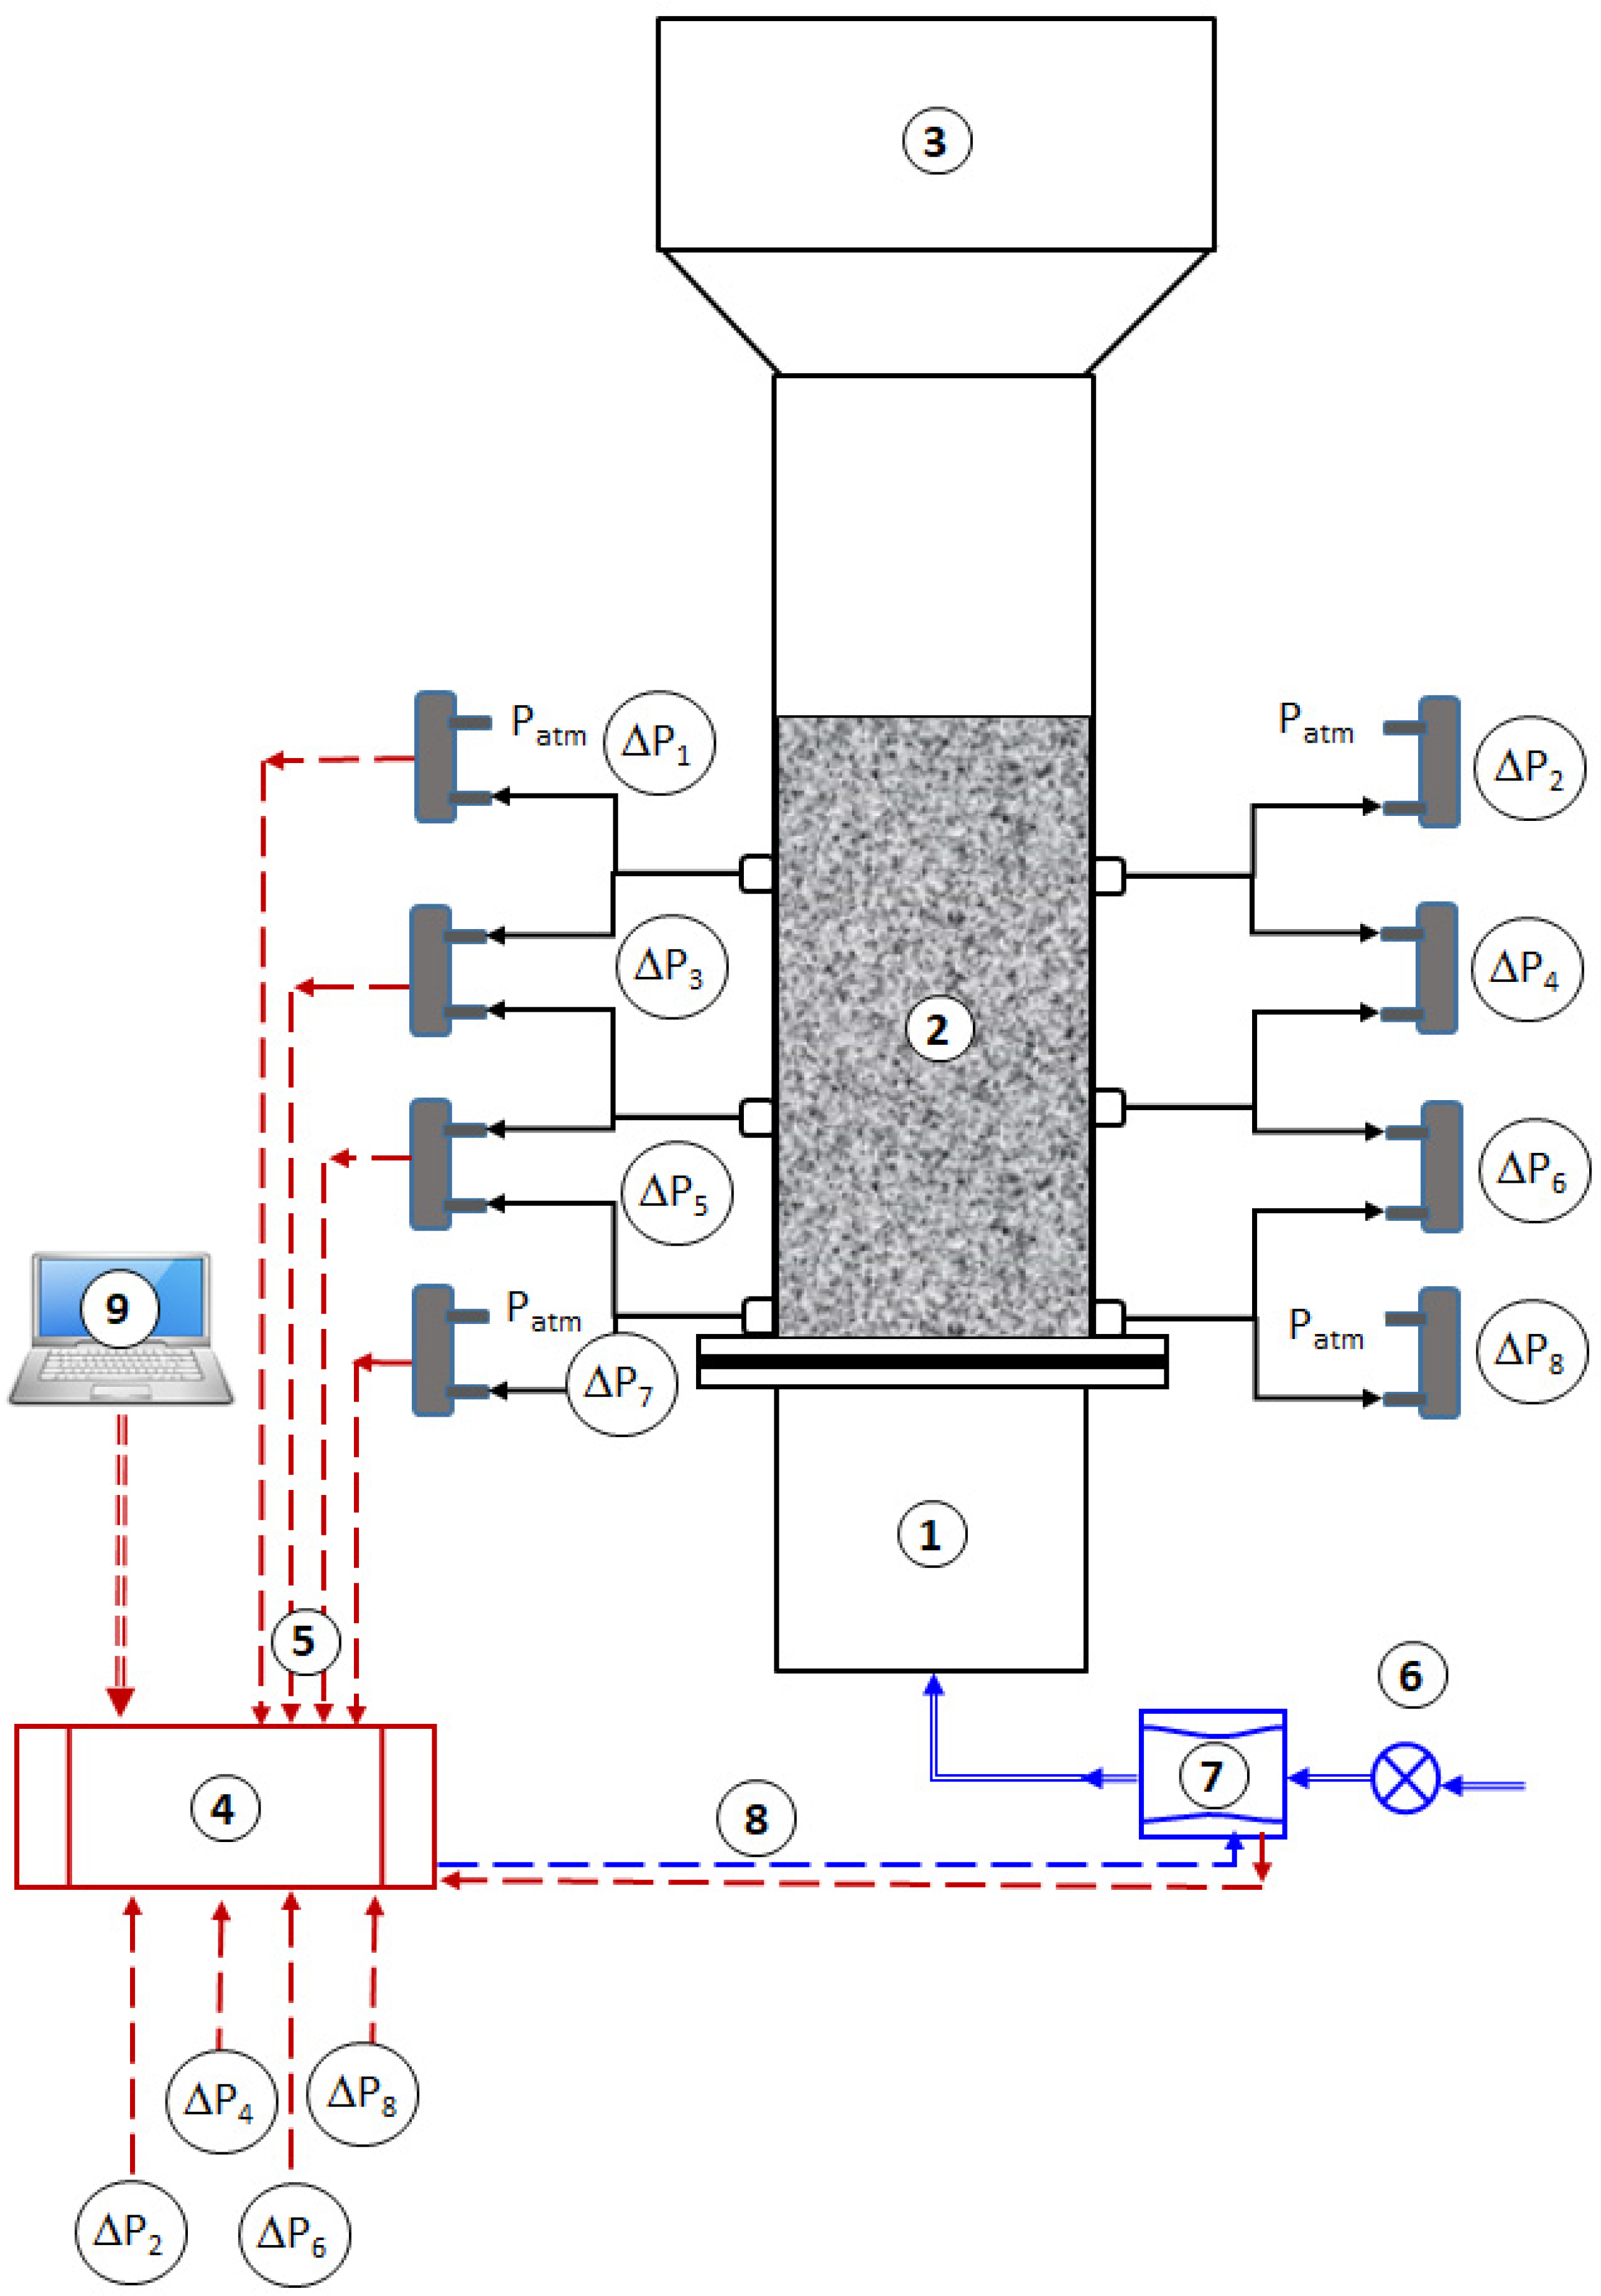
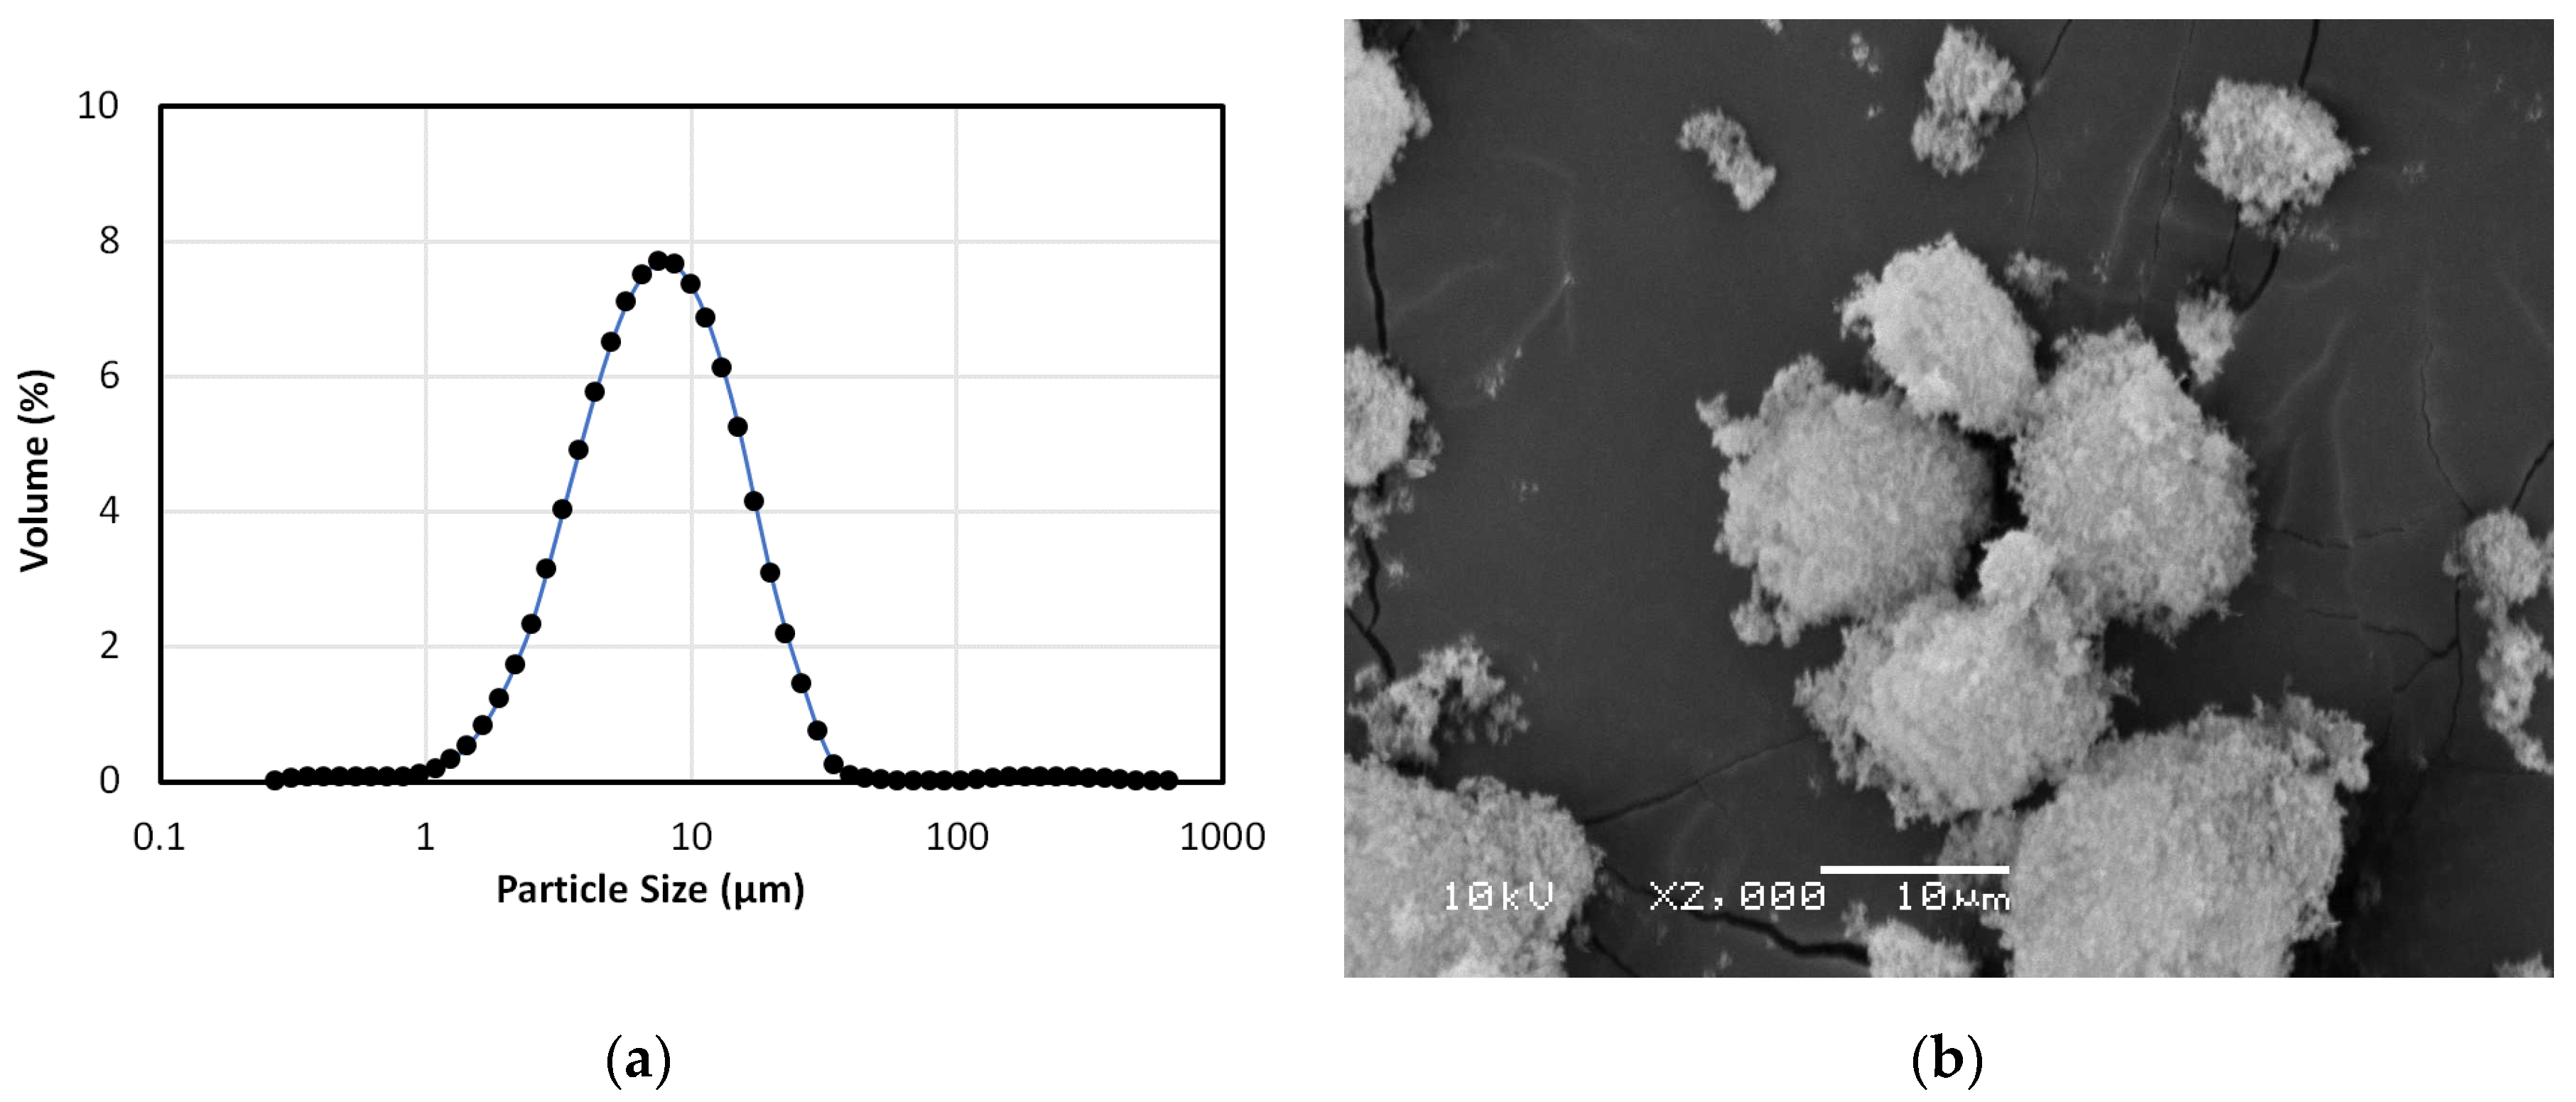
2. Experimental
3. Results and Discussion
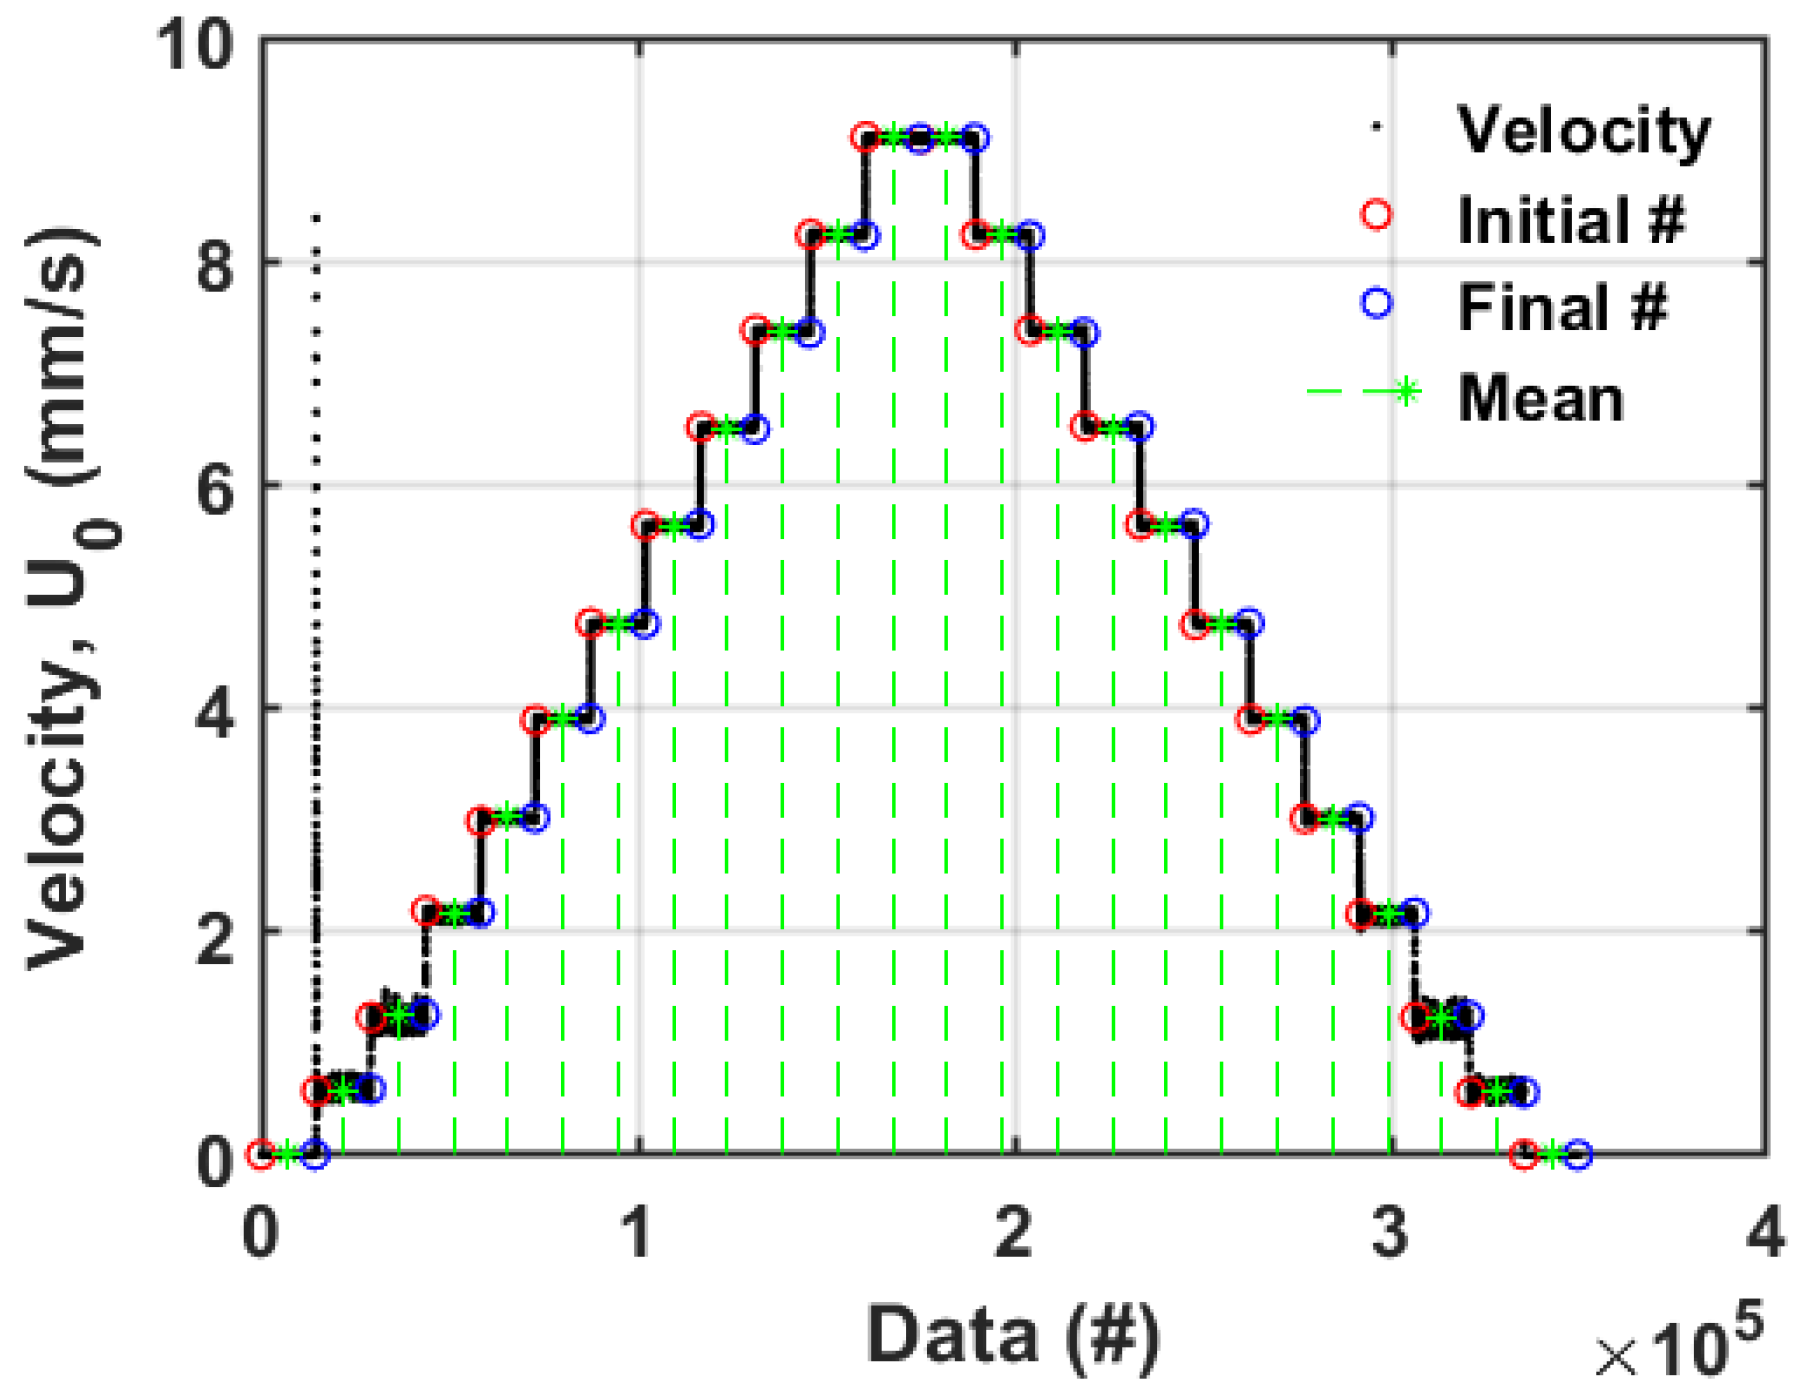
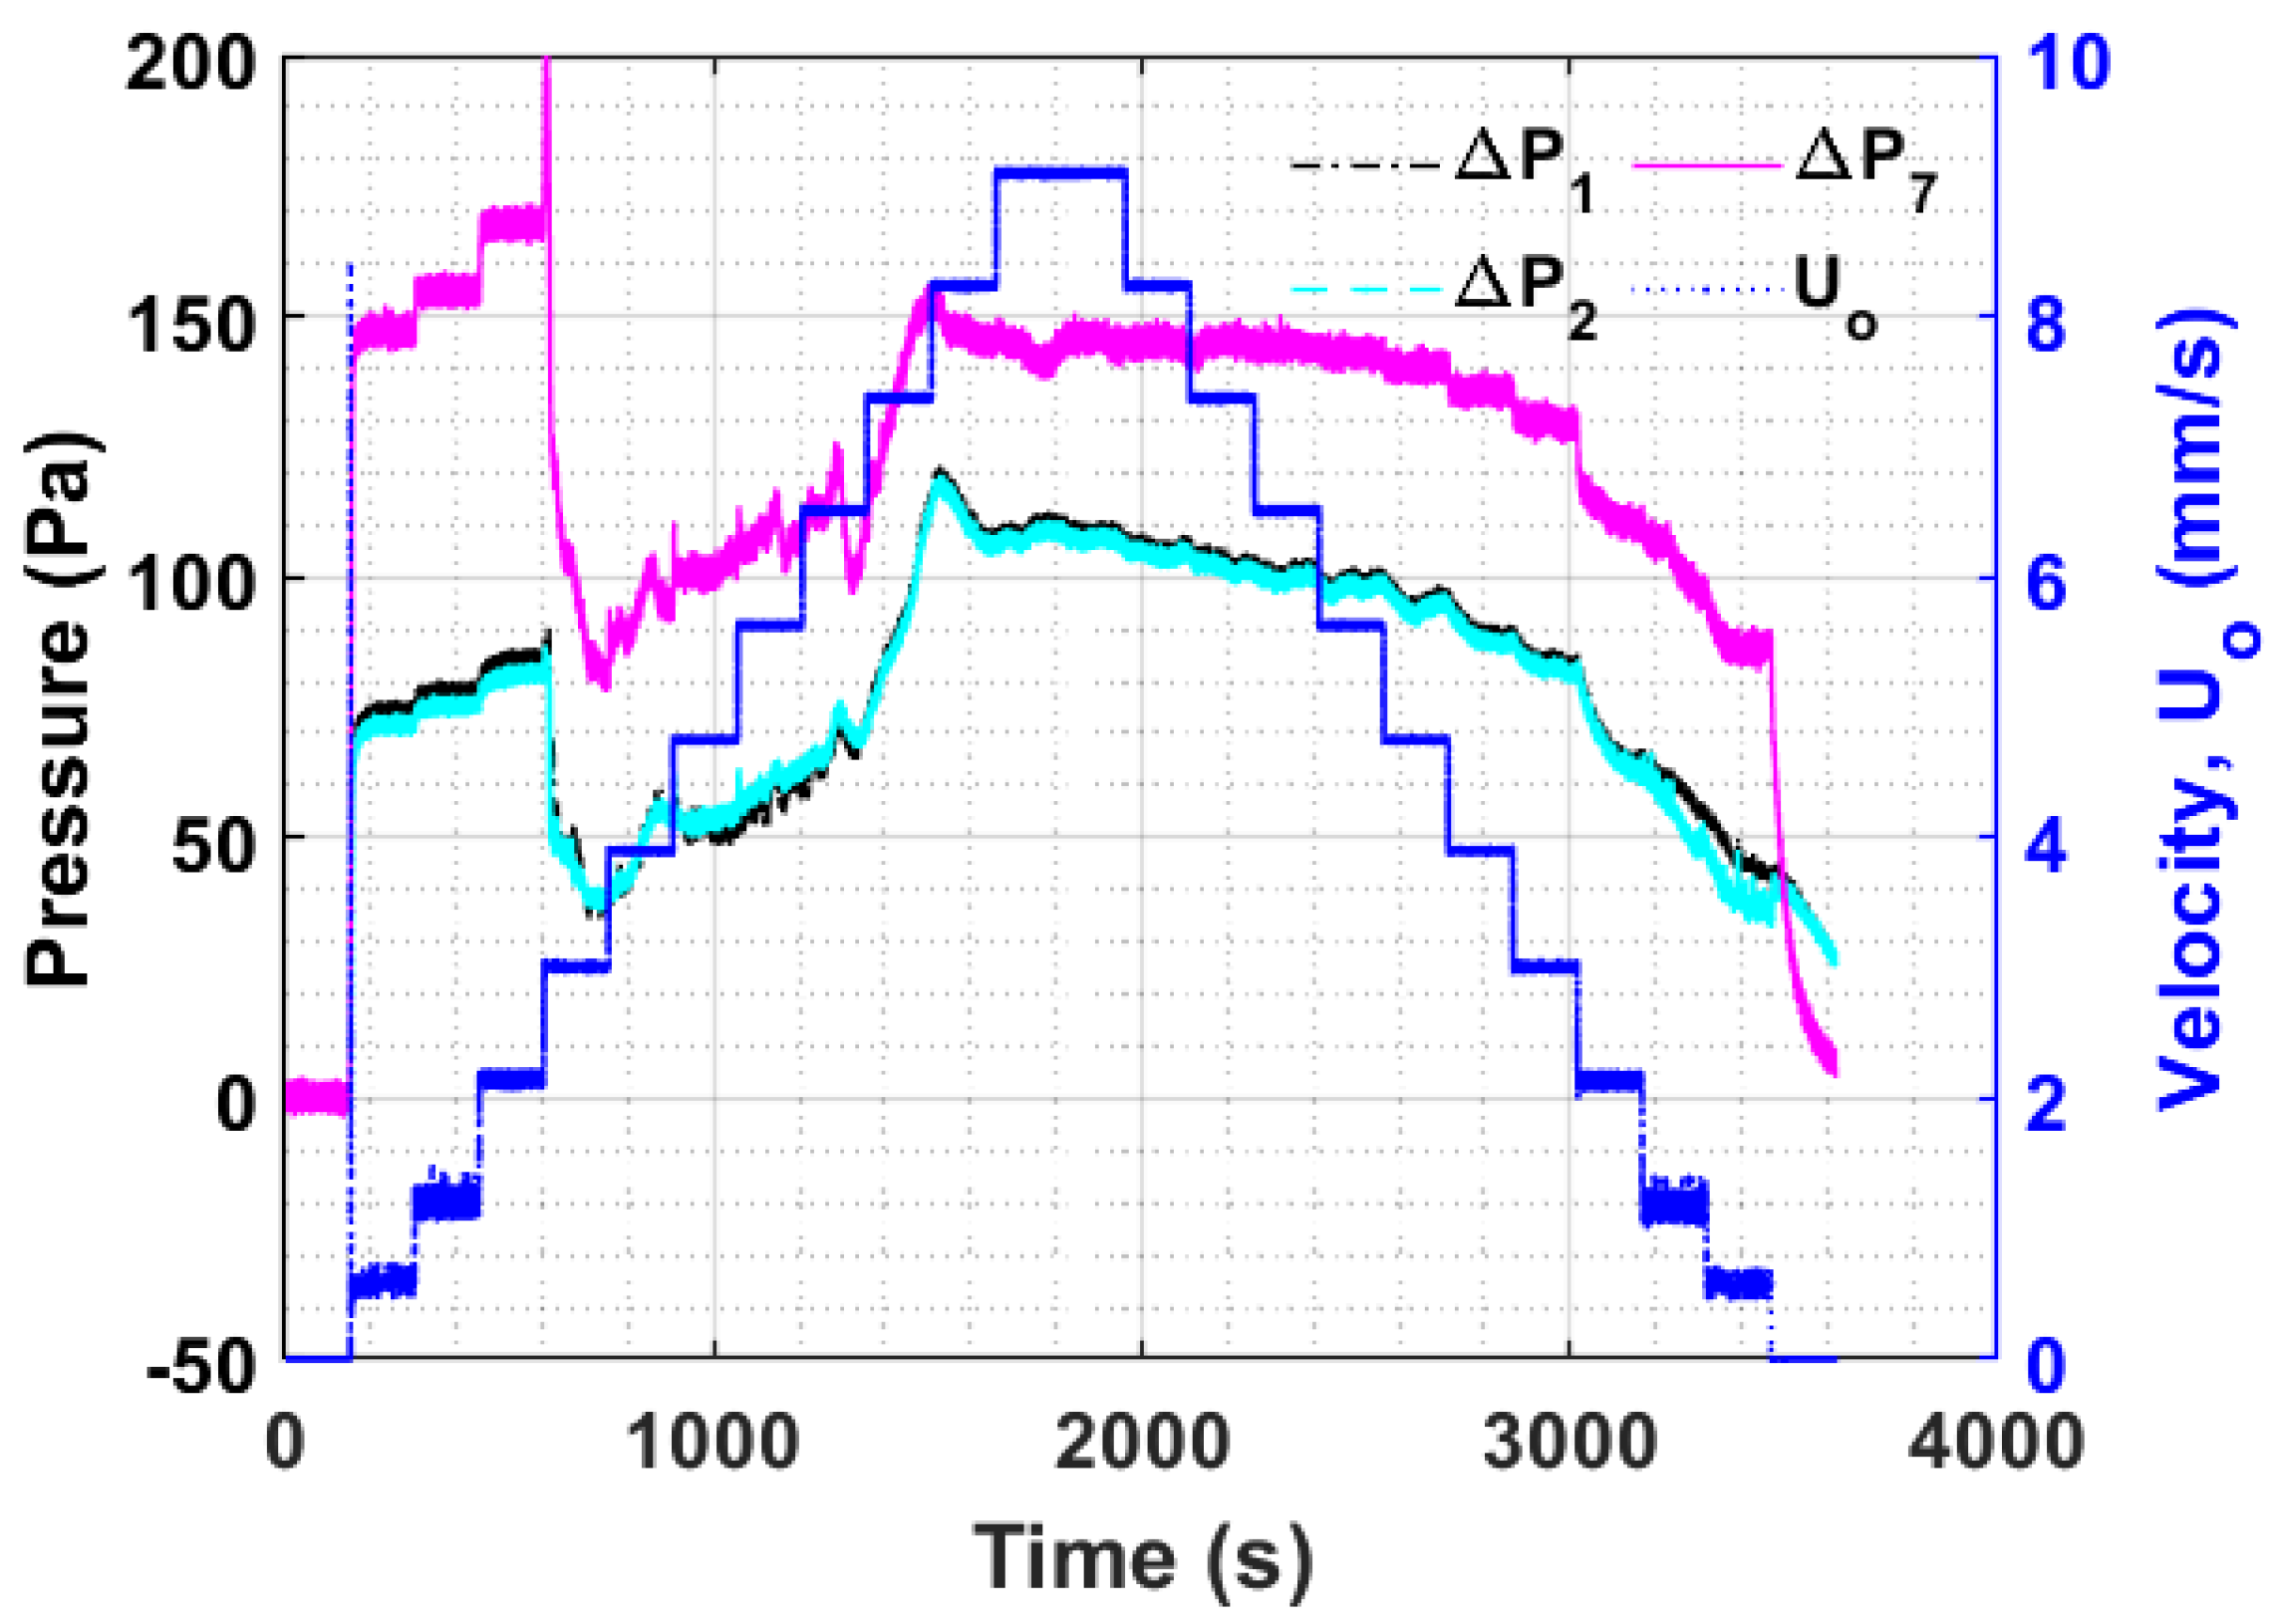
3.1. Overall Bed Transients
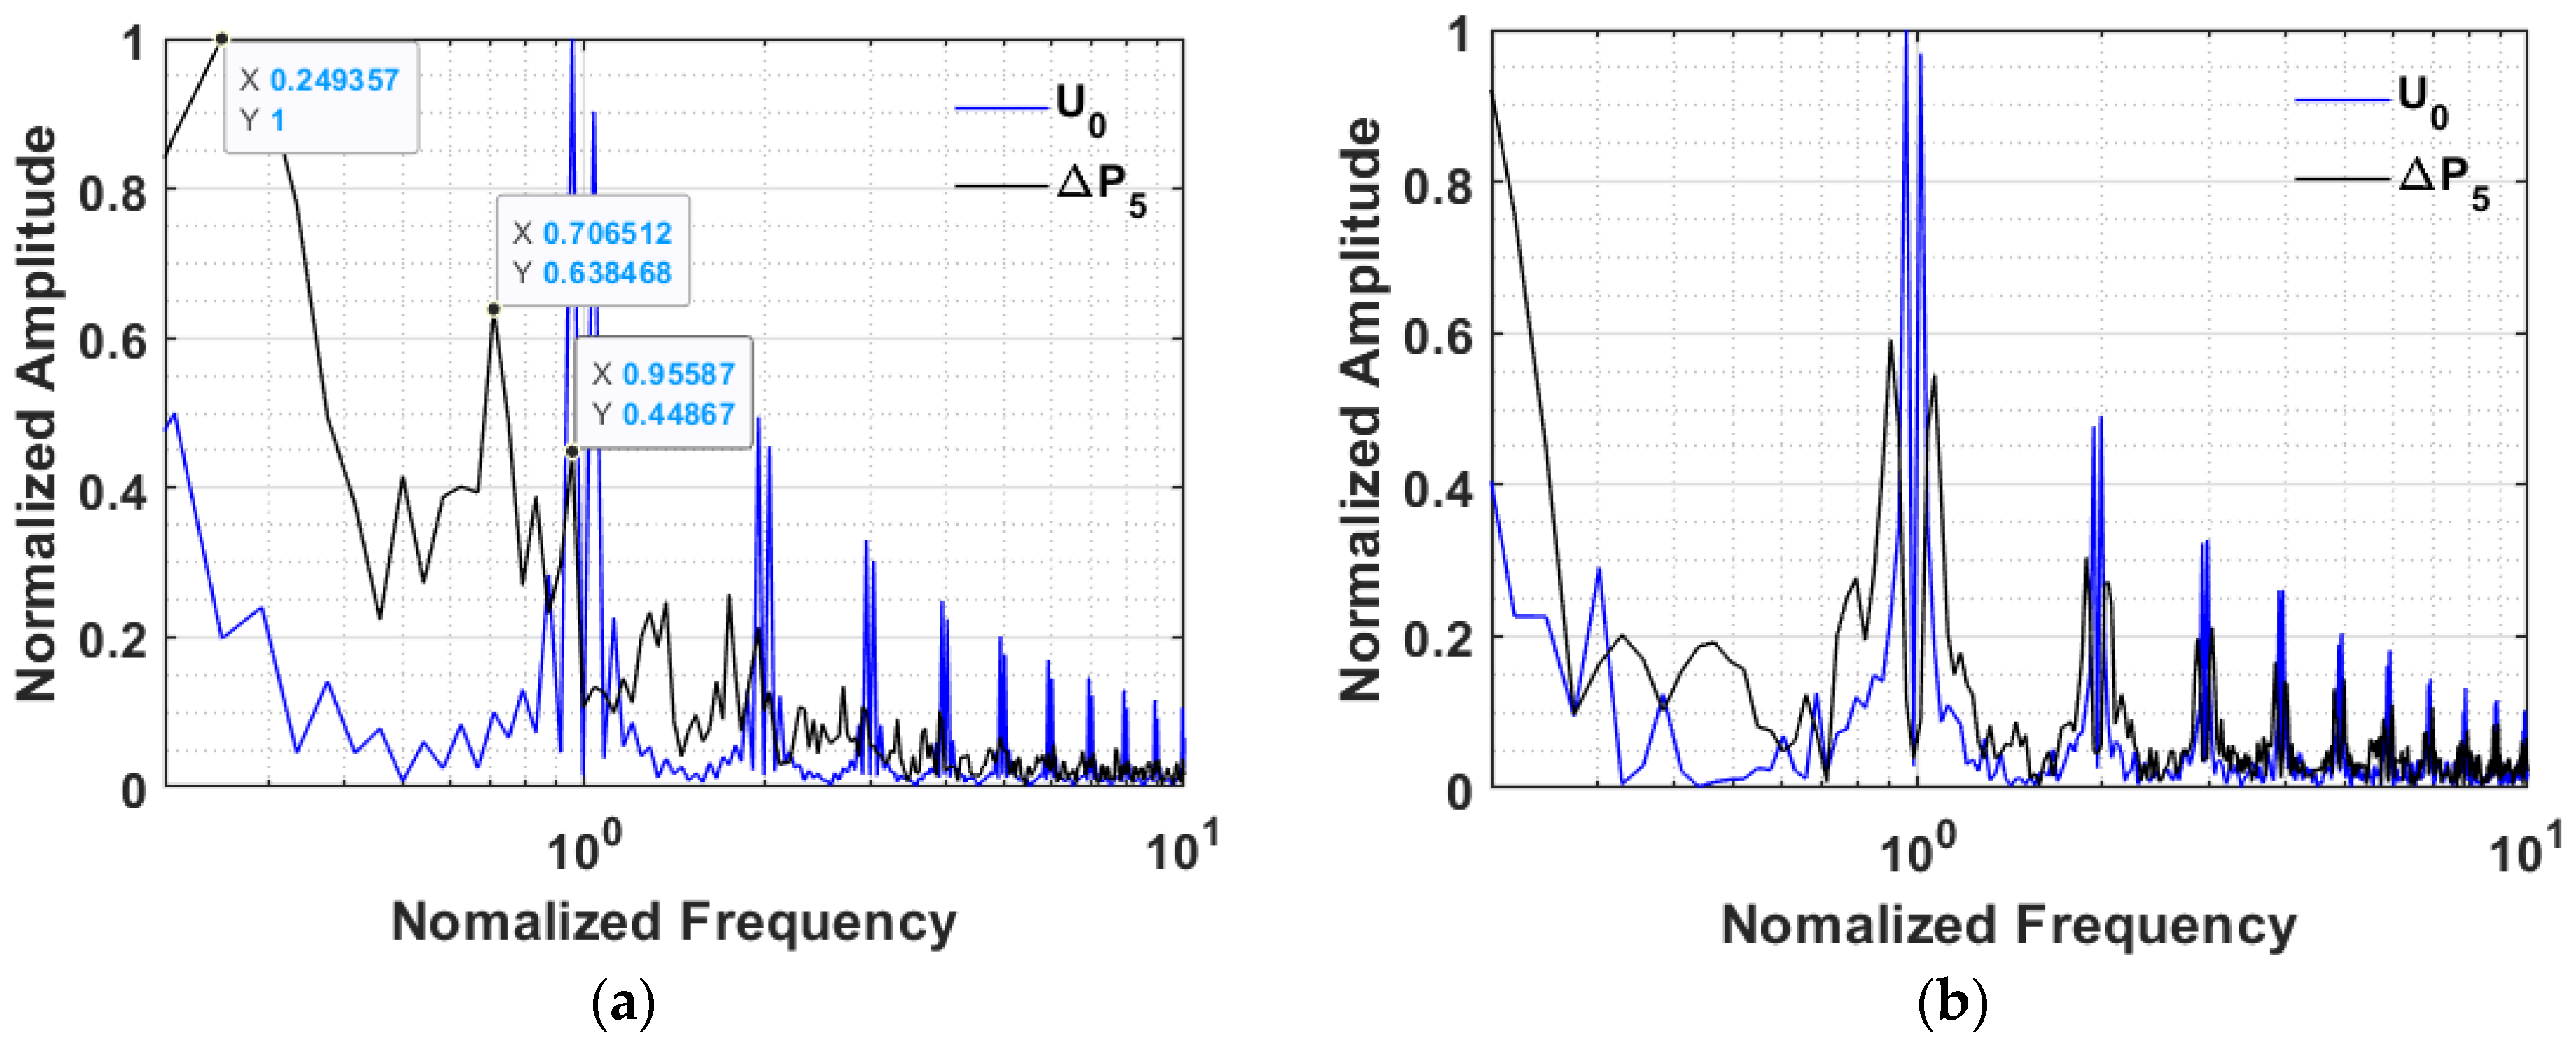
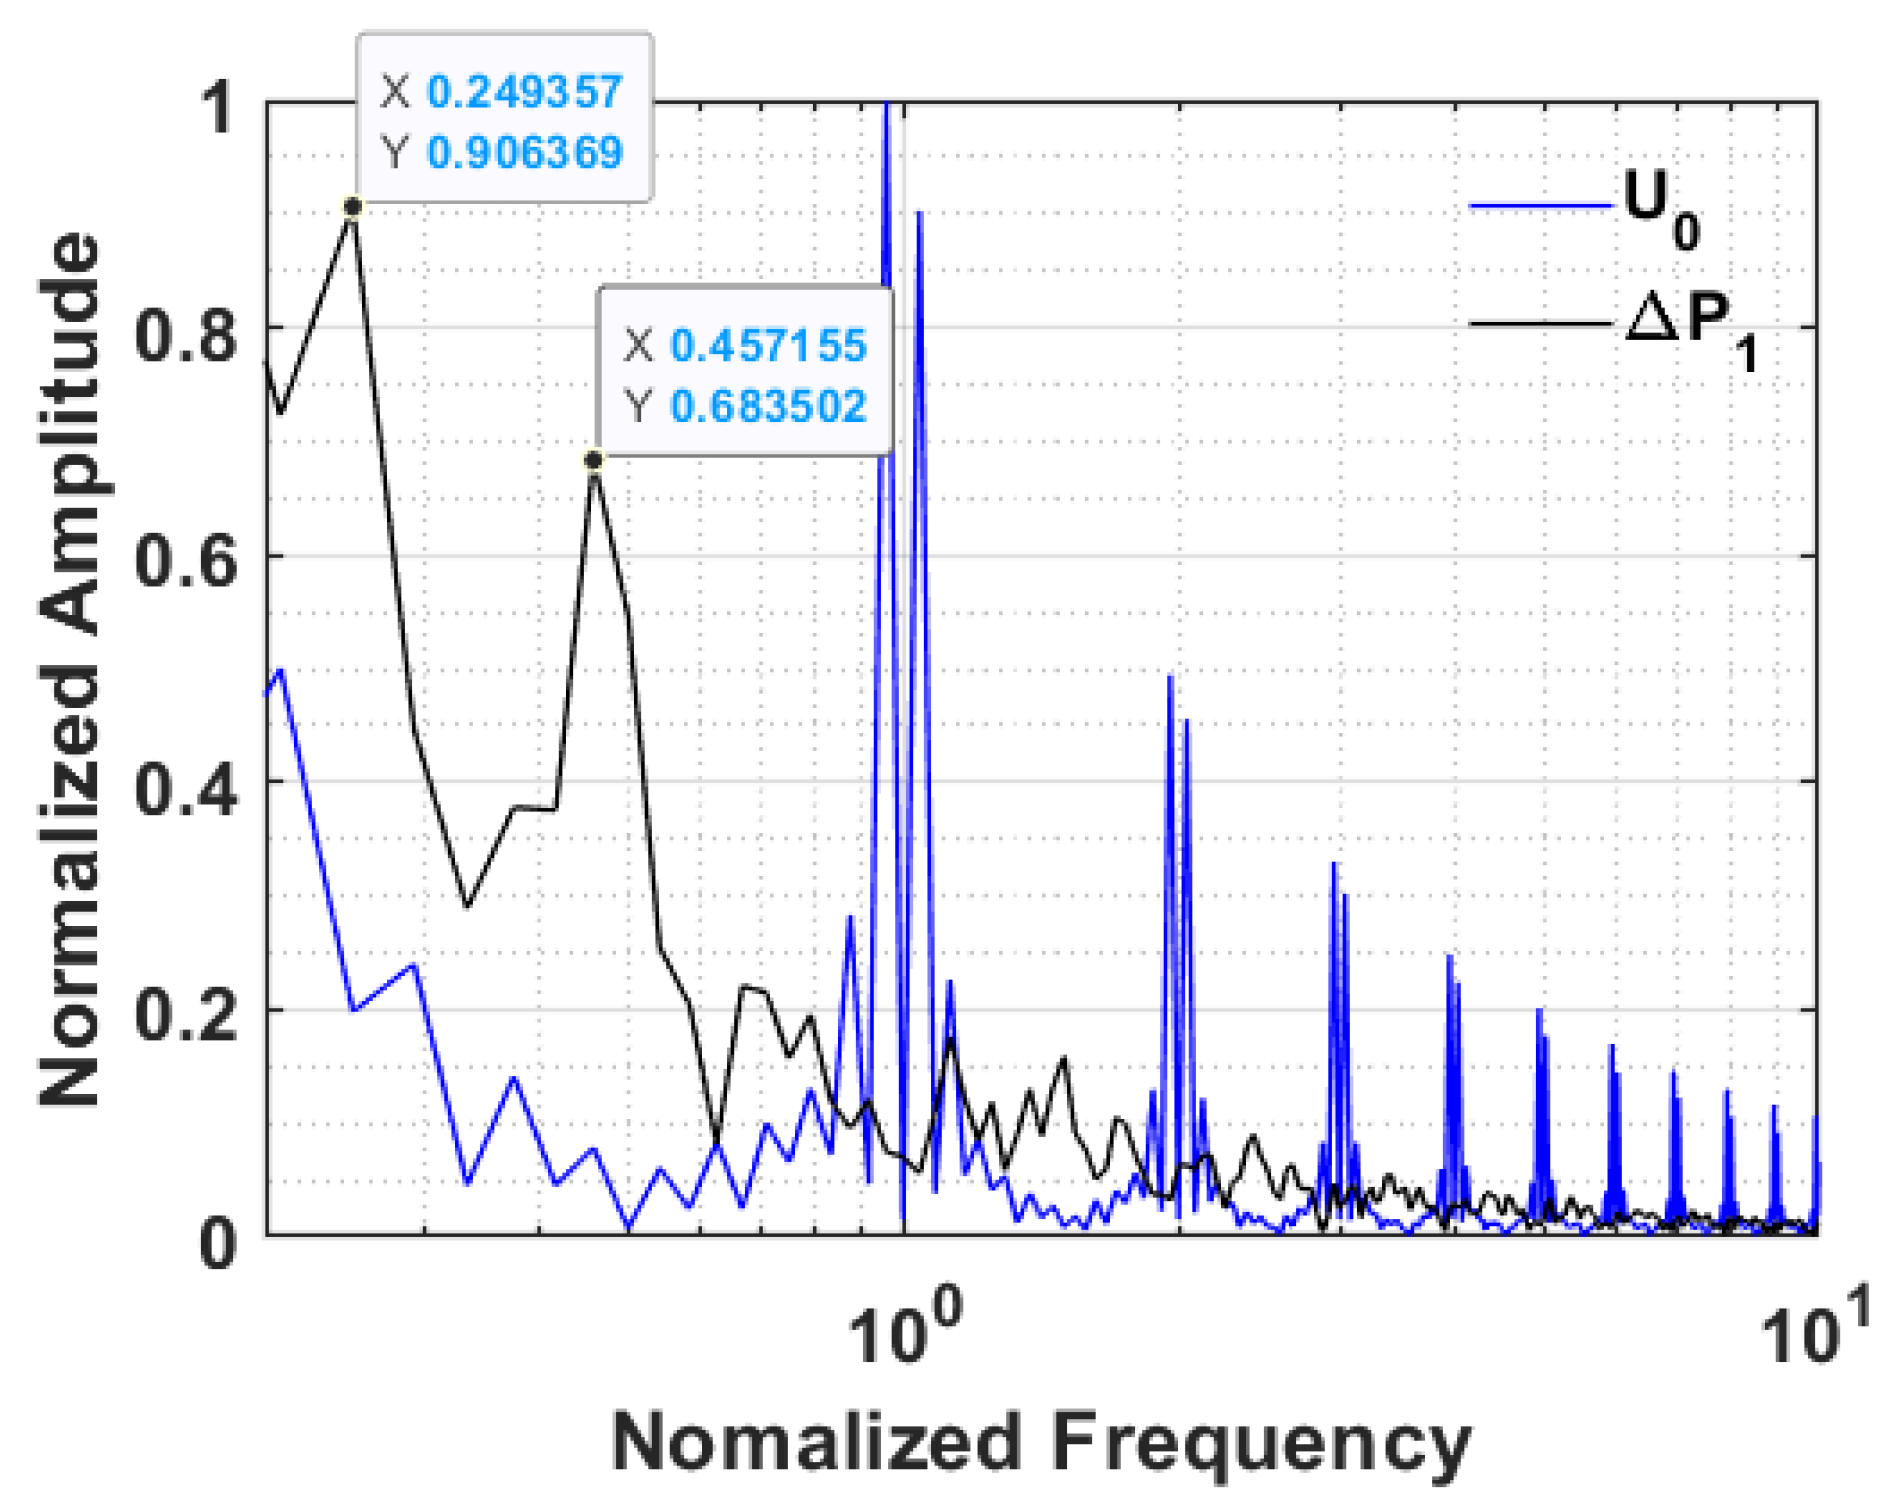
3.2. Frequency Response of Bed Transients
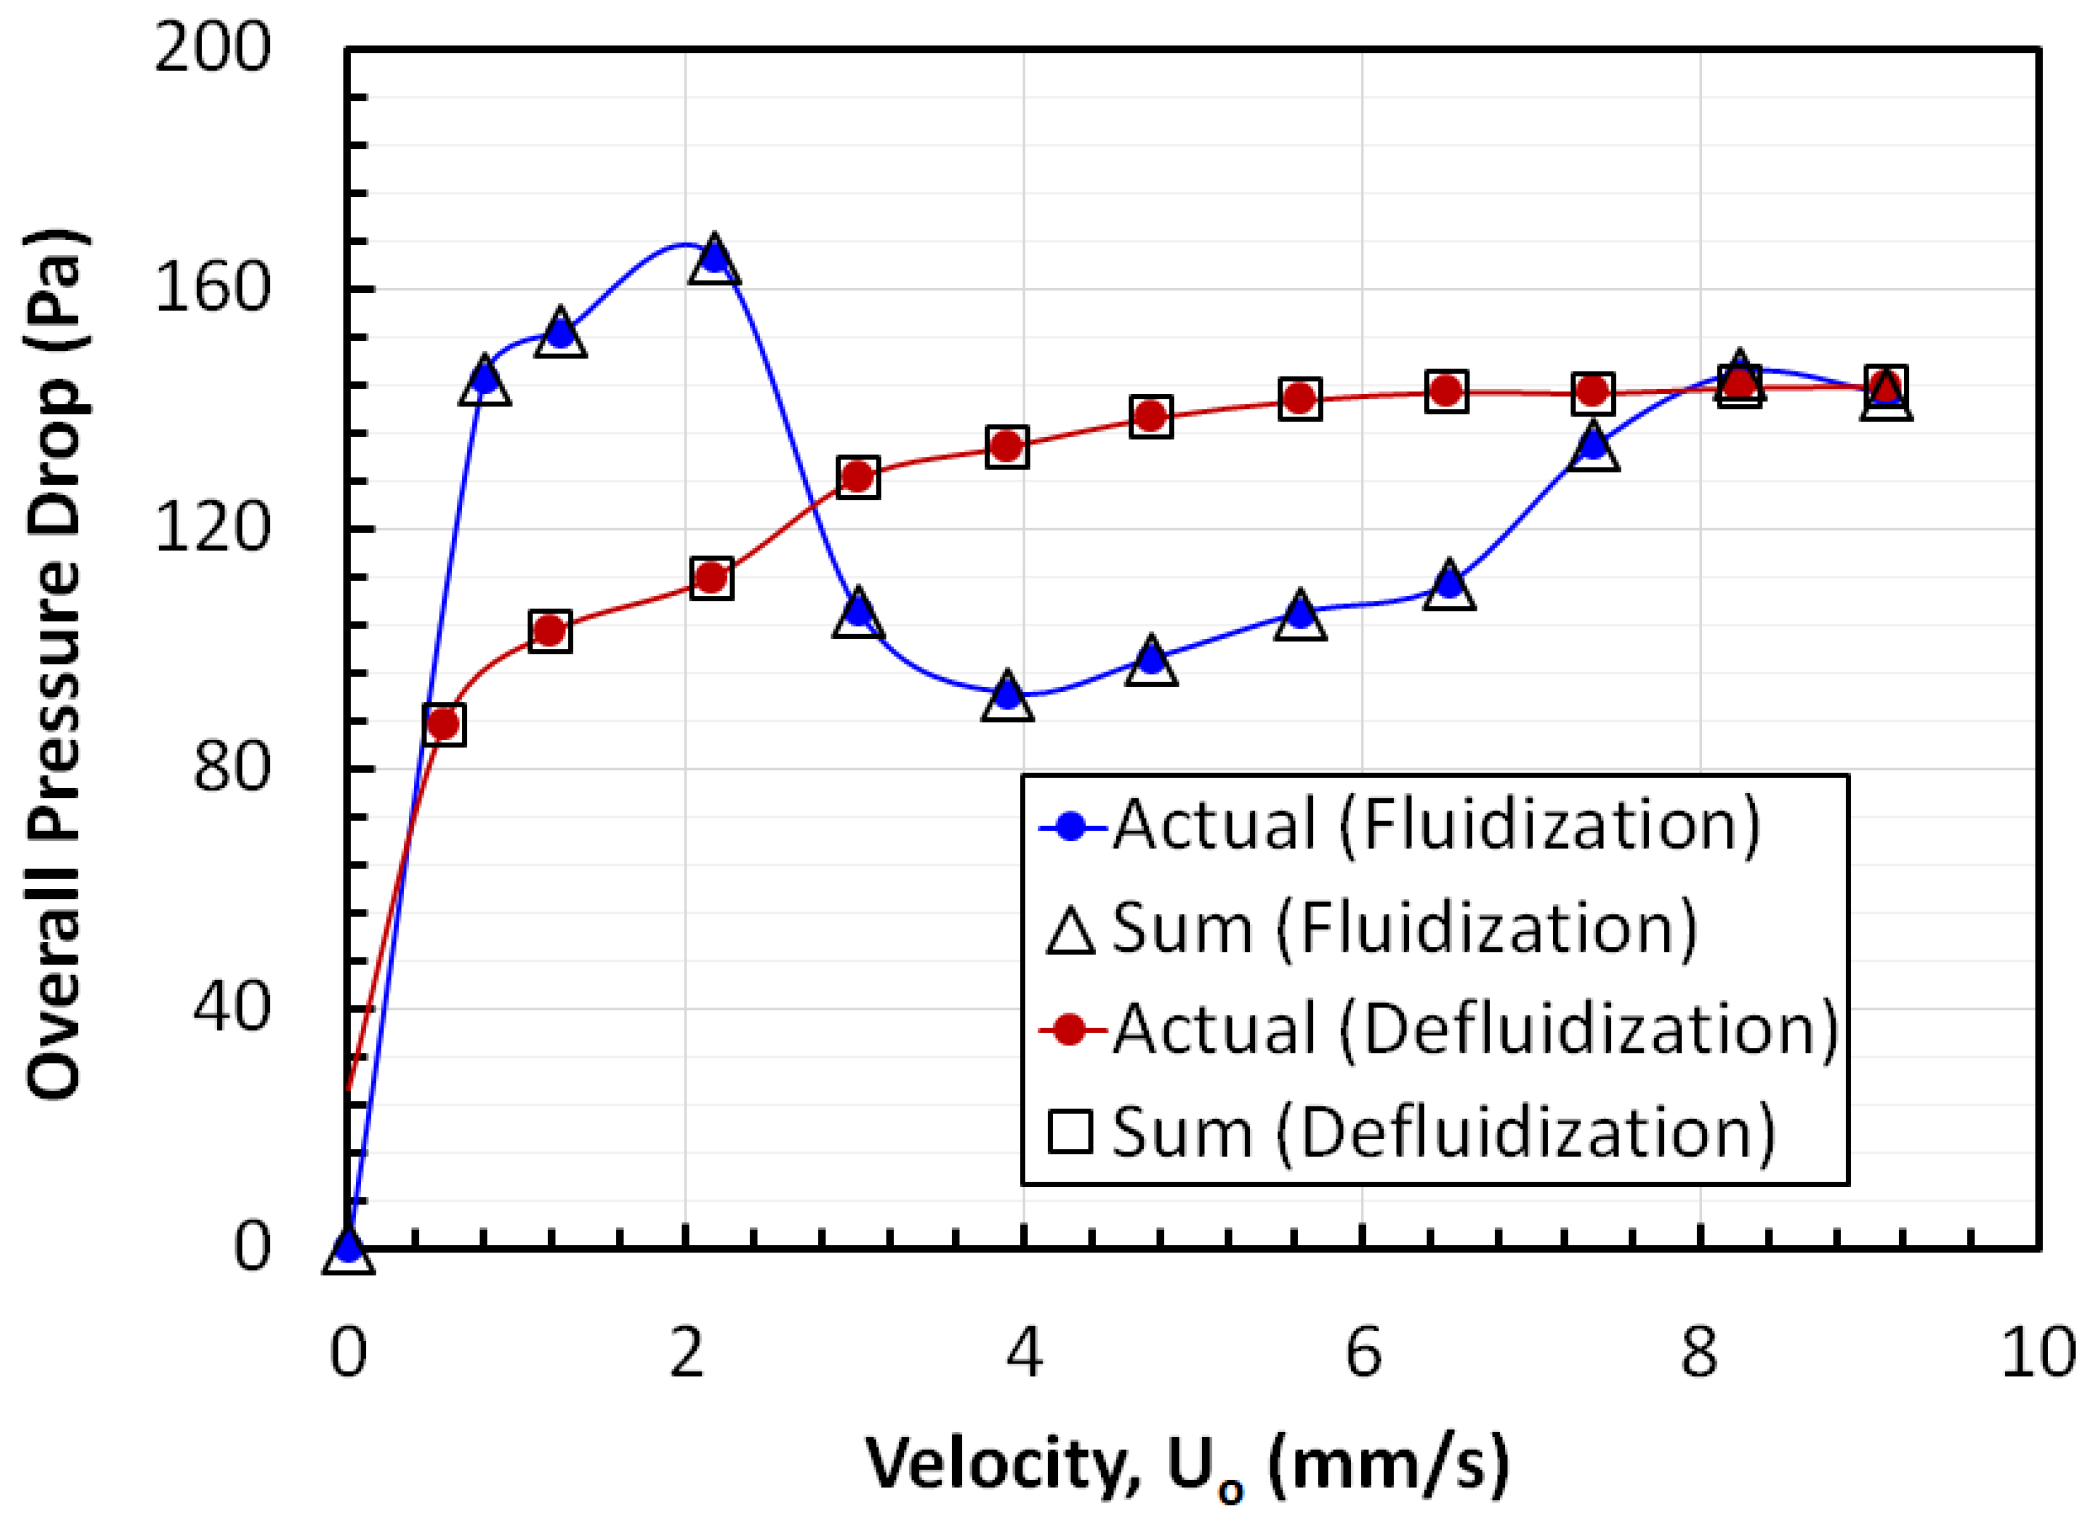
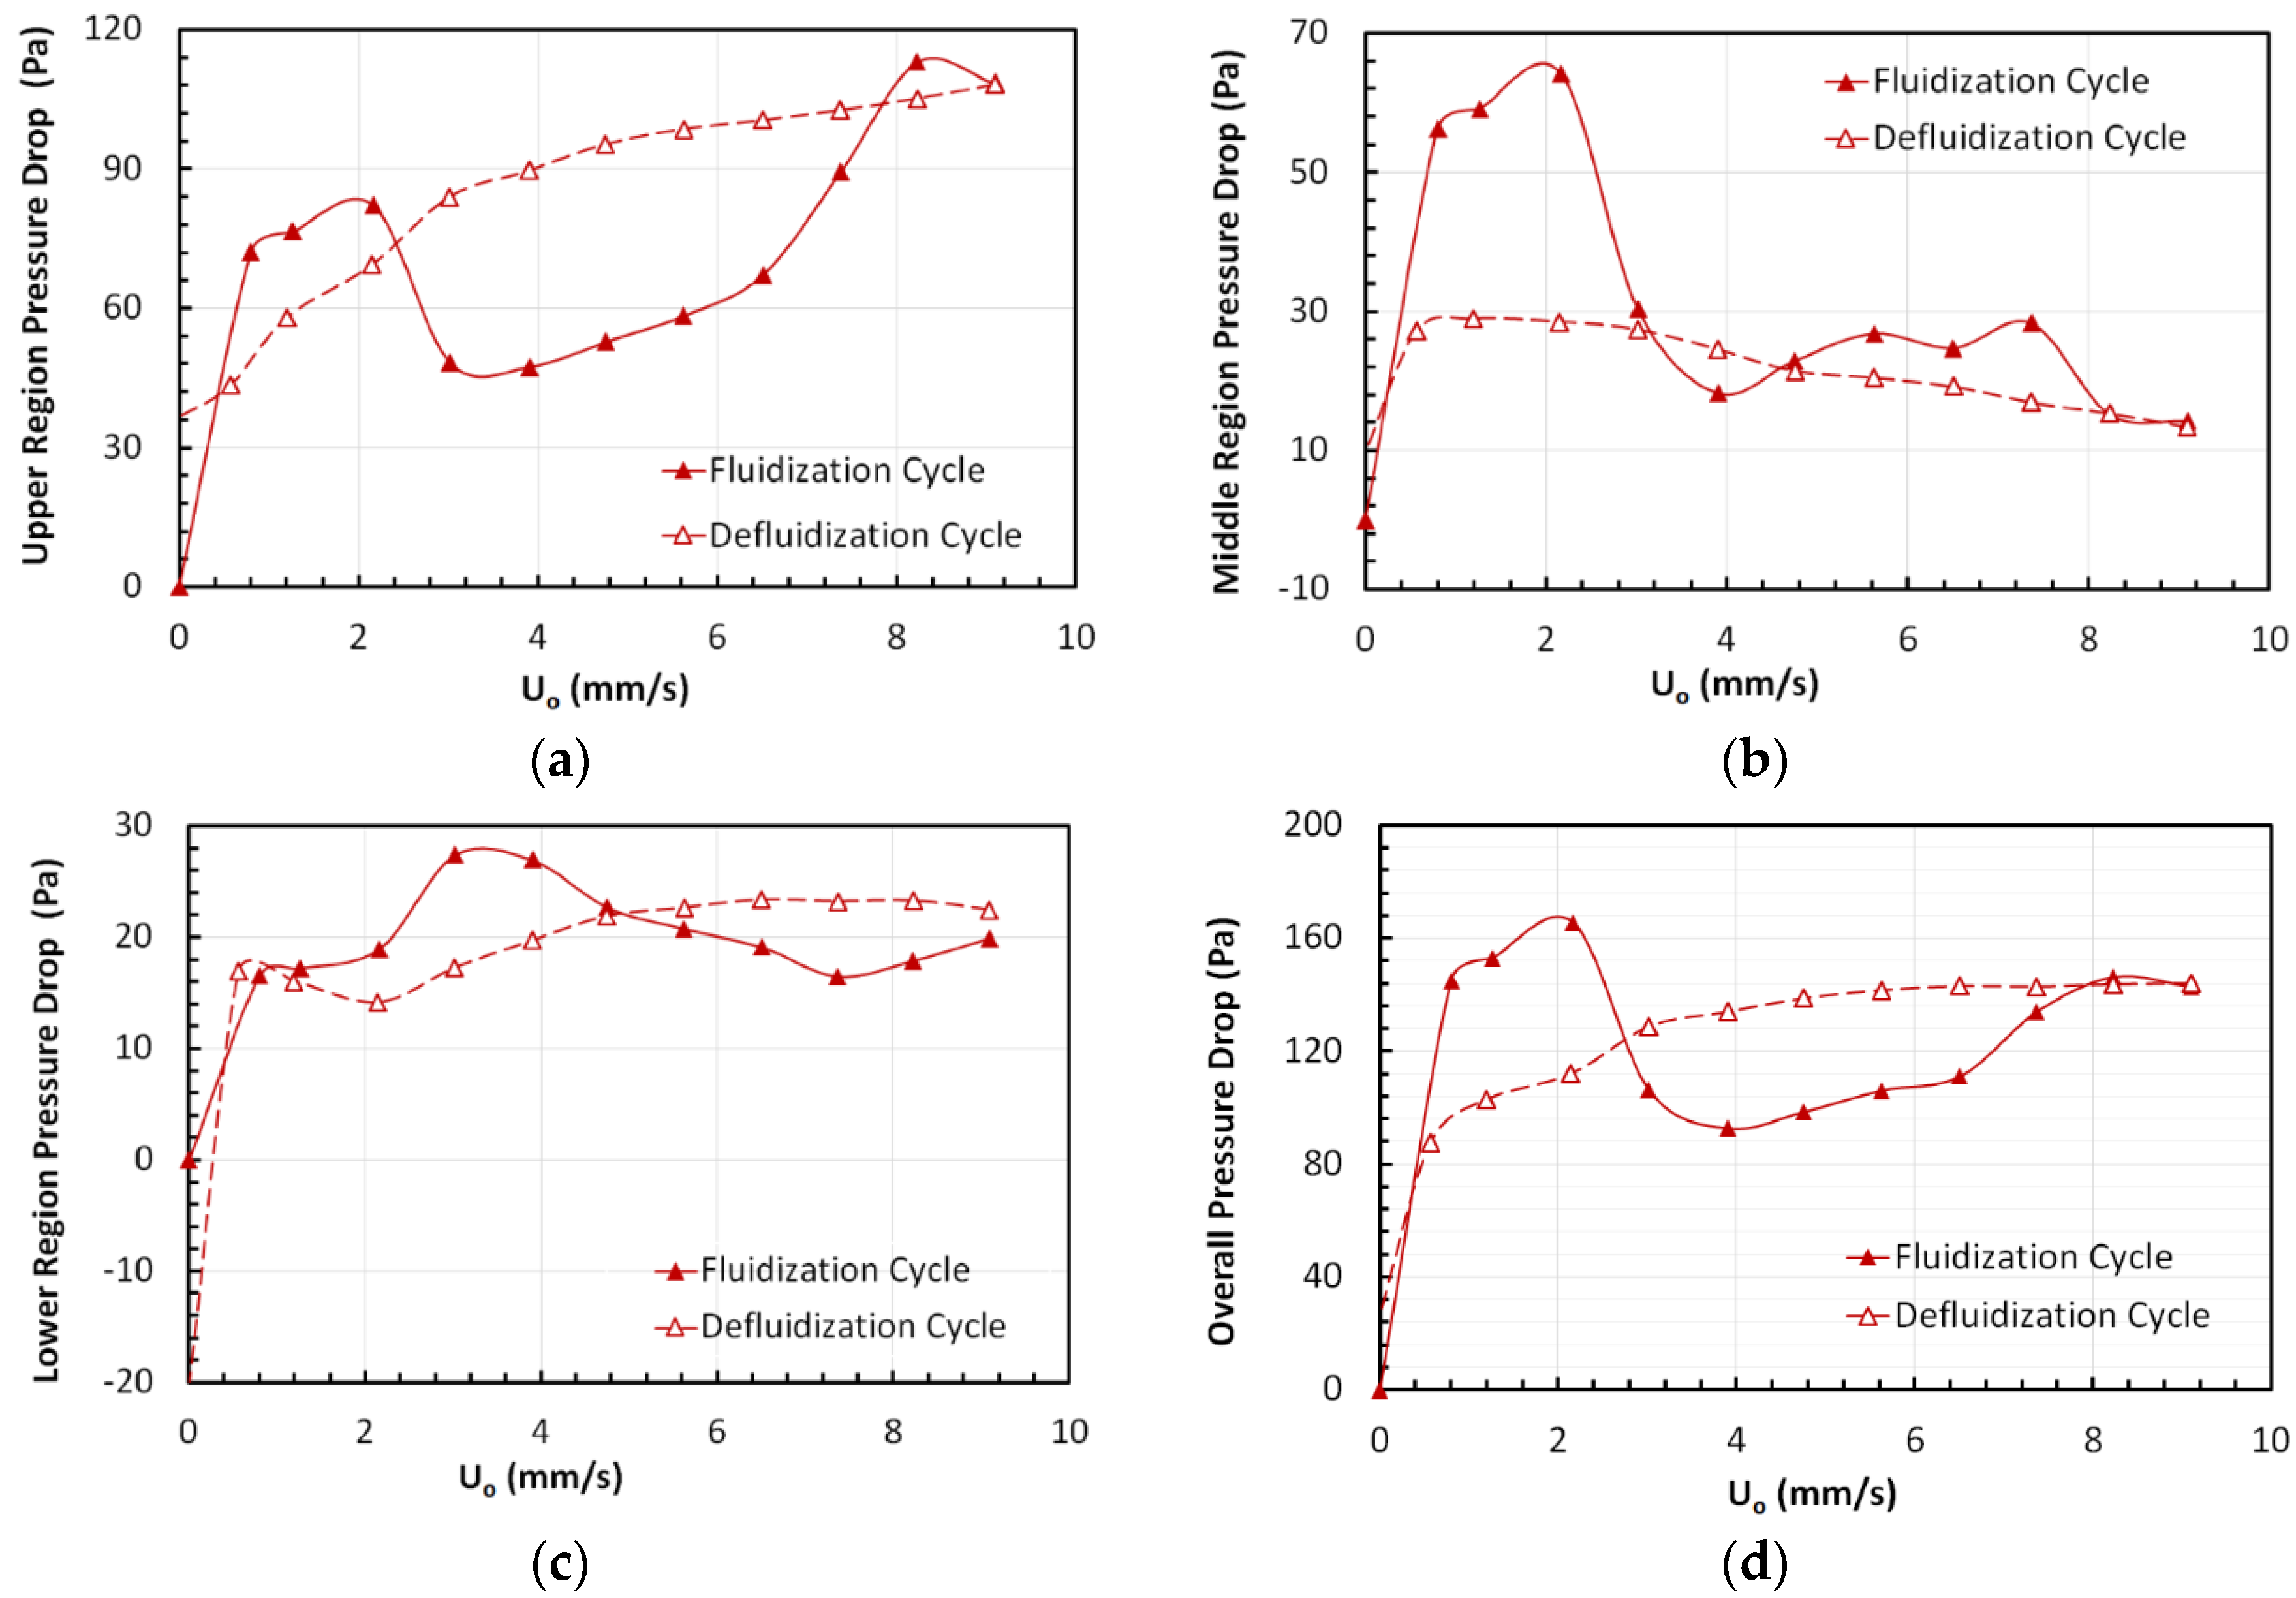
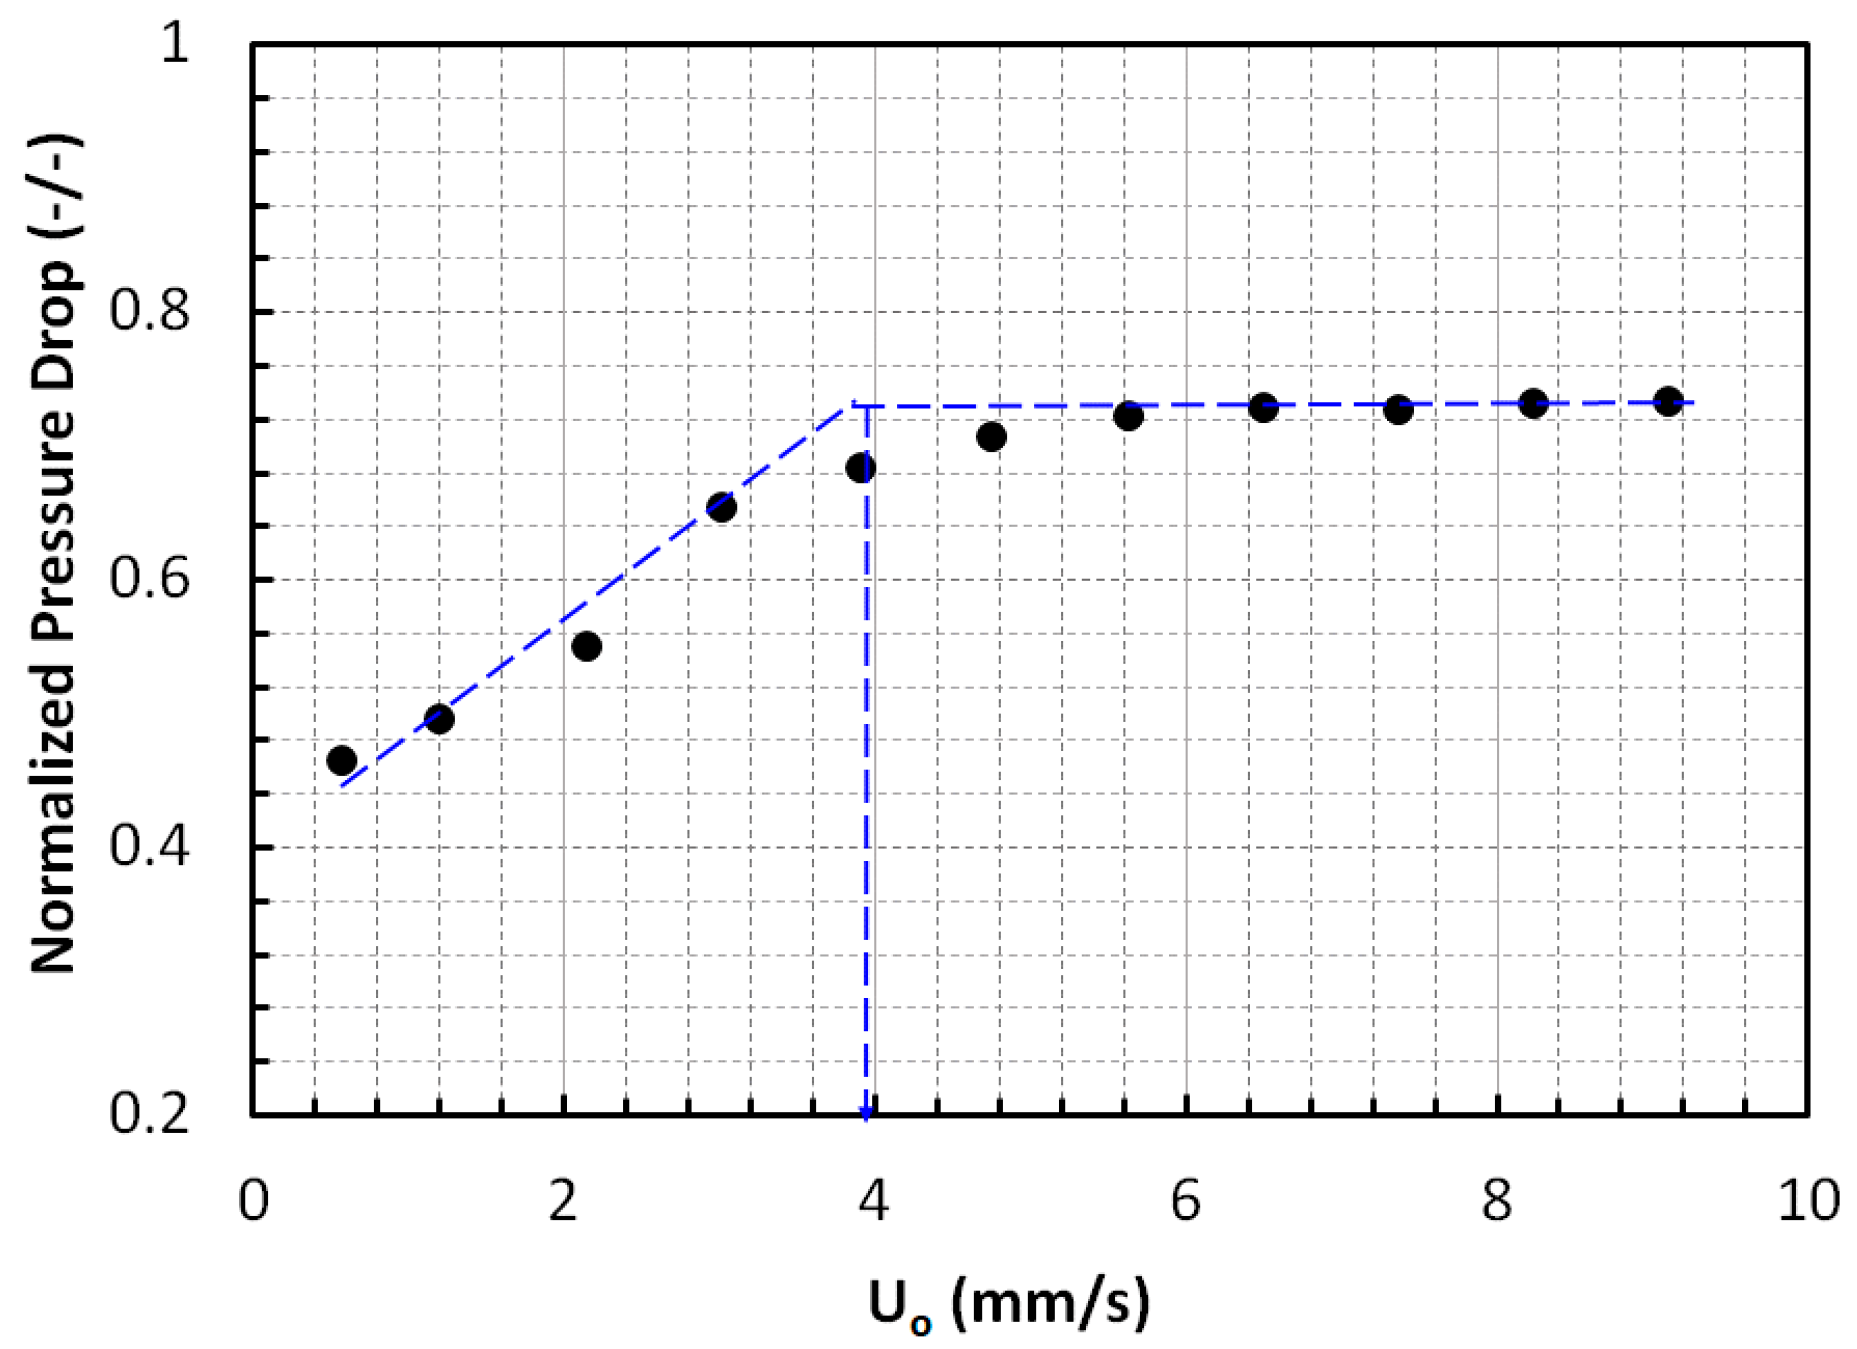
3.3. Region-Wise Pressure Drop Behavior
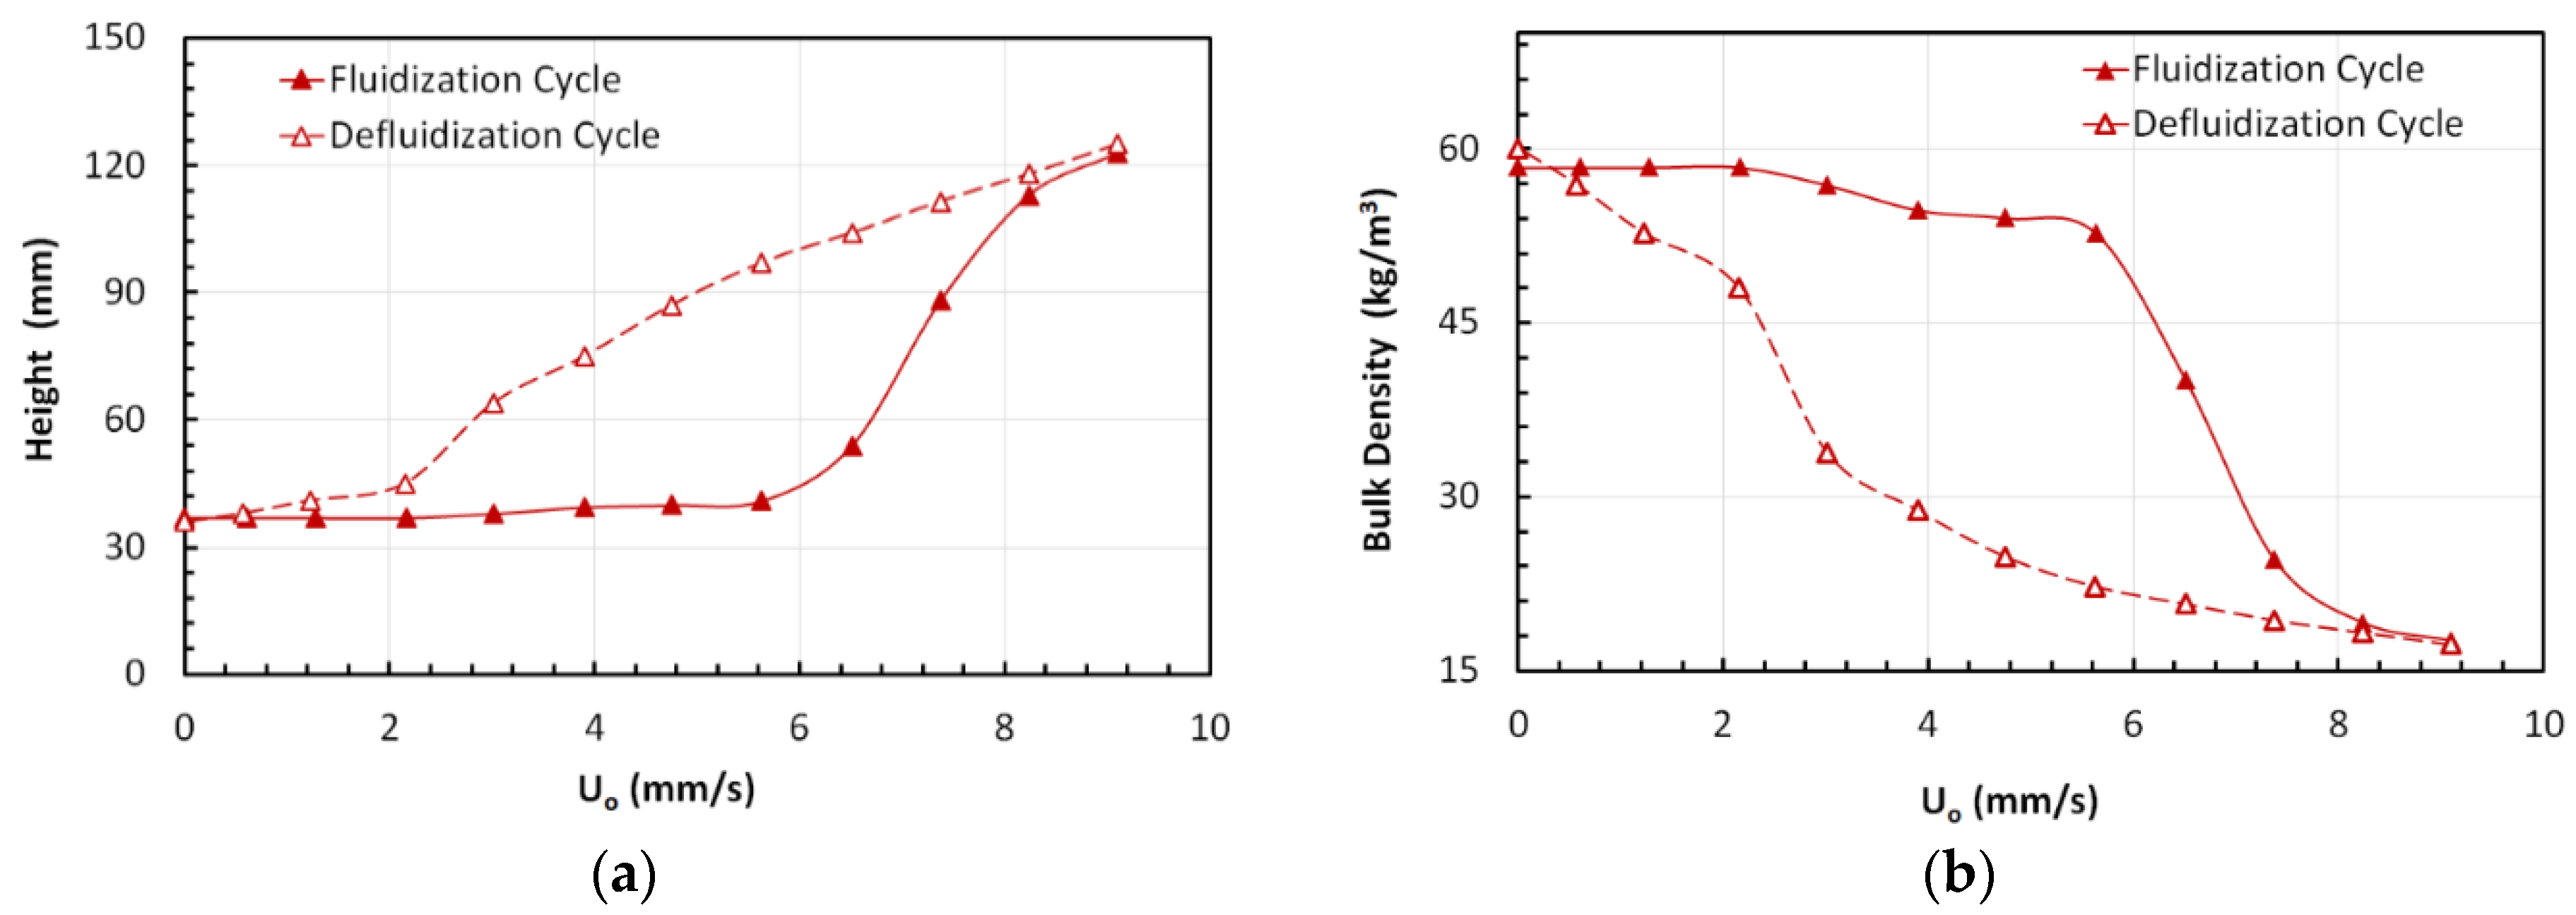
3.4. Bed Height and Bulk Density
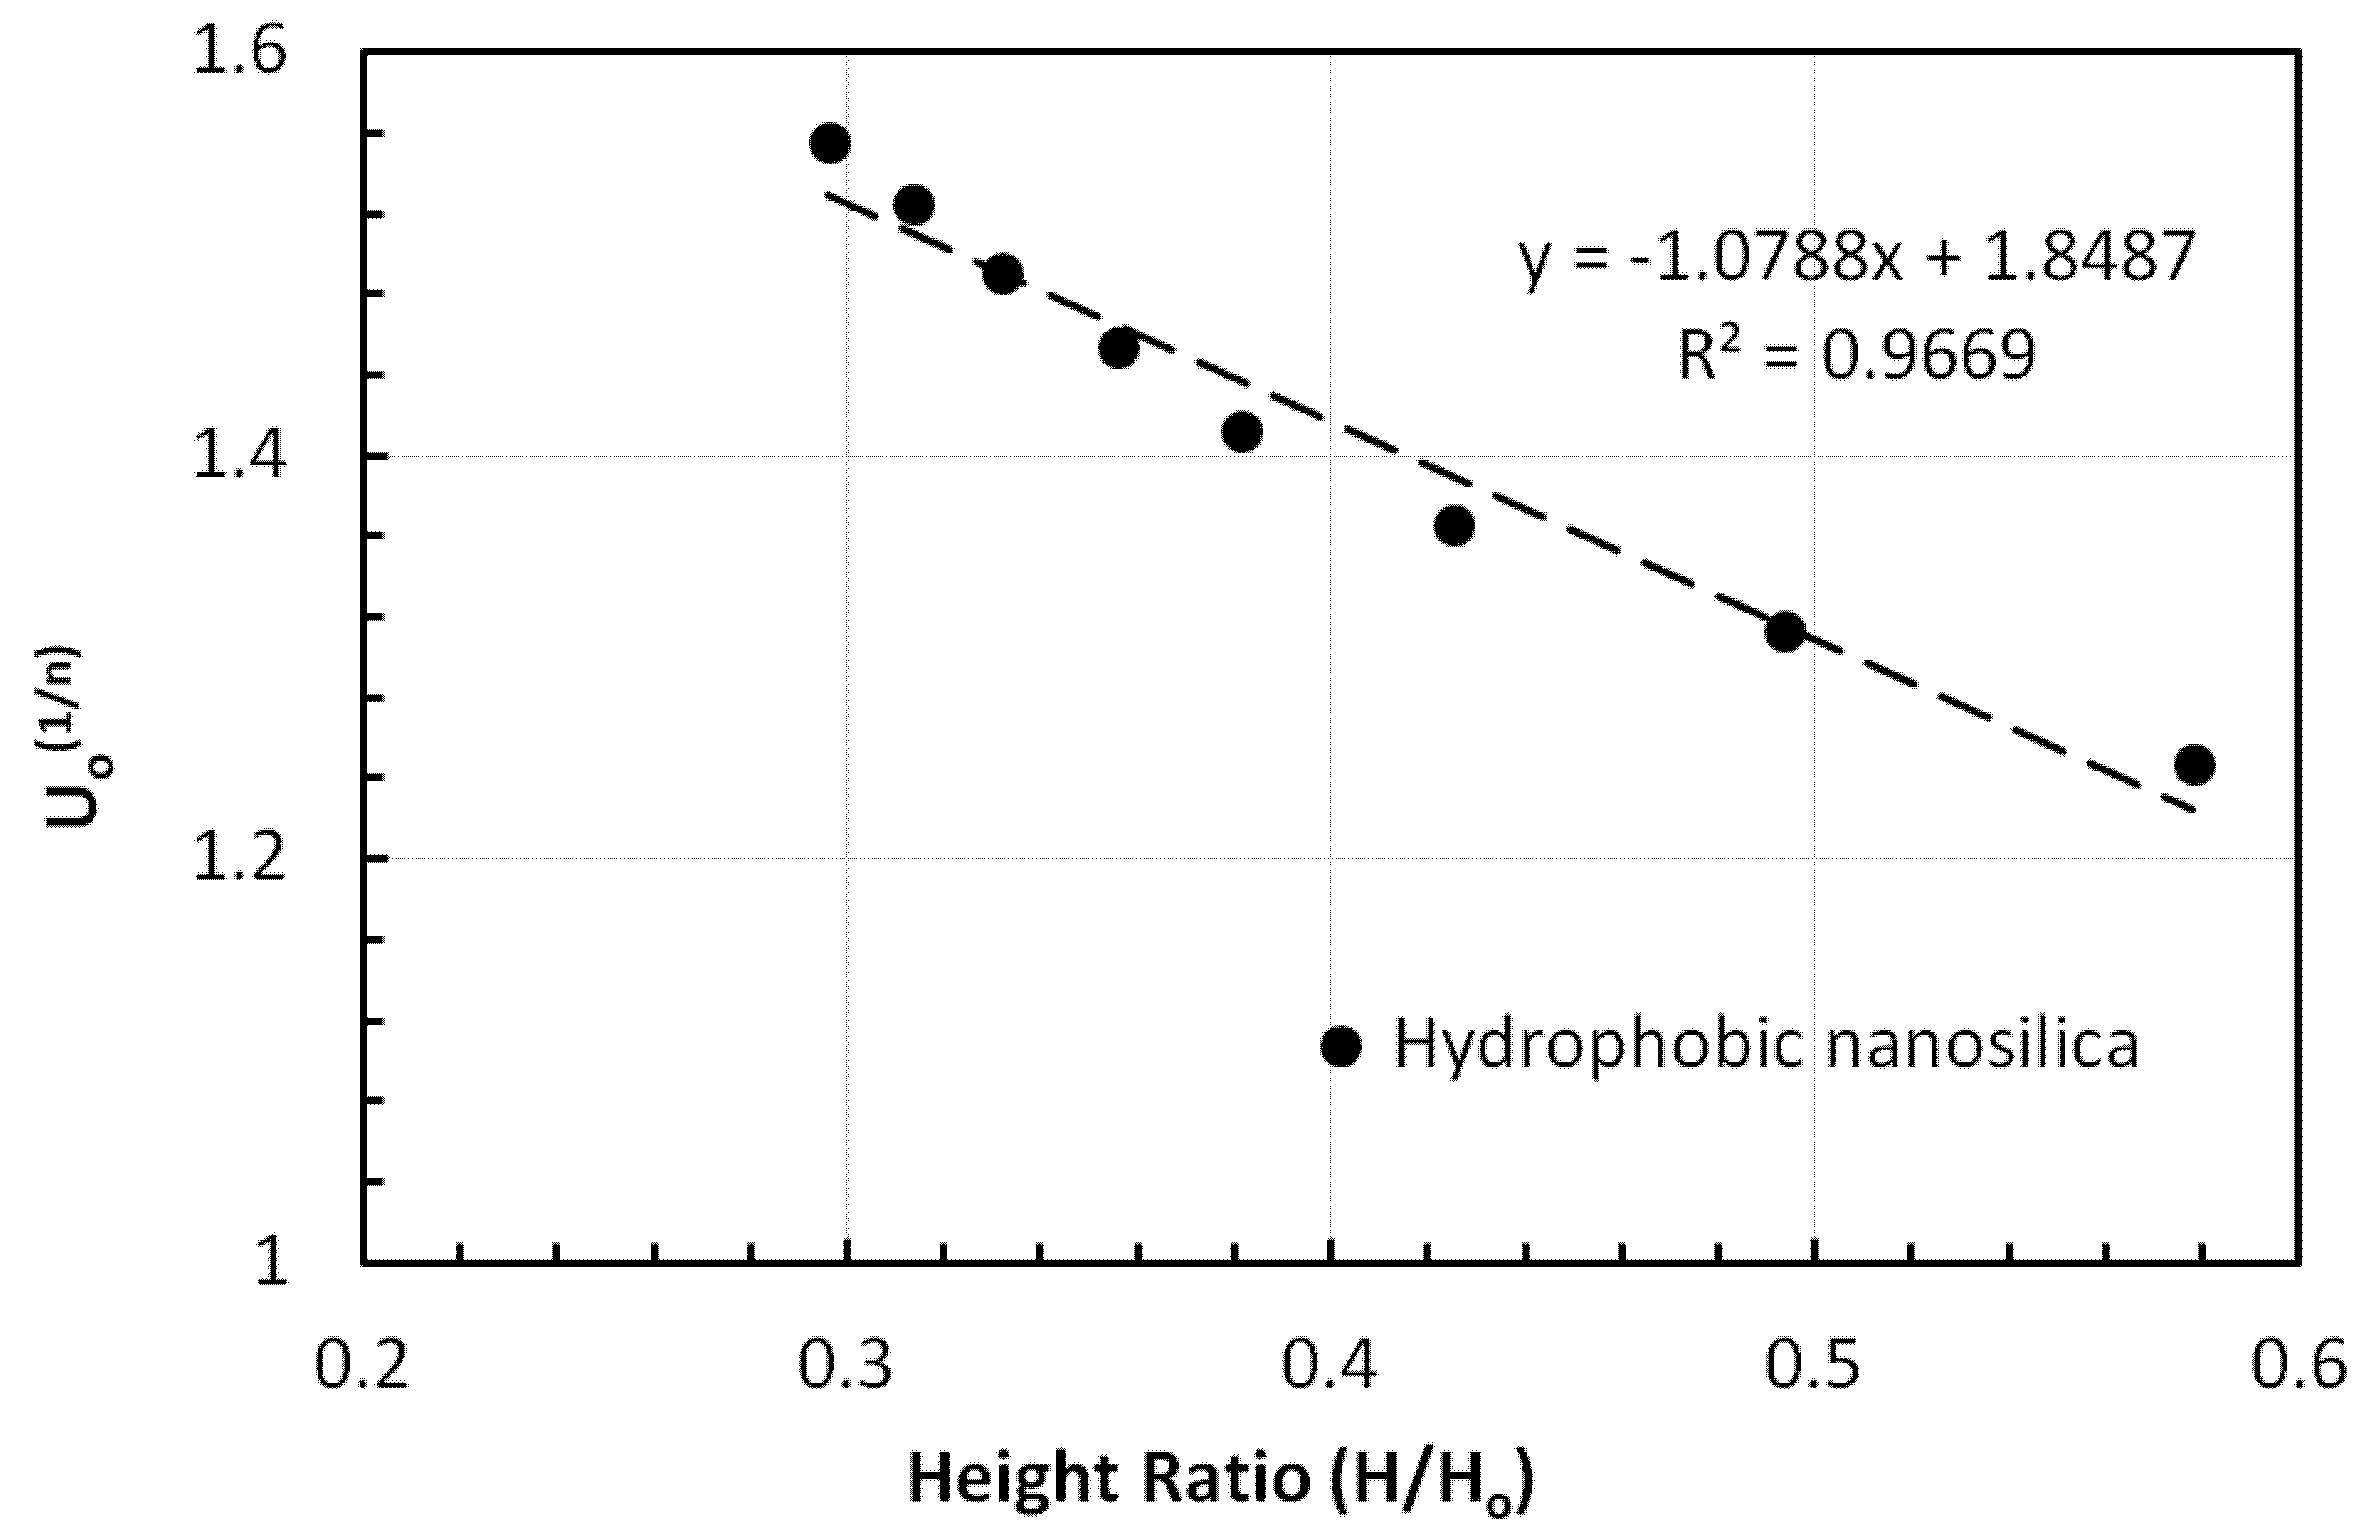
3.5. Incipient Fluidization and Terminal Velocity
4. Conclusions
Author Contributions
Funding
Acknowledgments
Conflicts of Interest
References
- Geldart, D. Types of gas fluidization. Powder Technol. 1973, 7, 285–292. [Google Scholar] [CrossRef]
- Raganati, F.; Chirone, R.; Ammendola, P. Gas-solid fluidization of cohesive powders. Chem. Eng. Res. Des. 2018, 133, 347–387. [Google Scholar] [CrossRef]
- Al-Ghurabi, E.H.; Ajbar, A.; Asif, M. Improving Fluidization Hydrodynamics of Group C Particles by Mixing with Group B Particles. Appl. Sci. 2018, 8, 1469. [Google Scholar] [CrossRef] [Green Version]
- Yao, W.; Guangsheng, G.; Fei, W.; Jun, W. Fluidization and agglomerate structure of SiO2 nanoparticles. Powder Technol. 2002, 124, 152–159. [Google Scholar] [CrossRef]
- Zhu, C.; Yu, Q.; Dave, R.N.; Pfeffer, R. Gas fluidization characteristics of nanoparticle agglomerates. AIChE J. 2005, 51, 426–439. [Google Scholar] [CrossRef]
- Barik, T.K.; Sahu, B.; Swain, V. Nanosilica—From medicine to pest control. Parasitol. Res. 2008, 103, 253. [Google Scholar] [CrossRef]
- Zhang, M.-H.; Islam, J. Use of nano-silica to reduce setting time and increase early strength of concretes with high volumes of fly ash or slag. Constr. Build. Mater. 2012, 29, 573–580. [Google Scholar] [CrossRef]
- Guo, W.; Guo, X.; Chang, M.; Dai, W. Evaluating the Effect of Hydrophobic Nanosilica on the Viscoelasticity Property of Asphalt and Asphalt Mixture. Materials 2018, 11, 2328. [Google Scholar] [CrossRef] [Green Version]
- Mallakpour, S.; Naghdi, M. Polymer/SiO2 nanocomposites: Production and applications. Prog. Mater. Sci. 2018, 97, 409–447. [Google Scholar] [CrossRef]
- NanoSilica Market Size & Share, Global Industry Report, 2018–2025. Available online: https://www.grandviewresearch.com/industry-analysis/nanosilica-market (accessed on 1 July 2020).
- Al-Ghurabi, E.H.; Shahabuddin, M.; Kumar, N.S.; Asif, M. Deagglomeration of Ultrafine Hydrophilic Nanopowder Using Low-Frequency Pulsed Fluidization. Nanomaterials 2020, 10, 388. [Google Scholar] [CrossRef] [Green Version]
- Asif, M.; Al-Ghurabi, E.H.; Ajbar, A.; Kumar, N.S. Hydrodynamics of Pulsed Fluidized Bed of Ultrafine Powder: Fully Collapsing Fluidized Bed. Processes 2020, 8, 807. [Google Scholar] [CrossRef]
- Shabanian, J.; Chaouki, J. Influence of interparticle forces on solids motion in a bubbling gas-solid fluidized bed. Powder Technol. 2016, 299, 98–106. [Google Scholar] [CrossRef]
- Lee, J.R.; Lee, K.S.; Park, Y.O.; Lee, K.Y. Fluidization characteristics of fine cohesive particles assisted by vertical vibration in a fluidized bed reactor. Chem. Eng. J. 2020, 380, 122454. [Google Scholar] [CrossRef]
- Lehmann, S.E.; Hartge, E.U.; Jongsma, A.; deLeeuw, I.M.; Innings, F.; Heinrich, S. Fluidization characteristics of cohesive powders in vibrated fluidized bed drying at low vibration frequencies. Powder Technol. 2019, 357, 54–63. [Google Scholar] [CrossRef]
- Zhao, Z.; Liu, D.; Ma, J.; Chen, X. Fluidization of nanoparticle agglomerates assisted by combining vibration and stirring methods. Chem. Eng. J. 2020, 388, 124213. [Google Scholar] [CrossRef]
- Saidi, M.; Tabrizi, H.B.; Grace, J.R. A review on pulsed flow in gas-solid fluidized beds and spouted beds: Recent work and future outlook. Adv. Powder Technol. 2019, 30, 1121–1130. [Google Scholar] [CrossRef]
- Ali, S.S.; Asif, M. Fluidization of nano-powders: Effect of flow pulsation. Powder Technol. 2012, 225, 86–92. [Google Scholar] [CrossRef]
- Al-Ghurabi, E.H.; Ali, S.S.; Alfadul, S.M.; Shahabuddin, M.; Asif, M. Experimental investigation of fluidized bed dynamics under resonant frequency of sound waves. Adv. Powder Technol. 2019, 30, 2812–2822. [Google Scholar] [CrossRef]
- Ali, S.S.; Asif, M. Effect of particle mixing on the hydrodynamics of fluidized bed of nanoparticles. Powder Technol. 2017, 310, 234–240. [Google Scholar] [CrossRef]
- Asif, M.; Kalogerakis, N.; Behie, L.A. Hydrodynamics of liquid fluidized-beds including the distributor region. Chem. Eng. Sci. 1992, 47, 4155–4166. [Google Scholar] [CrossRef]
- Robinson, N.; Gladden, L.F.; D’Agostino, C. Exploring catalyst passivation with NMR relaxation. Faraday Discuss 2017, 204, 439–452. [Google Scholar] [CrossRef] [PubMed] [Green Version]
- Zhou, E.; Zhang, Y.; Zhao, Y.; Luo, Z.; Yang, X.; Duan, C.; Dong, L.; Fu, Z. Effect of vibration energy on fluidization and 1–6 mm coal separation in a vibrated dense medium fluidized bed. Sep. Sci. Technol. 2018, 53, 2297–2313. [Google Scholar] [CrossRef]
- Fu, Z.; Zhu, J.; Barghi, S.; Zhao, Y.; Luo, Z.; Duan, C. Mixing and segregation behavior in an air dense medium fluidized bed with binary mixtures for dry coal beneficiation. Powder Technol. 2020, 371, 161–169. [Google Scholar] [CrossRef]


Publisher’s Note: MDPI stays neutral with regard to jurisdictional claims in published maps and institutional affiliations. |
© 2020 by the authors. Licensee MDPI, Basel, Switzerland. This article is an open access article distributed under the terms and conditions of the Creative Commons Attribution (CC BY) license (http://creativecommons.org/licenses/by/4.0/).
Share and Cite
Al-Ghurabi, E.H.; Asif, M.; Kumar, N.S.; Khan, S.A. Fluidization Dynamics of Hydrophobic Nanosilica with Velocity Step Changes. Appl. Sci. 2020, 10, 8127. https://doi.org/10.3390/app10228127
Al-Ghurabi EH, Asif M, Kumar NS, Khan SA. Fluidization Dynamics of Hydrophobic Nanosilica with Velocity Step Changes. Applied Sciences. 2020; 10(22):8127. https://doi.org/10.3390/app10228127
Chicago/Turabian StyleAl-Ghurabi, Ebrahim H., Mohammad Asif, Nadavala Siva Kumar, and Sher Afghan Khan. 2020. "Fluidization Dynamics of Hydrophobic Nanosilica with Velocity Step Changes" Applied Sciences 10, no. 22: 8127. https://doi.org/10.3390/app10228127