Article

Correlations Between Phenolic Composition and Perceived Astringency of Wines

Fruit Research Division, National Institute of Horticultural and Herbal Science, Wanju 55365, Korea
*
Author to whom correspondence should be addressed.
Appl. Sci. 2020, 10(22), 8020; https://doi.org/10.3390/app10228020
Submission received: 7 October 2020 / Revised: 4 November 2020 / Accepted: 11 November 2020 / Published: 12 November 2020
(This article belongs to the Special Issue Advances in Food Sensory Sciences)

Abstract

:
The astringent sensation of wines is attributable to the composition and concentration of phenolic compounds. However, in many cases, experimental results have shown a gap in relation to sensory astringency. The aim of the present study was to evaluate the relationships between the experimental evidence of astringent attributes and perceived astringency. To this end, the concentrations of phenolic compounds, namely, the total phenolic content (TPC), the polymeric tannin content (PTC), the proanthocyanidin content (PAC) and the total anthocyanin content (TAC), in wines made from a variety of grape breeding lines were estimated and their relationships to perceived astringency were evaluated. The TPC and the PTC showed strong positive correlations with perceived astringency. In contrast, the PAC showed a moderate correlation with perceived astringency, which was lower than that shown by the PTC despite their similar phenolic compositions. Unlike the other attributes, the TAC showed a weak correlation with perceived astringency. We concluded that the TPC and the PTC showed good correlations with perceived astringency and could be used as an index for predicting the astringency of wines.

1. Introduction

Astringency and bitterness are generally induced by various phenolic compounds including tannins in particular and are two of the most important organoleptic properties determining the quality of wines. An astringent sensation is the dry, puckering and rough feeling in the mouth experienced after tasting wines [1]. Anthocyanidins and proanthocyanidins contribute greatly to the color and astringency of wines, respectively [2], while volatile phenolic acids such as benzoic acids and cinnamic acids affect a wine’s flavor [3]. The composition of phenolic compounds in grapes and wines can be affected by numerous factors such as the grape cultivar, maturity, growing and climate conditions and wine-making procedure [4].
The concentrations of phenolic compounds can be estimated by various methods such as HPLC [5], electrochemistry [6] and colorimetry [7], depending on their molecular, physicochemical and electrochemical properties. Among them, colorimetric assay coupled with UV/Vis spectrophotometry is the most widely used method to estimate the concentrations of phenolic compounds [8]. The concentrations of total phenolic compounds, anthocyanidins and proanthocyanidins have been frequently used as determinants for evaluating wine quality due to their different physical, chemical and biological contributions. In particular, anthocyanidins and proanthocyanidins have been considered primary indicators for determining the quality of a wine because they directly affect the wine’s taste, i.e., astringency [9]. However, in many cases, experimental evidence of those astringent attributes has shown a gap in relation to perceived sensory data. Furthermore, the results varied depending on the estimation methods, chemical reagents and standard materials used [10,11]. For this reason, the selection of appropriate estimation methods is very important for evaluating the astringency of wine. Many studies have estimated the relationship between proanthocyanidin concentration and sensory astringency [11].
Thus, the aims of the present study were to estimate the concentrations of phenolic compounds including the total phenolic content (TPC), the polymeric tannin content (PTC), the proanthocyanidin content (PAC) and the total anthocyanin content (TAC) as experimental astringent attributes and to evaluate the relationships between these astringent attributes and perceived sensory astringency. For these purposes, we prepared eleven red wines and four white wines that contained various concentrations of phenolic compounds and were made from different grape breeding lines and estimated the TPC, the PTC, the PAC and the TAC of each wine. Furthermore, we evaluated the relationships between the experimental astringent attributes and the perceived sensory data to determine their viability for screening grape breeding lines suitable for wine-making.

2. Materials and Methods

2.1. Reagents

Analytical standard grade (+)-catechin (C) and gallic acid (GA) were purchased from Sigma-Aldrich (St. Louis, MO, USA) and cyanidin-3-O-β-glucopyronoside (C3G) from Polyphenols Laboratories AS (Hanaveien, Sandnes, Norway). Reagent grade Folin–Ciocalteu’s phenol reagent (FC reagent), vanillin, sodium carbonate, sodium chloride (NaCl), tannic acid (TA), iron (III) chloride hexahydrate (FeCl3·6H2O), bovine serum albumin (BSA, Fraction V, 96–98%), tartaric acid, potassium chloride (KCl), trifluoroacetic acid (TFA) and sodium acetate were also purchased from Sigma-Aldrich. Urea was purchased from the Promega Corporation (Madison, WI, USA).

2.2. Wine Sample Preparation

Various breeding lines were used for the preparation of the wines sampled in this study and their identities and parentages are listed in Table 1. The test wines were made using a micro-vinification method [12]. Grapes from each lineage were crushed and treated with potassium metabisulfite (K2S2O5) at a concentration of 0.2 g/kg followed by the addition of table sugar to adjust the grape must to 22 °Brix. Each grape must was inoculated with active yeast to a concentration of 0.02% (w/w). The yeast strains Saccharomyces cerevisiae Fermivin (DSM Food Specialties, Delft, The Netherlands) and Saccharomyces bayanus (EC-1118; Lallemand Inc., MON, Canada) were used for the fermentation of the red wine and white wine, respectively. The primary fermentation took place in a glass bottle sealed with a cork and airlock at 15 °C for two weeks. At the end of the primary fermentation, the grape juice was isolated from the sediment and transferred into a clean container for the week-long secondary fermentation. All of the wine samples were stored at 4 °C prior to analysis and sensory evaluation. For the estimation of phenolic compounds, the wine samples were filtered using a 0.2 µm syringe filter and stored in a refrigerator prior to analysis.

2.3. Color Characterization

The colors of the wine were determined by spectrophotometric colorimetry as described by Babincev et al. [13]. Briefly, 200 µL of each wine was transferred into a well of a 96-well plate and the absorbance was recorded at 420 nm, 520 nm and 620 nm using a dilution buffer (12% ethanol containing 5 mg/mL tartaric acid, pH 3.3) as a blank. The color intensity (I), hue (T) and percentage color compounds were estimated using the following equations:
Color intensity (I) = Abs420 + Abs520 + Abs620.
Hue (T) = Abs420/Abs520.
% Yellow compounds (%Y) = (Abs420/I) × 100.
% Red compounds (%R) = (Abs520/I) × 100.
% Blue compounds (%B) = (Abs620/I) × 100.

2.4. Total Phenolic Content

The total phenolic content (TPC) of the wine samples was determined by using a slight modification of the Folin–Ciocalteu’s reagent assay described by Amzad Hossain and Shah [7]. To a microtube, 0.1 mL of the wine sample and 0.5 mL of a working solution of the FC reagent diluted 10-fold with deionized water were added and vortexed. For initiating the reaction, 0.4 mL of a 20% NaCO3 solution was added, vortexed and incubated at 100 °C for two hours in a water bath (Maxturdy-18, DAIHAN Scientific, Wonju, Korea). Then, 0.2 mL of the reaction mixture was transferred into a well of a 96-well microplate and the absorbance was recorded at a wavelength of 760 nm on a microplate reader (Multiskan GO, Thermo Fisher Scientific, Waltham, MA, USA) against the blank solution consisting of a dilution buffer (12% ethanol containing 5 mg/mL tartaric acid, pH 3.3), the FC working solution and a 20% sodium carbonate solution. The TPC was estimated using a gallic acid (GA) calibration curve (y = 0.0048x+ 0.0372, R2 = 0.9978). Different concentrations of GA in the dilution buffer (25, 50, 100, 200, 300, 500 µg/mL) were used for the construction of the calibration curve. The concentration of the TPC was expressed as µg/mL gallic acid equivalent (GAE).

2.5. Polymeric Tannin Content

The polymeric tannin content (PTC) of the wine samples was determined by using a slight modification of the BSA precipitation assay described by Harbertson et al. [14]. To a 2 mL microtube, 0.5 mL of the wine sample and 1 mL of a precipitation buffer (1 mg/mL BSA in a washing buffer) were added, vortexed and centrifuged at 10,000 rpm for 2 min after 10 min incubation at room temperature. The supernatant was discarded and 1 mL of the washing buffer (170 mM NaCl in 200 mM acetic acid, pH 4.9) was added, vortexed and centrifuged again to eliminate free acids and unbound monomeric and oligomeric tannins. After discarding the supernatant again, 875 µL of a resuspension buffer (5% triethanolamine in 8.3 M urea aqueous solution, pH 7.0) was added, vortexed and incubated for 10 min at room temperature to resuspend the protein/tannin complex. The resuspended reaction mixtures with turbidity were diluted appropriately with the resuspension buffer to remove turbidity. To a well of a 96-well microplate, 175 µL of each resuspended sample solution was transferred and 25 µL of FeCl3 solution (10 mM FeCl3 in 10 mM HCl) was added and the whole microplate was covered with a lid and incubated for 10 min on a microplate reader (shaking on for 2 min, off for 8 min, end with shaking off). The absorbance of the reaction mixture (Abs1) was recorded at a wavelength of 510 nm against the blank solution, consisting of the resuspension buffer and the FeCl3 solution. The absorbance of the reaction mixture (Abs2), consisting of the resuspended sample solution and 10 mM HCl, was recorded using the same method. The absorbance value Abs1 subtracted from Abs2 was used to estimate the polymeric tannin content. The PTC was estimated using a tannic acid (TA) calibration curve (y = 0.0047x + 0.0197, R2 = 0.9989). Different concentrations of TA in a dilution buffer (10, 50, 100, 200, 400 µg/mL) were used for the construction of the calibration curve. The PTC was expressed as µg/mL TA equivalent (TAE).

2.6. Proanthocyanidin Content

The proanthocyanidin content (PAC) of the wine samples was determined by using a slight modification of the vanillin-acetic acid assay described by Butler et al. [10]. To each well of a 96-well microplate, 30 μL of the wine sample and a dilution buffer were transferred and 150 μL of a vanillin working solution (0.5% in 4% HCl in acetic acid) was added. The microplate was covered with a lid and incubated at 25 °C for 4 min on a microplate reader (shaking on for 3 min, off for 1 min, end with shaking off). The absorbance of the reaction mixture (Abs1) was recorded at a wavelength of 500 nm against the blank solution consisting of the dilution buffer and the vanillin working solution. The absorbance of the reaction mixture (Abs2) consisting of the wine sample and 4% HCl in acetic acid solution was recorded using this method as well. The absorbance value Abs1 subtracted from Abs2 was used to estimate the proanthocyanidin content. The PAC was estimated using a (+)-catechin (C) calibration curve (y = 0.0061x + 0.0018, R2 = 0.9988). Different concentrations of catechin in a dilution buffer (10, 20, 40, 80, 160, 200, 300 µg/mL) were used for the construction of the calibration curve. The PAC was expressed as µg/mL catechin equivalent (CE).

2.7. Total Anthocyanin Content

The total anthocyanin content (TAC) was determined by using a slightly modified version of the pH differential method described by Panico et al. [15]. To each well of a 96-well microplate, 100 μL of the wine sample and the same volume of a pH 1.0 buffer (0.025 M KCl aqueous solution) were transferred and the plate was incubated for 4 min on a microplate reader (shaking on for 3 min, off for 1 min, end with shaking off). The absorbance of the reaction mixture (Abs1) was recorded at a wavelength of 520 nm against the blank solution consisting of a dilution buffer and a pH 1.0 buffer. In the same way, the absorbance of the reaction mixture (Abs2) consisting of the wine sample and a pH 4.5 buffer (0.4 M sodium acetate aqueous solution) was recorded against the blank solution consisting of both the dilution buffer and the pH 4.5 buffer. The absorbance value of Abs1–Abs2 was used to estimate the TAC. The TAC was estimated using a cyanidin-3-O-β-glucopyronoside (C3G) calibration curve (y = 0.0156x + 0.0265, R2 = 0.9998). Different concentrations of C3G in a dilution buffer (5, 10, 50, 100, 250 µg/mL) were used for the construction of the calibration curve. The TAC was expressed as µg/mL C3G equivalent (C3GE).

2.8. Interaction of Phenolic Compounds with Salivary Protein

The interaction of phenolic compounds with salivary protein was determined by turbidimetric assay as described by Soares et al. [16]. Pooled human saliva fluid was purchased from Innovative Research (Peary Court Novi, MI, USA) and defrosted immediately before the test. The saliva fluid was purified by centrifugation at 5000 rpm for 10 min after mixing with 10% TFA (final concentration 0.1%). The resulting supernatant was used to evaluate the interaction between phenolic compounds and salivary protein. The binding affinity of phenolic compounds to salivary protein was evaluated by nephelometry. Briefly, 5 µL of the wine sample was mixed with 200 µL of purified saliva fluid and incubated at 37 °C for 30 min. The absorbance of the mixture was measured at 600 nm. The turbidity of the wine samples was estimated using a formazin solution (4000 NTU calibration standard formazin; Sigma-Aldrich) calibration curve. Different unit concentrations of 10–1000 NTU formazin were used to construct the calibration curve (y = 0.0004x − 0.0011). The turbidity was expressed as the nephelometric turbidity unit (NTU).

2.9. Sensory Evaluation

An untrained panel of thirty-two people (twenty women and twelve men aged 27–58 years) evaluated the perceived astringency of 15 wines containing various concentrations of tannins and fermented from various grape breeding lines. All of the panelists were recruited from the National Institute of Horticultural and Herbal Science and consumed wine at least once a month. They were trained using a model wine containing 0.5 g/L of proanthocyanidins (determined by a vanillin-acetic acid assay). The panelists were familiarized with astringent intensities by using five standard wine samples containing 0.1, 0.2, 0.3, 0.4 and 0.5 g/L of proanthocyanidins, which were prepared by diluting the model wine. The astringent sensation and bitterness taste were distinguished by the mouth feelings: a dry and puckering-like feeling, which derived from the astringent sensation; or a pungent and acrid taste, which derived from the bitterness. All of the standard and test wines were maintained at room temperature for least 12 h prior to the evaluation. For the test, 5 mL of each wine was served as a test sample in a random order to the panelists and unsalted crackers and water were given freely for cleansing their palates. The panelists were instructed to wait at least 1 min between the test samples. The astringent intensities of the tested wine samples were scored using a five-point scale (Not at all–Slightly–Moderately–Very–Extremely) [17]. The study was approved by the Institutional Review Board (IRB) in October 2020 (P01-202010-13-002).

2.10. Statistical Analysis

Pearson’s correlation coefficients (r) and linear regression coefficients (r2) for the relationship between all of the astringent attributes and perceived astringency were estimated using OriginLab Pro software (OriginLab Corporation, Northampton, MA, USA). An analysis of variance (ANOVA) was applied followed by Duncan’s multiple range tests for mean comparisons using SPSS Statistics software (IBM Corp., Armonk, NY, USA). The significant differences were determined at p < 0.05 for all tests. All of the analyses were performed at least in triplicate.

3. Results and Discussion

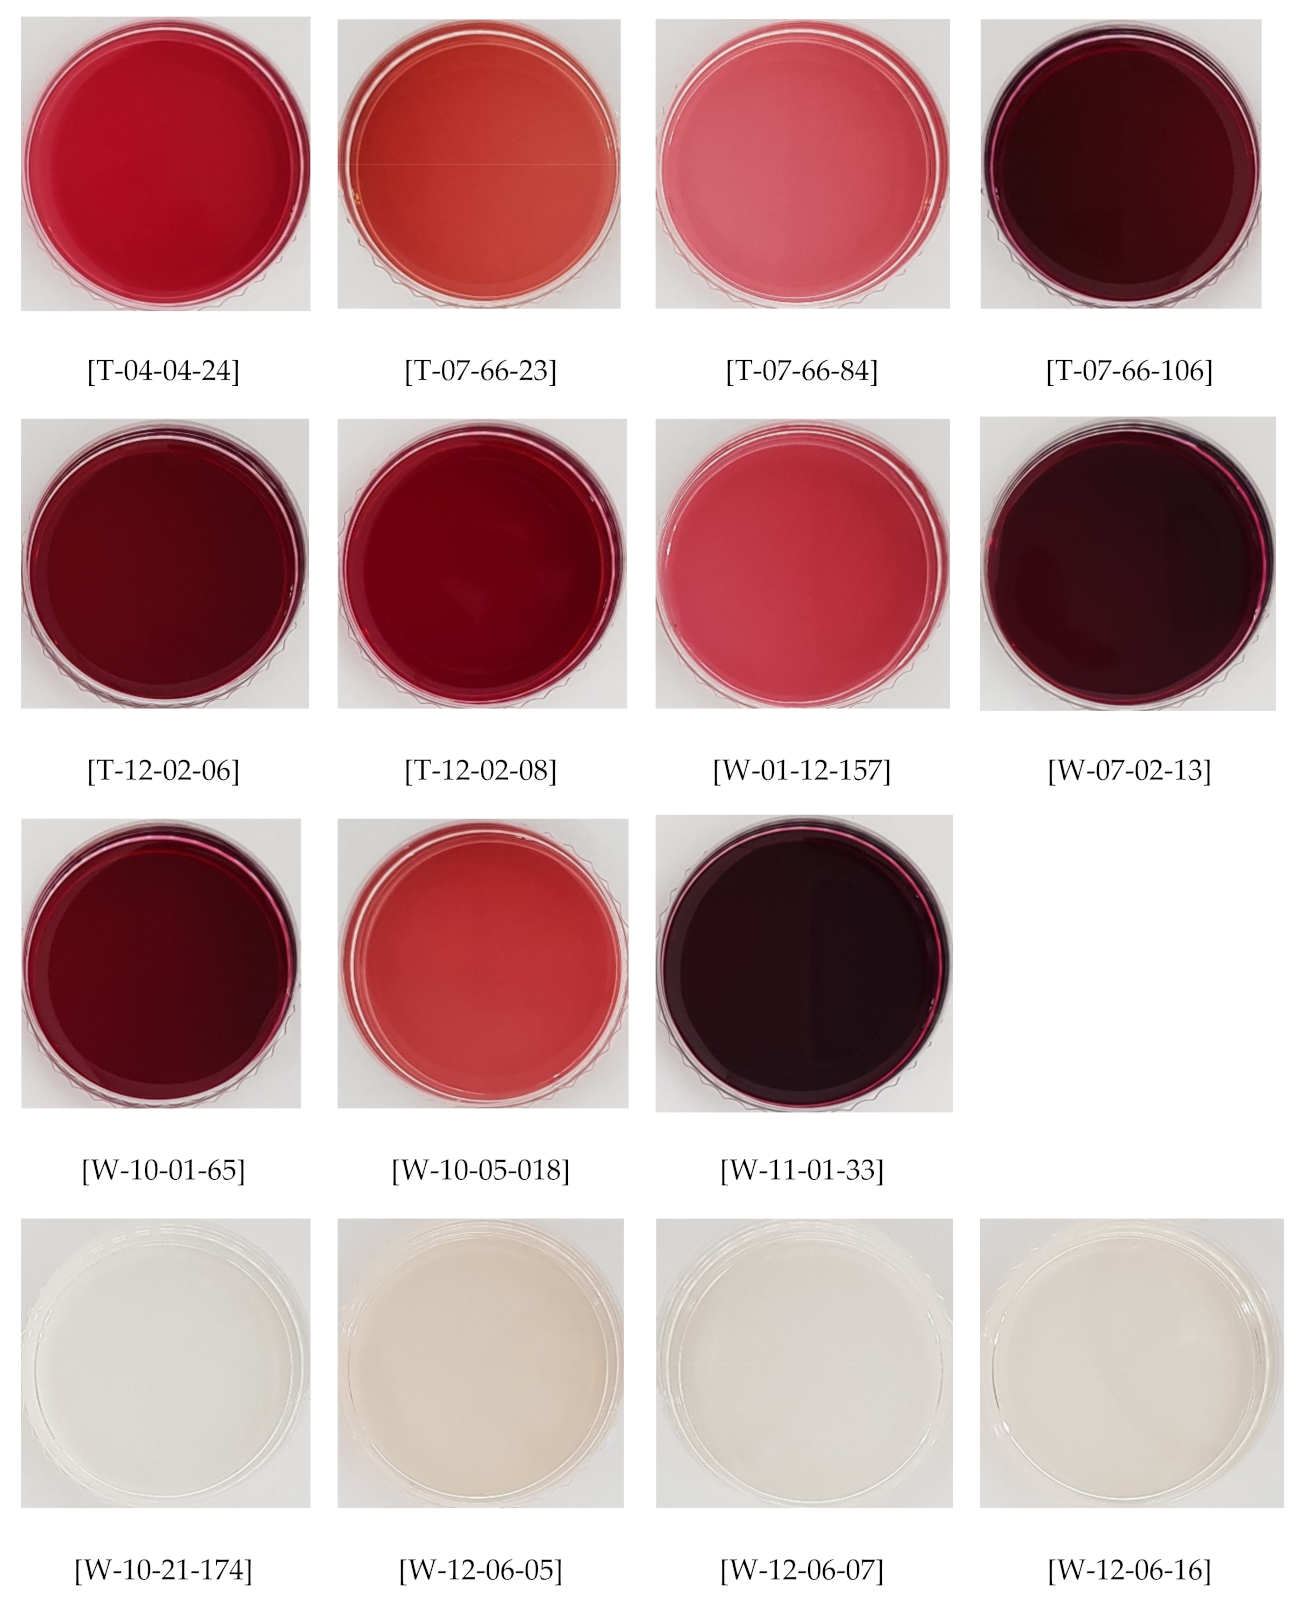
3.1. Color Characteristics

The visual appearance and color indices of wines made from the different breeding lines are presented in Figure 1 and Table 2, respectively. The color intensity (I) reflects the overall visual appearance of a wine [13]. In the red wines, therefore, the overall color intensity value was proportional to the darkness of the color of the red wines. Differences in color intensity were also proportional to the concentration of anthocyanin in wines as anthocyanin contributes greatly to the color of red wines. The color intensities of white wines were quite negligible compared with the red wines. The wine hue indicates the development of an orange color and can be estimated using the ratio of yellowness and redness of wines. Thus, wine hue values were higher in white wines containing no or trace amounts of anthocyanin, which is responsible for the red to violet color of red wines [18]. The contribution of pigments is expressed as a percentage of each pigment (yellow, red and blue).
Interestingly, the color intensity of red wines was proportional to the %Yellow pigments rather than the %Red pigments. The contribution of blue pigment was low (7–14%) regardless of the wine type.
The development of the wine color and variations in the color are associated with the composition and concentration of phenolic compounds, their oxidative transformation and the direct condensation of anthocyanins with other compounds during aging [19,20]. In the present study, variations in the color indices of the wines tested were likely to have been related to the compositional differences in the phenolic compounds rather than the other factors (i.e., oxidative transformation and condensation of anthocyanins) because all of the wine samples were similarly aged. The correlation coefficients between the total anthocyanin content and the color indices supported this. A strong positive correlation (r = 0.8231, p < 0.0002) was observed between the total anthocyanin content and color intensity (I). Furthermore, the total anthocyanin content showed a strong positive correlation (r = 0.7375, p < 0.0017) with %Red pigment but a strong negative correlation (r = − 0.7546, p < 0.0012) with %Yellow pigment. Our results were in agreement with previous studies [21], showing a strong positive correlation between color intensity and variables associated with the total anthocyanin content in grapes.

3.2. Phenolic Composition

The concentrations of the phenolic compounds (TPC, PAC, PTC and TAC) in wine samples are listed in Table 3 (values are expressed as the mean ± standard deviation (SD)).
The TPC of the red and white wines ranged from 858 to 2714 and 238 to 635 µg GAE/mL, respectively. The red wines were categorized in terms of the TPC into groups a–f, whereas the white wines were categorized into groups g–h. The results clearly indicated that the TPC values of the white wines were significantly lower than those of the red wines (p < 0.05) because the white wines contained no or only trace amounts of anthocyanidins (refer to the TAC value in Table 3). In the present study, the tannin content was estimated based on both the proanthocyanidin and polymeric tannin contents despite their similar phenolic composition because small differences in the phenolic composition can produce different sensory attributes. Regarding the phenolic composition, proanthocyanidins consist of monomeric, oligomeric and polymeric flavan-3-ols (i.e., catechin, epicatechin, epigallocatechin and epicatechin gallate) while polymeric tannins contain oligomeric and polymeric proanthocyanidins and hydrolysable tannins (i.e., tannic acid). As presented in Table 3, the breeding lines T-07-66-23, T-07-66-84, T-07-66-106, W-07-02-13 and W-10-21-174 contained 13–81 µg CE/mL of proanthocyanidins but no or only trace amounts of polymeric tannins. Based on this result, the proanthocyanidins in the wines were assumed to be either monomers or dimers or a mixture because the BSA used for precipitating the tannins did not bind to monomeric or dimeric tannins [22]. Furthermore, the two astringent attributes of the PTC and the PAC showed quite different correlation coefficients with perceived astringency in the correlation test. The PTC had a strong positive correlation coefficient (r = 0.7770, p < 0.0006) while the PAC was found to have a moderate positive correlation coefficient (r = 0.0.6635, p < 0.007) as shown in Figure 2.
However, these two attributes showed a strong positive coefficient (r = 0.8674, p < 0.0003) between them, as shown in Figure 3, because both contained relatively higher fractions of proanthocyanidins (monomer, oligomer and polymer) than the other phenolic compounds. The breeding lines W-12-06-05, W-12-06-07 and W-12-06-16, all producing white wines, showed relatively higher PAC values than those reported in another study [23] despite their low PTC values. White wines generally contain less than 30 µg/mL of flavan-3-ols (i.e., catechins and epicatechins) [24]. However, the abovementioned breeding lines appeared to contain high levels of monomeric or oligomeric flavan-3-ols. As expected, anthocyanins were not observed in any of the white wines while their amount varied in the red wines.
The binding affinity of the phenolic compounds in the wine samples to salivary proteins was expressed as a nephelometric turbidity unit (NTU) as shown in Table 3. The increase in the turbidity value corresponded to an increase in the binding affinity of the astringent compounds to salivary proteins. The red wines presented relatively stronger binding affinities (higher turbidity) than the white wines although no significant differences were observed between a number of the red wines (breeding lines T-07-66-23, T-07-66-84 and W-10-05-018) and white wines (breeding lines W-12-06-07 and W-12-06-16). The binding affinity of the astringent compounds to the salivary proteins can be affected by several factors, primarily their concentration, molecular size and molecular conformation [25]. The higher the concentration of phenolic compounds, the stronger the binding affinity to salivary proteins. Our results indicated that the highest binding affinity to the salivary proteins (41 × 103 NTU) was observed in the breeding line W-11-01-33, which also had the highest phenolics content. The lowest binding affinity (5.7 × 10³ NTU) was observed in the breeding line W-10-21-174, which had the lowest phenolics concentration.

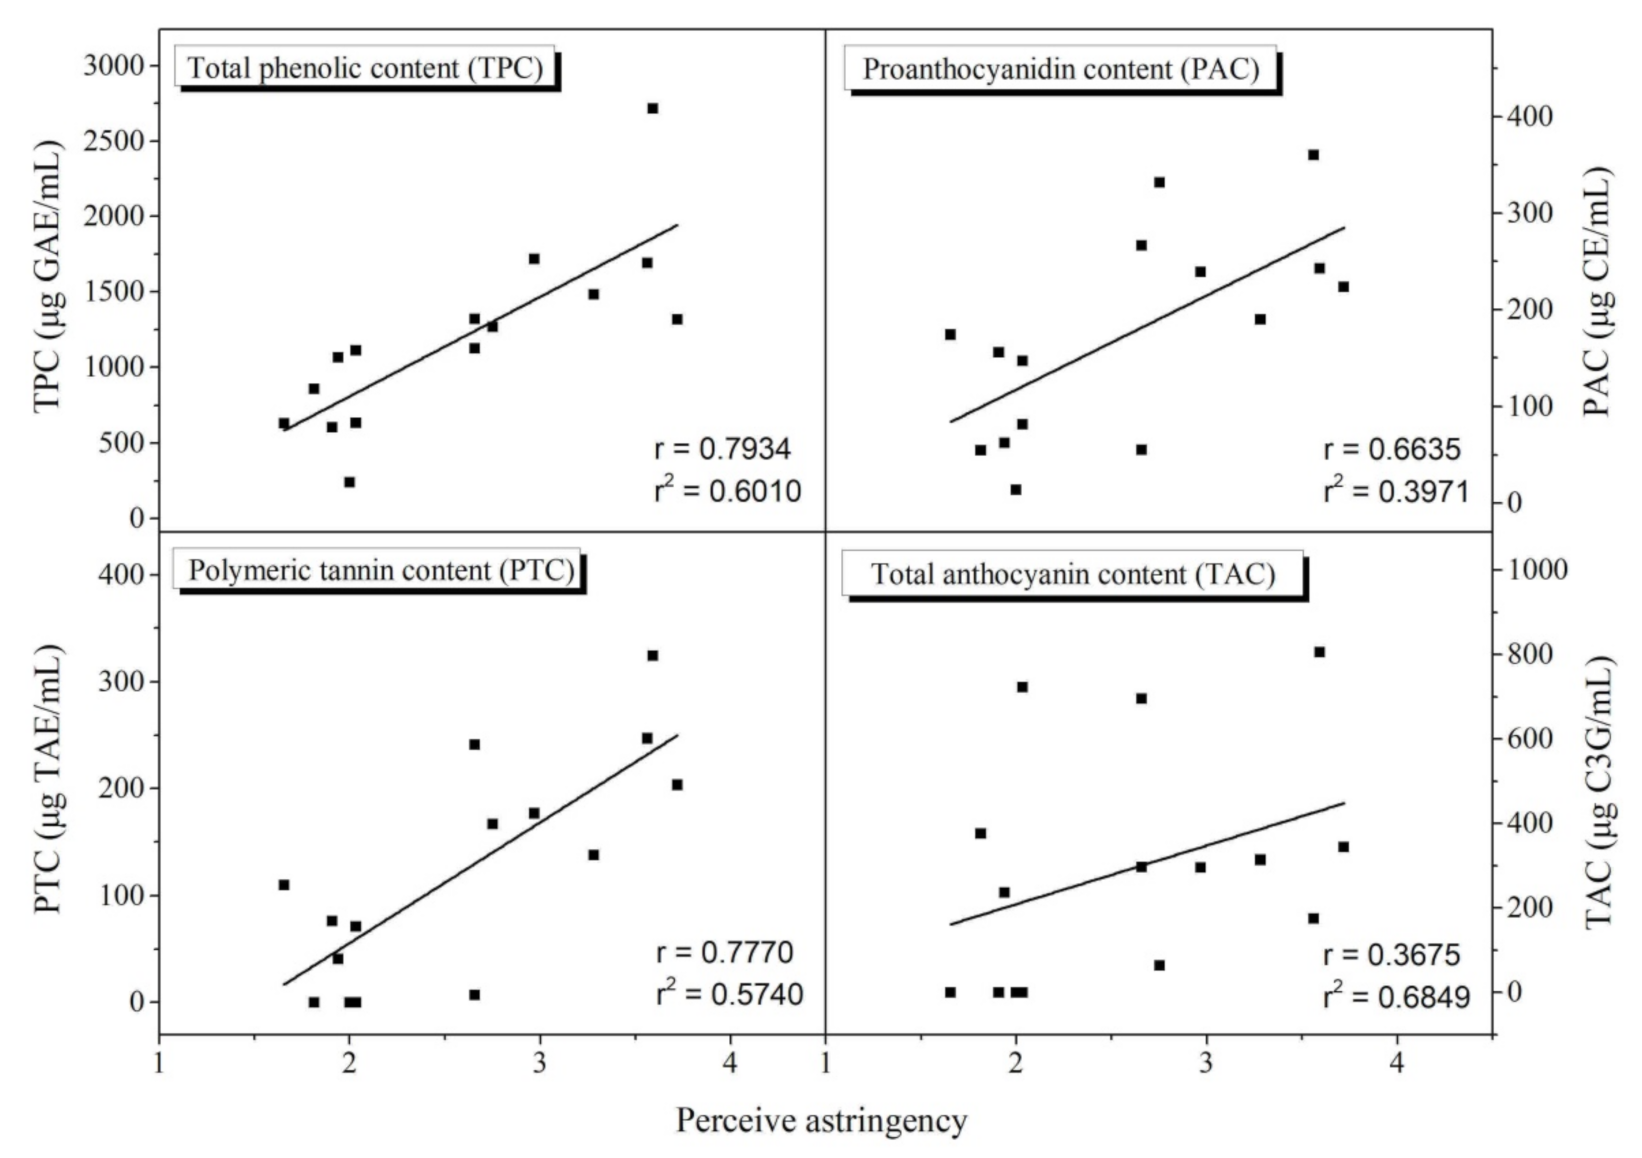
3.3. Correlations between Astringent Attributes and Perceived Astringency

Figure 2 shows the relationships between the astringent attributes and perceived astringency. The TPC and the PTC showed strong positive correlations with perceived astringency with coefficients of 0.7934 (p < 0.0004) and 0.7770 (p < 0.0006), respectively. These results are consistent with the previous report by Gonzalo-Diago et al. [26] in which the perceived astringency of wines was significantly correlated with the total polyphenol index and protein-precipitable proanthocyanidins. The PAC showed a moderate positive correlation with perceived astringency with a coefficient of 0.6635, which was lower than that of the PTC despite their similar phenolic compositions. Our results were in agreement with Caceres-Mella et al. [11] who compared four different estimation methods (BSA precipitation, methylcellulose precipitation, Bate-Smith assay and vanillin assay) for proanthocyanidin quantification and evaluated their relationships with perceived astringency and found higher correlation coefficient values in the precipitation methods (BSA and methylcellulose precipitation) than in the colorimetric methods (Bate-Smith and vanillin assay). The higher correlation coefficient value in the PTC compared with the PAC was most likely due to differences in the astringent intensity between the polymeric tannins and the monomeric ones. Many existing studies have suggested that the sensation of astringency is a tactile stimulation rather than one of taste or flavor.
Although the mechanism behind astringent sensation is not fully understood, the widely accepted principle is that polyphenols bind and precipitate proline-rich salivary proteins (PRPs) through hydrogen bonds and hydrophobic interactions. The precipitation of PRPs reduces the lubricating ability of saliva by decreasing viscosity and increasing friction. In this context, the astringent sensation associated with drinking wine is believed to be primarily governed by large molecular tannins such as polymeric proanthocyanidins, which contain a lot of hydrophobic residues and hydroxyl groups. The hydrophobic residues and hydroxyl groups in proanthocyanidins increase their binding affinity to proteins by enhancing intermolecular hydrophobic interactions and hydrogen bonds. Moreover, hydrolysable tannins, consisting of carbohydrates esterified with phenolic acids such as gallic acids or ellagic acids, were found to contribute to the astringent sensation as indicated by the results of the coefficients between perceived astringency and the PTC (Figure 2) and between the PAC and the PTC (Figure 3).
The TAC was found to be weakly correlated with perceived astringency (r = 0.3675, p > 0.05). However, this result was not reliable because the correlation between the TAC and perceived astringency was not statistically significant. According to previous reports, anthocyanins themselves do not seem to contribute to the perceived astringency of wines but rather affect astringency indirectly by forming polymeric pigments [27,28]. Cheynier et al. [27] noted that anthocyanins reacted with tannins directly to form new polymeric pigments during the fermentation and storage of wines. The resulting incorporation of anthocyanins into the tannin structure could decrease perceived astringency.

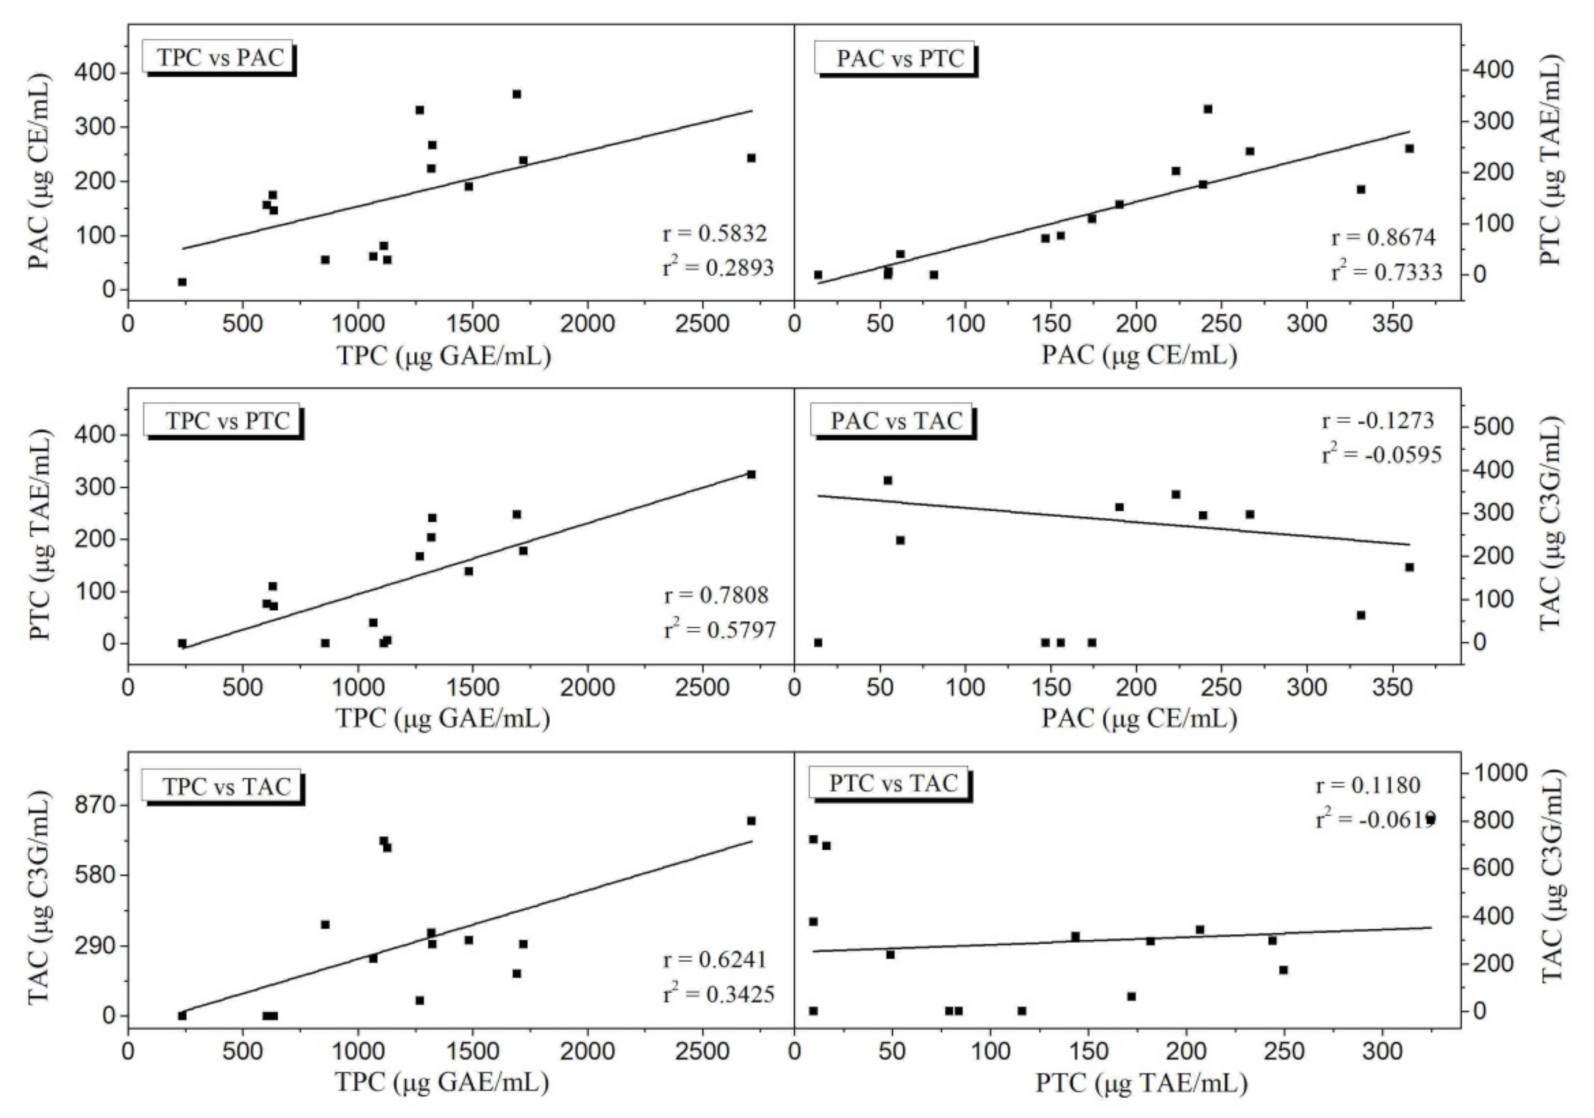
3.4. Correlations between Astringent Attributes

The relationships among the astringent attributes are shown in Figure 3. The correlation coefficients between the TPC and the PAC, the TPC and the PTC and the TPC and the TAC were 0.5832 (p < 0.02), 0.7808 (p < 0.0006) and 0.6241 (p < 0.0129), respectively. The TPC showed moderate to strong positive correlations with the other attributes because it covered all phenolic compounds present in wines (i.e., phenolic acids, anthocyanins, hydrolysable tannins and monomeric, oligomeric and polymeric proanthocyanidins). Notably, the strong positive correlation between the TPC and the PTC was consistent with their strong correlations with perceived astringency. These results indicated that polymeric tannins were the primary attribute of perceived astringency in wines while the other phenolic forms, namely, anthocyanins, phenolic acids and monomeric proanthocyanidins, were a minor attribute.
A strong positive correlation was observed between the PAC and the PTC (r = 0.8674, p < 0.0003) due to their similar phenolic compositions (Figure 3). The most abundant phenolic compounds in both the PTC and the PAC were proanthocyanidins as mentioned earlier; however, they were associated with different astringent intensities upon consumption. Proanthocyanidins consist of flavan-3-ols in monomeric, oligomeric and polymeric forms depending on the degree of polymerization (DP). The most abundant flavan-3-ol subunits present in wines are (+)-catechin and (-)-epicatechin. However, they also exist in galloylated form [25] while polymeric tannins contain oligomeric and high-molecular flavan-3-ols. Thus, the differences in astringent intensity between the PAC and the PTC may be derived from their differences in composition. This result ties in well with the results of previous studies. For example, Ma et al. [29] evaluated the tannin-salivary protein complex and found no remarkable binding affinity between monomeric flavan-3-ols and salivary proteins but a gradual increase of binding affinity with the increase of DP of flavan-3-ols. Furthermore, Peleg et al. [30] observed an increasing trend in astringency intensity as the DP of flavan-3-ols increased from monomer to trimer. The PAC and the PTC showed negligible correlations with the TAC (r = −0.1273 and 0.1186, respectively), as shown in Figure 3, but were not statistically significant.

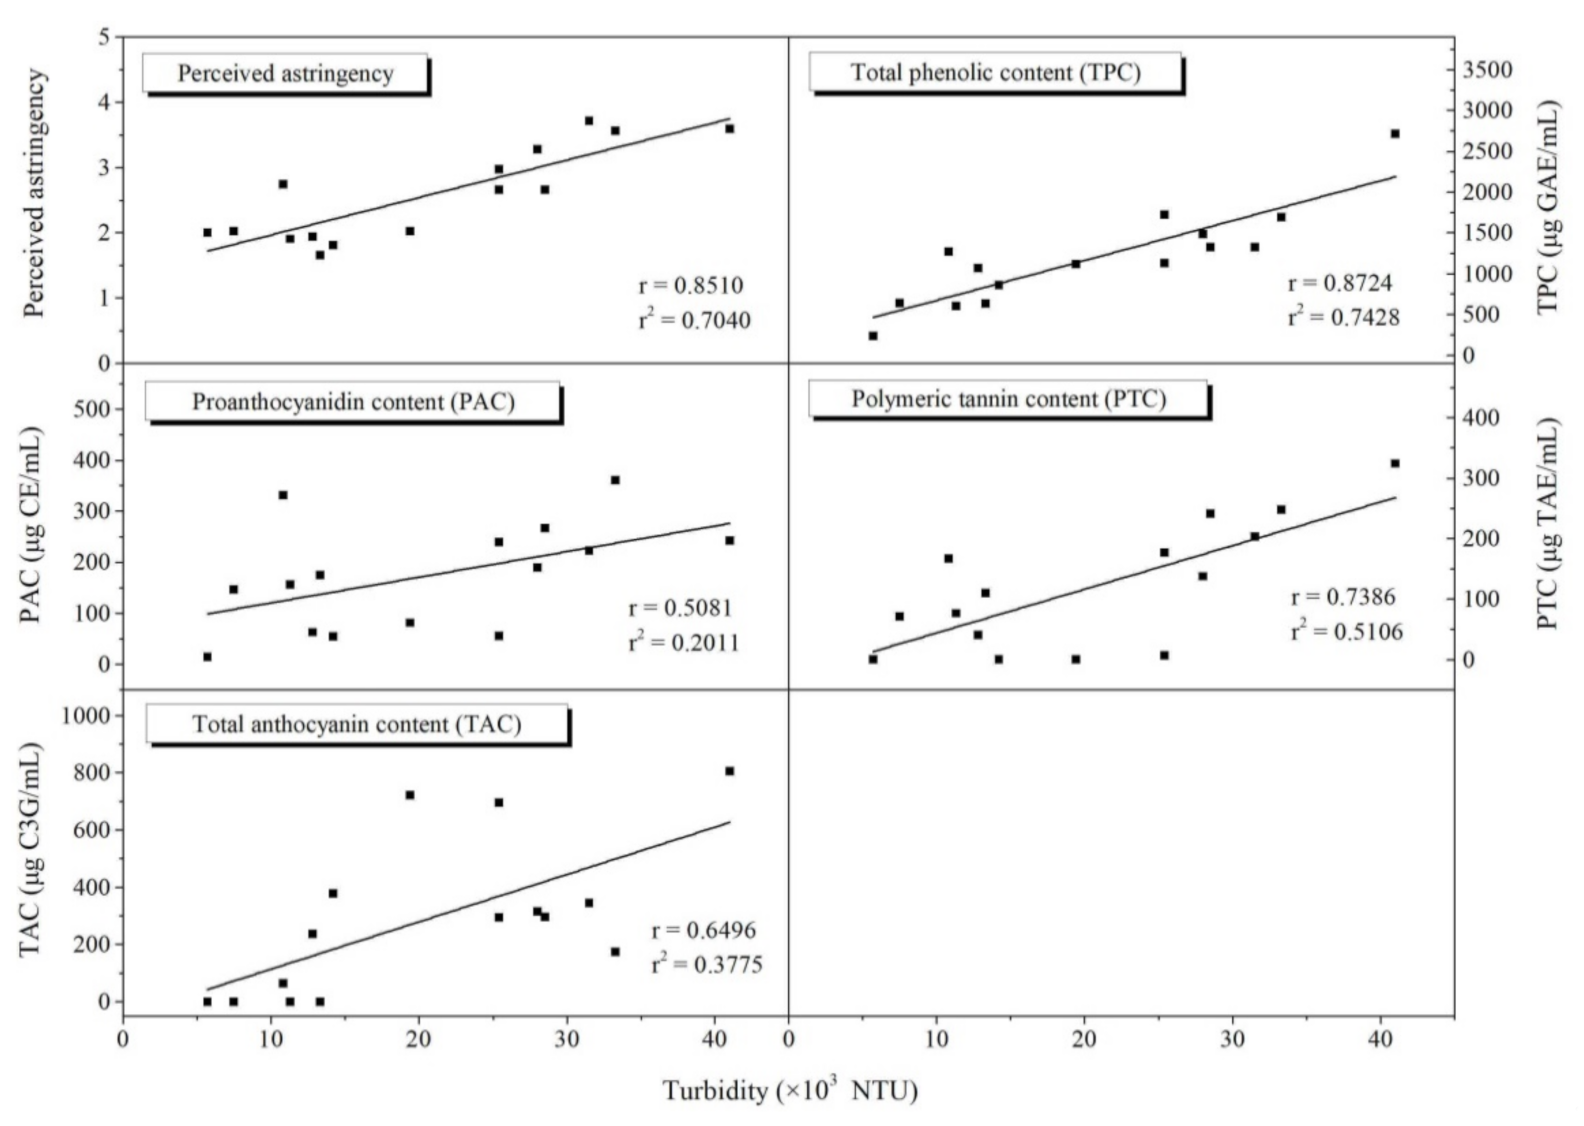
3.5. Correlations between Phenolic/Salivary Protein Interaction and Astringent Attributes

Measuring the interaction and binding affinity between wine constituents and salivary proteins is more reliable for predicting the astringency of wines than determining the concentrations of astringent compounds. This is due to the fact that saliva fluid (containing salivary proteins) contributes directly to the perception of taste and mouthfeel. Therefore, the binding ability of phenolic compounds in wine samples to salivary proteins was determined and expressed as NTU turbidity units. In this context, the correlation of turbidity with astringent attributes was determined (Figure 4).
The turbidity showed a strong positive correlation with perceived astringency (r = 0.8510, p < 0.0001). The TPC showed the highest correlation with turbidity (r = 0.8724, p < 0.0001) followed by the PTC (r = 0.7386, p < 0.0016), the TAC (r = 0.6496, p < 0.0088) and the PAC (r = 0.5081, p > 0.05). From the results, it was noted that the TPC and the PTC were strongly correlated in terms of their binding affinity to salivary proteins, which was consistent with their strong correlation with perceived astringency, as shown in Figure 2. The TAC showed a moderate correlation with turbidity, indicating that it contributed less to perceived astringency than the TPC and the PTC. On the other hand, although a moderate correlation was observed between the PAC and turbidity, this was not reliable due to the lack of statistical significance (p > 0.05).
Interestingly, a moderate correlation was observed between the TAC and turbidity despite the weak correlation between the TAC and perceived astringency. We assumed that a number of anthocyanins bound to salivary proteins to form an anthocyanin-protein complex in a similar manner as proanthocyanidins. However, the binding affinity of anthocyanidins is not enough for a significant impact on the perception of astringency. This result is in agreement with Paissoni et al. [31] who determined the binding affinity of various forms of anthocyanins to BSA and salivary protein to evaluate the effect of anthocyanin-protein complex formation on in-mouth sensory properties. Their results indicated that anthocyanins formed an anthocyanin-protein complex, thereby inducing astringency and bitterness perceptions. Nevertheless, they assumed that proanthocyanidins (i.e., monomeric, oligomeric and polymeric flavan-3-ols) were the major contributors to an astringent sensation rather than anthocyanins.

4. Conclusions

The present study estimated the concentrations of phenolic compounds including the TPC, the PTC, the PAC and the TAC in wines made from a variety of grape breeding lines and evaluated their relationships with perceived astringency. The TPC and the PTC showed strong positive correlations with perceived astringency. On the other hand, the PAC showed a moderate positive correlation with perceived astringency that was lower than the correlation with the PTC despite their similar phenolic composition. Unlike the other attributes, the TAC showed a weak correlation with perceived astringency. The strong correlations between the PTC and perceived astringency and between the TPC and the PTC indicated that polymeric flavan-3-ols are the main contributor to astringency in wines. Other phenolic compounds such as monomeric flavan-3-ols, anthocyanins and phenolic acids appear to contribute in a minor way to the development of astringent sensations. Anthocyanins were closely related to the color of wines rather than astringent perception. The results indicated that the total phenolic content and the polymeric tannin content are good indicators of the overall astringency of wines and can be utilized for the primary screening of grape breeding lines suitable for wine-making.

Author Contributions

Conceptualization, Methodology, Investigation, Writing—review draft preparation and editing, K.-O.C.; Conceptualization, Methodology, Investigation, Writing—review draft preparation, D.H.L.; Study conception and design, Methodology, S.J.P.; Conceptualization, Methodology, Investigation, Writing—review draft preparation, D.I.; Conceptualization, Methodology, Investigation, Writing—review draft preparation, Y.Y.H. All authors have read and agreed to the published version of the manuscript.

Funding

This work was supported by a grant from the Research Project for Agricultural Science and Technology Department (PJ01272902), Rural Development Administration, Wanju, Korea.

Conflicts of Interest

The authors declare no conflict of interest.

References

  1. Landon, J.; Weller, K.; Harbertson, J.; Ross, C. Chemical and sensory evaluation of astringency in Washington state red wines. Am. J. Enol. Viticult. 2008, 59, 153–158. [Google Scholar]
  2. Bautista, A.B.O.; Busse, N.V.; Fernandez, J.I.F.; Gomez, E.P.; Gil, R.M. The extraction kinetics of anthocyanins and proanthocyanidins from grape to wine in three different varieties. J. Int. Sci. Vigne Vin 2016, 50, 91–100. [Google Scholar] [CrossRef]
  3. Bahena-Garrido, S.M.; Ohama, T.; Suehiro, Y.; Hata, Y.; Isogai, A.; Iwashita, K.; Goto-Yamamoto, N.; Koyama, K. The potential aroma and flavor compounds inVitissp. cv. Koshu andV. viniferaL. cv. Chardonnay under different environmental conditions. J. Sci. Food Agric. 2019, 99, 1926–1937. [Google Scholar] [CrossRef] [PubMed]
  4. Garrido, J.; Borges, F. Wine and grape polyphenols—A chemical perspective. Food Res. Int. 2013, 54, 1844–1858. [Google Scholar] [CrossRef] [Green Version]
  5. Liaudanskas, M.; Viškelis, P.; Jakštas, V.; Raudonis, R.; Kviklys, D.; Milašius, A.; Janulis, V. Application of an Optimized HPLC Method for the Detection of Various Phenolic Compounds in Apples from Lithuanian Cultivars. J. Chem. 2014, 2014, 1–10. [Google Scholar] [CrossRef]
  6. Gamella, M.; Campuzano, S.; Reviejo, A.; Pingarrón, J.M.; Campuzano, S. Electrochemical Estimation of the Polyphenol Index in Wines Using a Laccase Biosensor. J. Agric. Food Chem. 2006, 54, 7960–7967. [Google Scholar] [CrossRef]
  7. Hossain, M.A.; Shah, M.D. A study on the total phenols content and antioxidant activity of essential oil and different solvent extracts of endemic plant Merremia borneensis. Arab. J. Chem. 2015, 8, 66–71. [Google Scholar] [CrossRef] [Green Version]
  8. Blainski, A.; Lopes, G.C.; De Mello, J.C.P. Application and Analysis of the Folin Ciocalteu Method for the Determination of the Total Phenolic Content from Limonium Brasiliense L. Molecules 2013, 18, 6852–6865. [Google Scholar] [CrossRef] [Green Version]
  9. Deluc, L.; Bogs, J.; Walker, A.R.; Ferrier, T.; Decendit, A.; Merillon, J.-M.; Robinson, S.P.; Barrieu, F. The Transcription Factor VvMYB5b Contributes to the Regulation of Anthocyanin and Proanthocyanidin Biosynthesis in Developing Grape Berries. Plant Physiol. 2008, 147, 2041–2053. [Google Scholar] [CrossRef] [Green Version]
  10. Butler, L.G.; Price, M.L.; Brotherton, J.E. Vanillin assay for proanthocyanidins (condensed tannins): Modification of the solvent for estimation of the degree of polymerization. J. Agric. Food Chem. 1982, 30, 1087–1089. [Google Scholar] [CrossRef]
  11. Cáceres-Mella, A.; Peña-Neira, Á.; Narváez-Bastias, J.; Jara-Campos, C.; López-Solís, R.; Canals, J.M. Comparison of analytical methods for measuring proanthocyanidins in wines and their relationship with perceived astringency. Int. J. Food Sci. Technol. 2013, 48, 2588–2594. [Google Scholar] [CrossRef]
  12. Kim, H.I.; Hur, Y.Y.; Jung, S.M.; Im, D.J.; Chung, K.H.; Kim, S.J. Comparison of volatile compounds in juices and wines of white grape cultivars Cheongsoo, Chardonnay, and Riesling. Korean J. Food Preserv. 2018, 25, 165–172. [Google Scholar] [CrossRef]
  13. Babincev, L.M.; Gurešić, D.M.; Simonović, R.M. Spectrophotometric characterization of red wine color from the vineyard region of Metohia. J. Agric. Sci. 2016, 61, 281–290. [Google Scholar] [CrossRef] [Green Version]
  14. Harbertson, J.F.; Mireles, M.; Yu, Y. Improvement of BSA Tannin Precipitation Assay by Reformulation of Resuspension Buffer. Am. J. Enol. Vitic. 2014, 66, 95–99. [Google Scholar] [CrossRef]
  15. Panico, A.M.; Garufi, F.; Nitto, S.; Di Mauro, R.; Longhitano, R.; Magrì, G.; Catalfo, A.; Serrentino, M.; De Guidi, G. Antioxidant activity and phenolic content of strawberry genotypes from Fragariaxananassa. Pharm. Biol. 2009, 47, 203–208. [Google Scholar] [CrossRef] [Green Version]
  16. Soares, S.; Sousa, A.; Mateus, N.; De Freitas, V. Effect of Condensed Tannins Addition on the Astringency of Red Wines. Chem. Senses 2011, 37, 191–198. [Google Scholar] [CrossRef] [Green Version]
  17. Sheridan, M.K.; Elias, R.J. Exogenous acetaldehyde as a tool for modulating wine color and astringency during fermentation. Food Chem. 2015, 177, 17–22. [Google Scholar] [CrossRef]
  18. De Freitas, V.; Fernandes, A.; Oliveira, J.; Teixeira, N.; Mateus, N. A review of the current knowledge of red wine colour. OENO One 2017, 51, 1–15. [Google Scholar] [CrossRef]
  19. Márquez, A.; Serratosa, M.P.; Merida, J. Pyranoanthocyanin Derived Pigments in Wine: Structure and Formation during Winemaking. J. Chem. 2013, 2013, 1–15. [Google Scholar] [CrossRef]
  20. Cosme, F.; Vilela, A.; Jordão, A.M.; Desk, S. Wine phenolics: Looking for a smooth mouthfeel. SDRP J. Food Sci. Technol. 2017, 1, 20–28. [Google Scholar] [CrossRef] [Green Version]
  21. Martí, N.; Lizama, V.; Verdú, J.; Muñoz, N.; Aleixandre, J.; Saura, D. Prediction of Phenolic Composition of Monastrell and Tempranillo Wines: Correlation between Phenolic Content and Traditional Variables of Fruit Maturity. Int. J. Food Prop. 2014, 18, 465–479. [Google Scholar] [CrossRef] [Green Version]
  22. Harbertson, J.F.; Kilmister, R.L.; Kelm, M.A.; Downey, M.O. Impact of condensed tannin size as individual and mixed polymers on bovine serum albumin precipitation. Food Chem. 2014, 160, 16–21. [Google Scholar] [CrossRef] [PubMed]
  23. De Lima, M.T.R.; Kelly, M.T.; Cabanis, M.-T.; Blaise, A. Levels of phenolic acids, catechin and epicatechin in wines of Portugal and the Azores prodece from different varieties and vintages. OENO One 2006, 40, 47. [Google Scholar] [CrossRef] [Green Version]
  24. McRae, J.M.; Kennedy, J.A. Wine and Grape Tannin Interactions with Salivary Proteins and Their Impact on Astringency: A Review of Current Research. Molecules 2011, 16, 2348–2364. [Google Scholar] [CrossRef] [PubMed] [Green Version]
  25. Lesschaeve, I.; Noble, A.C. Polyphenols: Factors influencing their sensory properties and their effects on food and beverage preferences. Am. J. Clin. Nutr. 2005, 81, 330–335. [Google Scholar] [CrossRef] [PubMed] [Green Version]
  26. Gonzalo-Diago, A.; Dizy, M.; Fernández-Zurbano, P. Taste and Mouthfeel Properties of Red Wines Proanthocyanidins and Their Relation to the Chemical Composition. J. Agric. Food Chem. 2013, 61, 8861–8870. [Google Scholar] [CrossRef] [PubMed] [Green Version]
  27. Cheynier, V.; Duenas, M.P.; Salas, E.; Maury, C.; Souquet, J.M.; Sarni Manchado, P.; Fulcrand, H. Structure and properties of wine pigments and tannins. Am. J. Enol. Viticult. 2006, 57, 298–305. [Google Scholar]
  28. Sánchez-Moreno, C.; Cao, G.; Ou, A.B.; Prior, R.L. Anthocyanin and Proanthocyanidin Content in Selected White and Red Wines. Oxygen Radical Absorbance Capacity Comparison with Nontraditional Wines Obtained from Highbush Blueberry. J. Agric. Food Chem. 2003, 51, 4889–4896. [Google Scholar] [CrossRef]
  29. Li, H.; Waffo-Teguo, P.; Jourdes, M.; Li, H.; Teissedre, P.-L. Chemical Affinity between Tannin Size and Salivary Protein Binding Abilities: Implications for Wine Astringency. PLoS ONE 2016, 11, e0161095. [Google Scholar] [CrossRef] [Green Version]
  30. Peleg, H.; Gacon, K.; Schlich, P.; Noble, A. Bitterness and astringency of flavan-3-ol monomers, dimers and trimers. J. Sci. Food Agric. 1999, 79, 1123–1128. [Google Scholar] [CrossRef]
  31. Paissoni, M.A.; Waffo-Teguo, P.; Li, H.; Jourdes, M.; Rolle, L.; Teissedre, P.-L. Chemical and sensorial investigation of in-mouth sensory properties of grape anthocyanins. Sci. Rep. 2018, 8, 17098. [Google Scholar] [CrossRef] [PubMed]
Figure 1. Visual appearances of wines made from different breeding lines.
Applsci 10 08020 g001
Figure 2. Plots of the correlations between perceived astringency and the TPC, the PAC, the PTC and the TAC.
Applsci 10 08020 g002
Figure 3. Plots of the correlations between the TPC and the PAC, the TPC and the PTC, the TPC and the TAC, the PAC and the PTC, the PAC and the TAC and the PTC and the TAC.
Applsci 10 08020 g003
Figure 4. Plots of the correlations between turbidity and perceived astringency, the TPC, the PAC, the PTC and the TAC.
Applsci 10 08020 g004
Table 1. List of grape breeding lines and their parentages.
ClassBreeding LinesParentage (Ovary × Pollen)
RedT-04-04-24Alden × Cheongsoo
T-07-66-23Wonkyo Ra-05 × Chancellor
T-07-66-84Muller Thurgau × Cheongsoo
T-07-66-106Wonkyo Ra-05 × Chancellor
T-12-02-06Bailey Alicante A × Wase Neo Muscat
T-12-02-08Bailey Alicante A × Wase Neo Muscat
W-01-12-157Schulyer × Black Sanjaku
W-07-02-13Black Pegaru × Baco 1
W-10-01-65Zweigeltrebe × Muscat Bailey A
W-10-05-018Cabernet Sauvignon × Muscat Bailey A
W-11-01-33Bailey Alicante A × Merlot
WhiteW-10-21-174Wonkyo Ra-05 × Chancellor
W-12-06-05Chasselas Rouge × Cheongsoo
W-12-06-07Chasselas Rouge × Cheongsoo
W-12-06-16Chasselas Rouge × Cheongsoo
Table 2. Color differences of wines made from different breeding lines.
ClassBreeding LinesColor Intensity
(I)
Hue
(T)
% Color Compounds
YellowRedBlue
RedT-04-04-242.370.5833589
T-07-66-231.100.8341509
T-07-66-841.531.148449
T-07-66-1065.100.4126659
T-12-02-065.140.51305911
T-12-02-085.500.4328648
W-01-12-1571.240.737549
W-07-02-134.040.5533608
W-10-01-655.950.45286210
W-10-05-0181.400.82414910
W-11-01-3311.990.54305614
WhiteW-10-21-1740.073.7272199
W-12-06-050.242.2865296
W-12-06-070.112.3965287
W-12-06-160.122.1864297
Table 3. Concentrations of phenolic compounds in wines made from different breeding lines.
ClassBreeding LinesPhenolic Compounds (μg/mL)Turbidity
(×103 NTU 5)
TPC 1PAC 2PTC 3TAC 4
RedT-04-04-241324 ± 9 d266.7 ± 19.9 c241.2 ± 33.1 b296.6 ± 12.3 e28.5 ± 1 bc
T-07-66-23858 ± 19 f54.7 ± 9 hN/D376.4 ± 12.5 c14.2 ± 3.1 de
T-07-66-841067 ± 30 e62.2 ± 13.1 h40.4 ± 1.7 h236.8 ± 9.2 f12.8 ± 2.6 de
T-07-66-1061114 ± 24 e81.6 ± 18.8 hN/D722.4 ± 52.8 b19.4 ± 2.9 cd
T-12-02-061720 ± 42 b239.2 ± 26.3 d177.1 ± 26.5 cd295 ± 14.8 e25.4 ± 3.4 bc
T-12-02-081484 ± 42 c190.2 ± 28.7 e137.7 ± 15.7 ef314.2 ± 12.8 de28 ± 7.1 bc
W-01-12-1571693 ± 102 b360.1 ± 34.9 a247.1 ± 46.1 b174.6 ± 2.9 g33.3 ± 11.9 ab
W-07-02-131129 ± 28 e55.1 ± 8 h7 ± 0.6 i695 ± 9 b25.4 ± 4.7 bc
W-10-01-651320 ± 30 d223.3 ± 26.8 d203.3 ± 25.8 c343.7 ± 19 cd31.5 ± 4 b
W-10-05-0181270 ± 12 d331.4 ± 28 b167.2 ± 8.1 de63.5 ± 5.9 h10.8 ± 1.5 de
W-11-01-332714 ± 95 a242.3 ± 29.6 cd324.3 ± 6.4 a804.9 ± 56.2 a41 ± 9.7 a
WhiteW-10-21-174238 ± 4 h13.9 ± 2.7 iN/DN/D5.7 ± 1 e
W-12-06-05635 ± 7 g146.9 ± 23.8 g71.2 ± 2.3 gN/D7.5 ± 1.4 e
W-12-06-07631 ± 7 g174.2 ± 15.7 ef109.5 ± 7.7 fN/D13.3 ± 3.4 de
W-12-06-16604 ± 11 g155.9 ± 20.8 fg76.3 ± 7.5 gN/D11.3 ± 2.5 de
1 TPC: Total phenolic content; 2 PAC: Proanthocyanidin content; 3 PTC: Polymeric tannin content; 4 TAC: Total anthocyanidin content; 5 NTU: Nephelometric turbidity unit; N/D: Not detected; Means not sharing the same letter(s) in the same column were significantly different by Duncan’s multiple range tests (p < 0.05).
Publisher’s Note: MDPI stays neutral with regard to jurisdictional claims in published maps and institutional affiliations.

