Article

The Use of Artificial Intelligence Methods to Assess the Effectiveness of Lean Maintenance Concept Implementation in Manufacturing Enterprises

1
Department of Manufacturing Processes and Production Engineering, Faculty of Mechanical Engineering and Aeronautics, Rzeszow University of Technology, Al. Powstańców Warszawy 8, 35-959 Rzeszów, Poland
2
Department of Computer Science, Faculty of Mechanical Engineering and Aeronautics, Rzeszow University of Technology, Al. Powstańców Warszawy 8, 35-959 Rzeszów, Poland
3
Department of Production Computerisation and Robotisation, Faculty of Mechanical Engineering, Lublin University of Technology, ul. Nadbystrzycka 36, 20-618 Lublin, Poland
*
Author to whom correspondence should be addressed.
Appl. Sci. 2020, 10(21), 7922; https://doi.org/10.3390/app10217922
Submission received: 19 October 2020 / Revised: 2 November 2020 / Accepted: 6 November 2020 / Published: 8 November 2020
(This article belongs to the Special Issue Design and Management of Manufacturing Systems)

Abstract

:
The increase in the performance and effectiveness of maintenance processes is a continuous aim of production enterprises. The elimination of unexpected failures, which generate excessive costs and production losses, is emphasized. The elements that influence the efficiency of maintenance are not only the choice of an appropriate conservation strategy but also the use of appropriate methods and tools to support the decision-making process in this area. The research problem, which was considered in the paper, is an insufficient means of assessing the degree of the implementation of lean maintenance. This problem results in not only the possibility of achieving high efficiency of the exploited machines, but, foremost, it influences a decision process and the formulation of maintenance policy of an enterprise. The purpose of this paper is to present the possibility of using intelligent systems to support decision-making processes in the implementation of the lean maintenance concept, which allows the increase in the operational efficiency of the company’s technical infrastructure. In particular, artificial intelligence methods were used to search for relationships between specific activities carried out under the implementation of lean maintenance and the results obtained. Decision trees and rough set theory were used for the analysis. The decision trees were made for the average value of the overall equipment effectiveness (OEE) indicator. The rough set theory was used to assess the degree of utilization of the lean maintenance strategy. Decision rules were generated based on the proposed algorithms, using RSES software, and their correctness was assessed.

1. Introduction

Obtaining appropriate reliability and quality of products requires proper methods of enterprise management, production, and the means necessary for its implementation [1]. These methods allow for the coordination and integration of all company functions [2]. One of the elements affecting the high quality of a product is the condition of technological machines maintained in enterprises [3,4,5]. Its suitability and technical condition largely determine the quality and competitiveness of a product.
Maintenance management is a critical issue amongst management activities of manufacturing organizations [6,7,8]. Therefore, in recent years, intensive efforts have been made to propose and improve maintenance strategies that aim to extend the useful life of every piece of existent equipment, increase its availability, and guarantee higher levels of reliability [9,10,11].
In recent decades, maintenance was regarded as a necessary evil in managing an organization, because it was limited to the appropriate functions that are usually performed in emergency situations, such as a machine failure. However, this practice is no longer acceptable, because the role of maintenance has been recognized as a strategic element of generating revenues for the organization [1].
The maintenance process in enterprises was not always carried out in a way that ensures the minimization of outlays while maximizing the achieved effects in service and maintenance processes. In practice, obtaining the maximum benefits from the operation of a technological machine system requires an optimal solution to a number of tasks [12,13]. For a larger number of machines, it creates the need for appropriate system modelling, simulation research, and optimization of partial and complex tasks based on the adopted optimization criteria [14]. Accordingly, the company must establish a maintenance system that enables these activities to be carried out in an optimal manner from the point of view of resource pro-vision and its effectiveness [15]. These activities are usually carried out in accordance with a specific exploitation strategy that has been developed with the development of production systems. Most of the enterprises with foreign capital managed to organize effective maintenance [16]. However, small and medium enterprises are still looking for the right method for their reorganization as well as for the right way of supervising technological machines and equipment that would allow for improving effectiveness as well as for using it in a manufacturing process. That is why, some organizations have started implementing lean methods and tools in the area of maintenance defined as lean maintenance [17]. Lean maintenance is a proactive maintenance strategy whose main goal is to support reliability in the most effective, cost-effective way possible, which means keeping costs to a minimum while ensuring high efficiency and productivity. This philosophy is mainly based on the concept of total productive maintenance (TPM), the idea of which is to involve all employees at every level of the organization in maintenance and management tasks [18].
This paper presents the possibilities of using intelligent systems to support decision-making processes in the implementation of the lean maintenance concept. The aim of the article is to indicate the methods and tools of lean maintenance, which have the greatest impact on increasing the effectiveness of the enterprise. The obtained research results indicate which lean maintenance methods and tools should be implemented in the company in the first place to increase the efficiency, quality, and availability of its production processes. This problem is particularly important from the point of view of small- and medium-sized enterprises, which do not always have adequate human or financial resources to implement modern concepts in a wide range. The methodology used in the work is based on the use of artificial intelligence methods (decision trees, rough set theory), which allows for the identification of factors influencing the effectiveness of lean maintenance implementation by enterprises. The second chapter of the article contains the background. Section 3 describes the problem formulation and methodology. Section 4 presents the results of research on the use of the overall equipment effectiveness (OEE) indicator in enterprises and the concept of using artificial intelligence (AI) methods to assess the effectiveness of the implementation of the lean maintenance concept. The work is summarized with conclusions and a proposal for further work.

2. Literature Review

2.1. Lean Manufacturing as the Foundation of Lean Maintenance

Global industry in the 21st century motivates companies to seek and implement a more competitive production system. Many of them implement or plan to implement lean manufacturing. Lean manufacturing philosophy is mainly used in industry to increase efficiency and productivity. It was developed in the 1990s and is mainly based on the Toyota Production System (TPS) [19].
The basis of this concept is the elimination of unnecessary losses that have a significant impact on productivity and profit. These losses can be divided into three main types: Muda, Mura, and Muri. Muda identifies seven types of waste, which include transportation, supplies, redundant movement, waiting, overproduction, over processing, and defects. Mura means unevenness, non-uniformity, and irregularity and is the reason for the existence of any of the seven wastes. Finally, Muri means overburden, beyond one’s power, excessiveness, impossible, or unreasonableness and can result from Mura and, in some cases, can be caused by excessive removal of Muda from the process [20,21,22].
Production using the lean manufacturing philosophy should consist of reducing the amount of losses related to people, inventory, time to market, and production space, so as to obtain a highly reactive demand for customer needs, while producing high-quality products in the most efficient and cost-effective manner [23]. Lean manufacturing can be a cost reduction mechanism, and if properly implemented, it will make it a world-class organization [24], and importantly, lean manufacturing can be used in all industries [19,25].
Many organizations have embarked on the practice of using “lean tools” primarily to eliminate wasted production. It is widely recognized that organizations that have applied lean manufacturing methods have significant cost and quality advantages over those that continue to use traditional manufacturing [23]. It turns out that organizations pay more and more attention to maintenance, which is why some organizations have started to practice lean maintenance in addition to lean manufacturing.
Lean maintenance is a concept that implements activities aimed at increasing the effectiveness of technical infrastructure. These activities are related to the elimination of losses in maintenance, such us [18,19]:
  • Unproductive works—execution of works that do not increase the reliability of the technical infrastructure;
  • Delays in the implementation of works—waiting for the availability of technical infrastructure in order to carry out preventive actions;
  • Unnecessary motion—unnecessary trips to stores with spare parts and searching for the required tools to get the job done;
  • Poor inventory management—lack of having an appropriate number of needed spare parts in a specific time;
  • Reworking—repeating tasks due to poor quality of performance;
  • Insufficient use of resources—inadequate use of available resources and skills of maintenance teams;
  • Machine misuse—malfunction or intentional operating strategies leading to maintenance work that does not need to be performed;
  • Ineffective data management—collecting data that are useless, and not those that are important.
Duran et al. [26] show the connection between the sources of waste in lean manufacturing and lean maintenance (Table 1).
The elimination of waste is most often carried out by implementing lean tools such as 5S, standardized work, Kaizen, Poka-Yoke, and value stream mapping (VSM) [27,28]. They are most commonly applied to make production processes more effective and to reduce lead-time or cost of production, but they can also be applied for maintenance operations. As the most common examples of application lean tools in the maintenance area, the implementation of the standardized work for maintenance operators, the Andon system to initiate corrective maintenance, or using VSM to identify and eliminate waste in maintenance operations can be distinguished [29]. However, the fundamental elements of lean philosophy and total productive maintenance (TPM) must be implemented before application of such specific tools [30].

2.2. Decision Support Systems in Maintenance Management

The problem of supporting decision processes in maintenance management has been the topic of many studies for over a dozen years now. Bashiri, Badri, and Hejazi [31] and Zhaoyang, Jianfeng, Zongzhi, Jianhu, and Weifeng [32] highlighted the role of risk-based maintenance in the maintenance management process. Cruz and Rincon point out that the maintenance process is at risk due to equipment failure [33]. Rinaldi, Portillo, Khalid, Henriques, Thies, Gato, and Johanning emphasized the importance of quantitative reliability, availability, and maintainability at early design stages [34]. Additionally, Wang, Furst, Cohen, Keil, Ridgway, and Stiefel predicted the risk of equipment failure using the Monte Carlo method [35], while in later works, they proposed approaches to monitoring disruptions and risk using ontologies and multi-agent systems [36].
Taghipour, Banjevic, and Jardine have proposed a method to identify and prioritize critical devices to mitigate functional failures [37]. Li, Parikh, He, Qian et al. incorporated machine learning techniques into the process of predicting failures, taking into account historical and real-time data analysis [38].
Jamshidi, Rahimi, Aitkadi, and Ruiz used fuzzy failure modes and analysis of effects to prioritize the operation of machinery, equipment, and classification [39], while Carnero and Gomez suggested the use of a multi-criteria model to increase the efficiency of the maintenance process [40].
Zeineb, Malek, Ahmand Ikram, and Faouzi, taking into account the total cost of ownership, used the Analytic Hierarchy Process (AHP) method to establish an appropriate-optimal maintenance program [41]. Moreover, fuzzy analytic hierarchy process for performing diagnostic and prescription tasks was discussed by Duran, Capaldo, and Duran Acevedo [27].
Lin, Yuan, and Tovilla use a continuous Markov chain model in a stochastic decision model that combines the effectiveness of maintenance activities and natural changes in state [42]. Jasiulewicz-Kaczmarek and Żywica use the non-additive fuzzy integral and balanced scorecard in the maintenance process [43]. In [44], the authors proposed a scorecard model that allows for monitoring the maintenance process in an enterprise. Finally, the importance of modern IT technologies in the maintenance decision-making process was also emphasized by Kosicka, Gola, and Pawlak [45].
Although the literature on the subject presents many solutions supporting decision-making in maintenance management, intelligent systems that are dedicated to supporting the implementation of the lean maintenance concept are not presented. For the time being, some limited results were presented by Antosz, Pasko, and Gola during the 13th IFAC Workshop on Intelligent Manufacturing Systems (Oshawa, ON, Canada) [46]. This explains why the research problem that was considered in the paper is an insufficient means of assessing the degree of the implementation of lean maintenance. This problem results in not only the possibility of achieving high efficiency of the exploited machines, but, foremost, it influences a decision process and the formulation of maintenance policy of an enterprise. In the context of the work conducted, the methodology of assessing lean maintenance was presented.

3. The Work Methodology

The research was carried out in two stages. The first stage of the study considered collecting the information on the systems of technical infrastructure management, in particular, the methods and tools of lean maintenance as well as the ability to identify the factors affecting the efficiency of their application. This stage in detail includes:
  • Identification of the degree of the use of specific methods and tools of the lean maintenance concept in manufacturing enterprises;
  • Identification of the results obtained by the production enterprises that are implementing the lean maintenance concept;
  • Identification of the factors affecting the results obtained after the implementation of the lean maintenance concept in enterprises;
  • Indication of the relationship between the activities undertaken as part of the implementation of the lean maintenance concept and the results achieved.
The detailed work methodology is presented on Figure 1.
The studies were carried out in 150 manufacturing enterprises in Podkarpackie Voivodship (Poland). Qualitative as well as quantitative research methods were used to analyze the results obtained. Additionally, a statistical analysis with the chi square test of the obtained results allowed us to identify the factors that influence the lean maintenance implementation effectiveness. In the second phase of the study, the concept of using artificial intelligence (AI) methods was proposed in order to assess the effectiveness of the lean maintenance concept implementation.
Artificial intelligence methods were used to search for the relationship between specific activities carried out under the implementation of lean maintenance and the results obtained. Decision trees and the rough set theory were used for the analysis. Decision trees were made for the variable of the average value of the OEE indicator. Decision trees enabled the generation of decision rules that can be the basis for determining the directions and effects of implementing lean maintenance in manufacturing enterprises. The rough set theory was used in order to assess the degree of the lean maintenance concept usage.

4. The Assessment of Lean Maintenance Effectiveness Concept in Enterprises

4.1. Use of the OEE Indicator in Enterprises—Study Results

The aim of the first stage of the research was to collect information on the use of lean maintenance methods and tools in enterprises, such as total productive maintenance (TPM), single minute exchange of die (SMED), 5S, and OEE indicator. The research, which was carried out in two stages, stage I—in 2010–2014 and stage II in 2014–2017, covered 150 production companies in the Podkarpackie Voivodship. The following criteria were taken into account when classifying the surveyed enterprises: size of the organization, production, type, industry, type of ownership, its capital, the company’s condition, and the type of machines owned. Among the analyzed enterprises, there were those that carried out several types of production or operated in several industries. Among the analyzed enterprises, the biggest group were large enterprises (stage I: 46%, stage II: 52%). The next group were medium-sized enterprises (stage I: 27%, stage II: 32%). Among the surveyed enterprises, those from the metal processing industry dominated (stage I: 22.77%, stage II: 22.41%), followed by the aviation industry (stage I: 23.76%, stage II: 24.14%) and the automotive industry (stage I: 18.81%, stage II: 20.69%) (Figure 2). The majority were private enterprises (stage I: 94%, stage II: 98%) with Polish capital (stage I: 44%, stage II: 2%) or majority foreign capital (stage I: 44%, stage II: 25%) (Figure 3).
Unit production dominated among the surveyed enterprises (stage I: 28.44%, stage II: 28%) and low- and medium-batch production, respectively, (stage I: 24.77%, stage II: 24%) and (stage I: 21.10%, stage II: 28%) (Figure 4).
A survey method was used for the research. The designed questionnaires allowed us to obtain the data in the same form from all the respondents who did them independently. The survey included the representatives of medium and top management as well as the workers directly responsible for the supervision process of technological machines and devices and the chosen machine operators. The survey was realized in the form of conjunctive closed questions, which included a list of the prepared, provided-in-advance answers presented to a respondent with a multiple response item in which more than one option might be chosen. Additionally, other answers could be given if they were not among the provided options.
Within the conducted survey, the identification of the measures used for the effectiveness assessment of the implemented LM methods and tools as well as the benefits from their use noticed by enterprises were thoroughly analyzed. Collecting the information on the used types of measures for the effectiveness assessment of machine operation was the area of the conducted studies. The OEE indicator is one of the measures recommended in the literature. While assessing the effectiveness of the possessed machines and the implementation of the TPM method, this parameter is crucial. However, as the studies show, it is not always used [47,48]. The OEE indicator was one of the main study areas. The aim of the studies was to investigate if the OEE indicator was calculated in enterprises and how its value changed after the TPM method implementation.
Figure 5 shows that most of the analyzed enterprises still do not apply the OEE indicator (stage II: 60.38%, stage I: 73.96%). Only a few percent of the enterprises use this indicator for all machines (stage II: 7.55%, stage I: 5.21%).
Figure 6 shows the size of the enterprises where this indicator in not used. The second stage of the studies indicates that the indicator is the most often not used in the medium size enterprises (stage I: 7.55%, stage II: 5.21%). However, its use increased significantly in micro companies (stage I: 10.26%, stage II: 5.88%).
In addition, the fact this indicator is not most often used in the enterprises with unit production (stage I: 29.49%, stage II: 29.41%) as well as with medium-batch production (stage I: 23.08%, stage II: 29.41%) was identified. Its use increased significantly in mass production (stage I: 8.97%, stage II: 2.94%). Furthermore, the indicator is most often not used in the enterprises of aviation, metal processing, and automotive industries. However, all the enterprises of the food industry that took part in the second stage of the studies declared its application. A crucial issue during the conducted studies was to obtain the information on the rate of calculating the OEE indicator. The rate of obtaining such information is essential, because the OEE indicator values inform us on an ongoing basis about productivity of the possessed machines. If the information is collected too seldom, a prompt reaction will not be possible in cases when the use of machines decreases.
The conducted studies show that in many enterprises the OEE indicator is calculated once a month (stage I: 26.09%, stage II: 25.00%). However, more and more often, the OEE indicator is calculated once per shift—the increase of over 17%, less often once a day—the decrease of over 16%. The obtained results show that large enterprises calculate the OEE value once per shift most often, medium enterprises once a month, small and micro enterprises once a week. The rate of calculating the indicator does not differ significantly in case of conventional and numerical machines (most often once per shift). Comparing the study results from the stages I and II, the rate of calculating changed from once a month to once a week for the machines described as “other”.
Another element of the realized studies was collecting the information, which considered the value of the OEE indicator. Its value is important, because it allows us to conduct initially a general analysis of the effectiveness of the possessed machines. The value over 85% is considered as the world level value of this indicator [49]. Analyzing the obtained results, it was stated that the number of companies that declared an average value of the OEE indicator at the level of 50–70% (stage I: 18.18%, stage II: 33.33%) and at the level of 30–50% (stage I: 9.09%, stage II: 25.00%) increased significantly. In stage II of the studies, none of the analyzed companies declared the OEE values below 30%. The highest OEE indicator values of over 70% are obtained in large enterprises for numerical machines, in the aviation and automotive industry with major foreign capital. The lowest OEE indicator values, below 30%, are obtained in small enterprises for the machines described as “other”, in the metal processing industry with Polish capital.

4.2. Identification of Factors Influencing the Effectiveness of Lean Maintenance Implementation

The aim of this stage was to identify the factors, which have an influence on the OEE value in analyzed enterprises. For provided analyses, the statistical chi-squared test was used. The following hypotheses were proposed zero hypotheses (H0), which means that there is not a significant difference in the solutions used in particular enterprises and alternative hypotheses H1, as there is a difference in the solutions used in particular enterprises.
These hypotheses can be written as
H0 = p1 = p2 = p3 =……= pn
and
(H1) = p1 ≠ p2 ≠ p3 ≠……≠ pn
The obtained p-value decided about accepting or rejecting H0, and therefore about accepting the alternative Hypothesis H1. If:
  • p-value < 0.05—H0 is rejected; thus, the alternative Hypothesis H1 is accepted.
  • p-value ≥ 0.05—H0 is accepted.
Table 2 shows the posed research hypotheses for the values of the OEE indicator as well as the obtained p-values.
For the analyzed Hypotheses 3 and 4, there is a statistically validated difference in the value of the OEE indicator (p-value OEE = 0.041 and OEE = 0.048—Hypothesis H0 rejected, Hypothesis H1 accepted). It means that, in the studied enterprises, the value of OEE depends on the type of ownership and the enterprise industry. In case of the concerned Hypothesis 13, there is also a statistically validated difference in the value of the OEE indicator (p-value OEE = 0.025, p-value LA = 0.005—Hypothesis H0 rejected, Hypothesis H1 accepted). It means that, in the studied enterprises, the value of OEE depends on the mean time to repair. The detailed results of the obtained studies were presented in the work [50].
On this basis, the following conclusions were drawn: the factors that influence the use of lean maintenance methods and tools are for example industry and the capital owned. The presented analyses allowed us to highlight the actual activities undertaken in the management of technical infrastructure and existing problems, and, thus, the possibility of identifying factors that increase the efficiency of lean maintenance. It should be noted that the studies often showed that single factors do not have a significant impact on the studied areas, although their interaction with other factors may have a substantial impact on the analyzed area. However, the problem is that analyzing a process with many variables is very difficult. Therefore, in the second stage of the study, the concept of using artificial intelligence (AI) methods in order to assess the effectiveness of the lean maintenance concept implementation was proposed.

5. Intelligent System to Support the Decision-Making Process in Lean Maintenance Management

5.1. Selection of Decision Variables in the Evaluation Process

To assess the effectiveness of lean maintenance tools, the factors influencing the dependent variable were identified. In the research on the assessment of the effectiveness of lean maintenance tools, one dependent variable and 19 explanatory variables (predictors) were determined. In the conducted research, one dependent variable was assumed: the average value of the OEE indicator.
Due to the large variety (combination) of response options, three additional indicators were introduced in the surveyed enterprises: maintenance strategy indicator (MSI), number of preventive activities (NPA), and number of TPM activities (NTPMA) indicator. The NPA number is the number of actions to prevent unplanned downtime, calculated as the total value of actions carried out simultaneously by the enterprise. During the survey (data collection) process, the company could choose several activities from the following:
  • Implementation of autonomous service (by the operator).
  • Implementation of preventive maintenance.
  • Forecasting activities based on the condition of machines (e.g., vibration analysis).
  • Additional operator training.
  • Additional training of maintenance service employees.
  • Equipping the maintenance services with specialized instruments (e.g., for measuring vibrations, for measuring the noise level).
  • Exchange of machines for new ones.
  • Modernization of machines.
  • Increasing the number of employees of maintenance services.
  • Outsourcing some maintenance activities to external companies.
Depending on how many activities are carried out by the enterprise at the same time, the indicator may range from 1 to 10. In addition, during the survey (data collection) process, the company could choose several activities implemented as part of the implementation of the TPM method, recommended in the literature on the subject, from the following:
  • Training of selected employees.
  • Training of all employees.
  • Implementation in a selected pilot area (position, line, etc.).
  • TPM workshops in the selected pilot area (stand, line, etc.).
  • Assessment of machines in terms of meeting health and safety requirements.
  • Assessment of the technical condition of machines.
  • Identification of non-conformities on machines.
  • Development of the inspection schedule.
  • Development of a renovation schedule.
  • Development of the scope of preventive service (for maintenance services).
  • Development of the scope of autonomous service (for the operator).
N T P M A =   i = 1 11 x i max n u m b e r   o f   a c t i v i t i e s 100 %
Depending on the value obtained, the indicator had four levels: low, medium, high and very high (Table 3).
The last index developed is the MSI index. With this indicator, it is possible to determine what technical infrastructure management strategy is applied by the enterprise. During the study (data collection), the company could choose several activities defining the realized activities implemented under the corrective maintenance (CM), preventive maintenance (PM), and condition-based maintenance (CBM) strategies. In order to define the index for possible variants of answers, numerical values ranging from 1 to 7 were introduced (Table 4). The lowest value was given to the action implemented in accordance with the CM strategy as the least effective strategy. However, the highest efficiency (value 7) was adopted for the operation: continuous monitoring of the condition of all machines (e.g., noise, vibrations, temperature) (CBM).
The value of MSI indicator is calculated as the sum of the value of activities by the number of implemented activities (4).
M S I   =   i = 1 n x i n
The MSI indicator may take values from 1 to 7. Value 1 means mainly the CM strategy, value 3.5—PM strategy, value 7—CBM strategy. When the value of the ratio is <3.5, it means the implementation of a mixed strategy, mainly CM–PM; when >3.5, it means the implementation of mainly a mixed strategy PM–CBM. At the same time, when closer to the value of 3.5, PM is the prevailing strategy. In order to ensure the adequacy of the adopted indicator, the variants of the strategy implemented by the examined enterprises were analyzed. For individual values of the indicator, implemented strategy variants (sequence of implemented actions) were assigned. The distribution of variants of the implemented strategies (distribution close to the normal distribution) allows us to confirm the validity of the adopted indicator (Table 5).
The Statistica Data Miner system was used to conduct the analyzes. This system enables the preparation of data in the form of a training and test set, intuitive guidance through the model building and fitting procedure, and a clear visualization of test results.

5.2. Decision Trees in the Assessment of the Effectiveness of Lean Maintenance

Due to qualitative nature of the dependent variables, classification decision trees with the use of the classification and regression trees (CART) algorithm were used.
Not all surveyed enterprises used the same solutions, methods, and tools, therefore the main criterion for selecting this method was its insensitivity to the occurrence of atypical observations, which are believed to come from a different population, and the possibility of its effective use in datasets characterized by numerous shortcomings in independent variables. Additionally, the following advantages of CART classification trees determined the choice of the method:
  • Taking into account non-monotonic dependencies through successive divisions with respect to the same variable;
  • Simple interpretation of results in comparison with other methods;
  • Suitability for tasks, where the a priori knowledge of which variables are related and how they are uncertain and intuitive;
  • Non-parametric and non-linear;
  • Estimating and ranking the importance of individual predictors (input variables) in the process of shaping the value of the dependent variable;
  • Very useful for classification issues.
The CART tree for a dependent variable—a mean value of the OEE indicator—was designed for 24 enterprises out of the studied group of enterprises, which had analyzed this indicator and implemented the TPM method. The following explanatory variables (predictors) were assumed: enterprise size, production type, industry, ownership type, capital, company condition, machine type, 5S implementation, 5S activities, SMED implementation, way of supervision, maintenance strategy, actions undertaken to prevent unplanned downtimes (number of prevent actions—NPA), machine classification, spare parts classification, actions within TPM implementation (NTPMA indicator), and mean time to repair. The following were assumed while creating the tree: equal costs of the incorrect classification, Gini coefficient, stop rule, and a minimum size criterion in the divided node n ≥ 2, which will allow for a detailed analysis of a tree structure and for 10-fold cross validation as a quality measure. A tree consisting of 12 divided nodes and 13 end nodes was chosen for the analysis. In order to assess the quality of the chosen tree, its validation for a new dataset was conducted. Thirteen decision rules may be defined for the created tree, which has 13 end nodes. The chosen decision rules, for which the highest values of OEE were reached (over 85% and for the range 70 to 85%) with the use of additional lean maintenance methods and tools, were presented below. Decision rules established on the basis of the decision tree are:
  • If an enterprise represents metal processing, aviation, or paper and wood industry, does not run partial supervision by outsourcing, and possesses an MSI indicator at the level of ≠4,5 and realizes machine classification, then it reaches an average value of the OEE indicator of over 85% (node 12).
  • If an enterprise represents an industry other than metal processing, aviation, or paper and wood. possesses an MSI indicator at the level of 3.5–5.6 and NPA number > 3, and the mean time to repair is below 1 h, then it reaches a mean value of the OEE indicator within the range from 70 to 85%.
  • If an enterprise represents an industry other than metal processing, aviation, or paper and wood and possesses an MSI indicator at the level other than that of 3.5–5.6 and an NTPMA indicator at any level other than high, then it reaches a mean value of the OEE indicator within the range from 70 to 85%.
  • If an enterprise represents an industry other than metal processing, aviation, or paper and wood, possesses an MSI indicator at any level other than that of 3.5–5.6a and an NTPMA indicator at a high level, and realizes supervision on its own with the service through outsourcing, then it reaches a mean value of the OEE indicator within the range from 70 to 85%.
  • If an enterprise represents an industry other than metal processing, aviation, or paper and wood, possesses an MSI indicator at any level other than that of 3.5–5.6 and an NTPMA indicator at a level other than high, and realizes supervision in a way other than on its own with the service through outsourcing, then it reaches a mean value of the OEE indicator of over 85%.
In order to evaluate the generated decision-making rules, research was again carried out in 20 randomly selected enterprises. Then, an expert system was designed and made (using PC-Shell—an expert system shell from the Aitech Sphinx software), taking into account the generated decision rules. Then, the general classification ability of the generated decision rules was tested using qualitative measures. Two blocks—aspects and rules—were used to develop the knowledge base in the system. The aspect block was used to declare the decision attributes and their values. On the other hand, the explanatory variables placed in the decision tree nodes are the decision attributes. The results of system inference were represented by the result attribute (target attribute). Finally, the value of the received attribute “OEE value” is presented in a separate window. The quality analysis consisted of developing binary matrices of classifiers’ errors determined for the classes that most commonly appear in the conducted studies. In the developed binary matrices (confusion matrices) (Table 6), the class analyzed at a particular moment was assumed as positive, while the remaining classes were treated as negative.
Table 7 and Table 8 present confusion matrices for the classifier—the value of OEE for the two most-emerging classes: 30–50% and 70–85%.
Based on the confusion matrix, numerical indicators presented in Table 9 can be designated. In detail, these indicators have been presented and discussed, among others in the works [51,52,53].
On the basis of the developed binary matrices, for each of them, the values of the twelve indicators showing the classifiers’ quality were calculated. Table 10 presents the results for the highlighted classifier classes.
The obtained indicator values the assessment of a classification measure, e.g., of an error (Err) at the level of 0.00 and 0.15, proved high usefulness of the developed classifiers, and thereby, their possibility to be applied by manufacturing enterprises for the effective assessment of the lean maintenance methods and tools implementation.

5.3. The Theory of Rough Sets to Support the Lean Maintenance Assessment

The rough set theory is one of the fastest growing branches of data exploration. It allows for a formal approach to all phenomena related to knowledge processing, therefore it is used as a methodology in the process of knowledge discovery from data. In particular, it can be used to test the imprecision and uncertainty in the data analysis process. It enables finding the relationship between explanatory variables (conditional attributes) and explained variables (decision attributes), which facilitates supporting decision-making based on data. It is also used to reduce dimensionality, consisting of removing from the dataset those explanatory variables that do not significantly affect the explained variables. Knowledge derived from data based on the rough set theory is recorded in the form of decision rules [55]. Details on the formal description of the rough set theory can be found, among others, at work [56]. Often, the purpose of the decision-making system based on rough sets is to search for hidden, and therefore, implicit rules that have not worked well during the selection made by an expert (or experts) [55,56,57]. Approximate sets are used to process the so-called unclear data with the use of intuitively understood inference rules. They can be used to search for hidden dependencies in input data, including decision support in the scope of cases that can be described with discrete attributes.
In this paper, the rough set theory was used to assess the degree of lean maintenance use. The same set of input data was used for the assessment as in the decision trees. Due to the presence of the so-called incomplete data, the use of rough sets improved the accuracy of the solution. Various types of algorithms were used to interfere with the rules.
The use of the rough set theory, and thus incomplete data, increased the number of analyzed enterprises from 24 included in decision trees to 34. An additional 10 analyzed enterprises were characterized by a set of variables, for which at least one variable did not have a specific value (no answer). By using decision tables in the rough set theory, it is possible to include more data when generating rules. This allows for the identification of new dependencies between the variables. To make the assessment, the rules were validated. In order to generate decision rules on the basis of the rough set theory, Rough Set Exploration System (RSES) software was used. The software was developed at the Institute of Mathematics of Warsaw University.
RSES software allows one to generate decision rules with the means of four algorithms: exhaustive algorithm, genetic algorithm, covering algorithm, and learning from examples module version 2 (LEM2). They were described in the works [57,58]. Furthermore, the software contains a number of other options, which, e.g., assign reductions for a given computer system. A reduct is a set of R attributes, where R ⊂ A, which allows to differentiate pairs of objects in a computer system, and at the same time, no other R proper subset possesses this property. Reductions are calculated with an exhaustive or genetic algorithm. On the basis of the assigned reductions, it is possible to create decision rules as well.
For each of decision classes, RSES software calculates three indicators, which indicate classification quality:
  • Accuracy—the ratio of properly classified objects of a given class to all objects belonging to this class;
  • Coverage—the ratio of the objects classified to a given class with decision rules to all objects belonging to this class;
  • True positive rate—the ratio of the properly classified objects of a given class to all objects that were classified to this class.
Accuracy and coverage are also calculated jointly for all decision classes (for the whole set of rules).
Decision rules for the described variable “an average OEE value” were generated by means of all four algorithms available in RSES. The scheme of the conducted study is shown in Figure 7. The OEE symbol designates a decision table which contains 34 studied objects (enterprises). Each object is described by 17 explanatory variables: an enterprise size, production type, industry, ownership type, capital, actions undertaken to prevent unplanned downtimes (NPA number—MSI indicator), machine category, spare parts category, actions in the TPM implementation (NTPMA indicator), and mean time to repair. The described variable “an average OEE value” played in the study the role of a decision attribute. The remaining symbols in the scheme are described in Table 11.
While formulating the decision rules, the parameters of genetic and covering algorithms were chosen in such a way that the accuracy and coverage of the created set were equal to 1. Table 12 includes the information on a number of rules in each of the four sets of rules. For each of the rules, a rule match is calculated. It is equal to the number of objects from the learning set and matching the forerunner of the rule.
Each of the four rule sets was used for the classification of the data from the OEE decision table. The classification was accomplished by a standard voting method. The manner of such voting is as follows: each of the generated rules determines the value of a variable described for the considered object (an enterprise). The calculated match value of particular rules is treated during the voting as an importance—the higher the match of a given rule, the more important is its vote. That is why it is more influential on a final voting result than the vote of the rule with a lower match. Eventually, the object is assigned such a value of an explanatory variable that won the weighted voting.
The result of the classification was presented in the form of a confusion matrix. The confusion matrix that includes the results of the classification accomplished by the rule set generated by an exhaustive algorithm was presented in Figure 8. Matrix rows correspond to the real decision classes (the values of the variable described). However, matrix columns are the results of the classification that was accomplished by the generated rules. All 34 objects that are in the decision board were classified properly. It is reflected in the values located only on the main diagonal of the confusion matrix. The last three columns in the described figure show the information on the number of objects belonging to a given decision class (no. of obj.), accuracy, and coverage. The last row of the table is the true positive rate calculated for each class individually. The bottom part of the window presents the number of all studied objects and the accuracy and coverage calculated for all decision classes altogether.
Confusion matrices were also created for the classification results based on the three remaining rule sets. Each of these matrices included the same results (accuracy = 1), such as the matrix presented in Figure 4, which indicates that there are no classification errors also for other classifications.
The assessment of the developed decision rules (decision trees and rough set theory) was carried out in the following stages: generation of a decision table and confusion matrix; development of an expert system based on the generated decision rules; use of the obtained study results to test the overall classification capacity; use of the obtained study results to test the overall classification capacity of decision-making rules using the developed expert system; and qualitative assessment of the results obtained using classification quality measures.
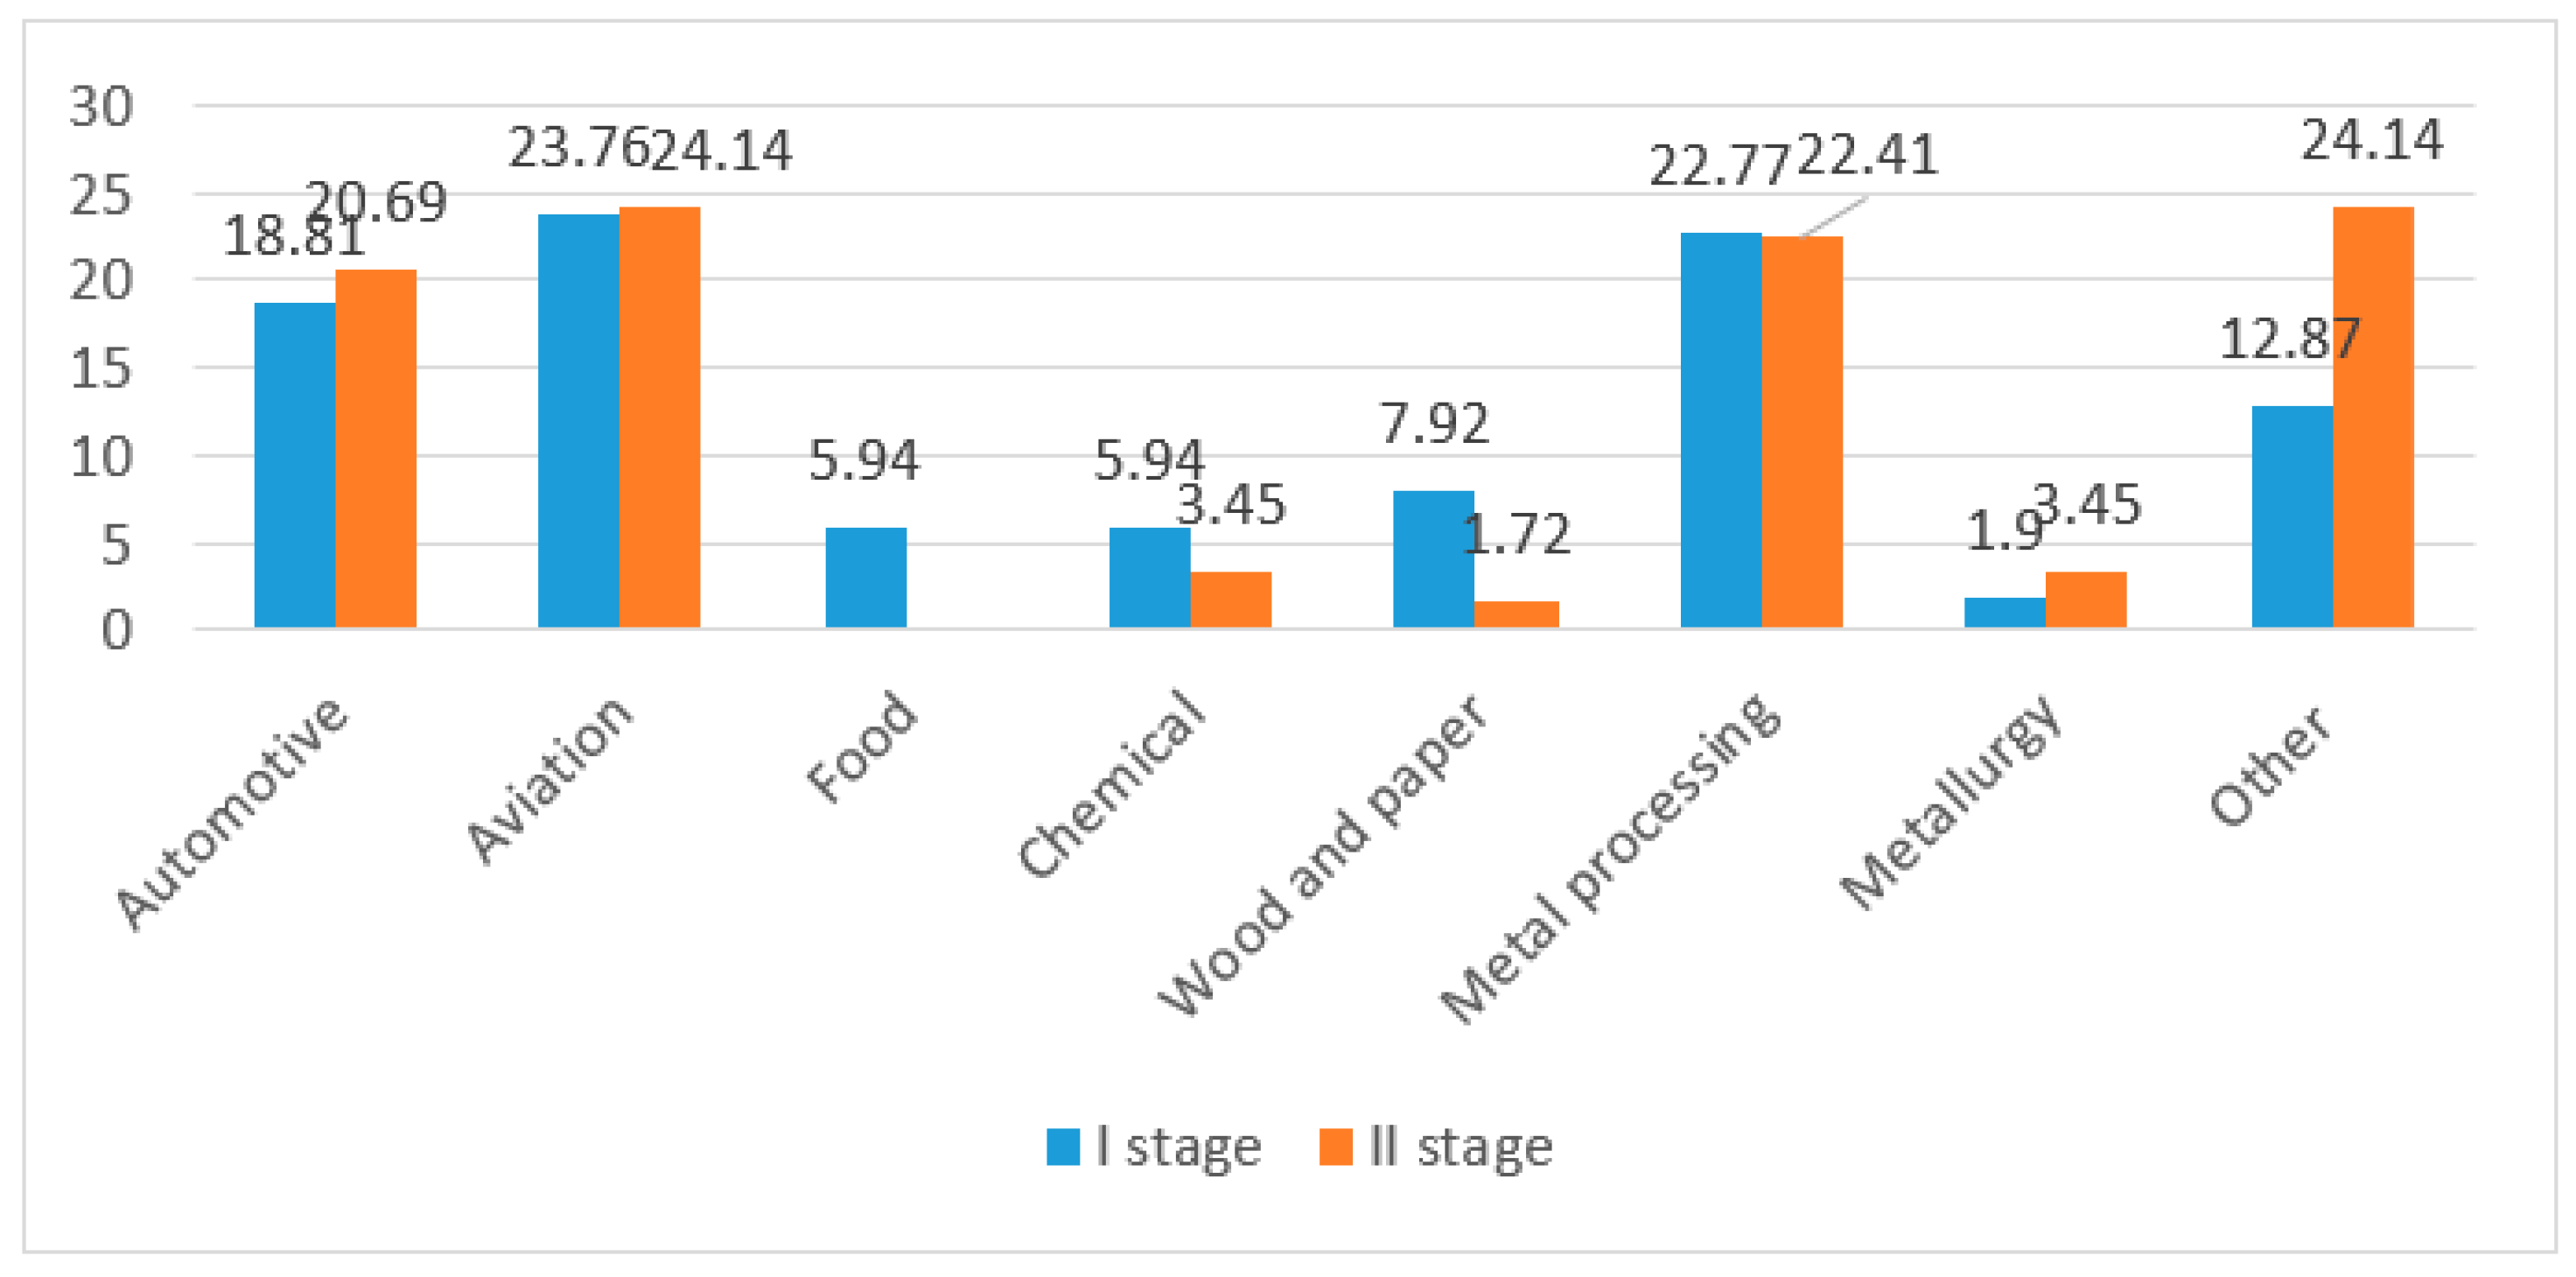
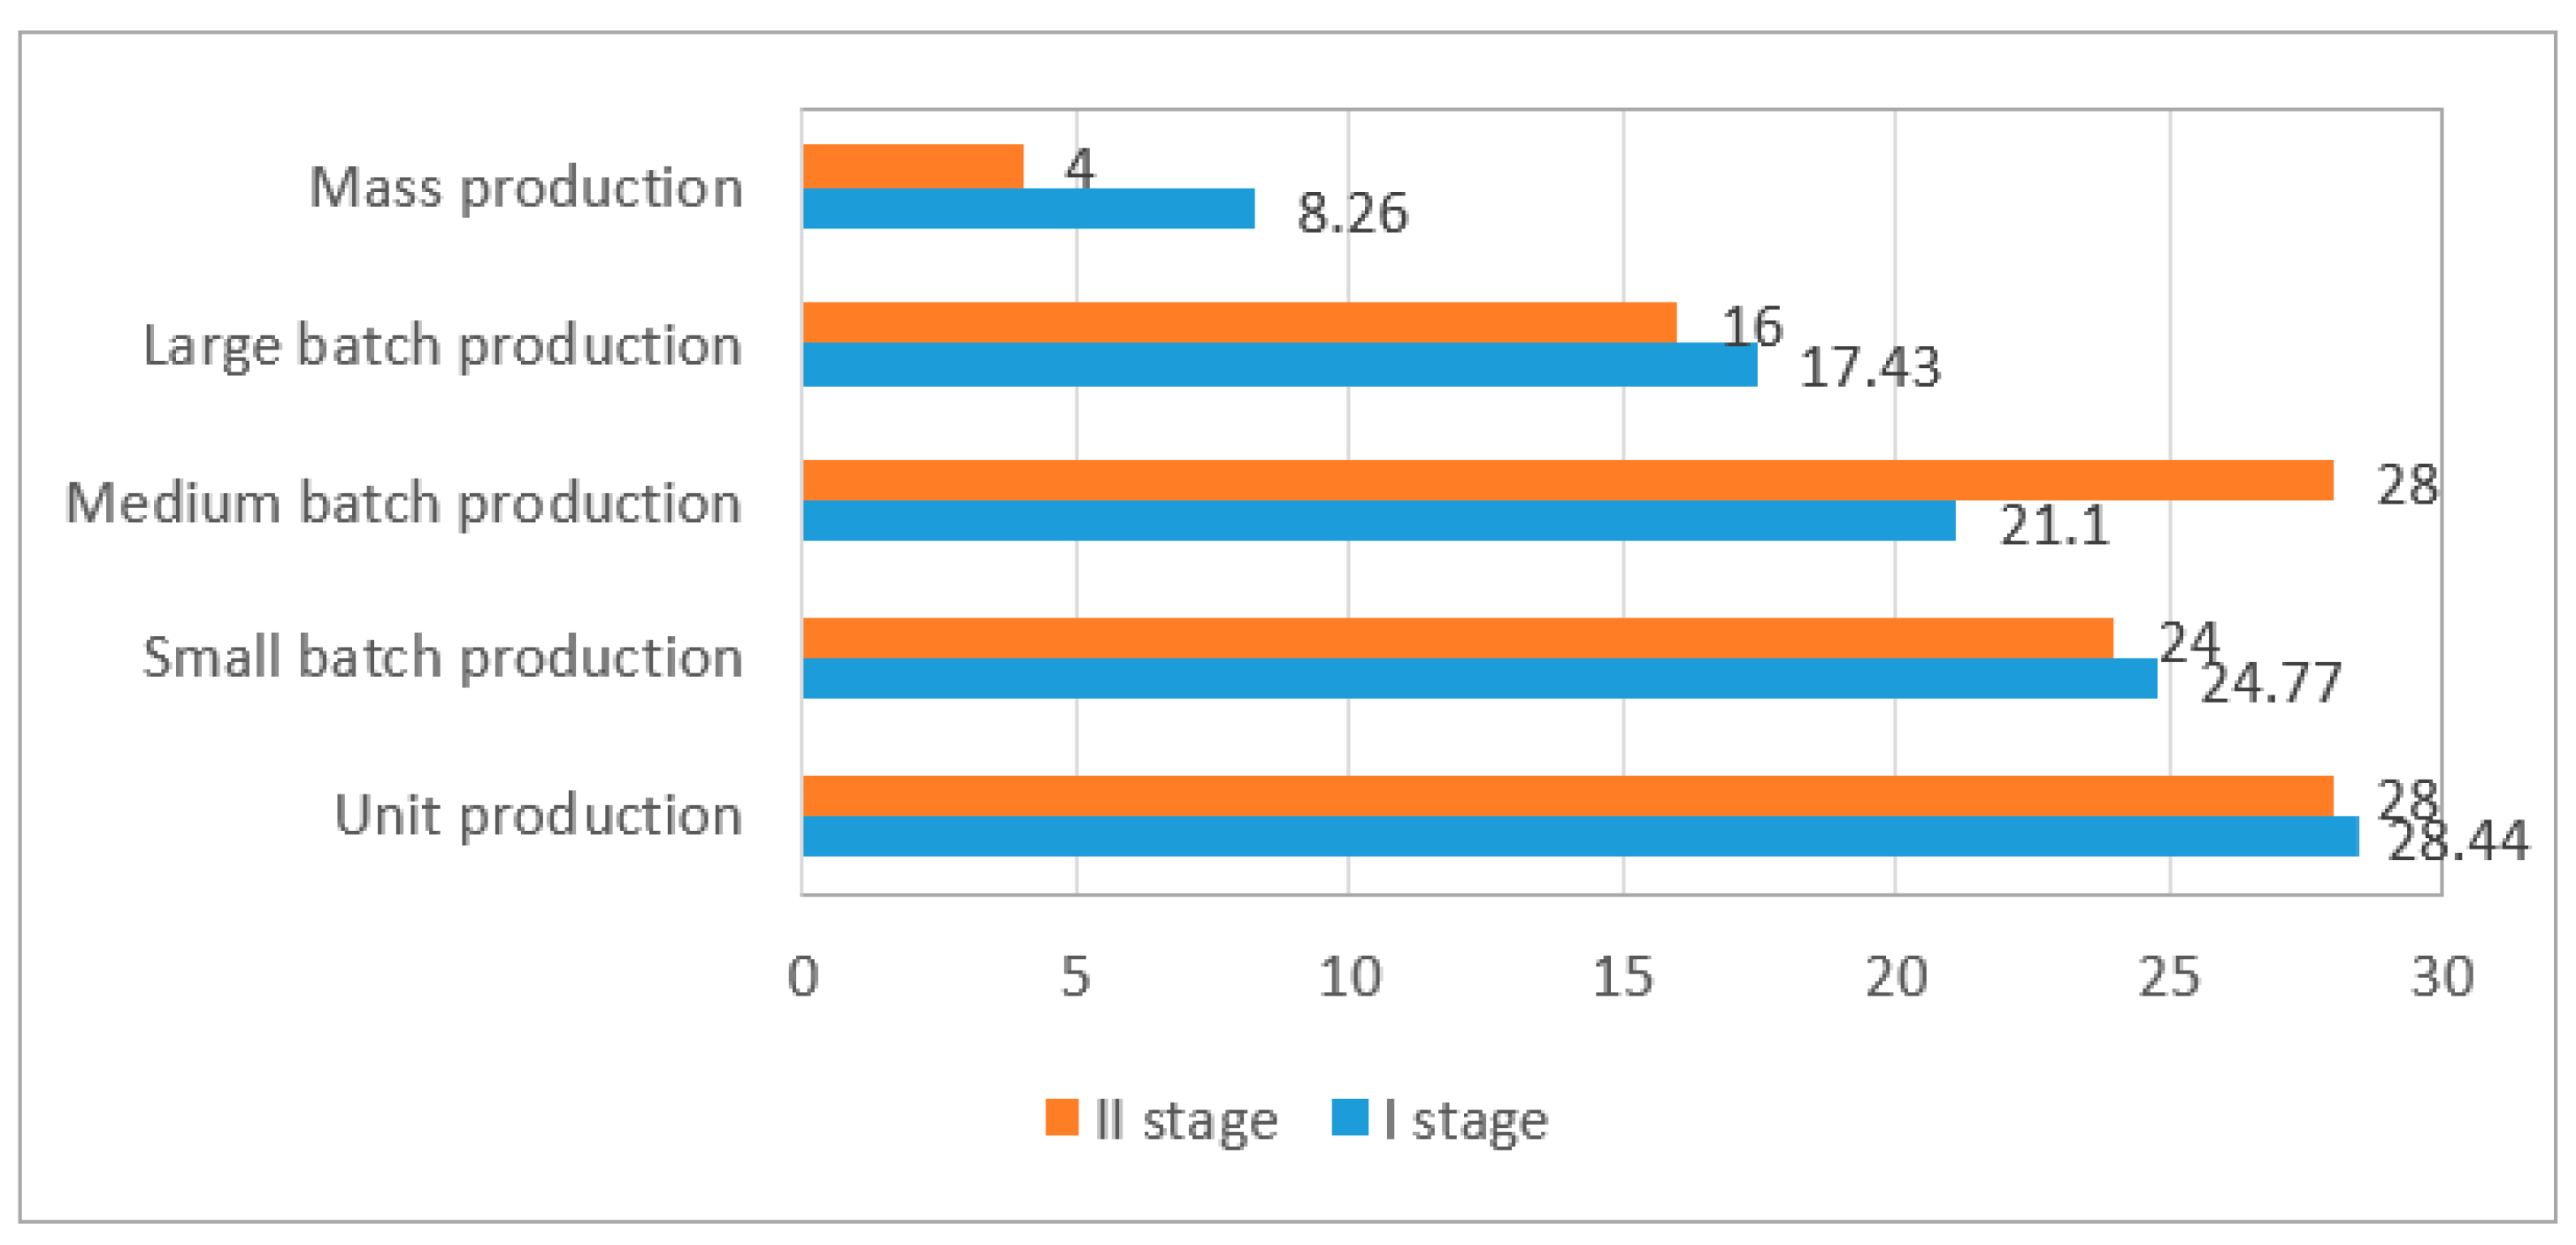
The results of the surveys from 20 companies of the Podkarpackie Voivodship were reused to validate the decision-making rules. Among the companies analyzed, the largest group included large companies (85%) from the aviation industry (50%). The majority of them were private companies (95%), with a majority of foreign capital (85%). Large-batch production (45%) dominated among the companies surveyed. On the basis of the results obtained, a decision table was created. The created decision table was introduced into the RSES system. It allowed us to create a confusion matrix for the explanatory variable “an average OEE value”. Maximum coverage calculated for all decision classes in total that equals 1 and accuracy of 0.30 for the explanatory variable “an average OEE value” were achieved using a set of rules generated by a genetic algorithm (Figure 9).
In order to carry out the next stage of validation, an expert system was developed. The decision-making rules generated by all algorithms were implemented in the knowledge base that was created for the system needs. The knowledge base for the expert system was developed with PC-Shell software, which is part of the Aitech SPHINX integrated artificial intelligence suite and Aitech HybRex software.
In order to test the overall quality of the classifier for all algorithms, confusion matrices (Table 13, Table 14, Table 15 and Table 16) were used. These matrices were developed by comparing the results obtained by the studied companies with the result generated by the developed expert system. The classification was carried out again according to the following voting method:
  • The conformity of the actual class value and predicted class value was considered as a valid result;
  • The cases when the value of the class predicted by an expert system was one class lower than the actual class value was allowed as a valid result, e.g., the actual class is a range of 30–50% and the predicted value is 10–30%. In practice, this means that an enterprise can expect projected variables to be at a minimum level of 10–30%. However, in fact, it may be higher.
When analyzing particular confusion matrices, it should be noted that the best results for the most common classes (30–50% and 70–85%) of the accuracy value were obtained for the rules generated by an exhaustive algorithm. The accuracy value was 0.6 and 0.875, respectively. In order to accurately assess the quality of the classifiers based on binary matrices, the values of the twelve indicators were calculated for each of the matrices according to the Table 9.

6. Analysis of the Obtained Results

In order to assess the obtained results, the values of the indicators used to test the quality of classifiers were compared. In the Table 17, a comparison of the values obtained for the models acquired with decision trees (DT) and the rough set theory (RST) was presented. Indicators from Acc to J should acquire the highest possible values up to 1, while the remaining ones should acquire the lowest possible value to 0. The green color indicates those indicator values that obtained more favorable values for particular classes. Yellow, on the other hand, indicates that the values obtained for particular indicators were identical.
When analyzing the results presented in the table, it should be noted that the first indicator (accuracy—Acc) shows that the classifier developed with DT for the class 30–50% allocates objects to this class to which they actually belong (Acc = 1) with the most likelihood. By contrast, the lowest Acc value obtained for the RST classifier was a genetic algorithm for the class 70–85% (Acc = 0.58). The sensitivity (TPR) of the classifiers presents itself in a slightly different way. The ability to detect the objects from the highlighted class is the highest for LEM2 algorithm for both highlighted classes and for DT in the class of 30–50%. The lowest ability for a genetic algorithm in the class of 30–50% (TPR = 0.00). By analyzing specificity (TNR), you can see that, for the highlighted class of 30–50%, the results are the highest (TNR = 1.00) for DT, exhaustive, and genetic algorithms. Precision (PPV) is similarly the highest for the highlighted class of 30–50% for DT and exhaustive algorithms (PPV = 1), and the lowest, again, for the highlighted class of 30–50% for a genetic algorithm. Negative predictive value (NVP), or the probability of the membership of the object recognized by a classifier as non-highlighted to the actual non-highlighted class, is the highest in case of the LEM2 algorithm for both highlighted classes and DT in the class of 30–50% (NVP = 1). It is the lowest for the class of 70–85% for covering and genetic algorithms (NPV = 0.67).
The results of the compared values of the Matthew’s correlation coefficient (MCC) measure (correlation coefficient between real classes and projected classes by the model) indicate that the best result was achieved in the class of 30–50% for DT (MCC = 1). The lowest result was for a genetic algorithm in the class of 70–85% (MCC = 0.17). By analyzing the results obtained for F1 (harmonic mean of precision and sensitivity of a model) and J (the sum of sensitivity and specificity reduced by 1) for all the models, it can be seen that the best classifier is DT in the class of 30–50%, while the worst is a genetic algorithm for the same class.
The remaining indicators should take the lowest possible values. A general classifier error (Err) is more favorable in case of using the DT classifier for the class of 30–50% (Err = 0.00), and the worst for the class of 70–85% is a genetic algorithm. The FPR indicator (probability of false alarms, i.e., the objects incorrectly assigned to a highlighted class, among all objects actually non-highlighted) and the FDR indicator (probability of false alarms among all the objects recognized by the classifier as highlighted) achieves the best values for the class of 30–50% (FPR = 0 and FDR = 0). However, the best FNR values (the probability of missing the highlighted objects, that is, their assignment by the classifier to the non-highlighted class) were also obtained for the class of 30–50% (FNR = 0).

7. Conclusions

The main research problem that was considered in the paper was an insufficient means of assessing the degree of the implementation of lean maintenance. To find the solution of identified problem, artificial intelligence methods such as decision trees and the rough set theory were used. When analyzing the results presented, it should be noted that the models generated with the rough set theory achieved much better results than in decision trees. The decision rules generated by DT showed better values for all indicators for the classifier for the class of 30–50%. However, better values for the class of 70–85% were achieved for RST, mainly for LEM2 algorithm. The number of rules generated by the LEM2 algorithm is the smallest compared to the other algorithms. This shows that a large number of rules is not needed to get good prediction results in the investigated problem.
The resulting indicators for testing the quality of classifiers confirmed the high usefulness of the generated decision rules, both those using decision trees and the rough set theory. The developed dependencies allow us to assess which results a given company can expect after the implementation of specific lean maintenance methods and tools, and which lean maintenance methods and tools should be used to achieve the intended goals. These dependencies may be the basis for determining the directions and effects of implementing lean maintenance in manufacturing companies. Additionally, an expert system in the form of a software application, developed on the basis of the generated dependencies (decision rules), allows for the selection of appropriate actions in order to obtain the best results after implementing lean maintenance.
The presented studies can be used by enterprises to build and organize maintenance processes, to select an appropriate action strategy, but above all, to improve already implemented activities in this area. Although the research was conducted in a limited area, it was based on common assumptions, principles, and objectives of implementing the lean maintenance concept in the enterprise. Therefore, the presented solutions are useful for practical use by all production companies for forecasting and assessing the effectiveness of implementing lean maintenance methods and tools, regardless of the region.
Moreover, the positive results obtained during the conduct of the described study lead to the conclusion that the activities in these areas should be continued. In particular, there ought to be studies considering the assessment of the effectiveness of using other methods and tools recommended in the literature within lean maintenance implementation; the possibility of extending functionality designed in a computer application; and the use of other methods of data exploration for generating decision rules and comparing their classification quality.

Author Contributions

K.A. gave the theoretical and substantive background for the provided research and conceived and designed the experiments; L.P. made an experimental verification of the proposed approach; A.G. provided technical guidance and gave critical review for this paper. All authors have read and agreed to the published version of the manuscript.

Funding

This research received no external funding.

Conflicts of Interest

The authors declare no conflict of interest.

References

  1. Jasiulewicz-Kaczmarek, M.; Gola, A. Maintenance 4.0 technologies for sustainable manufacturing—An overview. IFAC-PapersOnLine 2019, 52, 91–96. [Google Scholar] [CrossRef]
  2. Danilczuk, W.; Gola, A. Computer-aided material demand planning using ERP systems and business intelligence technology. Appl. Comput. Sci. 2020, 16, 42–55. [Google Scholar]
  3. Gornicka, D.; Burduk, A. Improvement of production processes with the use of simulation models. Intell. Syst. Comput. 2018, 657, 265–274. [Google Scholar]
  4. Kotowska, J.; Markowski, M.; Burduk, A. Optimization of the supply of components for mass production with the use of the ant colony algorithm. In Proceedings of the 1st International Conference on Intelligent Systems in Production Engineering and Maintenance (ISPEM), Wroclaw, Poland, 18 August 2017; Volume 637, pp. 347–357. [Google Scholar]
  5. Valis, D.; Mazurkiewicz, D. Application of selected levy processes for degradation modelling of long range mine belt using real-time data. Arch. Civ. Mech. Eng. 2018, 18, 1430–1440. [Google Scholar] [CrossRef]
  6. Sa Ribeiro, D.R.; Forcellini, F.A.; Pereira, M.; Xavier, F.A. An overview about the implementing of lean maintenance in manufacturing processes. J. Lean Syst. 2019, 4, 44–59. [Google Scholar]
  7. Mouzani, I.A.; Bouami, D. The integration of lean manufacturing and lean maintenance to improve production efficiency. Int. J. Mech. Prod. Eng. Res. Dev. 2019, 9, 593–604. [Google Scholar]
  8. Antosz, K. Maintenance–identification and analysis of the competency gap. Eksploat. Niezawodn. Maint. Reliab. 2018, 20, 484–494. [Google Scholar] [CrossRef]
  9. Sobaszek, Ł.; Gola, A.; Świć, A. Time-based machine failure prediction in multi-machine manufacturing systems. Eksploat. Niezawodn. 2020, 22, 52–56. [Google Scholar] [CrossRef]
  10. Prabowo, H.A.; Adesta, E.Y.T. A study of total productive maintenance (TPM) and lean manufacturing tools and their impact on manufacturing performance. Int. J. Recent Technol. Eng. 2019, 7, 39–43. [Google Scholar]
  11. Loska, A. Exploitation assessment of selected technical objects using taxonomic methods. Eksploat. Niezawodn. Maint. Reliab. 2013, 15, 1–8. [Google Scholar]
  12. Szwarc, E.; Bocewicz, G.; Banaszak, Z.; Wikarek, J. Competence allocation planning robust to unexpected staff absenteeism. Eksploat. Niezawodn. Maint. Reliab. 2019, 21, 440–450. [Google Scholar] [CrossRef]
  13. Sobaszek, Ł.; Gola, A.; Kozłowski, E. Application of survival function in robust scheduling of production jobs. In Proceedings of the 2017 Federated Conference on Computer Science and Information Systems (FEDCSIS), Prague, Czech Republic, 3–6 September 2017; Ganzha, M., Maciaszek, M., Paprzycki, M., Eds.; IEEE: New York, NY, USA, 2017; pp. 575–578. [Google Scholar]
  14. Gola, A.; Kłosowski, G. Development of computer-controlled material handling model by means of fuzzy logic and genetic algorithms. Neurocomputing 2019, 338, 381–392. [Google Scholar] [CrossRef]
  15. Jasiulewicz-Kaczmarek, M.; Saniuk, A. How to make maintenance processes more efficient using lean tools? Adv. Intell. Syst. Comput. 2018, 605, 9–20. [Google Scholar]
  16. Antosz, K.; Stadnicka, D. The results of the study concerning the identification of the activities realized in the management of the technical infrastructure in large enterprises. Eksploat. Niezawodn. Maint. Reliab. 2014, 16, 112–119. [Google Scholar]
  17. Ramos, E.; Mesia, R.; Alva, C.; Miyashiro, R. Applying lean maintenance to optimize manufacturing processes in the supply chain: A Peruvian print company case. Int. J. Supply Chain Manag. 2020, 9, 264–281. [Google Scholar]
  18. Clarke, G.; Mulryan, G.; Liggan, P. Lean maintenance. A risk-based approach, pharmaceutical engineering. Off. Mag. ISPE 2010, 30, 1–6. [Google Scholar]
  19. Womack, J.; Jones, D.T.; Roos, D. The Machine that Changed the World; Rawson Associates: New York, NY, USA, 1990. [Google Scholar]
  20. Ohno, T. Toyota Production System—Beyond Large Scale Production; Productivity Press: New York, NY, USA, 1988. [Google Scholar]
  21. Womack, J.; Jones, D. Lean Thinking: Banish Waste and Create Wealth in Your Corporation; Simon & Schuster Inc.: London, UK, 2003. [Google Scholar]
  22. Melton, T. The benefits of lean manufacturing. What lean thinking has to offer the process industries. Chem. Eng. Res. Des. 2005, 83, 662–673. [Google Scholar] [CrossRef] [Green Version]
  23. Pavnaskar, S.J.; Gershenson, J.K.; Jambekar, A.B. Classification scheme for lean manufacturing tools. Int. J. Prod. Res. 2003, 41, 3075–3090. [Google Scholar] [CrossRef]
  24. Papadopoulu, T.C.; Ozbayrak, M. Leanness: Experiences from the journey to date. J. Manuf. Technol. Manag. 2005, 16, 784–806. [Google Scholar] [CrossRef]
  25. Billesbach, T.J. A study of the implementation of just in time in the United States. Prod. Inventory Manag. J. 1991, 32, 1–4. [Google Scholar]
  26. Duran, O.; Capaldo, A.; Acevado, P.A.D. Lean maintenance applied to improve maintenance efficiency in thermoelectric power plants. Energies 2017, 10, 1653. [Google Scholar] [CrossRef] [Green Version]
  27. Jasiulewicz-Kaczmarek, M. Sustainability: Orientation in maintenance management. Case study. In EcoProduction and Logistics-Environmental Issues in Logistics and Manufacturing; Golinska, P., Ed.; Springer: Berlin/Heidelberg, Germany, 2013; pp. 135–154. [Google Scholar]
  28. Leksic, I.; Stefanic, N.; Veza, I. The impact of using different lean manufacturing tools on waste reduction. Adv. Prod. Eng. Manag. 2020, 15, 81–92. [Google Scholar] [CrossRef] [Green Version]
  29. Levitt, J. Lean Maintenance; Industrial Press: New York, NY, USA, 2008. [Google Scholar]
  30. Baluch, N.; Abdullah, C.S.; Mohtar, S. TPM and LEAN maintenance—A critical review. Interdiscip. J. Contemp. Res. Bus. 2012, 4, 850–857. [Google Scholar]
  31. Bashiri, M.; Badri, H.; Hejazi, T.H. Selecting optimum maintenance strategy by fuzzy interactive linear assignment method. Appl. Math. Model. 2011, 35, 152–164. [Google Scholar] [CrossRef]
  32. Zhaoyang, T.; Jianfeng, L.; Zongzhi, W.; Jianhu, Z.; Weifeng, H. An evaluation of maintenance strategy using risk based inspection. Saf. Sci. 2011, 49, 852–860. [Google Scholar]
  33. Cruz, A.M.; Rincon, A.M.R. Medical device maintenance outsourcing: Have operation management research and management theories forgotten the medical engineering community? A mapping review. Eur. J. Oper. Res. 2012, 221, 186–197. [Google Scholar] [CrossRef]
  34. Rinaldi, G.; Portillo, J.C.C.; Khalid, F.; Henriques, J.C.C.; Thies, P.R.; Gato, L.M.C.; Johanning, L. Multivariate analysis of the reliability, availability, and maintainability characterizations of a Spar-Buoy wave energy converter farm. J. Ocena Eng. Mar. Energy 2018, 4, 199–215. [Google Scholar] [CrossRef] [Green Version]
  35. Wang, B.; Furst, E.; Cohen, T.; Keil, O.R.; Ridgway, M.; Stiefel, R. Medical equipment management strategies. Biomed. Instrum. Technol. 2006, 40, 233–237. [Google Scholar] [CrossRef]
  36. Bayar, N.; Darmoul, S.; Hajri-Gabouj, S.; Pierreval, H. Using immune designed ontologies to monitor disruptions in manufacturing systems. Comput. Ind. 2016, 81, 67–81. [Google Scholar] [CrossRef]
  37. Taghipour, S.; Banjevic, D.; Jardine, A. Prioritization of medical equipment for maintenance decisions. J. Oper. Res. Soc. 2011, 62, 1666–1687. [Google Scholar] [CrossRef]
  38. Li, H.F.; Parikh, D.; He, Q.; Qian, B.Y.; Li, Z.G.; Fang, D.P.; Hampapur, A. Improving rail network velocity: A machine learning approach to predictive maintenance. Transport. Res. C Emer. 2014, 45, 17–26. [Google Scholar] [CrossRef]
  39. Jamshidi, A.; Rahimi, S.A.; Aitkadi, D.; Ruiz, A. A comprehensive fuzzy risk-based maintenance frame-work for prioritization of medical devices. Appl. Soft Comput. 2015, 32, 322–334. [Google Scholar] [CrossRef]
  40. Carnero, M.C.; Gomez, A. A multicriteria decision making approach applied to improving maintenance policies in healthcare organizations. BMC Med. Inform. Decis. Mak. 2016, 16, 47. [Google Scholar] [CrossRef] [Green Version]
  41. Zeineb, B.H.; Malek, M.; Ahmad, A.H.; Ikram, K.; Faouzi, M. Quantitative techniques for medical equipment maintenance management. Eur. J. Ind. Eng. 2017, 10, 703–723. [Google Scholar]
  42. Lin, P.; Yuan, X.-X.; Tovilla, E. Integrative modeling of performance deterioration and maintenance effectiveness for infrastructure assets with missing condition data. Comput. Aided Civ. Infrastruct. Eng. 2019, 34, 677–695. [Google Scholar] [CrossRef]
  43. Jasiulewicz-Kaczmarek, M.; Żywica, P. The concept of maintenance sustainability performance assessment by integrating balanced scorecard with non-additive fuzzy integral. Eksploat. Niezawodn. 2018, 20, 650–661. [Google Scholar] [CrossRef]
  44. Rodríguez-Padial, N.; Marín, M.; Domingo, R. An approach to evaluate tactical decision–making in industrial maintenance. Procedia Manuf. 2017, 13, 1051–1058. [Google Scholar] [CrossRef]
  45. Kosicka, E.; Gola, A.; Pawlak, J. Application-based support of machine maintenance. IFAC-PapersOnLine 2019, 52, 131–135. [Google Scholar] [CrossRef]
  46. Antosz, K.; Pasko, L.; Gola, A. The use of intelligent systems to support the decision-making process in lean maintenance management. IFAC-PapersOnLine 2019, 52, 148–153. [Google Scholar] [CrossRef]
  47. Antosz, K.; Stadnicka, D. TPM in large enterprises: Study results. Int. J. Ind. Manuf. Eng. 2013, 7, 2101–2108. [Google Scholar]
  48. Stadnicka, D.; Antosz, K. Overall equipment effectiveness: Analysis of different ways of calculations and improvements. In Advances in Manufacturing. Lecture Notes in Mechanical Engineering; Hamrol, A., Ciszak, O., Legutko, S., Jurczyk, M., Eds.; Springer: Cham, Germany, 2018. [Google Scholar]
  49. Scodanibbio, C. World–Class TPM–How to Calculate Overall Equipment Efficiency. Carlo Scodanibbio 2008/2009. 2009. Available online: www.scodanibbio.com (accessed on 17 August 2020).
  50. Antosz, K. Metodyka Modelowania, Oceny i Doskonalenia Koncepcji Lean Maintenance; Oficyna Wydawnicza Politechniki Rzeszowskiej: Rzeszów, Poland, 2019. [Google Scholar]
  51. Costa, E.P.; Lorena, A.C.; Carvalho, A.C.P.L.F.; Freitas, A.A. A review of performance evaluation measures for hierarchical classifiers. In Evaluation Methods for Machine Learning II: Papers from the AAAI-2007 Workshop; AAAI Press: Palo Alto, CA, USA, 2007; pp. 182–196. [Google Scholar]
  52. Fawcelt, T. An introduction to ROC analysis. Pattern Recogn. Lett. 2006, 27, 861–874. [Google Scholar] [CrossRef]
  53. Sokolova, M.; Lapalme, G. A systematic analysis of performance measures for classification tasks. Inf. Process. Manag. 2009, 45, 427–437. [Google Scholar] [CrossRef]
  54. Pasko, Ł.; Setlak, G. Badanie jakości predykcyjnej segmentacji rynku. Zesz. Nauk. Politech. Śląskiej Ser. Inform. 2016, 37, 83–97. [Google Scholar]
  55. Pawlak, Z. Rough Sets: Theoretical Aspects of Reasoning about Data; Theory and Decision Library D; Springer: Dordrecht, The Netherlands, 1991. [Google Scholar]
  56. Beaubouefa, T.; Petryb, F.E.; Arorac, G. Information-theoretic measures of uncertainty for rough sets and rough relational databases. Inf. Sci. 1998, 109, 185–195. [Google Scholar] [CrossRef]
  57. Bazan, J.G.; Nguyen, H.S.; Nguyen, S.H.; Synak, P.; Wróblewski, J. Rough set algorithms in classification problem. In Rough Set Methods and Applications: New Developments in Knowledge Discovery in Information Systems, Studies in Fuzziness and Soft Computing; Polkowski, L., Tsumoto, S., Lin, T.Y., Eds.; Physica-Verlag HD: Heidelberg, Germany, 2000; pp. 49–88. [Google Scholar]
  58. Grzymala-Busse, J.W. A new version of the rule induction system LERS. Fundam. Inform. 1997, 31, 27–39. [Google Scholar] [CrossRef]
Figure 1. The detailed work methodology of the research.
Applsci 10 07922 g001
Figure 2. Structure of the surveyed research enterprises—type of industry.
Applsci 10 07922 g002
Figure 3. Structure of the surveyed research enterprises—property and capital.
Applsci 10 07922 g003
Figure 4. Structure of the surveyed research enterprises—type of production.
Applsci 10 07922 g004
Figure 5. Is the overall equipment effectiveness (OEE) indicator calculated?—study results.
Applsci 10 07922 g005
Figure 6. The percentage of enterprises that do not use the OEE indicator—the enterprise size.
Applsci 10 07922 g006
Figure 7. The scheme for the explained variable “an average OEE value”.
Applsci 10 07922 g007
Figure 8. Confusion matrix for the rules generated by an exhaustive algorithm.
Applsci 10 07922 g008
Figure 9. Confusion matrix for the rules generated by an genetic algorithm.
Applsci 10 07922 g009
Table 1. Relationships between sources of waste in lean manufacturing and lean maintenance.
Waste in Lean ManufacturingWaste in Lean Maintenance
material transporttransport of spare parts and tools
manufacture of non-required goodsimplementation of non-required maintenance activities (over maintenance)
waiting between operations or in the course of an operationthe waiting between maintenance actions or procedures
stocks of materialsexcessive stocks of spare parts
over processingexcessive or too frequent maintenance activities
non-conforming productsrework
Table 2. Research hypotheses—the effects obtained for the implementation of the lean maintenance methods and tools.
Hypothesis NumberHypothesisp-Value
OEE
Hypothesis 1There is no difference in the values of measures obtained in the enterprises of different sizes0.588
Hypothesis 2There is no difference in the values of measures obtained in the enterprises of different production types (SB—small-batch, UP—unit production, MB—medium-batch, LB—large-batch, MP—mass production)0.316
Hypothesis 3There is no difference in the values of measures obtained in the enterprises of different industries0.041
Hypothesis 4There is no difference in the values of measures obtained in the enterprises of different ownership0.048
Hypothesis 5There is no difference in the values of measures obtained in the enterprises in different condition0.967
Hypothesis 6There is no difference in the values of measures obtained in the enterprises of different capital0.235
Hypothesis 7There is no difference in the values of measures obtained in the enterprises with different types of machines owned 0.339
Hypothesis 8There is no difference in the values of measures obtained in the enterprises that are implementing 5S method0.422
Hypothesis 9There is no difference in the values of measures obtained in the enterprises that are implementing the SMED method0.535
Hypothesis 10There is no difference in the values of measures obtained in the enterprises that use Kanban for spare parts0.348
Hypothesis 11There is no difference in the values of measures obtained in the enterprises with different ways of supervision 0.854
Hypothesis 12There is no difference in the values of measures obtained in the enterprises with different types of supervision 0.305
Hypothesis 13There is no difference in the values of measures obtained in the enterprises with different mean time to repair0.025
Hypothesis 14There is no difference in the values of measures obtained in the enterprises with a different number of actions that prevent unplanned downtimes0.707
Table 3. The levels of number of TPM activities (NTPMA) indicator.
The Value of NTPMA Indicator0–25%26–50%51–75%More than 75%
LevelLowMediumHighVery high
Table 4. Maintenance strategy—realized activities.
Maintenance Strategy—Realized ActivitiesValue
Only failures are removed on a regular basis (CM)1
Inspections during the warranty period (PM)2
Scheduled inspections by maintenance services (PM)3
Scheduled inspections and repairs carried out by maintenance services (PM)4
Machine condition assessment by the operator before starting work—autonomous maintenance (PM)5
Continuous condition monitoring of selected machines (e.g., noise, vibration, temperature) (CBM)6
Continuous condition monitoring of all machines (e.g., noise, vibration, temperature) (CBM)7
Table 5. The values of maintenance strategy indicator (MSI) indicator.
The Value of MSI Indicator11.522.533.544.555.566.57
Range1.00–1.241.25–1.741.75–2.242.25–2.742.75–3.243.25–3.743.75–4.244.25–4.744.75–5.245.25–5.745.75–6.246.25–6.74More than 6.75
Maintenance strategy (realized actions)112131253234523456364564576 7
1423524545713672567 57
2312345236434563457
15235345346
135 2452457
24 35
CMCM—PMPMPM—CBMCBM
Table 6. Confusion matrix.
Real ClassesPredicted Classes
PositiveNegative
PositiveTP (True positive)FN (False negative)
NegativeFP (False positive)TN (True negative)
Table 7. Confusion matrix for the classifier value of the OEE indicator—30–50% class.
Real ClassesPredicted Classes
PositiveNegative
Positive70
Negative013
Table 8. Confusion matrix for the classifier value of the OEE indicator—70–85% class.
Real ClassesPredicted Classes
PositiveNegative
Positive51
Negative212
Table 9. Indicators used to test the quality of classifiers [54].
IndicatorDesignationFormula
AccAccuracy A c c = T P + T N T P + T N + F P + F N
ErrOverall error rate E r r = F P + F N T P + T N + F P + F N
TPRTrue positives rate T P R = T P T P + F N
TNRTrue negatives rate T N R = T N T N + F P
PPVPositive predictive value P P V = T P T P + F P
NPVNegative predictive value N P V = T N T N + F N
FPRFalse positive rate F P R = F P F P + T N = 1 T N R
FDRFalse discovery rate F D R = F P F P + T P
FNRFalse negatives rate F N R = F N T P + F N = 1 T P R
MCCMatthew’s correlation coefficient M C C = T P × T N F P × F N ( T P + F N ) ( T P + F P ) ( F N + T N ) ( F P + T N )
F1F1-score F 1 = 2 × P P V × T P R P P V + T P R
JYouden’s J statistic J = T P R + T N R 1
Table 10. Indicators used to test the quality of classifiers.
IndicatorsAccTPRTNRPPVNPVMCCF1JErrFPRFDRFNR
Classifier: an average OEE valueMarked class30–50%1.001.001.001.001.001.001.001.000.000.000.000.00
70–85%0.850.830.860.710.920.660.770.690.150.670.290.17
Table 11. Description from the study scheme (Figure 3).
SymbolSymbol NameDescription
Applsci 10 07922 i001OEE_ExhAlgA set of decision rules generated with an exhaustive algorithm.
OEE_GenAlgA set of decision rules generated with an exhaustive algorithm working in an exact mode with a population size equal to 10.
OEE_CovAlgA set of decision rules generated with a covering algorithm with the coverage parameter equal to 0.0001.
OEE_LEM2A set of decision rules generated with LEM2 algorithm with the coverage parameter equal to 1.
Applsci 10 07922 i002A confusion matrix that includes the results of the classification prepared with a set of rules from which the arrow on the scheme/diagram leads. The classification is realized on the objects from the OEE decision table.
Table 12. The number of rules in each of the created sets for the described variable “an average OEE value”.
Name of a Rule SetNumber of Rules
OEE_ExhALg2606
OEE_GenAlg325
OEE_CovAlg55
OEE_LEM221
Table 13. Confusion matrix for the rules generated by an exhaustive algorithm.
Predicted
Lower than 30%30–50%50–70%70–85%More than 85%No. of obj.AccuracyCoverage
ActualLower than 30%00320501
30–50%0301150.61
50–70%00010101
70–85%0007180.8751
More than 85%00001111
True positive rate0100.640.33
Table 14. Confusion matrix for the rules generated by a genetic algorithm.
Predicted
Lower than 30%30–50%50–70%70–85%More than 85%No. of obj.AccuracyCoverage
ActualLower than 30%1003150.21
30–50%00121500.8
50–70%00100111
70–85%0005380.6251
More than 85%00001111
True positive rate100.50.50.17
Table 15. Confusion matrix for the rules generated by a covering algorithm.
Predicted
Lower than 30%30–50%50–70%70–85%More than 85%No. of obj.AccuracyCoverage
ActualLower than 30%1021150.21
30–50%0111250.21
50–70%00100111
70–85%3103180.751
More than 85%00100101
True positive rate0.250.50.20.60
Table 16. Confusion matrix for LEM2—generated rules.
Predicted
Lower than 30%30–50%50–70%70–85%More than 85%No. of obj.AccuracyCoverage
ActualLower than 30%1000150.50.4
30–50%0100250.3330.6
50–70%10000101
70–85%2003080.60.625
More than 85%00000100
True positive rate0.251010
Table 17. Comparison of the obtained indicator values for testing the quality of classifiers for the models obtained with decision trees (DT) and the rough set theory (RST).
IndicatorsClassifier: An Average OEE Value
Marked Class
30–50%70–85%
DTRSTDTRST
LEM2Exh.Alg.Gen.Alg. Cov.Alg.LEM2Exh.Alg.Gen.Alg. Cov.Alg.
Acc1.000.900.900.790.750.850.900.750.580.65
TPR1.001.000.600.000.200.831.000.880.620.37
TNR1.000.881.001.000.940.860.860.670.550.83
PPV1.000.601.000.000.500.710.750.640.500.60
NPV1.001.000.880.790.780.921.000.890.670.67
MCC1.000.730.730.000.200.660.800.530.170.24
F11.000.750.750.000.290.770.860.740.560.46
J1.000.880.600.000.130.690.860.540.170.20
Err0.000.100.100.210.250.150.100.250.420.35
FPR0.001.000.000.000.200.671.000.800.620.29
FDR0.000.400.000.000.500.290.250.360.500.40
FNR0.000.000.401.000.800.170.000.120.380.62
Legend:
-
indicator values that obtained more favorable results,
-
indicator values that obtained the same results.
Publisher’s Note: MDPI stays neutral with regard to jurisdictional claims in published maps and institutional affiliations.

