Article

Spatiotemporal Analysis of Land Use and Land Cover (LULC) Changes and Precipitation Trends in Shanghai

1
Key Laboratory of Geographic Information Science (Ministry of Education), East China Normal University, Shanghai 200241, China
2
School of Geographic Sciences, East China Normal University, Shanghai 200241, China
3
Water in the West, Woods Institute for the Environment, Stanford University, Stanford, CA 94305, USA
4
School of Environmental and Geographical Sciences, Shanghai Normal University, Shanghai 200234, China
5
Shanghai Climate Centre, Shanghai Meteorological Bureau Service, Shanghai 200030, China
6
Shanghai Meteorological Society, Shanghai Meteorological Bureau Service, Shanghai 200030, China
*
Authors to whom correspondence should be addressed.
Appl. Sci. 2020, 10(21), 7897; https://doi.org/10.3390/app10217897
Submission received: 25 September 2020 / Revised: 3 November 2020 / Accepted: 5 November 2020 / Published: 7 November 2020
(This article belongs to the Special Issue Remote Sensing and Health Problems)

Abstract

:
The impacts of anthropogenic land use and land cover (LULC) changes on the spatiotemporal distribution of precipitation in megacities have been highlighted in studies on urban climate change. In this study, we conducted a quantitative analysis of urban growth on the impact on precipitation in Shanghai, China. We considered four periods of LULC data in 1979, 1990, 2000 and 2010, in addition to the long-term (1979–2010) trend of daily precipitation. The results indicate that the trend in precipitation exhibit different characteristics for urban (Ur), outskirt of urban (OUr) and outer suburb (OS) regions. Most Ur regions had an upward trend in annual and extreme precipitation during 1979–2010, while annual precipitation for the OUr and OS regions exhibited a decreasing trend. From 1979 to 2010, the areas of fastest expansion were located in the OUr region. The OS region, far away from the central area, had a relatively lower rate of change. In addition, OUr regions with rapid LULC changes exhibited higher increasing trends in annual and daily extreme precipitation, which is critical for the identification of frequent precipitation areas and the reliable projection of further changes.

Graphical Abstract

1. Introduction

It was reported in the World Urbanization Prospects that more than 54% of the global population currently lives in cities, and this percentage is projected to reach 66% by 2050 [1]. The 2014 Intergovernmental Panel on Climate Change (IPCC) predicted that several large metropolitan areas around the world may experience a temperature rise of greater than 1.5 ℃ under the Representative Concentration Pathway (RCP) 2.6 scenario, which introduces additional challenges for cities with respect to coping with climate change and its impact [2,3]. Under the influence of anthropogenic factors, cities are very sensitive and vulnerable to heavy rainstorms [4,5], floods [6,7], heat waves [8] and other weather-related hazards that are likely to be exacerbated by climate change [9,10]. In particular, changes in “urban heat island (UHIs)” associated with anthropogenic land use and land cover (LULC) in megacities have raised great concerns with regard to their impact on urban precipitation [11,12,13].
By 2030, the urban land cover will increase by 1.2 million km², which is nearly triple the situation in 2000 [14,15]. More densely built impervious underlying surface, such as road, building and concrete, have replaced the natural vegetation during rapid urbanization [16,17], which leads to changes in precipitation due to changes in the urban thermal environment, e.g., albedo effects [18,19], anthropogenic heat [20,21,22] and the increase in emission of artificial aerosols [23,24,25,26]. These changes in the underlying urban surface have exacerbated the destabilization of the boundary layer, thereby altering local precipitation processes [27,28]. For instance, Holst et al. [29] used cloud-resolving models (CRMs) and found that an increase in convective precipitation depends on the amount of heat energy released at the surface. Moreover, it was demonstrated that high precipitation rates are sensitive to the amount of surface heat that is released [30]. Currently, high accuracy LULC data are an important parameter in the precise simulation of precipitation processes in most climate models [31,32,33], such as the Weather Research and Forecasting (WRF) model [34]. Specifically, the WRF model incorporates the urban canopy model (UCM) parameterization scheme option with Noah land surface beginning from WRF-UCM version 2.2 [35]. However, it has been demonstrated in some instances that simulated precipitation does not accurately represent the actual precipitation process due to the coarser spatial [36,37,38,39] and temporal [40] resolution of the LULC data. In particular, Xie et al. [41] simulated a precipitation process in 2012 that occurred during a heavy rainstorm in Beijing based on the WRF model, and they concluded that the simulated results could be sensitive to the accuracies of LULC data.
Over the past decades, China has experienced rapid urbanization [42]. The unprecedented LULC changes across urban areas of China have exerted substantial impacts on regional climate and precipitation [43,44,45,46]. Previous studies in some urban agglomerations such as the Yangtze River Delta [47], Pearl River Delta [48,49] and Beijing-Tianjin-Hebei [50] have revealed that rapid urban expansion may cause significant increases in the amount of total precipitation in urban areas. Moreover, extreme precipitation may be intensified in the center of metropolitan areas [51], especially in the cities of Beijing, Guangzhou and Shanghai. In addition, precipitation intensity [52] and frequency [53] are more likely to increase in the metropolitan areas of these cities during the phase of rapid urbanization.
Since the 1980s, Shanghai’s built-up area has ranked second in China under the rapid urbanization process. Liang et al. [54] found that the speed of urbanization exerts significant influences on the spatial distribution of annual and extreme precipitation. In addition, further results show that changes in the frequency and total amount of hourly heavy precipitation indicate an obvious increasing trend in urban and suburban areas during the rapid urbanization phase (1981–2014) in Shanghai [55]. Based on these studies, Shanghai was selected as a case study region not only because of its complicated underlying urban surfaces but also due to the changing pattern of its regional precipitation extremes. Therefore, it is necessary for us to explore the relationship between different LULCs and precipitation in Shanghai. Two aspects could be emphasized: precipitation patterns in different LULC types and impacts of LULC variations on precipitation trends. In this study, we quantitatively compared the differences of gridded precipitation trends among urban, outskirt of urban and outer suburbs areas during the rapid urbanization phase (1979–2010), particularly in the case of extreme events. In addition, the potential changes in precipitation trends with variations in LULC were further analyzed. The rest of this paper is organized into several sections. Section 2 introduces the study area, datasets and methods. Section 3 presents the main results on the influence of built-up area changes on precipitation. Finally, the discussion and conclusions are summarized in Section 4 and Section 5, respectively.

2. Materials and Methods

2.1. Study Area

Shanghai, on the coast of the East China Sea, is a well-known megacity of more than 24.28 million residents as of 2019 and a total area of 6340.5 km2 [56]. The entire city is situated on the eastern fringe of the Yangtze River Delta (Figure 1), and the average elevation is approximately 4.0 m (above sea level, measured at the Wusong Datum). Shanghai has a humid subtropical climate with four distinct seasons. The average annual precipitation is approximately 1123 mm/year [57]. This city typically faces threats from typhoon-triggered rainstorms from June to September [58]. Covering an area of 314.96 km2, more than 30% of Shanghai’s population lives in the central area, which includes the most densely populated commercial regions in Shanghai.

2.2. Datasets

Table 1 shows all the data used in this study, including 30 m-resolution LULC data available for 1979, 1990, 2000 and 2010 and daily precipitation data from 10 rain gauges during 1979–2010.

2.2.1. LULC Data

LULC data were obtained from Landsat satellite images for four periods (i.e., 1979, 1990, 2000 and 2010) from the USGS (https://earthexplorer.usgs.gov/). Table 2 shows the image details for the four periods. After atmospheric and geometric correction, these images were further classified into built-up and non-built-up areas based on a supervised classification method. The non-built-up area included four land use types: farmland, green land, bare land and water (Table 3). The classification results show that the total accuracy is higher than 85% and the values of the Kappa coefficient (a measure of agreement between the two individuals, see Yin et al. [59]) are between 0.79 and 0.89. Figure 2 shows the spatiotemporal distribution of the built-up and non-built-up areas. In this period (1979–2010), Shanghai experienced rapid urbanization and the extent of built-up area in 2010 reached 2350.05 km², which is nearly 10 times than that in 1979.

2.2.2. Rain Gauge Data

Based on the 25-km distance of the barycenter of the central area, the investigated area could be classified into three categories: urban area (Ur), outskirt of urban area (OUr) and outer suburb area (OS) (see Figure 3). Daily rain gauge-based precipitation observations from January 1979 to December 2010 were obtained from the Shanghai Meteorological Bureau (http://sh.cma.gov.cn/). As shown in Figure 3, Xujiahui gauge (red dot) is located in the Ur region. Minhang, Baoshan, Jiading and Songjiang gauges (orange dots) are distributed in the OUr region (the distance of the barycenter of the central area is less than 25 km). In addition, other gauges (e.g., Qingpu, Jinshan, Nanhui and Chongming gauges) are positioned in the OS region, which are far from the city center (distance of the barycenter of central area is more than 25 km).
In addition, we selected five rain stations located in coastal areas around Shanghai including one in Jiangsu province (Lvsi site) and four in Zhejiang province (Pinghu, Cixi, Dinghai and Shengsi sites) (see Figure 4). Given that these stations are mainly distributed on islands and in coastal regions, their precipitation trend changes are strongly affected by climatic factors, especially for the oceans.

2.3. Methods

2.3.1. Precipitation Trend Modeling

We used the nonparametric Theil–Sen estimator [60] to calculate the trend of precipitation (i.e., annual extreme amount, extreme precipitation amount and frequency of extreme precipitation). This method is insensitive to outliers and suitable for skewed data. In addition, the nonparametric Mann–Kendall test [61] at a significance level α = 0.05 was applied to examine the statistical significance of the detected precipitation trends.
Usually, a daily precipitation event is defined with the condition that the daily precipitation is larger than 0.1 mm [62]. In addition, the daily precipitation that exceeded the 95th percentile threshold [63] (calculated based on the period 1979–2010) was considered as an extreme precipitation event. The yearly number of extreme precipitation events that exceeded this threshold was used as the frequency of occurrence of extreme precipitation.
In this study, the three-year moving-average method was used to smooth the short-term data fluctuations and to address the precipitation trend in the long-term series [64].

2.3.2. Gridded Precipitation Trends

To quantify the precipitation trends of the entire study area, the inverse distance weighted (IDW) interpolation method was employed to generate the spatially distributed precipitation from the point-scale to the gridded scale [65]. To prevent the “extrapolation” in the gridding process, two rain gauges that located in the surrounding area of Shanghai (Figure 1) were included in interpolation. Five automatic weather stations daily records provided by Shanghai Climate Centre were used to verify the daily precipitation interpolation results in 2008. The 10 rain gauges used in this paper and the automatic weather stations are belonging to the same dataset, but the historical period of the automatic weather stations observation is shorter than rain gauges. The results show that IDW interpolation has high accuracy with an averaged correlation coefficient of 0.78 and root mean square error is less than 10 mm.

2.3.3. Built-Up area Changes

To quantify the spatiotemporal changes of the built-up area, we created a vector layer with a 5 km resolution covering the study area, the four periods of the built-up layers were assigned to the vector layer. The percentage of the built-up area in each block was calculated, based on Equation (1).
P i ,   j = G i ,   j S i   ×   100 %
where P i ,   j is the percentage of the built-up area, i is block number and j represents the year. The parameter G i ,   j is the extent of the block for period j and S i is the total area of block i.
In addition, the change rate of the built-up area percentage from 1979 to 2010 was calculated based on the linear regression model (see Equation (2)).
y = a x + b
where a is the regression coefficient that represents the change rate of the built-up area percentage and x and b represent the time series variables and constant, respectively.

3. Results

3.1. Spatiotemporal Changes in Precipitation Trends

Spatial distribution of the gridded mean annual precipitation in Shanghai during the period 1979–2010 is shown in Figure 5. The precipitation in the Ur and southern OUr is higher than in other areas, with an average annual precipitation of over 1700 mm/year. The relatively low average annual precipitation is located on Chongming Island and the western areas. Figure 6 shows the spatial distributions of the trend for annual precipitation amount, extreme precipitation amount and frequency of extreme precipitation. It is evident that most of the Ur region had an upward trend with respect to the annual and extreme precipitation from 1979 to 2010. The annual precipitation amount exhibited a decreasing trend for most of the OUr and OS regions. We found that regions with an upward trend for extreme precipitation amount and its frequency are mainly distributed over the eastern region of the study area (Figure 6b,c).
Box plots of the precipitation trends during 1979–2010 for the Ur, OUr and OS regions are shown in Figure 7. Based on a thorough analysis of Figure 7, the median rise of the annual and extreme precipitation in Ur is higher compared to OUr and OS, which indicates that some areas in Ur exhibit an increasing trend in precipitation. It is noted that the maximum trends of extreme precipitation for the OUr region is nearly 2.0 mm/year.

3.2. Spatiotemporal Changes of Built-Up Areas

Based on Equations (1) and (2), we calculated the percentage changes of the built-up areas given the selected four periods. As shown in Figure 8, in 1979, most of the built-up areas were primarily located in the central area of Shanghai. From 1990, the built-up areas have expanded throughout the Ur region of Shanghai, and some new built-up areas have been established around the OUr region. Since 2000, there has been an expansion of the built-up areas to the OS region. In 2010, the percentage of built-up areas in OS region exceeded 20%. Overall, from 1979 to 2010, it is noted that the fastest areas of expansion are located in the OUr region (Figure 9). The grids with higher change rates of the built-up area are mainly distributed in the OUr region, e.g., within the 25 km distance of the barycenter of the central area. The OS region, far away from the central area, has a relatively lower changing rate.
To further investigate the potential changes of the trend in precipitation and the variation of the built-up area, a quantitative analysis of the relationship between changes in the built-up area and the distribution of precipitation is presented in Section 3.3.

3.3. The Relationship between Precipitation Trends and Built-Up Changes

Scatter plots for the precipitation trend and changes of the built-up in the Ur, OUr and OS regions are shown in Figure 10. Overall, the linear-fitting mode of the precipitation trends and built-up area change rates of the three regions are different. The rapid growth in the percentage of built-up area in the OUr is positively correlated with the increase in the precipitation trend (correlation coefficient >0.4). As such, higher changing rates of the built-up area is associated with a larger increase in precipitation over time. In contrast, although the Ur experienced relatively rapid growth of the built-up area percentage, there is a strong negative correlation between the precipitation trend and the changes in the built-up area percentage. In addition, the precipitation trend for the OS is smaller than that of the Ur and OUr regions, and a negative correlation is observed between the precipitation trend and changes in the built-up area percentage.
Spatial distributions of the blocks that exhibit an upward precipitation trend and the rapid built-up area changes (the change rate of built-up area percentage exceeds 0.2, red filled) are shown in Figure 11. These blocks are mainly distributed in the OUr region. In contrast to the circular distribution surrounding the Ur region for the frequency of extreme precipitation, annual precipitation amount and extreme precipitation amount are concentrated in the south of the Ur and OUr regions.

4. Discussion

The urbanization process is complex and includes continuous population concentration, industrialization and commercialization that trigger the conversion of underlying surface types, as well as changes in urban geometry. Changes involving wider impervious surface areas consisting of cement and asphalt dramatically alter the environment factors of urban boundary layer, including land surface albedo, roughness, surface latent fluxes, etc. [66,67,68]. In this process, decreases in albedo increase the radiative energy absorption by urban land surface [69,70]; higher and denser urban buildings increase the roughness length, which exerts a stronger drag on the wind [71,72,73,74]. Moreover, a lower canopy fraction results in reduced ground moisture content and surface latent fluxes [75,76]. Urbanization is often associated with high emissions of artificial aerosols, which reflects and scatter solar radiation, thereby altering the energy budget and acting as cloud condensation nuclei [77]. In addition, anthropogenic heat production enhances sensible heat flux from the land surface to the atmosphere near cities [78,79,80]. The urban boundary layer is described as being unstable whenever the surface is warmer than the air and in a state of free convection in the case of vigorous thermal updrafts and downdrafts [81].
The changes of the urban boundary layer thermodynamic stability induced by increased urbanization processes can affect the local microclimate [82,83,84]. In addition, enhanced convection over a city can cause a measurable increase in convective clouds and thunderstorms, and it may also produce modification of precipitation patterns [85]. It has been shown in previous studies that thermally induced changes in circulation play an important role in the simulated precipitation increase in the central urban domain [13,29]. For instance, Souma, Sunada, Suetsugi and Tanaka [21] confirmed that the increase in the amount of precipitation over the Tokyo urban area was caused by anthropogenic heat and artificial land cover.
In the current study, we considered changes in built-up area as one of the most important factors that influence the occurrence and intensity of urban precipitation [86,87]. We also demonstrated that precipitation trends show different characteristics in the Ur, OUr and OS regions in Shanghai, during the period of rapid urbanization. However, further efforts are still needed to determine changes in other factors interlinked with urbanization in Shanghai, for example, the impact of urban heat island (UHI) effects on precipitation. In addition, apart from LULC changes, influences of natural external variability including extreme precipitation is also very important and is often assumed to scale with changes in atmospheric moisture and content [88] and large-scale circulation patterns [89]. As a coastal city, precipitation in Shanghai is not only influenced by anthropogenic activities but is also affected by adjacent oceans. Therefore, detailed analyses of observed trends in temperature change in Shanghai during urbanization and the effects of regional and nearby oceanic influences on precipitation, should be thoroughly investigated.

4.1. The Spatiotemporal Changes of Temperature Trends

Due to the physical mechanism and thermal modifications of the urban boundary layer, this causes the city center to be warmer than the surrounding rural areas. This phenomenon as termed the UHI effect [90,91,92]. Figure 12 shows the time series of temperature in Shanghai from 1960 to 2010 based on in situ observations. It is evident that mean annual temperature, mean summer temperature, and mean winter temperature recorded at stations located in the Ur, OUr and OS regions generally exhibit an upward trend from 1960 to 2010. From the 1960s to the early 1980s, the temperature and change trends among those three regions are relatively synchronized. However, from the mid-1980s, the observed annual average temperature differences gradually become more prominent due to rapid urbanization. The temperature of Ur becomes gradually higher than measurements from the gauges distributed in OUr and OS. As previously indicated, associated with the expansion of the built-up area, the central area has a relatively high degree of built-up area percentage, which inevitably increases the impervious surface cover with its high heat capacity. Therefore, the quantitative relationship between the temperature and the changing rate of the built-up in the Ur, OUr and OS regions during 1979–2010 is further discussed.
The spatial pattern of mean annual temperature indicates that areas with an upward change trend are mainly distributed over the Ur and OUr regions (Figure 13a). Urbanization and LULC changes may contribute to the spatial distribution difference of the evolution trends of temperature in Shanghai. The largest rise in mean annual temperature occurs in the southwest of OUr, where the change rate of built-up area percentage is the highest. However, it is noted that most of the Chongming Island and northern OUr region had an upward trend with respect to the extreme high temperature and days of extreme high temperature from 1979 to 2010 (Figure 13b,c).
Figure 14 shows the relationship between temperature and the change rate of the built-up area in the Ur, OUr and OS regions. Although the warming trend for mean annual temperature was observed in Ur, the increase in the built-up area percentage has a poor linear fit for a change in temperature. In contrast, the temperature warming trends for OUr and OS are positively related to the growth of the built-up area (correlation coefficient >0.5). Many previous studies have concluded that land use change caused by urbanization is the primary driving factor for the increase in temperature. Kalnay and Cai [87] estimated that there was a 0.27 °C mean surface warming per century due to land-use changes, which is at least twice as high as previous estimates based only on urbanization. However, the days of extreme temperature only show lightly positive relationship with the growth of the built-up area in OS (correlation coefficient >0.3).

4.2. Analysis of the Possible Influence of Urbanization on Precipitation

The time series of the annual precipitation amount from 1979 to 2010 and the percentage of the built-up area from 1990 to 2010 for Xujiahui and five coastal sites are shown in Figure 15. The results show that there are remarkably different patterns for the percentage of built-up area. For Xujiahui station, the percentage of built-up area in the surrounding 5 km buffer zones exceeded 90% in the period from 1990 to 2010, and an obvious increasing trend at a rate of 4.75 mm/year was observed at this station from 1979 to 2010 (statistically significant at the α = 0.05 level). Among coastal stations, Cixi station also exhibits an increasing trend at a rate of 1.30 mm/year. However, a decreasing trend in annual precipitation amount was observed for the Pinghu and Dinghai stations, and a relatively weak increasing trend was observed for the Lvsi and Shengsi stations (not statistically significant at the α = 0.05 level). We found that the amount of precipitation increased significantly in the Shanghai urban areas and suggest that urbanization has a profound impact on precipitation at a regional level.
Moreover, the effects of regional and nearby oceanic influences on precipitation trends in Shanghai should be considered in detail. Firstly, a brief statement of sea–land breezes is appropriate because rain in coastal regions is usually initiated by the convergence associated with land–sea breezes [93]. The different thermal conductivity of the land surface and sea surface results in the land–sea temperature difference and causes horizontal pressure gradients which can drive mesoscale circulations, daytime sea breeze and nighttime land breeze [81]. The subsequent sea breeze may affect the diurnal cycle and intensity of local precipitation by modifying low-level convergence [94,95]. However, urban-induced circulation changes can cause enhanced convergence leading to moisture transport from the ocean [96,97]. Lei et al. [98] found that even with the active-phase monsoon urbanization also contributes to local heavy precipitation and mesoscale precipitation distribution, and the upward trends of precipitation region in Mumbai city was increased due to the feedback of the sea breeze–urban landscape convergence. In Shanghai, previous studies have documented that the urban heat island effect is most prominent during the late afternoon to early evening, which combines the influence of urban effects and the basic local circulation associated sea breeze. Thus, urban heavy precipitation is much more intensive than that in rural areas [55].
The decadal and interdecadal variabilities of precipitation in China may be associated with the large-scale East Asia Summer Monsoon (EASM) circulation features [99,100]. The prevailing winds in summer controlled by the EASM are the southeast winds that blow from adjacent seas [101]. The variation of precipitation is closely related to the northward airflow, with an abundance of water vapor and humidity. It has been proposed in many studies that the large-scale anomaly of summer precipitation has a complex relationship at intraseasonal, interannual and interdecadal timescale [102,103,104]. In addition, after the late 1970s, EASM exhibited a low northward movement with a northern edge located south of its normal position. Reduced summer precipitation occurred in East China except for the Yangtze River basin [99,105]. Recently, numerical model simulations have shown that the expansion of the urban surface is an important factor that weakened the EASM system after the 1990s via changes in thermal states [106]. It is noted that human-induced land use changes in East China could affect the climate [67,107]. According to our results (Figure 6), it is evident that the spatial distribution of extreme precipitation and its frequency exhibits a large upward trend in the upwind region of the East Asian Summer Monsoon, i.e., the southeast coastal area. According to Liang and Ding [55], the prevailing wind direction convergence zone over Shanghai central city areas and the nearby suburbs is similar to that of the heat-island area. In combination, these two factors readily led to the occurrence of heavy precipitation events. However, we currently still do not have an adequate understanding of the changes of EASM in terms of onset, intensity and the influence of these changes on precipitation in Shanghai.
Additionally, some studies have revealed that the changes in annual and extreme precipitations in China are also related to the large-scale circulation indexes [89,108,109], including the El Niño-Southern Oscillation (ENSO), the North Atlantic Oscillation (NAO), the Southern Oscillation Index (SOI) and the Pacific Decadal Oscillation (PDO). For example, summer rainfall anomalies in China are different between the developing and decaying phases of ENSO. In Shanghai, Liu et al. [110] performed the chi-square test on daily precipitation from 1951 to 2001, and the results indicate that the El Niño events lead to more precipitation than normal year. Regional precipitation events may not only be related to ENSO and monsoon variability but also to some local mechanisms (e.g., warming environment or aerosols) [111]. This means that the regional changes of precipitation are more complex, and further comprehensive analyses involving natural climatic factors combined with numerical modeling studies will be beneficial.

5. Conclusions

We analyzed Landsat satellite images for 1979, 1990, 2000 and 2010, in addition to rain gauge-based daily precipitation observations from January 1979 to December 2010 in Shanghai to investigate the effects of LULC changes on precipitation. The conclusions are summarized as follows.
(1)
Precipitation trends show different characteristics in the Ur, OUr and OS region during a period of rapid urbanization. Most Ur regions had an upward trend in terms of annual and extreme precipitation from 1979 to 2010. In comparison, the trends in annual precipitation were downward in most OUr and OS regions. Moreover, we found that the upward trends in extreme precipitation including extreme amount and frequency are distributed throughout the eastern region of the study area. From 1979 to 2010, the areas of most rapid expansion were in the OUr region. The grids with higher change rates of the built-up area are mainly distributed in the OUr region, e.g., within 25 km of the barycenter of the central area. The OS region, far away from the central area, has a relatively lower changing rate.
(2)
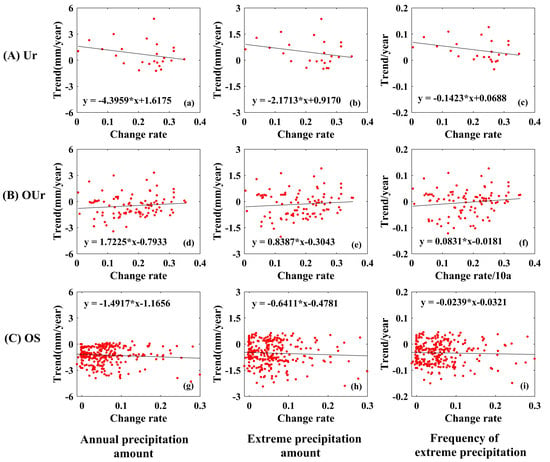
The rapid growth of the built-up area percentage in the OUr is positively correlated with the increase of precipitation. The larger the change of the built-up area percentage, the more pronounced the increase in precipitation over time. In contrast, although the Ur experienced relatively rapid growth of built-up area percentage, there is a negative correlation between precipitation and changes in the built-up area percentage.
(3)
The quantitative relationship between temperature and the change rates of the built-up indicates that the warming trends in the Ur and OUr region are distinct. The largest increase in the annual mean temperature was observed in the southwest of OUr, where the change rate of the built-up area percentage was highest, which is related to the growth of the built-up area.
(4)
The data from five rain stations located in coastal areas around Shanghai that have hardly experienced obvious urbanization processes were used for precipitation trend analysis of climate backgrounds. We found that the magnitude of precipitation increased significantly in the Shanghai urban areas, which suggests that urbanization has a profound impact on precipitation at the regional level.
In summary, we investigated the statistical relationship between urban sprawl and precipitation changes; however, the analysis of the influence mechanism of LULC changes on the regional climate still needs to be further studied. In the future, we will expand the study to include urban agglomerations and attempt to combine climate simulations based on the Weather Research and Forecasting (WRF) model and high-resolution gridded satellite-based precipitation data for further urban agglomeration precipitation analysis.

Author Contributions

Q.J. carried out the data analysis and wrote the majority of the paper. X.H. supported the structure of the paper and revised the paper. J.W. (Jun Wang) is the supervisor of Q.J. and designed the experiments. J.W. (Jiahong Wen) contributed many conceptual and practical ideas. H.M., M.X. and J.G. participated in the discussion of the paper. All authors have read and agreed to the published version of the manuscript.

Funding

This research was funded by the Major Program of National Social Science Foundation of China (18ZDA105); the National Key Research and Development Program of China (2018YFC1508803); the National Natural Science Foundation of China (41671095 and 41971199); and Shanghai Science and Technology Support Program (19DZ1201505).

Conflicts of Interest

The authors declare no conflict of interest.

References

  1. Gremm, J.; Barth, J.; Fietkiewicz, K.J.; Stock, W.G. Informational Cities in the GCC States. In Transitioning Towards a Knowledge Society: Qatar as a Case Study; Springer: Berlin/Heidelberg, Germany, 2018; pp. 3–36. [Google Scholar]
  2. Abadie, L.M.; Galarraga, I.; Sainz de Murieta, E. Understanding risks in the light of uncertainty: Low-probability, high-impact coastal events in cities. Env. Res. Lett. 2017, 12, 014017. [Google Scholar] [CrossRef]
  3. IPCC. Integrated Risk and Uncertainty Assessment of Climate Change Response Policies. In Climate Change 2014: Mitigation of Climate Change: Working Group III Contribution to the IPCC Fifth Assessment Report, Intergovernmental Panel on Climate, C.; Cambridge University Press: Cambridge, UK, 2015; pp. 151–206. [Google Scholar]
  4. Shen, M.X.; Chen, J.; Zhuan, M.J.; Chen, H.; Xu, C.Y.; Xiong, L.H. Estimating uncertainty and its temporal variation related to global climate models in quantifying climate change impacts on hydrology. J. Hydrol. 2018, 556, 10–24. [Google Scholar] [CrossRef]
  5. Kim, S.; Shin, Y.; Kim, H.; Pak, H.; Ha, J. Impacts of typhoon and heavy rain disasters on mortality and infectious diarrhea hospitalization in South Korea. Int. J. Environ. Health Res. 2012, 23, 365–376. [Google Scholar] [CrossRef] [PubMed]
  6. Wang, J.; Yi, S.; Li, M.Y.; Wang, L.; Song, C.C. Effects of sea level rise, land subsidence, bathymetric change and typhoon tracks on storm flooding in the coastal areas of Shanghai. Sci. Total. Env. 2017, 621, 228–234. [Google Scholar] [CrossRef]
  7. Löwe, R.; Urich, C.; Sto Domingo, N.; Mark, O.; Deletic, A.; Arnbjerg-Nielsen, K. Assessment of Urban Pluvial Flood Risk and Efficiency of Adaptation Options Through Simulations-A New Generation of Urban Planning Tools. J. Hydrol. 2017, 550, 355–367. [Google Scholar] [CrossRef] [Green Version]
  8. Russo, S.; Dosio, A.; Graversen, R.; Sillmann, J.; Carrao, H.; Dunbar, M.; Singleton, A.; Montagna, P.; Barbosa, P.; Vogt, J. Magnitude of extreme heat waves in present climate and their projection in a warming world. J. Geophys. Res.-Atmos. 2014, 119, 12500–12512. [Google Scholar] [CrossRef] [Green Version]
  9. Binita, K.; Shepherd, J.M.; Johnson, G.C. Climate change vulnerability assessment in Georgia. Appl. Geogr. 2015, 62, 62–74. [Google Scholar]
  10. Carter, J.G.; Cavan, G.; Connelly, A.; Guy, S.; Handley, J.; Kazmierczak, A. Climate change and the city: Building capacity for urban adaptation. Prog. Plann. 2015, 95, 1–66. [Google Scholar] [CrossRef]
  11. Fan, F.L.; Weng, Q.H.; Wang, Y.P. Land Use and Land Cover Change in Guangzhou, China, from 1998 to 2003, Based on Landsat TM /ETM+ Imagery. Sensors 2007, 7, 1323–1342. [Google Scholar] [CrossRef] [Green Version]
  12. Bornstein, R.; Lin, Q.L. Urban heat islands and summertime convective thunderstorms in Atlanta: Three case studies. Atmos Env. 2000, 34, 507–516. [Google Scholar] [CrossRef]
  13. Seino, N.; Aoyagi, T.; Tsuguti, H. Numerical simulation of urban impact on precipitation in Tokyo: How does urban temperature rise affect precipitation? Urban. Clim. 2018, 23, 8–35. [Google Scholar] [CrossRef]
  14. Seto, K.C.; Fragkias, M.; Güneralp, B.; Reilly, M.K. A Meta-Analysis of Global Urban Land Expansion. PLoS ONE 2011, 6, e23777. [Google Scholar] [CrossRef]
  15. Seto, K.C.; Güneralp, B.; Hutyra, L. Global Forecasts of Urban Expansion to 2030 and Direct Impacts on Biodiversity and Carbon Pools. PLoS ONE 2012, 109, 16083–16088. [Google Scholar] [CrossRef] [PubMed] [Green Version]
  16. Kusaka, H.; Nawata, K.; Suzuki-Parker, A.; Takane, Y.; Furuhashi, N. Mechanism of Precipitation Increase with Urbanization in Tokyo as Revealed by Ensemble Climate Simulations. J. Appl. Meteorol. Clim. 2014, 53, 824–839. [Google Scholar] [CrossRef]
  17. Sharma, R.; Joshi, P.K. Mapping environmental impacts of rapid urbanization in the National Capital Region of India using remote sensing inputs. Urban. Clim. 2016, 15, 70–82. [Google Scholar] [CrossRef]
  18. Bae, S.Y.; Jeong, J.I.; Park, R.J.; Lim, K.S.S.; Hong, S.Y. Weekly variability of precipitation induced by anthropogenic aerosols: A case study in Korea in summer 2004. Sci. Total. Env. 2016, 541, 1531–1539. [Google Scholar] [CrossRef] [Green Version]
  19. Lee, S.S.; Tao, W.K.; Jung, C.-H. Aerosol Effects on Instability, Circulations, Clouds, and Precipitation. Adv. Meteorol. 2014, 2014, 1–8. [Google Scholar] [CrossRef]
  20. Yan, H.; Fan, S.X.; Guo, C.X.; Hu, J.; Dong, l. Quantifying the Impact of Land Cover Composition on Intra-Urban Air Temperature Variations at a Mid-Latitude City. PLoS ONE 2014, 9, e102124. [Google Scholar] [CrossRef]
  21. Souma, K.; Sunada, K.; Suetsugi, T.; Tanaka, K. Use of ensemble simulations to evaluate the urban effect on a localized heavy rainfall event in Tokyo, Japan. J. Hydro-Environ. Res. 2013, 7, 228–235. [Google Scholar] [CrossRef]
  22. Smith, C.; Lindley, S.; Levermore, G. Estimating spatial and temporal patterns of urban anthropogenic heat fluxes for UK cities: The case of Manchester. Appl. Clim. 2009, 98, 19–35. [Google Scholar] [CrossRef]
  23. Zhong, S.; Qian, Y.; Zhao, C.; Leung, L.; Yang, X.Q. A Case Study of Urbanization Impact on Summer Precipitation in the Greater Beijing Metropolitan Area: Urban Heat Island Versus Aerosol Effects. J. Geophys. Res.-Atmos. 2015, 120, 10903–10914. [Google Scholar] [CrossRef]
  24. Zhu, K.G.; Xie, M.; Wang, T.J.; Cai, J.X.; Li, S.B.; Feng, W. A modeling study on the effect of urban land surface forcing to regional meteorology and air quality over South China. Atmos. Environ. 2017, 152, 389–404. [Google Scholar] [CrossRef]
  25. Jin, M.L.; Marshall Shepherd, J.; King, M.D. Urban aerosols and their variations with clouds and rainfall: A case study for New York and Houston. J. Geophys. Res.-Atmos. 2005, 110, D10S20. [Google Scholar] [CrossRef]
  26. Lin, L.; Wang, Z.L.; Xu, Y.Y.; Fu, Q. Sensitivity of precipitation extremes to radiative forcing of greenhouse gases and aerosols. Geophys. Res. Lett. 2016, 43, 9860–9868. [Google Scholar] [CrossRef]
  27. Yang, B.; Zhang, Y.C.; Qian, Y. Simulation of urban climate with high-resolution WRF model: A case study in Nanjing, China. Asia-Pac. J. Atmos. Sci. 2012, 48, 227–241. [Google Scholar] [CrossRef]
  28. Pathirana, A.; Denekew, H.B.; Veerbeek, W.; Zevenbergen, C.; Banda, A.T. Impact of urban growth-driven landuse change on microclimate and extreme precipitation-A sensitivity study. Atmos. Res. 2014, 138, 59–72. [Google Scholar] [CrossRef]
  29. Holst, C.C.; Tam, C.-Y.; Chan, J.C.L. Sensitivity of urban rainfall to anthropogenic heat flux: A numerical experiment. Geophys. Res. Lett. 2016, 43, 2240–2248. [Google Scholar] [CrossRef] [Green Version]
  30. Souma, K.; Tanaka, K.; Suetsugi, T.; Sunada, K.; Tsuboki, K.; Shinoda, T.; Wang, Y.Q.; Sakakibara, A.; Hasegawa, K.; Moteki, Q.; et al. A comparison between the effects of artificial land cover and anthropogenic heat on a localized heavy rain event in 2008 in Zoshigaya, Tokyo, Japan. J. Geophys. Res.-Atmos. 2013, 118, 11600–11610. [Google Scholar] [CrossRef]
  31. Solecki, W.D.; Oliveri, C. Downscaling climate change scenarios in an urban land use change model. J. Env. Manag. 2004, 72, 105–115. [Google Scholar] [CrossRef] [PubMed]
  32. Shem, W.; Shepherd, M. On the impact of urbanization on summertime thunderstorms in Atlanta: Two numerical model case studies. Atmos. Res. 2009, 92, 172–189. [Google Scholar] [CrossRef]
  33. Cunha, A.P.M.A.; Alvalá, R.C.S.; Kubota, P.Y.; Vieira, R.M.S.P. Impacts of land use and land cover changes on the climate over Northeast Brazil. Atmos. Sci. Lett. 2015, 16, 219–227. [Google Scholar] [CrossRef]
  34. Bhati, S.; Mohan, M. WRF model evaluation for the urban heat island assessment under varying land use/land cover and reference site conditions. Appl. Clim. 2016, 126, 385–400. [Google Scholar] [CrossRef]
  35. Vahmani, P.; Ban-Weiss, G.A. Impact of remotely sensed albedo and vegetation fraction on simulation of urban climate in WRF-urban canopy model: A case study of the urban heat island in Los Angeles. J. Geophys. Res.-Atmos. 2016, 121, 1511–1531. [Google Scholar] [CrossRef]
  36. Salathé, E.; Leung, L.; Qian, Y.; Zhang, Y.X. Regional Climate Models Regional Climate Model Projections for the State of Washington. Clim. Chang. 2010, 102, 51–75. [Google Scholar] [CrossRef] [Green Version]
  37. Wehner, M.F.; Smith, R.L.; Bala, G.; Duffy, P. The effect of horizontal resolution on simulation of very extreme US precipitation events in a global atmosphere model. Clim. Dynam. 2010, 34, 241–247. [Google Scholar] [CrossRef] [Green Version]
  38. Mishra, V.; Dominguez, F.; Lettenmaier, D.P. Urban precipitation extremes: How reliable are regional climate models? Geophys. Res. Lett. 2012, 39, 419–420. [Google Scholar] [CrossRef] [Green Version]
  39. Bolgiani, P.; Fernández-González, S.; Valero, F.; Merino, A.; García-Ortega, E.; Sánchez, J.L.; Martín, M.L. Numerical Simulation of a Heavy Precipitation Event in the Vicinity of Madrid-Barajas International Airport: Sensitivity to Initial Conditions, Domain Resolution, and Microphysics Parameterizations. Atmosphere 2018, 9, 329. [Google Scholar] [CrossRef] [Green Version]
  40. Sertel, E.; Robock, A.; Ormeci, C. Impacts of land cover data quality on regional climate simulations. Int. J. Clim. 2010, 30, 1942–1953. [Google Scholar] [CrossRef]
  41. Xie, Y.H.; Shi, J.C.; Lei, Y.H.; Xing, J.Y.; Yang, A.Q. Impacts of land cover change on simulating precipitation in Beijing area of China. Int. Geosci. Remote Sens. Symp. (Igarss) 2014, 4145–4148. [Google Scholar] [CrossRef]
  42. Zhang, K.H.L.; Song, S.F. Rural–urban migration and urbanization in China: Evidence from time-series and cross-section analyses. China Econ. Rev. 2003, 14, 386–400. [Google Scholar] [CrossRef]
  43. Zhao, D.M.; Wu, J. Regional warming induced by urban surface expansion in Shanghai. Atmos. Ocean. Sci. Lett. 2018. 11, 228–235. [CrossRef] [Green Version]
  44. Wang, Y.L.; Feng, J.M.; Gao, H. Numerical simulation of the impact of land cover change on regional climate in China. Appl. Clim. 2013, 115, 141–152. [Google Scholar] [CrossRef]
  45. Zhao, D.M.; Wu, J. Changes in urban-related precipitation in the summer over three city clusters in China. Appl. Clim. 2018, 134, 83–93. [Google Scholar] [CrossRef]
  46. Hu, Y.H.; Jia, G.S. Influence of land use change on urban heat island derived from multi-sensor data. Int. J. Clim. 2010, 30, 1382–1395. [Google Scholar] [CrossRef]
  47. Sang, Y.F.; Wang, Z.G.; Li, Z.; Liu, C.M.; Liu, X.J. Investigation into the daily precipitation variability in the Yangtze River Delta, China. Hydrol. Process. 2013, 27, 175–185. [Google Scholar] [CrossRef]
  48. Chen, S.; Li, W.B.; Du, Y.D.; Mao, C.Y.; Zhang, L. Urbanization effect on precipitation over the Pearl River Delta based on CMORPH data. Adv. Clim. Chang. Res. 2015, 6, 16–22. [Google Scholar] [CrossRef]
  49. Wang, D.G.; Jiang, P.; Wang, G.L.; Wang, D.S. Urban extent enhances extreme precipitation over the Pearl River Delta, China. Atmos. Sci. Lett. 2015, 16, 310–317. [Google Scholar] [CrossRef]
  50. Su, Y.X.; Chen, X.Z.; Wang, C.Y.; Zhang, H.O.; Liao, J.S.; Ye, Y.Y.; Wang, C.J. A new method for extracting built-up urban areas using DMSP-OLS nighttime stable lights: A case study in the Pearl River Delta, southern China. Gisci. Remote Sens. 2015, 52, 218–238. [Google Scholar] [CrossRef]
  51. Li, W.Y.; He, X.G.; Scaioni, M.; Yao, D.J.; Mi, C.R.; Zhao, J.; Chen, Y.; Zhang, K.H.; Gao, J.; Li, X. Annual precipitation and daily extreme precipitation distribution: Possible trends from 1960 to 2010 in urban areas of China. Geomat. Nat. Haz. Risk 2019, 10, 1694–1711. [Google Scholar] [CrossRef]
  52. Song, X.M.; Zhang, J.Y.; Aghakouchak, A.; Shouraseni, S.R.; Xuan, Y.Q.; Wang, G.Q.; He, R.M.; Wang, X.J.; Liu, C.S. Rapid urbanization and changes in spatiotemporal characteristics of precipitation in Beijing metropolitan area. J. Geophys. Res.-Atmos. 2014, 119, 11250–11271. [Google Scholar] [CrossRef] [Green Version]
  53. Chen, X.H.; Liu, B.J.; Chen, G. Effects of Urbanization on Precipitation Characteristics. J. Nat. Resour. (Chin.) 2017, 32, 1591–1601. [Google Scholar]
  54. Liang, P.; Ding, Y.H.; He, J.M.; Tang, X. Study of relationship between urbanization speed and change of spatial distribution of rainfall over Shanghai. J. Trop. Meteorol. (Chin.) 2011, 27, 475–483. [Google Scholar]
  55. Liang, P.; Ding, Y.H. The Long-term Variation of Extreme Heavy Precipitation and Its Link to Urbanization Effects in Shanghai during 1916–2014. Adv. Atmos. Sci. 2017, 34, 321–334. [Google Scholar] [CrossRef]
  56. Shanghai Statistical YearBook 2019. Shanghai Municipal Statistics Bureau. Available online: http://tjj.sh.gov.cn/ (accessed on 1 August 2020).
  57. Du, S.Q.; Gu, H.H.; Wen, J.H.; Chen, K.; Van Rompaey, A. Detecting Flood Variations in Shanghai over 1949–2009 with Mann-Kendall Tests and a Newspaper-Based Database. Water 2015, 7, 1808–1824. [Google Scholar] [CrossRef] [Green Version]
  58. Meng, F.; Kang, J.; Li, W.; Wu, T.; Wang, T.; An, Y. Analysis and evaluation of typhoon disasters in Shanghai in past 50 years. J. Catastrophology (Chin.) 2007, 22, 71–76. [Google Scholar]
  59. Yin, J.; Yin, Z.E.; Zhong, H.D.; Xu, S.Y.; Hu, X.M.; Wang, J.; Wu, J.P. Monitoring urban expansion and land use/land cover changes of Shanghai metropolitan area during the transitional economy (1979–2009) in China. Env. Monit Assess. 2011, 177, 609–621. [Google Scholar] [CrossRef]
  60. Wilcox, R.R. A note on the Theil-Sen regression estimator when the regressor is random and the error term is heteroscedastic. Biom. J. 1998, 40, 261–268. [Google Scholar] [CrossRef]
  61. Hamed, K.H.; Rao, A.R. A modified Mann-Kendall trend test for autocorrelated data. J. Hydrol. 1998, 204, 182–196. [Google Scholar] [CrossRef]
  62. Ma, S.M.; Zhou, T.J.; Dai, A.G.; Han, Z.Y. Observed Changes in the Distributions of Daily Precipitation Frequency and Amount over China from 1960 to 2013. J. Clim. 2015, 28, 6960–6978. [Google Scholar] [CrossRef]
  63. Pfeifer, S.; Bülow, K.; Gobiet, A.; Hänsler, A.; Mudelsee, M.; Otto, J.; Rechid, D.; Teichmann, C.; Jacob, D. Robustness of Ensemble Climate Projections Analyzed with Climate Signal Maps: Seasonal and Extreme Precipitation for Germany. Atmosphere 2015, 6, 677–698. [Google Scholar] [CrossRef] [Green Version]
  64. Sonesson, C. Evaluations of some Exponentially Weighted Moving Average methods. J. Appl. Stat. 2003, 30, 1115–1133. [Google Scholar] [CrossRef] [Green Version]
  65. Lu, G.Y.; Wong, D.W. An adaptive inverse-distance weighting spatial interpolation technique. Comput. Geosci. 2008, 34, 1044–1055. [Google Scholar] [CrossRef]
  66. Li, X.; Mitra, C.; Dong, L.; Yang, Q.C. Understanding land use change impacts on microclimate using Weather Research and Forecasting (WRF) model. Phys. Chem. Earth 2018, 103, 115–126. [Google Scholar] [CrossRef]
  67. Kamal, S.; Huang, H.P.; Myint, S.W. The Influence of Urbanization on the Climate of the Las Vegas Metropolitan Area: A Numerical Study. J. Appl. Meteorol. Clim. 2015, 54, 2157–2177. [Google Scholar] [CrossRef]
  68. de Souza, D.O.; dos Santos Alvala, R.C.; do Nascimento, M.G. Urbanization effects on the microclimate of Manaus: A modeling study. Atmos. Res. 2016, 167, 237–248. [Google Scholar] [CrossRef]
  69. Akbari, H.; Matthews, H.D.; Seto, D. The long-term effect of increasing the albedo of urban areas. Env. Res. Lett. 2012, 7, 024004. [Google Scholar] [CrossRef]
  70. Trlica, A.; Hutyra, L.R.; Schaaf, C.L.; Erb, A.; Wang, J.A. Albedo, Land Cover, and Daytime Surface Temperature Variation Across an Urbanized Landscape. Earth’s Future 2017, 5, 1084–1101. [Google Scholar] [CrossRef] [Green Version]
  71. Yuan, C.; Ng, E. Building Porosity for Better Urban Ventilation in High-Density Cities-A computational parametric study. Build. Env. 2012, 50, 176–189. [Google Scholar] [CrossRef] [PubMed]
  72. Klipp, C. Wind Direction Dependence of Atmospheric Boundary Layer Turbulence Parameters in the Urban Roughness Sublayer. J. Appl. Meteorol. Clim. 2007, 46, 2086–2097. [Google Scholar] [CrossRef] [Green Version]
  73. Crago, R.D.; Okello, W.; Jasinski, M.F. Equations for the Drag Force and Aerodynamic Roughness Length of Urban Areas with Random Building Heights. Bound.-Lay Meteorol. 2012, 145, 423–437. [Google Scholar] [CrossRef]
  74. Liu, G.; Sun, J.N.; Jiang, W.M. Observational verification of urban surface roughness parameters derived from morphological models. Meteorol. Appl. 2009, 16, 205–213. [Google Scholar] [CrossRef]
  75. Padmakumari, B.; Jaswal, A.K.; Goswami, B.N. Decrease in evaporation over the Indian monsoon region: Implication on regional hydrological cycle. Clim. Chang. 2013, 121, 787–799. [Google Scholar] [CrossRef]
  76. Guo, X.L.; Fu, D.H.; Wang, J. Mesoscale convective precipitation system modified by urbanization in Beijing City. Atmos. Res. 2006, 82, 112–126. [Google Scholar] [CrossRef]
  77. Pozo, D.; Marín, J.C.; Raga, G.B.; Baumgardner, D. Aerosol particles in the Mexican East Pacific. Part II: Numerical simulations of the impact of enhanced CCN on precipitation development. Atmosfera 2013, 26, 221–241. [Google Scholar] [CrossRef] [Green Version]
  78. Kato, S.; Yamaguchi, Y. Analysis of urban heat-island effect using ASTER and ETM+ Data: Separation of anthropogenic heat discharge and natural heat radiation from sensible heat flux. Remote Sens. Env. 2005, 99, 44–54. [Google Scholar] [CrossRef]
  79. Sailor, D.J. A review of methods for estimating anthropogenic heat and moisture emissions in the urban environment. Int. J. Clim. 2011, 31, 189–199. [Google Scholar] [CrossRef]
  80. Allen, L.; Lindberg, F.; Grimmond, C.S.B. Global to city scale urban anthropogenic heat flux: Model and variability. Int. J. Clim. 2011, 31, 1990–2005. [Google Scholar] [CrossRef]
  81. Wallace, J.M.; Hobbs, P.V. Atmospheric Science-An Introductory Survey, 2nd ed.; Academic Press: Cambridge, MA, USA, 2006; pp. 375–412. [Google Scholar]
  82. Wong, P.; Lai, P.C.; Hart, M. Temporal statistical analysis of urban heat islands at the microclimate level. Procedia Env. Sci. 2015, 26, 91–94. [Google Scholar]
  83. González-Aparicio, I.; Baklanov, A.; Hidalgo, J.; Korsholm, U.; Mahura, A. Impact of city expansion and increased heat fluxes scenarios on the urban boundary layer of Bilbao using Enviro-HIRLAM. Urban. Clim. 2014, 10, 831–845. [Google Scholar] [CrossRef]
  84. Sharma, A.; Fernando, H.J.S.; Hamlet, A.F.; Hellmann, J.J.; Barlage, M.; Chen, F. Urban meteorological modeling using WRF: A sensitivity study. Int. J. Clim. 2017, 37, 1885–1900. [Google Scholar] [CrossRef]
  85. Ganeshan, M.; Murtugudde, R.; Imhoff, M.L. A multi-city analysis of the UHI-influence on warm season rainfall. Urban. Clim. 2013, 6, 1–23. [Google Scholar] [CrossRef]
  86. Kaufmann, R.K.; Seto, K.C.; Schneider, A.; Liu, Z.T.; Zhou, L.M.; Wang, W.L. Climate Response to Rapid Urban Growth: Evidence of a Human-Induced Precipitation Deficit. J. Clim. 2007, 20, 2299–2306. [Google Scholar] [CrossRef]
  87. Kalnay, E.; Cai, M. Impact of urbanization and land-use change on climate. Nature 2003, 423, 528–531. [Google Scholar] [CrossRef]
  88. Sugiyama, M.; Shiogama, H.; Emori, S. Precipitation extreme changes exceeding moisture content increases in MIROC and IPCC climate models. PNAS 2009, 107, 571–575. [Google Scholar] [CrossRef] [Green Version]
  89. Deng, Y.; Jiang, W.G.; He, B.; Chen, Z.; Jia, K. Change in Intensity and Frequency of Extreme Precipitation and its Possible Teleconnection With Large-Scale Climate Index Over the China From 1960 to 2015. J. Geophys. Res.-Atmos. 2018, 123, 1–14. [Google Scholar] [CrossRef]
  90. Menberg, K.; Blum, P.; Schaffitel, A.; Bayer, P. Long-Term Evolution of Anthropogenic Heat Fluxes into a Subsurface Urban Heat Island. Env. Sci. Technol. 2013, 47, 9747–9755. [Google Scholar] [CrossRef]
  91. Mallick, J.; Rahman, A.; Singh, C.K. Modeling urban heat islands in heterogeneous land surface and its correlation with impervious surface area by using night-time ASTER satellite data in highly urbanizing city, Delhi-India. Adv. Space Res. 2013, 52, 639–655. [Google Scholar] [CrossRef]
  92. Deilami, K.; Kamruzzaman, M.; Liu, Y. Urban heat island effect: A systematic review of spatio-temporal factors, data, methods, and mitigation measures. Int. J. Appl. Earth Obs. 2018, 67, 30–42. [Google Scholar] [CrossRef]
  93. Simpson, M.; Raman, S.; Suresh, R.; Mohanty, U.C. Urban effects of Chennai on sea breeze induced convection and precipitation. J. Earth Syst. Sci. 2008, 117, 897–909. [Google Scholar] [CrossRef] [Green Version]
  94. Zhu, L.; Meng, Z.Y.; Zhang, F.Q.; Markowski, P.M. The influence of sea- and land-breeze circulations on the diurnal variability in precipitation over a tropical island. Atmos. Chem. Phys. 2017, 17, 13213–13232. [Google Scholar] [CrossRef] [Green Version]
  95. Baker, R.D.; Lynn, B.H.; Boone, A.; Tao, W.K.; Simpson, J. The Influence of Soil Moisture, Coastline Curvature, and Land-Breeze Circulations on Sea-Breeze-Initiated Precipitation. J. Hydrometeorol. 2001, 2, 193–211. [Google Scholar] [CrossRef] [Green Version]
  96. Huang, W.R.; Chan, J.C.L.; Wang, S.-Y. A planetary-scale land-sea breeze circulation in East Asia and the western North Pacific. Q. J. R. Meteorol. Soc. 2010, 136, 1543–1553. [Google Scholar] [CrossRef] [Green Version]
  97. Lu, X.; Chow, K.C.; Yao, T.; Lau, A.K.H.; Fung, J.C.H. Effects of urbanization on the land sea breeze circulation over the Pearl River Delta region in winter. Int. J. Clim. 2010, 30, 1089–1104. [Google Scholar] [CrossRef] [Green Version]
  98. Lei, M.; Niyogi, D.; Kishtawal, C.; Sr-Pielke, R.A.; Beltrán-Przekurat, A.; Nobis, T.E.; Vaidya, S.S. Effect of explicit urban land surface representation on the simulation of the 26 July 2005 heavy rain event over Mumbai, India. Atmos. Chem. Phys. 2008, 8, 5975–5995. [Google Scholar] [CrossRef] [Green Version]
  99. Ding, Y.H.; Wang, Z.Y.; Sun, Y. Inter-decadal variation of the summer precipitation in East China and its association with decreasing Asian summer monsoon Part I: Observed evidences. Int. J. Clim. 2008, 28, 1139–1161. [Google Scholar] [CrossRef]
  100. Lu, D.R.; Yang, Y.J.; Fu, Y.F. Interannual variability of summer monsoon convective and stratiform precipitations in East Asia during 1998–2013. Int. J. Clim. 2016, 36, 3507–3520. [Google Scholar] [CrossRef]
  101. Hu, Y.J.; Zhong, Z.; Liu, X.Y.; Zhu, Y.M. Influence of air–sea interaction on the simulation of East Asian summer monsoon: A case study. Dynam. Atmos. Ocean. 2012, 53–54, 1–16. [Google Scholar] [CrossRef]
  102. Chen, H.P.; Sun, J.Q. Projected change in East Asian summer monsoon precipitation under RCP scenario. Meteorol. Atmos. Phys. 2013, 121, 55–77. [Google Scholar] [CrossRef]
  103. Jiang, Z.; Yang, S.; He, J.; Li, J.; Liang, J. Interdecadal variations of East Asian summer monsoon northward propagation and influences on summer precipitation over East China. Meteorol. Atmos. Phys. 2008, 100, 101–119. [Google Scholar] [CrossRef]
  104. Ding, A.J.; Wang, T.; Zhao, M.; Wang, T.J.; Li, Z.K. Simulation of sea-land breezes and a discussion of their implications on the transport of air pollution during a multi-day ozone episode in the Pearl River Delta of China. Atmos Env. 2004, 38, 6737–6750. [Google Scholar] [CrossRef]
  105. Zhang, Z.Q.; Sun, X.G.; Yang, X.-Q. Understanding the interdecadal variability of East Asian summer monsoon precipitation: Joint influence of three oceanic signals. J. Clim. 2018, 31, 5485–5505. [Google Scholar] [CrossRef]
  106. Ma, H.Y.; Jiang, Z.H.; Jie, S.; Dai, A.G.; Fei, H. Effects of urban land-use change in East China on the East Asian summer monsoon based on the CAM5.1 model. Clim. Dynam. 2015, 46, 2977–2989. [Google Scholar] [CrossRef]
  107. Wu, J.; Zha, J.l.; Zhao, D.M. Estimating the impact of the changes in land use and cover on the surface wind speed over the East China Plain during the period 1980–2011. Clim. Dynam. 2016, 46, 847–863. [Google Scholar] [CrossRef]
  108. Chen, J.P.; Wen, Z.P.; Wu, R.G.; Chen, Z.S.; Zhao, P. Interdecadal changes in the relationship between Southern China winter-spring precipitation and ENSO. Clim. Dynam. 2014, 43, 1327–1338. [Google Scholar] [CrossRef]
  109. Gao, T.; Wang, H.J.; Zhou, T.J. Changes of extreme precipitation and nonlinear influence of climate variables over monsoon region in China. Atmos. Res. 2017, 197, 379–389. [Google Scholar] [CrossRef]
  110. Liu, C.L.; Zhang, Q.; Xu, Y.P.; Jiang, T. Impacts of ENSO Events on Climate Changes during Last 50 Years in the Yangtze Delta. Meteorological (Chin.) 2005, 31, 12–16. [Google Scholar]
  111. Agilan, V.; Umamahesh, N.V. Detection and attribution of non-stationarity in intensity and frequency of daily and 4-h extreme rainfall of Hyderabad, India. J. Hydrol. 2015, 530, 677–697. [Google Scholar] [CrossRef]
Figure 1. LULC types of Shanghai in 2010.
Applsci 10 07897 g001
Figure 2. Spatiotemporal distributions of built-up and non-built up areas in Shanghai.
Applsci 10 07897 g002
Figure 3. Location of the selected 10 rain gauges in Shanghai and the two surrounding rain gauges.
Applsci 10 07897 g003
Figure 4. Locations of Xujiahui and five coastal stations.
Applsci 10 07897 g004
Figure 5. Spatial distribution of the mean annual precipitation from 1979 to 2010 in Shanghai.
Applsci 10 07897 g005
Figure 6. Spatial distribution of the trends for: (a) annual precipitation amount; (b) extreme precipitation amount; and (c) frequency of extreme precipitation.
Applsci 10 07897 g006
Figure 7. Box plots of the precipitation trends during 1979–2010 for Ur, OUr and OS. The rectangular box plot shows three horizontal lines that represent the median (intermediate line), the 25th percentile (low line) and the 75th percentile values (upper line), while the top and bottom three vertical lines represent the maximum and minimum of the precipitation changes during 1979–2010 for Ur, OUr and OS, respectively. (a) annual precipitation amount; (b) extreme precipitation amount; and (c) frequency of extreme precipitation.
Applsci 10 07897 g007
Figure 8. The percentage of the built-up areas in: (a) 1979; (b) 1990; (c) 2000; and (d) 2010.
Applsci 10 07897 g008
Figure 9. The percentage change rate of the built-up area from 1979 to 2010.
Applsci 10 07897 g009
Figure 10. Scatter plots of the precipitation trend and changes in the rate of built-up area percentage for: the (A) Ur; (B) OUr; and (C) OS regions.
Applsci 10 07897 g010
Figure 11. Spatial distributions of the grids with upward precipitation trends and rapid built-up area changes: (a) annual precipitation amount; (b) extreme precipitation amount; and (c) frequency of extreme precipitation.
Applsci 10 07897 g011
Figure 12. Time series of temperature in Shanghai from 1960 to 2010: (a) mean annual temperature; (b) mean summer temperature; and (c) mean winter temperature.
Applsci 10 07897 g012
Figure 13. Spatial distribution of the trends for: (a) mean annual temperature; (b) extreme high temperature; and (c) days of extreme high temperature from 1979 to 2010.
Applsci 10 07897 g013
Figure 14. Scatter plots of temperature and change rates of built-up area percentage for: the (a) Ur; (b) OUr; and (c) OS regions.
Applsci 10 07897 g014
Figure 15. The time series and estimated trends for annual precipitation amounts from 1979 to 2010 and the percentage of the built-up area from 1990 to 2010 for: (a) Xujiahui; and five coastal sites ((b) Lvsi; (c) Pinghu; (d) Cixi; (e) Dinghai; and (f) Shengsi).
Applsci 10 07897 g015
Table 1. Datasets used in this study.
Data TypePeriodTemporal
Resolution
Spatial ScalePurposeSource
LULC data1979, 1990, 2000, 2010YearlyAreasBuilt-up area detectionUnited States Geological Survey (USGS)
Daily precipitation data1979–2010DailyPointPrecipitation trend analysisShanghai Meteorological Bureau (SMB)
Table 2. Description of the four-periods for the Landsat satellite images.
PeriodDateSensors
19794 AugustLandsat Multispectral Scanner (MSS)
19904 DecemberLandsat-5 Thematic Mapper (TM)
200029 JuneLandsat-7 Enhanced TM (ETM+)
201022 MayLandsat-7 Enhanced TM (ETM+)
Table 3. Description of each land use type.
CategoriesTypes of Land UseLULC Descriptions
Built-up area/Urban land, settlements, other construction land (industrial land, transportation land, airport, special land, etc.)
Non-built-up areaFarmlandCrop fields, vegetable field, fallow and alternate land, etc.)
Green landLand used for growing forest, arbors, shrubs, bamboos, coastal mangroves, etc.
Bare landLand to be built on, unused land, rock, beaches, etc.
WatersRivers, lakes, reservoirs, ponds, mud flat, etc.
Publisher’s Note: MDPI stays neutral with regard to jurisdictional claims in published maps and institutional affiliations.

