Article

The Accuracy of Three Intraoral Scanners in the Oral Environment with and without Saliva: A Comparative Study

1
Department of Basic Medical Sciences, Neurosciences and Sense Organs, “Aldo Moro” University of Bari, 70124 Bari, Italy
2
Private Practice, 70124 Bari, Italy
3
Complex Operative Unit of Odontostomatology, Hospital S.S. Annunziata, 66100 Chieti, Italy
4
Interdisciplinary Department of Medicine, “Aldo Moro” University of Bari, 70124 Bari, Italy
*
Author to whom correspondence should be addressed.
Appl. Sci. 2020, 10(21), 7762; https://doi.org/10.3390/app10217762
Submission received: 8 October 2020 / Revised: 23 October 2020 / Accepted: 24 October 2020 / Published: 2 November 2020

Abstract

:
Background: with the emergence of technological innovations in the dental industry, one emerging trend has been the intraoral digitizing of patients by using intraoral scanning systems. Compared to taking conventional impressions, the use of intraoral scanners (IOS) is suitable for capturing direct optical impressions, helping to improve diagnostic efficacy, save time, reduce patient discomfort, and simplify clinical procedures. Intraoral scanning systems appear to have a high potential for providing guidance on proper standards of care. However, one main disadvantage is breathing and saliva secretion, which causes deviations, interfering with the applicability and accuracy of the optical impression. The aim of this study was to compare the validity and accuracy of three commercially available intraoral scanners, performing an analysis exploiting a wet model. Methods: an in vitro experimental study of four permanent teeth (two molars and two premolars) on the accuracy of copings obtained by subgingival preparations was performed, using an oral wet environment model. Two hundred and forty digital impressions were produced from three digital scanners using four samples. Descriptive analysis was performed using mean, standard deviation, and median. ANOVA and F-tests were performed to assess the amount of variability between the groups. For statistical analysis a 95% significance level was chosen. Results: all differences between groups were statistically significant. Conclusions: the present data implicate a huge impact of the oral biological fluids on the accuracy of digital impression to corresponding images, implying a failure of accurate impression under wetness conditions.

1. Introduction

Technological developments in dentistry have delivered an offspring of digital devices. There has been a global convergence in avant-garde digital impression systems via use of intraoral scanners (IOS) [1,2]. Intraoral scanners are digital devices for capturing direct optical impressions with the use of optical laser scanning or structured light [3,4] based on the principle of parallel confocal scanning. They collect information of the dental arches (or projection, object of interest), and obtain three-dimensional representations, employing a scanning software. After processing the captured images, scanning software generates point clouds [4,5]. Then, a triangulation is obtained to estimate the teeth surface by connecting points with each other, ending up with a three-dimensional (3D) surface model (mesh). An IOS possesses many inherent advantages over a conventional physical detection of impression because of its ability [6,7] to quickly and accurately produce meshed models of the patient’s mouth. It also possesses great flexibility acquisition, and is beneficial, particularly for examinations in sensitive patients [8,9]. The optical detection with IOS allows to acquire an immediate visualization and determination of the areas of impression. Numerous studies have assessed the accuracy of intraoral scanners (IOS), but there is a paucity of data derived from analysis comparing the depiction ability of the critical finish line and the finish line accuracy between different devices [3,10,11]. Few studies have shown the limits of these scanners in subgingival preparations and in the presence of biological fluids and secretions (saliva, blood, crevicular fluid) [7,8,9,10,11]. In subgingival preparations, the light can hardly penetrate the groove and correctly detect the marginal areas [12,13,14,15,16]. Using a rubber dam can avoid such a problem. It allows isolating the dental surfaces, but only in extra gingival preparations [10]. Our study was aimed to compare the accuracy of the finishing line among three intraoral scanners in subgingival preparations with and without saliva, to identify the possible clinical acceptability in wetness condition. The null hypothesis of this study was that oral environment would not affect the scan data precision of the intraoral scanners, and no significant difference would be found in accuracy between the oral condition, with and without saliva.

2. Materials and Methods

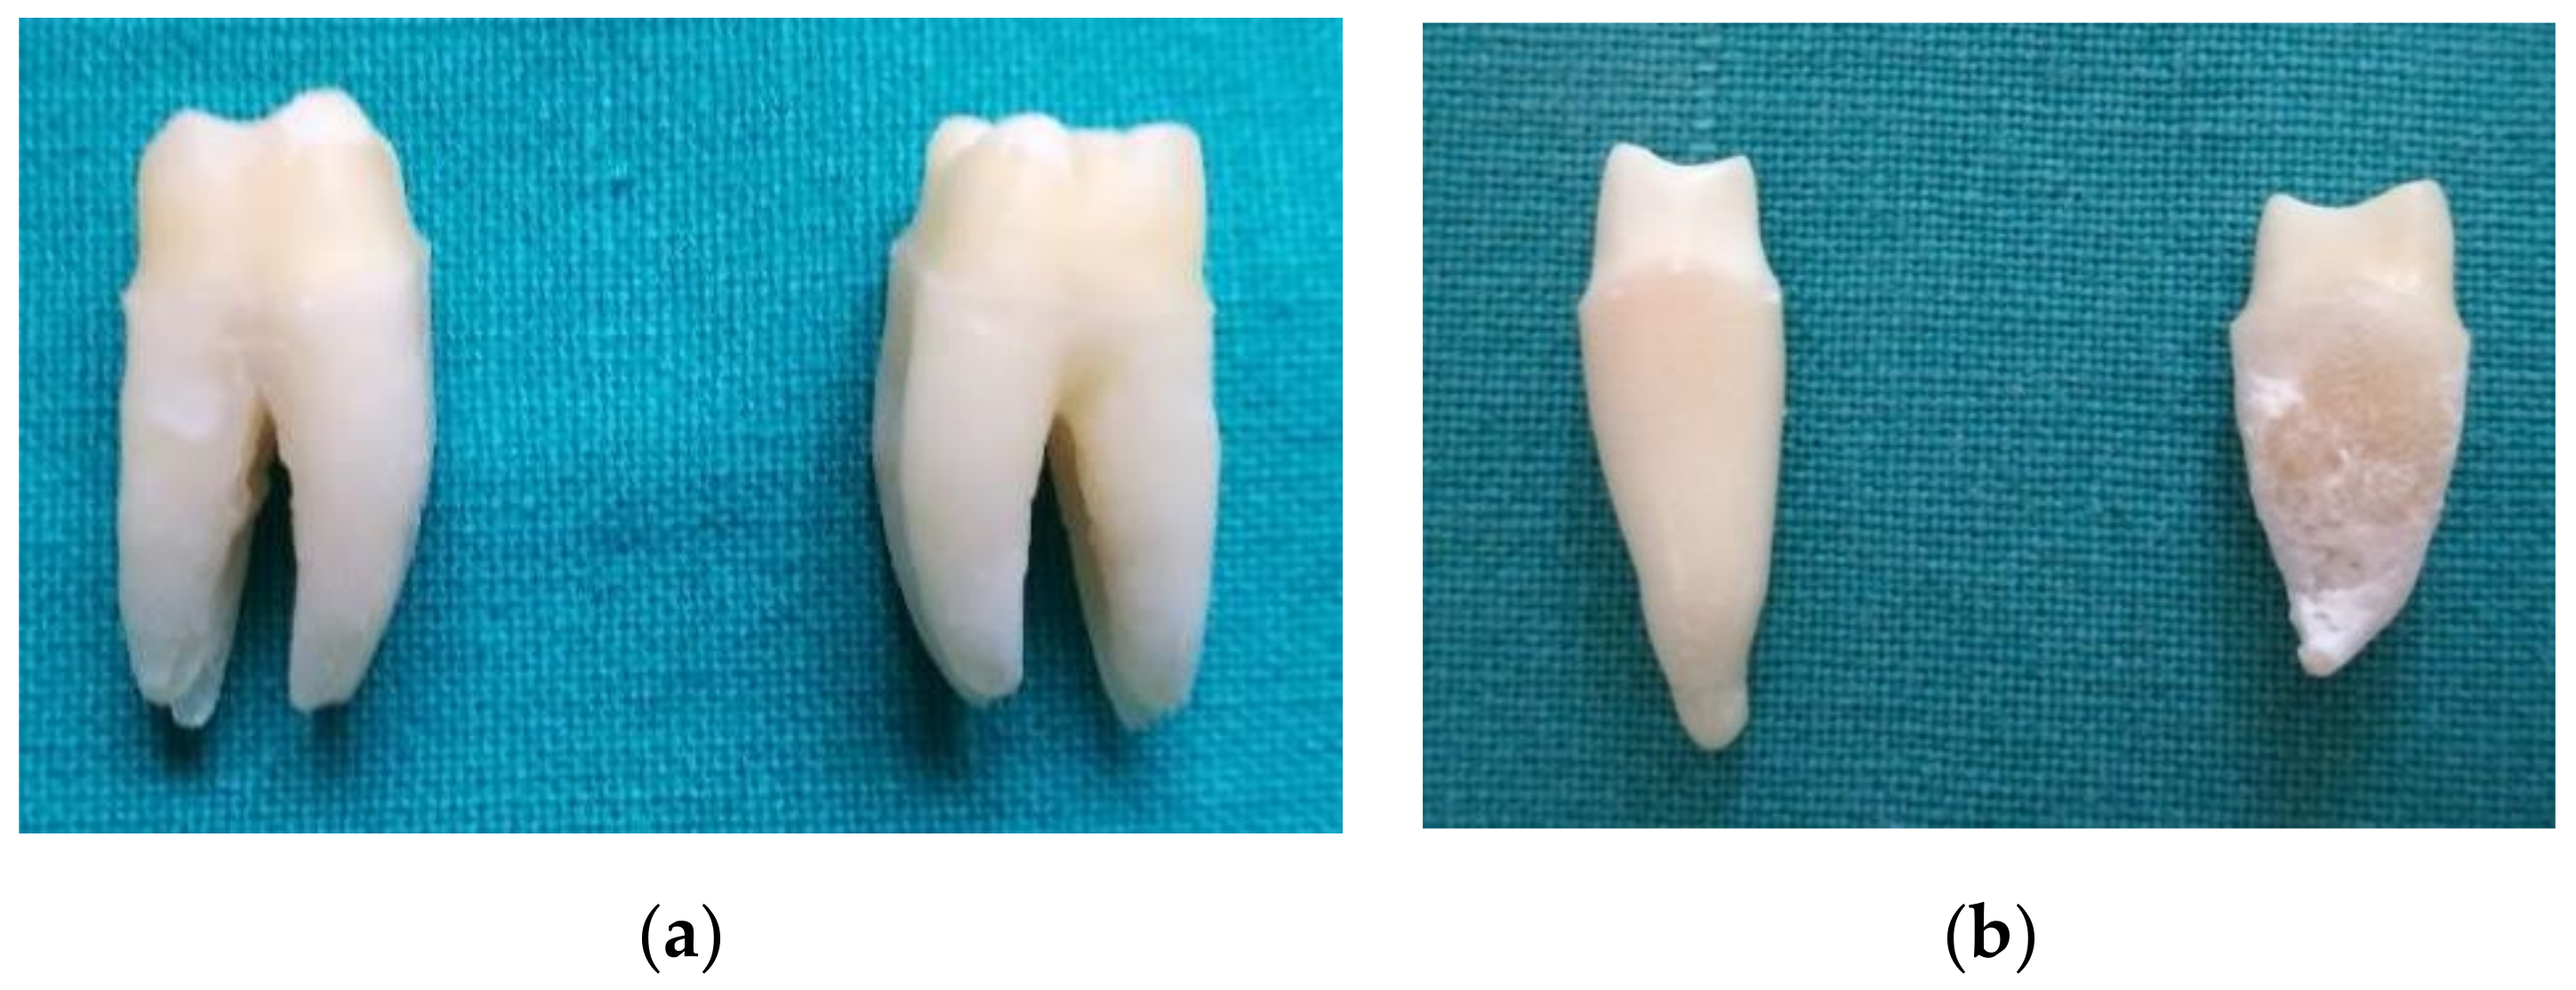
2.1. Samples Preparation

Four extracted human teeth (two mandibular molars, one maxillary, and one mandibular premolar) were used. Following extraction, the teeth were stored at 4 °C in 0.5% chloramyl-T solution to prevent bacterial growth (Figure 1), and then were prepared using standard procedures.
The finish line of the preparation was performed. A proper reduction cut of the axial surfaces using a 1.5 mm round bur was made, then, the margins of cervical preparation were made using a truncated bur (green ring) at the amelioration-cement junction (CEJ). The occlusal surfaces have been reduced with a bur football (green ring) (Figure 2).
All preparations were conducted with the same constant water-cooling. A model of brass and agar gel was made to simulate human sulci and clinical gingival conditions. The samples were then placed. Next, a base was built to incorporate the root portion of each element. The base of the middle-and third apical of the root was made of self-curing acrylic resin (Splintline, Lang, USA). A model of elastomer gel was made to simulate human sulci and clinical gingival conditions (Vestogum, 3M ESPE, Seefeld, Germany). Study samples were then applied with an artificial saliva and scanned. To scan each intraoral scanning, the margin of the artificial gingiva was positioned 1 mm away from both the finishing margin and the axial wall surfaces. To do this, before the realization of the artificial gingiva, the gingival sulcus was made with a silicone in laboratory. After that, the artificial gingiva in wax was prepared, taking as a reference pattern the artificial silicone sulcus. A laboratory silicone mask (Zetalabor, Zhermack, Badia Polesine (RO) ITALY Italy) was built on the tooth and on the gingiva in wax (Figure 3).
Then, the wax gum was removed. An insulating film was applied to the surface of the artificial furrow and the silicone material (Vestogum, 3M ESPE, Germany) was injected through a hole made by the silicone mask to occupy the space previously occupied by the wax. After the polymerization, the silicone furrow was removed. With a thickness gauge, the thickness of the free gingiva (preset at 0.9 mm) was checked and eventually changed, i.e., the distance from the finishing margin to the external surface of the artificial gingiva; the same resistance of the silicone material along the entire circumference of the tooth was obtained at the time of inserting the retractor thread. Furthermore, the support plane of the sample was modified so that the buccal gingival margin and the lingual margin lay on the same plane, parallel to the support plane, to avoid that the saliva might, by gravity, accumulate a higher quantity in the sulcus positioned more apically (Figure 3). The scans were made with three different scanners: CS 3600® (Carestream Dental, Rochester, NY, USA), TRIOS® 3 (3Shape, Copenhagen, Denmark), CEREC® Omnicam (Sirona Dental System GmbH, Bensheim, Germany) (Table 1).
The reference scans were made with the S600ARTI scanner (Zirkonzahn, Brunico, Bolzano, Italy): a fully automatic, structured light optical scanner with two high-resolution cameras. The manufacturing company reports a scanning accuracy of ≤10 μm. The reference scans were made on the private sample of the artificial gingiva to better identify the margin at the end of the preparation, and after applying a thin layer of titanium dioxide to improve the reflection of the surfaces. With the three different scanners, 20 sample scans were performed: 10 without and 10 with saliva. Before the scans, a retraction thread 00 (Ultrapak, Ultradent, South Jordan, UT, USA) was inserted apically at the finishing margin. The trueness and precision of the models were evaluated valuing the different previous IOSs studied [9,10]. The scans were all carried out inside a box made of Plexiglas at a temperature of 37° and a humidity of 90%. The sample was placed during the scan in the middle of the box. In scans with saliva, the artificial saliva used (Biotène mouthwash moisturizing, GlaxoSmithKline, Mississauga, Canada) was injected into the artificial sulcus through a syringe with a fine blunt-tipped needle at a temperature of 37°, until it reached the free margin of the artificial gingival. The intraoral scans were carried out by a single expert dentist. The reference scans and STL files of each IOS system were imported into a reverse-engineering software (Geomagic Studio 2015, Morrisville, NC, USA) and compared. In order to reduce potentially important factors for task effects on driving performance, the scans were carried out sequentially with a timer to break down work into intervals. Starting from the occlusal surface, the left, rear, right, and front surfaces scans were carried out.
The “Mesh doctor” function was used to remove the independent polygons. The test scans were then cut, with these in occlusal vision (OVA). The finishing line of the reference samples was used as a common cutting model. The cut models were then saved in specific folders. Before starting the overlapping for surfaces, the validity of the method was tested: each reference model introduced into the software was duplicated and moved in space and then superimposed. Such a test was repeated five times to certify the reliability of the procedure. Once the validation tests were completed, the 3D test models were overlapped with those of reference. Such overlapping was obtained firstly by using the “3-point registration” function, and then, to optimize the alignment, the “best fit” superposition algorithm of the reverse-engineering software was applied. The congruence between the specific corresponding structures was calculated. Finally, a colorimetric map was developed for the immediate 3D visualization of the distances between the models, using the “3D deviation” function. The color scale ranged from a maximum deviation of +100 and −100 μm. For the descriptive study, the fifth file of each IOS system of both samples was selected, both with and without saliva. Chromatic map was elaborated for expected distance computation between the closest point-to surfaces of the meshes composing the models (Figure 4).
Only on all the five files of each IOS system of both samples with and without saliva, 5 sections in the lingual vestibule sense and 5 in the distal mesial sense were made. The matching between the sections and the finishing lines have made it possible to identify 20 points along the perimeter of the reference finish line and the same number on the test line. Measurements of the distances between the 20 predetermined points were carried out and the averages calculated.
The overall mean marginal gap value and standard deviation were 53.45 ± 30.52 μm. The minimum mean value (40.04 ± 18.90 μm) was recorded by PlanScan® (Planmeca Oy, Helsinki, Finland), then 3D PROGRESS Plus® (MHT, Verona, Italy) (40.20 ± 21.91 μm), True Definition Scanner® (3M, St. Paul, MN, USA) (40.82 ± 26.19 μm), CS 3500® (54.82 ± 28.86 μm) CS 3600® (59.67 ± 28.72 μm), Omnicam® (Denstply Sirona, Verona, Italy) (61.57 ± 38.59 μm), dental wings intraoral scanners (DWIO®, Dental Wings, Montreal, Quebec, Canada) (62.49 ± 31.54 μm), while the maximum mean value (67.95 ± 30.41 μm) was recorded by TRIOS® 3. The Kruskal–Wallis tests revealed a statistically significant difference (p-value <0.5) in the mean marginal gaps between copings produced by 3D PROGRESS Plus®, PlanScan, True Definition Scanner, and the other evaluated IOS. The use of an IOS for digital impressions may be a viable alternative to analog techniques. Although in this in vitro study PlanScan®, 3D PROGRESS Plus® and True Definition Scanner® may have showed the best performances, all IOS tested could provide clinically encouraging results, especially in terms of marginal accuracy, since mean marginal gap values were all within the clinically acceptable threshold of 120 μm.

2.2. Governance and Ethics

All subjects gave their informed consent for inclusion before they participated in the study. The study was conducted in accordance with the Declaration of Helsinki [16], and the protocol was approved by the Ethics Committee of “Aldo Moro” University of Bari (Code: 4987).

3. Statistical Analysis

Statistical analysis was performed by one-way ANOVA, to detect differences between scans, as well as between scans within the same device. A level of statistical significance of p <0.05 was set. Descriptive analysis was performed using mean, standard deviation, and median. Overall accuracy of the scanners were analyzed and compared, and the statistical significance was calculated using the paired-test.

4. Results

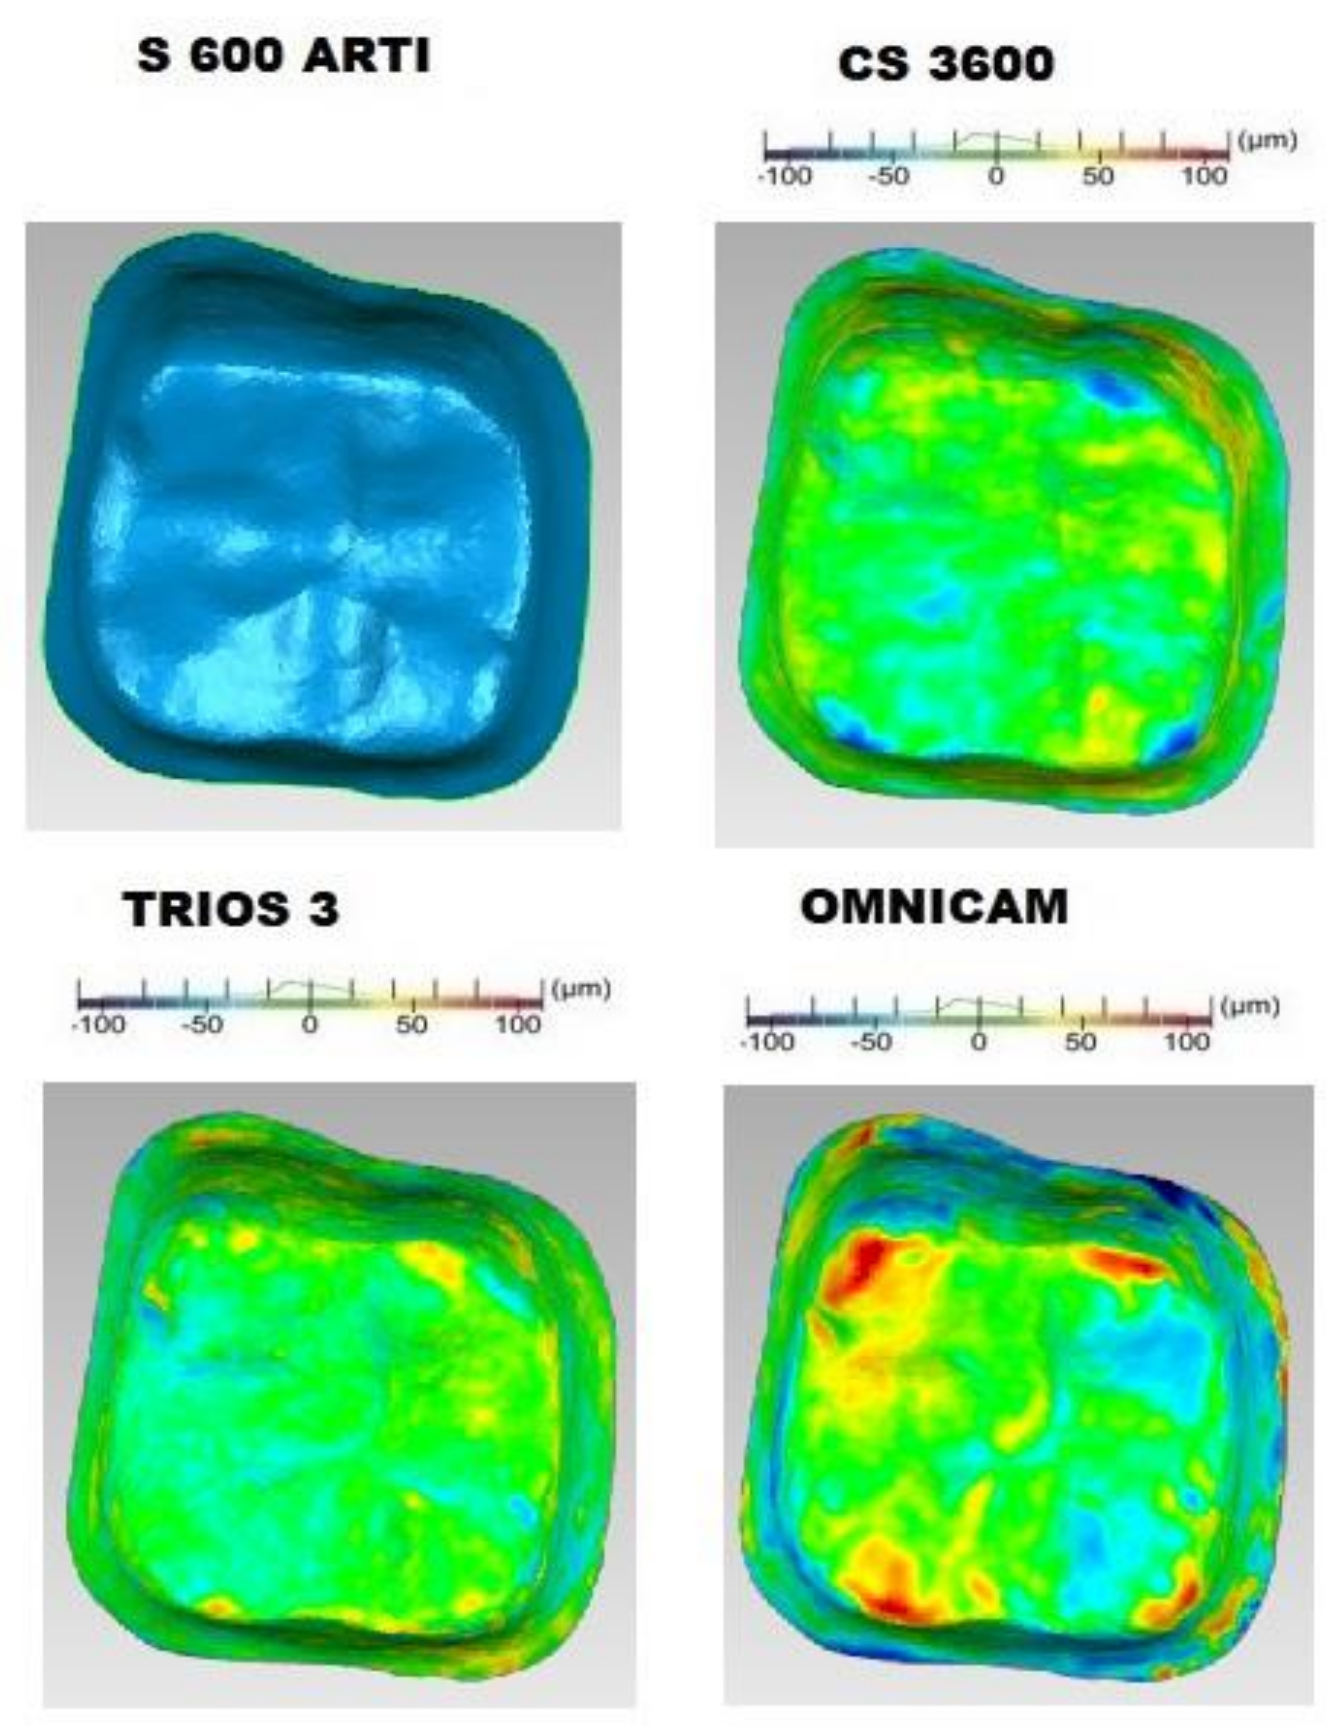
4.1. Accuracy Evaluation of IOS Scans of Saliva-Free Samples

Accuracy of CS 3600 and TRIOS® 3 (Figure 5) were found to be statistically significantly higher than CEREC® Omnicam. Variation was found for CS 3600 and TRIOS® 3 with deviations below ±25 μm, while CEREC® Omnicam showed deviations >25 microns with areas even higher than 100 microns.
Accuracy of CS 3600 and TRIOS® 3 (Figure 6) showed at the level of the finishing line values below 25 microns; CEREC® Omnicam shown deviations of more than 25 microns with areas even higher than 100 microns.
CS 3600 and TRIOS® 3 (Figure 7) showed at the level of the finishing line values below 25 microns; whereas CEREC® Omnicam showed deviations of more than 25 microns with areas even higher than 100 microns.
From the 3D analysis of comparison with the saliva of sample 1 (Figure 8), it emerged that all three IOS examined showed a target line shifted more coronal in relation to the reference line and with deviations of more than 100 microns. CS 3600 had a maximum deviation of 270 microns; TRIOS® 3 also had a maximum deviation of 323 microns; CEREC® Omnicam presented 480 microns of deviation max.
From the 3D analysis of comparison with saliva of sample 2 (Figure 9), it emerged that all three examined IOS show a line of target shifted more coronal in relation to that of the reference and with deviations higher than 100 microns. CS 3600 has a maximum deviation of 302 microns; TRIOS® 3 also has a maximum deviation of 337 microns; CEREC® Omnicam presents 508 microns of deviation max.
From the 3D analysis of comparison with the saliva of sample 3 (Figure 10), it emerges that all three IOS examined showed a target line shifted more coronal in relation to the reference line and with deviations of more than 100 microns.
From the 3D analysis of comparison with saliva of sample 3 (Figure 11), it emerges that all three IOS examined showed a target line shifted more coronal in relation to the reference line and with deviations of more than 100 microns.
CS 3600 has a maximum deviation of 218 microns; TRIOS® 3 also has a maximum deviation of 310 microns; CEREC® Omnicam presents 410 microns of deviation max. From the 3D analysis of comparison with saliva of sample 4 (Figure 12), it emerges that all three IOS examined shown a target line shifted more coronal in relation to the reference line and with deviations of more than 100 microns.
CS 3600 has a maximum deviation of 304 microns; TRIOS® 3 also had a maximum deviation of 320 microns; CEREC® Omnicam presented 380 microns of max deviation.

4.2. Scans of Four Samples with Saliva

From the analysis of the distances of the reference finishing line with those corresponding to the IOS of the sample 1 with saliva, it resulted that: CS 3600 showed a mean distance of 231.3 microns; TRIOS® 3 had a mean distance of 279; CEREC® Omnicam had a mean distance of 421.915 (Table 2).
From the analysis of the distances of the reference finishing line with those corresponding to the IOS of the sample 2 with saliva, it resulted that: CS 3600 showed a mean distance of 179.165 ± 334.69 microns; TRIOS® 3 had a mean distance of 279.65 ± 112.93; CEREC® Omnicam had a mean distance of 378.145 ± 274.635 (Table 3).
From the analysis of the distances of the reference finishing line with those corresponding to the IOS of the sample 3 with saliva, it can be seen that: CS 3600 showed a mean distance of 179.165 ± 28.5659 microns; TRIOS® 3 had a mean distance of 256.585 ± 50.76; CEREC® Omnicam had a mean distance of 378.145 ± 23.8861 (Table 4).
From the analysis of the distances of the reference finishing line with those corresponding to the IOS of the sample 4 with saliva, it can be seen that: CS 3600 showed a mean of 329.205 ± 28.5659 microns; TRIOS® 3 had a mean distance of 37.225±50.7625; CEREC® Omnicam had a mean distance of 505.04514 ± 23.8861 (Table 5).

4.3. Scans of Four Samples without Saliva

From the analysis of the distances of the reference finishing line with those corresponding to the IOS of the sample 1 without saliva, it can be seen that: CS 3600 showed a mean distance of 52.51 ± 13.9797 microns; TRIOS® 3 had an average distance of 66.91 ± 21.6337 microns; CEREC® Omnicam had an average distance of 98.825 ± 18.094 microns (Table 6).
From the analysis of the distances of the reference finishing line with those corresponding to the IOS of the sample 2 without saliva, it can be seen that: CS 3600 showed a mean distance of 61.855 ± 17.4147 microns; TRIOS® 3 had a mean distance of 72.995 ± 14.1916 microns; CEREC® Omnicam had a mean distance of 97.8 ± 20.3839 microns (Table 7).
From the analysis of the distances of the reference finishing line with those corresponding to the IOS of the sample 3 without saliva, it can be seen that: CS 3600 showed a mean distance of 46.58 ± 12.7563 microns; TRIOS® 3 had a mean distance of 75.555 ± 16.663 microns; CEREC® Omnicam had an average distance of 63.065 ± 15.7074 microns (Table 8).
From the analysis of the distances of the reference finishing line with those corresponding to the IOS of the sample 4 without saliva, it can be seen that: CS 3600 showed an average distance of 53.635 ± 14.1098 microns; TRIOS® 3 had an average distance of 55.92 ± 16.6755 microns; CEREC® Omnicam had an average distance of 89.295 ± 16.6857 microns (Table 9).

4.4. Differences Between Scans Performed for Each Sample, With and Without Saliva

The t-test was used to evaluate whether two groups differ from each other, as follows (Table 10a–c, Table 11a–c, Table 12a–c, Table 13a–c).

5. Discussion

The gradually increasing of the digitalization in dentistry has becoming an alternative to conventional approach. The study was aimed to evaluate the accuracy of scanned images of three intraoral scanners when scanning the dental surfaces in the presence and absence of artificial saliva. There are several in vitro and in vivo studies reporting clinically precision and trueness of contemporary IOS [6,13]. CEREC® Omnicam showed the lowest accuracy [9].
The study conducted by Nedelcu et al. [5] was aimed to compare the finish line distinctness (FLD), and finish line accuracy (FLA) of seven IOS (3M, CS 3500, and CS 3600, DWIO, Omnicam, PlanScan, and TRIOS), using a dental model with supra and subgingival margin placement of a preparation of the crown [7]. Their results no showed significant differences between all devices, but scanner dependent topography variations in TRIOS and 3M was found, reporting deviations below +/−25 μm for TRIOS [5]. Lee et al. stated that some of the examined IOS have shown a higher degree of accuracy of the finishing line compared to the conventional impression. They found TRIOS, CS 3600, and conventional impression shown deviations of less than 50 microns; CS 3500 deviations of 105 microns; dental wings intraoral scanners (DWIO), Omnicam, PlanScan, and 3M over 120 microns [12]. Different studies evaluating the marginal fit of metal ceramic crowns with the digital model are described in the literature, registering a value of ~120 microns as the reference pattern for the measurement of variation of good accuracy [5,6,7,8,9]. Ender et al. have compared the partial impression to conventional impression [7]. As a result of the performance, the authors described that the mean trueness of various IOS devices ranges between 20 and 48 μm and the precision is between 4 and 16 μm [17], as well as similar papers that have confirmed a clinical adaptability of the current available IOS devices for common practice, indicating a similar accuracy to conventional impression [6]. Another study registered mean deviations and averaged maximal positive and negative deviations of 17/−13 ± 19 and 134/−123 μm, respectively, for digitizing of a premolar and a molar with a chamfer preparation of a four-unit fixed dental prosthesis (FDP) [18]. A recent study evaluating the accuracy of FDPs, showed values of 30–68 μm for the marginal inaccuracy and 29–88 μm for the internal [19]. The measurement of deviations in ‘saliva samples’ are 2–4 times higher than clinically acceptable cut-off value of 120 microns. These results clearly demonstrate that the scanned area must be saliva-free to achieve clinically acceptable accuracy of the digital impression [19,20,21]. Van der Meer et al. evaluated linear discrepancies of intraoral scanners between cylinders screwed on implant analogs in a stone model [22]. The authors demonstrated significant differences about the accuracy of the finish lines comparing the IOS [13]. However, it has been amply described the phenomenon of distortion in vivo full-arch impression. The accuracy of intraoral scanners has been previously examined by Schaefer et al. [20] who measured the marginal fit of partial ceramic crowns, reporting significant differences between scanning systems. Similar results were highlighted by Nedelcu et al. [21], after measuring the accuracy of four intraoral scanners, suggesting the limited applicability of IOS only in precise setting, including prosthetic treatments. Interestingly, a study conducted by Andriessen et al. [23] on three intraoral scanners revealed an error of the accuracy directly proportional with the size of the scanned surface. Further studies focusing on the accuracy of scans of single teeth have shown that the trueness and precision values ranged between 19.2 μm and 27.9 μm, and 10.8 ± 1.8 μm, respectively. Additionally, studies evaluating the accuracy of quadrant scans reported values about 35 and 13 μm of trueness and precision, respectively [17,18,19]. A large number of studies have been in recent years to try the reliability and practicability of intraoral scanners, but most of them were carried out with dry models. Few studies have been conducted focusing on the accuracy of intraoral scanner images considering the oral environment and the effect of contamination of saliva and other aspects, such as humidity, intraoral temperature, and so on. Treesh et al. shown the contribution of saliva to the inaccuracy of digital impression [24]. This study used test models and devices that led to the detection of dental impression reproducing oral environment conditions. However, several factors that alter the final result (blood, non-homogeneous finishing lines, depth of non-uniform gingival sulcus) were not included. The 360° chamfer preparation was chosen because it allows a better view of the finishing margin [24,25,26]. This type of finishing margin was only of the iuxta and extra gingival type, but in this study, it was deliberately placed under the gum to investigate, in the presence of artificial saliva, the limitations that the IOS have in identifying the finish line [25]. CEREC® Omnicam showed a lower overall accuracy both in the absence and in the presence of saliva with significant differences higher than the other two IOS examined only in the presence of saliva. TRIOS® 3 and CS 3600 showed an important loss of accuracy only in the presence of saliva and lower compared to CEREC® Omnicam. In accordance with the previous literature, the negative influence of the presence of saliva was highlighted for each scan [19,24,25,26,27,28,29]. This is important in the long-term success of the final restoration. Our analysis makes additional reference to the potential of IOS. However, our study had several limitations: firstly, the scarcity of samples; secondly, more scans were not performed due to the paucity of analyzed scanners. Further, a critical aspect may regard the limitation of in vitro model, because of performing analysis outside the normal biological environment. Additional limitations are represented by using an opaque film, which leads to loss of accuracy of the reference scan [26] in both conditions (with/without saliva).

6. Conclusions

This study, although with the limitations previously described, has shown how saliva can lead to loss of accuracy of IOS. All three IOS, with variable accuracy, have values that are not clinically accepted by literature. Therefore, these systems, in conditions where it is not possible to eliminate or adequately control the amount of saliva, could lead to altered 3D models. It will be useful to carry out further comparison studies with the conventional impression on a greater number of samples to verify if the use of IOS can be considered a valid alternative in these conditions.

Author Contributions

Conceptualization, B.R. and M.C.; investigation, B.R., E.F. and M.C.; resources, G.A. and E.F.; data curation, B.R., E.F. and. M.C.; validation, B.R., C.P., D.D.V. and M.C.; writing-original draft preparation, B.R. and M.C.; writing-review and editing, B.R., E.F. and M.C.; visualization, C.P. and G.A.; supervision, B.R. and M.C.; project administration B.R. and M.C. All authors have read and agreed to the published version of the manuscript.

Funding

This research received no external funding.

Conflicts of Interest

The authors declare no conflict of interest.

References

  1. Zimmermann, M.; Mehl, A.; Mörmann, W.H.; Reich, S. Intraoral scanning systems—A current overview. Int. J. Comput. Dent. 2015, 18, 101–129. [Google Scholar] [PubMed]
  2. Martin, C.B.; Chalmers, E.V.; McIntyre, G.T.; Cochrane, H.; Mossey, P.A. Orthodontic scanners: What’s available? J. Orthod. 2015, 42, 136–143. [Google Scholar] [CrossRef] [PubMed]
  3. Aragón, M.L.; Pontes, L.F.; Bichara, L.M.; Flores-Mir, C.; Normando, D. Validity and reliability of intraoral scanners compared to conventional gypsum models measurements: A systematic review. Eur. J. Orthod. 2016, 38, 429–434. [Google Scholar] [CrossRef] [PubMed]
  4. Richert, R.; Goujat, A.; Venet, L.; Viguie, G.; Viennot, S.; Robinson, P.; Farges, J.C.; Fages, M.; Ducret, M. Intraoral Scanner Technologies: A Review to Make a Successful Impression. J. Healthc. Eng. 2017, 2017, 8427595. [Google Scholar] [CrossRef]
  5. Nedelcu, R.; Olsson, P.; Nyström, I.; Thor, A. Finish line distinctness and accuracy in 7 intraoral scanners versus conventional impression: An in vitro descriptive comparison. BMC Oral. Health 2018, 18, 27. [Google Scholar] [CrossRef]
  6. Ting-Shu, S.; Jian, S.J. Intraoral Digital Impression Technique: A Review. J. Prosthodont. 2015, 24, 313–321. [Google Scholar] [CrossRef]
  7. Ender, A.; Attin, T.; Mehl, A.J. In vivo precision of conventional and digital methods of obtaining complete-arch dental impressions. J. Prosthet. Dent. 2016, 115, 313–320. [Google Scholar] [CrossRef] [Green Version]
  8. Keeling, A.; Wu, J.; Ferrari, M. Confounding factors affecting the marginal quality of an intra-oral scan. J. Dent. 2017, 59, 33–40. [Google Scholar] [CrossRef] [Green Version]
  9. Mangano, F.G.; Hauschild, U.; Veronesi, G.; Imburgia, M.; Mangano, C.; Admakin, O. Trueness and precision of 5 intraoral scanners in the impressions of single and multiple implants: A comparative in vitro study. BMC Oral. Health 2019, 19, 101. [Google Scholar] [CrossRef] [Green Version]
  10. Renne, W.; Ludlow, M.; Fryml, J.; Schurch, Z.; Mennito, A.; Kessler, R.; Lauer, A. Evaluation of the accuracy of 7 digital scanners: An in vitro analysis based on 3-dimensional comparisons. J. Prosthet. Dent. 2017, 118, 36–42. [Google Scholar] [CrossRef]
  11. Luthardt, R.G.; Loos, R.; Quaas, S. Accuracy of intraoral data acquisition in comparison to the conventional impression. Int. J. Comput. Dent. 2005, 8, 283–294. [Google Scholar] [PubMed]
  12. Lee, S.J.; Macarthur, R.X., 4th; Gallucci, G.O. An evaluation of student and clinician perception of digital and conventional implant impressions. J. Prosthet. Dent. 2013, 110, 420–423. [Google Scholar] [CrossRef] [PubMed]
  13. Gjelvold, B.; Chrcanovic, B.R.; Korduner, E.K.; Collin-Bagewitz, I.; Kisch, J.J. Intraoral Digital Impression Technique Compared to Conventional Impression Technique. A Randomized Clinical Trial. J. Prosthodont. 2016, 25, 282–287. [Google Scholar] [CrossRef]
  14. Di Venere, D.; Nardi, G.M.; Lacarbonara, V.; Laforgia, A.; Stefanachi, G.; Corsalini, M.; Grassi, F.R.; Rapone, B.; Pettini, F. Early mandibular canine-lateral incisor transposition: Case Report. Oral. Implantol. 2017, 10, 181–189. [Google Scholar] [CrossRef]
  15. Di Venere, D.; Corsalini, M.; Nardi, G.M.; Laforgia, A.; Grassi, F.R.; Rapone, B.; Pettini, F. Obstructive site localization in patients with Obstructive Sleep Apnea Syndrome: A comparison between otolaryngologic data and cephalometric values. Oral. Implantol. 2017, 10, 295–310. [Google Scholar] [CrossRef] [PubMed]
  16. Holt, G.R. Declaration of Helsinki—The World’s Document of Conscience and Responsibility. South. Med. J. 2014, 107, 407. [Google Scholar] [CrossRef]
  17. Zou, H.; Wang, Y.; Zhang, H.; Shen, J.; Liu, H. An overview on rubber dam application in dental treatments. Zhonghua Kou Qiang Yi Xue Za Zhi 2016, 51, 119–123. [Google Scholar]
  18. Mangano, F.; Gandolfi, A.; Luongo, G.; Logozzo, S. Intraoral scanners in dentistry: A review of the current literature. BMC Oral. Health 2017, 17, 149. [Google Scholar] [CrossRef] [Green Version]
  19. Ferrari, M.; Keeling, A.; Mandelli, F.; Lo Giudice, G.; Garcia-Godoy, F.; Joda, T. The ability of marginal detection using different intraoral scanning systems: A pilot randomized controlled trial. Am. J. Dent. 2018, 5, 272–276. [Google Scholar]
  20. Schaefer, O.; Decker, M.; Wittstock, F.; Kuepper, H.; Guentsch, A. Impact of digital impression techniques on the adaption of ceramic partial crowns in vitro. J. Dent. 2014, 4, 677–683. [Google Scholar] [CrossRef]
  21. Nedelcu, R.; Olsson, P.; Nyström, I.; Rydén, J.; Thor, A. Accuracy and precision of 3 intraoral scanners and accuracy of conventional impressions: A novel in vivo analysis method. J. Dent. 2018, 69, 110–118. [Google Scholar] [CrossRef] [PubMed]
  22. Van der Meer, W.J.; Vissink, A.; Ren, Y. Full 3-dimensional digital workflow for multicomponent dental appliances: A proof of concept. J. Am. Dent. Assoc. 2016, 147, 288–291. [Google Scholar] [CrossRef]
  23. Andriessen, F.S.; Rijkens, D.R.; van der Meer, W.J.; Wismeijer, D.W. Applicability and accuracy of an intraoral scanner for scanning multiple implants in edentulous mandibles: A pilot study. J. Prosthet. Dent. 2014, 111, 186–194. [Google Scholar] [CrossRef] [PubMed]
  24. Treesh, J.C.; Liacouras, P.C.; Taft, R.M.; Brooks, D.L.; Raiciulescu, S.; Ellert, D.O.; Grant, G.T.; Ye, L. Complete-arch accuracy of intraoral scanners. J. Prosthet. Dent. 2018, 120, 382–388. [Google Scholar] [CrossRef]
  25. Lee, K. Comparison of two intraoral scanners based on three-dimensional surface analysis. Prog. Orthod. 2018, 19, 6. [Google Scholar] [CrossRef] [PubMed]
  26. Grassi, F.R.; Rapone, B.; Scarano Catanzaro, F.; Corsalini, M.; Kalemaj, Z. Effectiveness of computer-assisted anesthetic delivery system (STA™) in dental implant surgery: A prospective study. Oral. Implantol. 2017, 10, 381–389. [Google Scholar] [CrossRef]
  27. Tsirogiannis, P.; Reissmann, D.R.; Heydecke, G. Evaluation of the marginal fit of single-unit, complete-coverage ceramic restorations fabricated after digital and conventional impressions: A systematic review and meta-analysis. J. Prosthet. Dent. 2016, 116, 328–335. [Google Scholar] [CrossRef]
  28. Ahlholm, P.; Sipila, K.; Vallittu, P.; Jakonen, M.; Kotiranta, U. Digital versus conventional impressions in fixed prosthodontics: A review. J. Prosthodont. 2018, 27, 35–41. [Google Scholar] [CrossRef] [Green Version]
  29. Corsalini, M.; Di Venere, D.; Rapone, B.; Stefanachi, G.; Laforgia, A.; Pettini, F. Evidence of signs and symptoms of Craniomandibular Disorders in Fibromyalgia patients. Open Dent. J. 2017, 11, 91–98. [Google Scholar] [CrossRef] [Green Version]
Figure 1. Samples 1, 2, 3, and 4 before shaping: (a) the mandibular molars; (b) the mandibular premolars.
Applsci 10 07762 g001
Figure 2. Samples 1, 2, 3, and 4 after shaping: (a) prepared mandibular molars; (b) prepared mandibular premolars.
Applsci 10 07762 g002
Figure 3. Samples during the construction phases of the base: (a) a base of the incorporated root portion of molar element; (b) A model of elastomer gel simulating human sulci and clinical gingival conditions; (c) a base of the incorporated root portion of premolar element; (d) A model of elastomer gel simulating human sulci and clinical gingival conditions.
Applsci 10 07762 g003
Figure 4. Representation of the known points for the measurement comparison with the pattern line and IOS target line: chromatic map of direct scan with intraoral scanner (a); inward moving (blue) and outward moving (red) of displacement between overlapped structures (b), whereas an absence change was indicated by a green colour (c).
Applsci 10 07762 g004
Figure 5. Comparison of the complete preparation in occlusal vision (OVA) rendering S600ARTI and three-dimensional (3D) comparison analysis for IOS without saliva in relation to the sample 1. Nominal histogram settings ±25 microns and critical ±100 microns.
Applsci 10 07762 g005
Figure 6. Three-dimensional (3D) Comparison of complete preparation in OVA rendering S600ARTI and 3D comparison analysis for IOS without saliva in relation to the sample 2. Nominal histogram settings ±25 microns and critical ±100 microns.
Applsci 10 07762 g006
Figure 7. Comparison of complete preparation in OVA rendering S600ARTI and 3D comparison analysis for IOS without saliva in relation to the sample 3. Nominal histogram settings ±25 microns and critical ±100 microns.
Applsci 10 07762 g007
Figure 8. Comparison of complete preparation in OVA rendering S600ARTI and 3D comparison analysis for IOS without saliva in relation to the sample 4. Nominal histogram settings ±25 microns and critical ±100 microns.
Applsci 10 07762 g008
Figure 9. Comparison of the complete preparation in OVA rendering S600ARTI and 3D comparison analysis for IOS with saliva in relation to the sample 1. Nominal histogram settings ±25 microns and critical ±100 microns.
Applsci 10 07762 g009
Figure 10. Comparison of the complete preparation in OVA rendering S600ARTI and 3D comparison analysis for IOS with saliva in relation to sample 2. Nominal histogram settings ±25 microns and critical ±100 microns.
Applsci 10 07762 g010
Figure 11. Comparison of the complete preparation in OVA rendering S600ARTI and 3D comparison analysis for IOS with saliva in relation to sample 3. Nominal histogram settings ±25 microns and critical ±100 microns.
Applsci 10 07762 g011
Figure 12. Comparison of the complete preparation in OVA rendering S600ARTI and 3D comparison analysis for IOS with saliva in relation to the sample 4. Nominal histogram settings ±25 microns and critical ±100 microns.
Applsci 10 07762 g012
Table 1. Features of the intraoral scanners.
SystemCompanySoftwareSource of LightAcquisition
CS 3600Carestream Dental3LEDVIDEO
TRIOS® 33Shape1.4.7.5LEDVIDEO
CEREC® OmnicamSirona4.5.2LEDVIDEO
Table 2. Distance between reference lines and test ones in sample 1 with saliva.
CARESTREAM CS 3600CEREC OMNICAM®Total
N101030
∑X2310.34219.159405.25
Mean231.03421.915313.508
∑X2580,305.2317,879,183. 2533,146,932,575
Std. Dev.719.233294.3111.123.524
Results Details
SourceSS*Df**MS***
Between-treatments1.922.695.9322961.347.966F = 14.93469
Within-treatments1.737.994.1232764.370.153
Total3.660.690.05429
The f-ratio value is 14.93469. The p-value is 0.000043. The result is significant at p < 0.05. * SS: sum-of-squares; ** Df: degrees of freedom; *** MS: mean squares; Std. Dev.: Standard Deviation.
Table 3. Distance between reference lines and test ones in sample 2 with saliva.
TRIOS® 3CARESTREAM CS 3600CEREC OMNICAM®Total
N10101030
∑X2791.651791.653781.458364.75
Mean279.165179.165378.145278.825
∑X28,941,240,5253,310,826.2751,436,724,62752,661,931,3075
Std. Dev.1.129.371334.691274.635106.614
Results Details
Std. Dev.112.937133.469127.4635106.614
SourceSS*Df**MS***
Between-treatments197,966.936298,983.468F = 20.29845
Within-treatments131,662.9528274876.4057
Total329,629.888829
The f-ratio value is 20.29845. The p-value is <0.00001. The result is significant at p < 0.05. * SS: sum-of-squares; ** Df: degrees of freedom; *** MS: mean squares.
Table 4. Distance between reference lines and test ones in sample 3 with saliva.
TRIOS® 3CARESTREAM CS 3600CEREC OMNICAM®Total
N10101030
∑X2565.851676.154319.78364.75
Mean256.585179.165378.145278.825
∑X2681,550.1325288,291.99251,871,115.7252,840,957.85
Std. Dev.50.762528.565923.8861117.0815
Results Details
SourceSS*Df**MS***
Between-treatments361,863.75052180,931.8753F = 136.95226
Within-treatments35,670.5365271321.131
Total397,534.28729
The f-ratio value is 136.95226. The p-value is < 0.00001. The result is significant at p < 0.05. * SS: sum-of-squares; ** Df: degrees of freedom; *** MS: mean squares.
Table 5. Distance between reference lines and test ones in sample 4 with saliva.
TRIOS® 3CARESTREAM CS 3600CEREC OMNICAM®Total
N10101030
∑X3712.253292.055050.4512,054.75
Mean371.225329.205505.04514401.825
∑X21,416,688.63251,091,374.70752,560,913.61255,068,976.9525
Std. Dev.50.762528.565923.886188.0981
Results Details
SourceSS*Df**MS***
Between-treatments168,643.928284,321.964F = 40.34322
Within-treatments56,433.1058272090.115
Total225,077.037729
The f-ratio value is 40.34322. The p-value is <0.00001. The result is significant at p < 0.05. * SS: sum-of-squares; ** Df: degrees of freedom; *** MS: mean squares.
Table 6. Distance between reference lines and test ones in sample 1 without saliva. The averages are in red.
TRIOS® 3CARESTREAM CS 3600CEREC OMNICAM®Total
N10101030
∑X669.1525.1988.252182.45
Mean66.9152.5198.82572.748
∑X248,981.6329,331.88100,610.3475178,923.8575
Std. Dev.21.633713.979718.09426.3624
Results Details
SourceSS*Df**MS***
Between-treatments11,236.6882 25618.3441F = 17.01083
Within-treatments8917.569227330.2803
Total20,154.257429
The f-ratio value is 17.01083. The p-value is <0.000017. The result is significant at p < 0.05. * SS: sum-of-squares; ** Df: degrees of freedom; *** MS: mean squares.
Table 7. Distance between reference lines and test ones in sample 2 without saliva.
TRIOS® 3CARESTREAM CS 3600CEREC OMNICAM®Total
N10101030
∑X729.95618.559782326.5
Mean72.99561.85597.877.55
∑X255095.307540,989.842599,387.92195,473.07
Std. Dev.14.191617.414720.383922.7831
Results Details
SourceSS*Df**MS***
Between-treatments6771.4355 23385.7177F = 11.03831
Within-treatments8281.559527306.7244
Total15,052.99529
The f-ratio value is 11.03831. The p-value is 0.000314. The result is significant at p < 0.05 * SS: sum-of-squares; ** Df: degrees of freedom; *** MS: mean squares.
Table 8. Distance between reference lines and test ones in sample 3 without saliva.
TRIOS® 3CARESTREAM CS 3600CEREC OMNICAM®Total
N10101030
∑X755.55465.58630.651852
Mean75.55546.5863.06561.733
∑X25984.477523,161.46541,992.4575124,738.4
Std. Dev.16.66312.756315.707418.9448
Results Details
SourceSS*Df**MS***
Between-treatments4224.3552 22112.1766F = 9.22212
Within-treatments6183.913527229.0338
Total10,408.266729
The f-ratio value is 9.22212. The p-value is 0.000886. The result is significant at p < 0.05 * SS: sum-of-squares; ** Df: degrees of freedom; *** MS: mean squares.
Table 9. Distance between reference lines and test ones in sample 4 without saliva.
TRIOS® 3CARESTREAM CS 3600CEREC OMNICAM®Total
N10101030
∑X559.2536.35892.951988.5
Mean55.9253.63589.29566.283
∑X233,773.1130,558.922582,241.687514,573.72
Std. Dev.16.675514.109816.685722.5674
Results Details
SourceSS*Df**MS***
Between-treatments7969.158223984.5791F = 15.82077
Within-treatments6800.153527251.8575
Total14,769.311729
* SS: sum-of-squares; ** Df: degrees of freedom; *** MS: mean squares.
Table 10. t-test sample 1.
(a)
TRIOS®Scan with SalivaScan without Saliva
Mean 287.5800 66.9100
SD 115.2037 21.6337
SEM 36.4306 6.8412
N 10 10
(b)
CARESTREAMScan with SalivaScan without Saliva
CS 3600
Mean231.030052.5100
SD71.923313.9797
SEM22.74414.4208
N1010
(c)
CERECSample with SalivaSample without Saliva
OMNICAM ®
Mean421.915098.8250
SD29.431118.0940
SEM9.30695.7218
N1010
(a) The two-tailed p value is less than 0.0001; By conventional criteria, this difference is considered to be extremely statistically significant. The mean of Group One minus Group Two equals 220.6700; 95% confidence interval of this difference: From 142.7943 to 298.5457; t = 5.9532; df = 18 standard error of difference = 37.067. (b) The two-tailed p value is less than 0.0001; By conventional criteria, this difference is considered to be extremely statistically significant. The mean of Group One minus Group Two equals 178.5200; 95% confidence interval of this difference: From 129.8421 to 227.1979; t = 7.7049; df = 18 standard error of difference = 23.170. (c) The two-tailed p value is less than 0.0001; By conventional criteria, this difference is considered to be extremely statistically significant. The mean of Group One minus Group Two equals 323.0900; 95% confidence interval of this difference: From 300.1372 to 346.0428 t = 29.5731; df = 18; standard error of difference = 10.925.
Table 11. t-test sample 2.
(a)
TRIOS ®Scan with SalivaScan without Saliva
Mean279.165072.9950
SD112.937114.1916
SEM35.71384.4878
N1010
(b)
CARESTREAM CS3600Scan with SalivaScan without Saliva
Mean179.165061.8550
SD33.469117.4147
SEM10.58395.5070
N1010
(c)
CEREC OMNICAM®Scan with SalivaScan without Saliva
Mean378.145097.8000
SD27.463520.3839
SEM8.68476.4459
N1010
(a) The two-tailed p value is less than 0.0001 By conventional criteria, this difference is considered to be extremely statistically significant. The mean of Group One minus Group Two equals 206.1700; 95% confidence interval of this difference: From 130.5479 to 281.7921 t = 5.7278; df = 18; standard error of difference = 35.995. (b) The two-tailed p value is less than 0.0001. By conventional criteria, this difference is considered to be extremely statistically significant. The mean of Group One minus Group Two equals 117.3100; 95% confidence interval of this difference: From 92.2442 to 142.3758; t = 9.8325; df = 18; standard error of difference = 11.931. (c) The two-tailed p value is less than 0.0001; By conventional criteria, this difference is considered to be extremely statistically significant. The mean of Group One minus Group Two equals 280.3450; 95% confidence interval of this difference: From 257.6225 to 303.0675; t = 25.9207; df = 18; standard error of difference = 10.815.
Table 12. t-test sample 3.
(a)
TRIOS®Scan with SalivaScan without Saliva
Mean256.485075.5550
SD50.817116.6630
SEM16.06985.2693
N1010
(b)
CARESTREAM
CS3600
Scan with SalivaScan without Saliva
Mean167.615046.5800
SD28.565912.7563
SEM9.03334.0339
N1010
(c)
CEREC OMNICAM ®Scan with SalivaScan without Saliva
Mean431.970063.0650
SD23.886115.7074
SEM7.55354.9671
N1010
(a) The two-tailed p value is less than 0.0001; By conventional criteria, this difference is considered to be extremely statistically significant. The mean of Group One minus Group Two equals 180.9300; 95% confidence interval of this difference: From 145.4000 to 216.4600; t = 10.6986; df = 18; standard error of difference = 16.912. (b) The two-tailed p value is less than 0.0001; By conventional criteria, this difference is considered to be extremely statistically significant. The mean of Group One minus Group Two equals 121.0350; 95% confidence interval of this difference: From 100.2504 to 141.8196; t = 12.2343; df = 18; standard error of difference = 9.893. (c) The two-tailed p value is less than 0.0001; By conventional criteria, this difference is considered to be extremely statistically significant. The mean of Group One minus Group Two equals 368.9050; 95% confidence interval of this difference: From 349.9120 to 387.8980; t = 40.8067; df = 18; standard error of difference = 9.040.
Table 13. t-test sample 4.
(a)
TRIOS 3 ®Scan with SalivaScan without Saliva
Mean 371.2250 55.9200
SD 65.4969 16.6755
SEM 20.7119 5.2733
N 10 10
(b)
CARESTREAM CS3600Scan with SalivaScan without Saliva
Mean329.205053.6350
SD29.088714.1098
SEM9.19874.4619
N1010
(c)
CEREC ® OMNICAMScan with SalivaScan without Saliva
Mean505.045089.2950
SD33.680016.6857
SEM10.65065.2765
N1010
(a) The two-tailed p value is less than 0.0001; By conventional criteria, this difference is considered to be extremely statistically significant. The mean of Group One minus Group Two equals 315.3050; 95% confidence interval of this difference: From 270.4026 to 360.2074t = 14.7527; df = 18; standard error of difference = 21.373. (b) The two-tailed p value is less than 0.0001; By conventional criteria, this difference is considered to be extremely statistically significant. The mean of Group One minus Group Two equals 275.5700; 95% confidence interval of this difference: From 254.0908 to 297.0492; t = 26.9540; df = 18; standard error of difference = 10.224. (c) The two-tailed p value is less than 0.0001; By conventional criteria, this difference is considered to be extremely statistically significant. The mean of Group One minus Group Two equals 415.7500; 95% confidence interval of this difference: From 390.7785 to 440.7215; t = 34.9783; df = 18; standard error of difference = 11.886.
Publisher’s Note: MDPI stays neutral with regard to jurisdictional claims in published maps and institutional affiliations.

