Article

Effects of Supply Angle on Thermal Environment of Residential Space with Hybrid Desiccant Cooling System for Multi-Room Control

1
School of Mechanical Engineering, Kookmin University, Seoul 02707, Korea
2
Department of Mechanical Engineering, Graduate School, Kookmin University, Seoul 02707, Korea
*
Author to whom correspondence should be addressed.
Appl. Sci. 2020, 10(20), 7271; https://doi.org/10.3390/app10207271
Submission received: 2 September 2020 / Revised: 5 October 2020 / Accepted: 15 October 2020 / Published: 17 October 2020
(This article belongs to the Special Issue Sciences and Innovations in Heat Pump/Refrigeration: Volume II)

Abstract

:
In this study, local measurement and computational fluid dynamics (CFD) were employed to evaluate the thermal comfort in a residential environment where desiccant cooling is performed in an outdoor air condition, which is the typical summer weather in Korea. The desiccant cooling system in the present study has been developed for multi-room control with a hybrid air distribution, whereby mixing and displacement ventilation occur simultaneously. Due to this distribution of air flow, the thermal comfort was changed, and the thermal comfort indicators conflicted. The evaluation indicators included the ASHRAE (American Society of Heating, Refrigerating and Air-Conditioning Engineers) comfort zone, predicted mean vote (PMV), and effective draft temperature (EDT). The dry-bulb temperature displayed a distribution of 26.2–26.8 °C in the cooling spaces, i.e., living room, kitchen, and dining room. When determined based on the standard ASHRAE comfort zone, the space where desiccant cooling takes place entered the comfort zone for summer. Due to the influence of solar radiation, the globe temperature was more than 2 °C higher than the dry-bulb temperature at the window. A difference of up to 6% in humidity was observed locally in the cooling space. In the dining room located along the outlet of the desiccant cooling device, the PMV entered the comfort zone, but was slightly above 1 in the rest of the space. Conversely, as for the EDT, its value was lower than −1.7 in the dining room, but was included in the comfort zone in the rest of the space. By adjusting the discharge angle upward, the PMV and EDT were expected to be more uniform in the cooling space. In particular, the optimum discharge angle obtained was 40° upward from the discharge surface.

1. Introduction

In Korea, the demand for heating varies greatly depending on the season, but the heat-to-electricity ratio of cogeneration cannot be adjusted according to the fluctuations of demand [1]. The problem becomes particularly serious during summer when there is no demand for heating; thus, a system configuration and operation plan to solve this problem has been studied. Recently, technologies to reduce heat load in summer, such as green roofs, have been introduced [2]; however, in the case of combined heat and power systems, the treatment of excess heat is still a problem. The most representative approach is the implementation of the cooling system driven by thermal energy [3].
Cooling systems driven by thermal energy include absorption, desiccant and adsorption cooling. In absorption cooling, the technology is highly mature, which might explain its wide usage compared to the other two. To facilitate it, a high-temperature heat source and a large facility are required; thus, it is difficult to use it in connection with an existing district heating system [1,3]. Desiccant cooling follows absorption in terms of usage popularity. Solid and liquid desiccants are typically used in this system, with more preference is given to the solid one due to technical issues [4,5].
Additionally, desiccant cooling is sensitive to outdoor air conditions, because dehumidification and ventilation take place during the process [6]. Thus, hybrid desiccant cooling systems are sometimes used to secure sufficient cooling capacity in high-temperature and high-humidity environments, such as Korea or Taiwan [5,6]. Hybrid desiccant cooling can be considered even in places where applying evaporative cooling is difficult due to insufficient water [7]. When applied in conjunction with district heating, the hybrid desiccant cooling system shows adequate performance, as demonstrated in Korean residential spaces [8]. However, compared with the conventional air conditioners with high technological maturity, the reduced operating costs are deflected by the high costs of equipment, making it difficult to obtain the economics [9].
Because desiccant cooling contributes to energy and greenhouse gas reduction, a common effort by manufacturers, governments, and consumers is required to secure economic feasibility. Manufacturers must reduce costs through technology development. For the government’s policy support, a cost–benefit analysis of desiccant cooling in terms of energy and environment should be conducted [10]. In addition, if the effect of improving indoor air quality through desiccant cooling is properly promoted, it can persuade consumers to pay additional costs [11].
Many factors affect indoor air quality; however, in the case of air conditioners, thermal comfort has a great influence on consumers’ choices. Among the evaluation indicators of thermal comfort, the simplest and most widely used one is setting the seasonal comfort zone based on temperature and humidity [12]. This is the ASHRAE comfort zone, an indicator developed in the United States. In Japan, which has a similar summer climate to Korea, a result of feeling a little cold in the comfort zone has been reported [13]. However, if the thermal comfort is evaluated using this index, the comparison would be difficult because both conventional air conditioners and desiccant cooling are included in the comfort area [8,13].
A representative index that allows a relative comparison is the predicted mean vote (PMV) [14,15]. PMV additionally considers variables such as radiant temperature, metabolic activity, and clothing, among others, in addition to the temperature and humidity of an indoor space. The PMV value ranges from −3 to 3, enabling a comparison of the values of relative thermal comfort. However, in PMV, variables such as climate, psychological factors and ventilation are not reflected, which leads to some controversy [16]. Nevertheless, PMV is still the most widely used index for evaluating thermal comfort, along with the ASHRAE comfort zone. For desiccant cooling, there is existing work on a simulation-based PMV prediction for a liquid desiccant system operated in an office space [17].
Besides PMV, there is another index of thermal comfort that can be compared quantitatively, i.e., the effective draft temperature (EDT). The EDT index is commonly used for the evaluation of thermal comfort in air-conditioning spaces with ventilation, such as desiccant cooling systems [18]. EDT has been frequently studied as an indicator of thermal comfort in East Asia, where Korea is situated. However, in the EDT index, measuring the local airflow velocity distribution required for EDT calculation, which is mostly obtained through computational fluid dynamics (CFD), is difficult [19,20]. The distribution of airflow generated by the air conditioner is greatly influenced by the discharge angle. Recently, studies that analyzed the effect of discharge angle on flow distribution, energy efficiency and thermal comfort by CFD have been published [21,22,23,24].
For floor standing type air conditioners, the optimum discharge angle considering energy consumption and thermal comfort was calculated to be 30° upward [21]. Lee et al. [23] reported that the flow rate varies up to 20% depending on the discharge angle for the wall mounted type, but the thermal comfort was left as a future work. In the case of the casette type [24], it was reported that the optimum supply angle was 30° from the ceiling when considering ventilation and PMV.
The desiccant cooling system analyzed in this study has a discharge type close to that of a standing type air conditioner. However, the return air intake is located on the ceiling. In a conventional air conditioner, the supply port and the suction port are located close to each other for mixing ventilation [21,24]. However, this system has been developed for the purpose of multi-room control, and has a hybrid air distribution system in which mixing and displacement ventilation occur simultaneously [25], as the suction port is installed on the ceiling. Therefore, in the present study, the change in thermal comfort according to the discharge angle in a cooling space with hybrid air distribution was investigated.
Because the factors of EDT are affected by PMV, EDT and PMV have a strong correlation in the laboratory environment without direct sunlight [26]. However, in a residential environment with windows and direct sunlight, it was found that the two factors locally conflict with each other due to different distributions of radiant temperature and air current. Therefore, in the present study, a discharge angle with optimal thermal comfort was found between PMV and EDT in a residential space where desiccant cooling was performed.

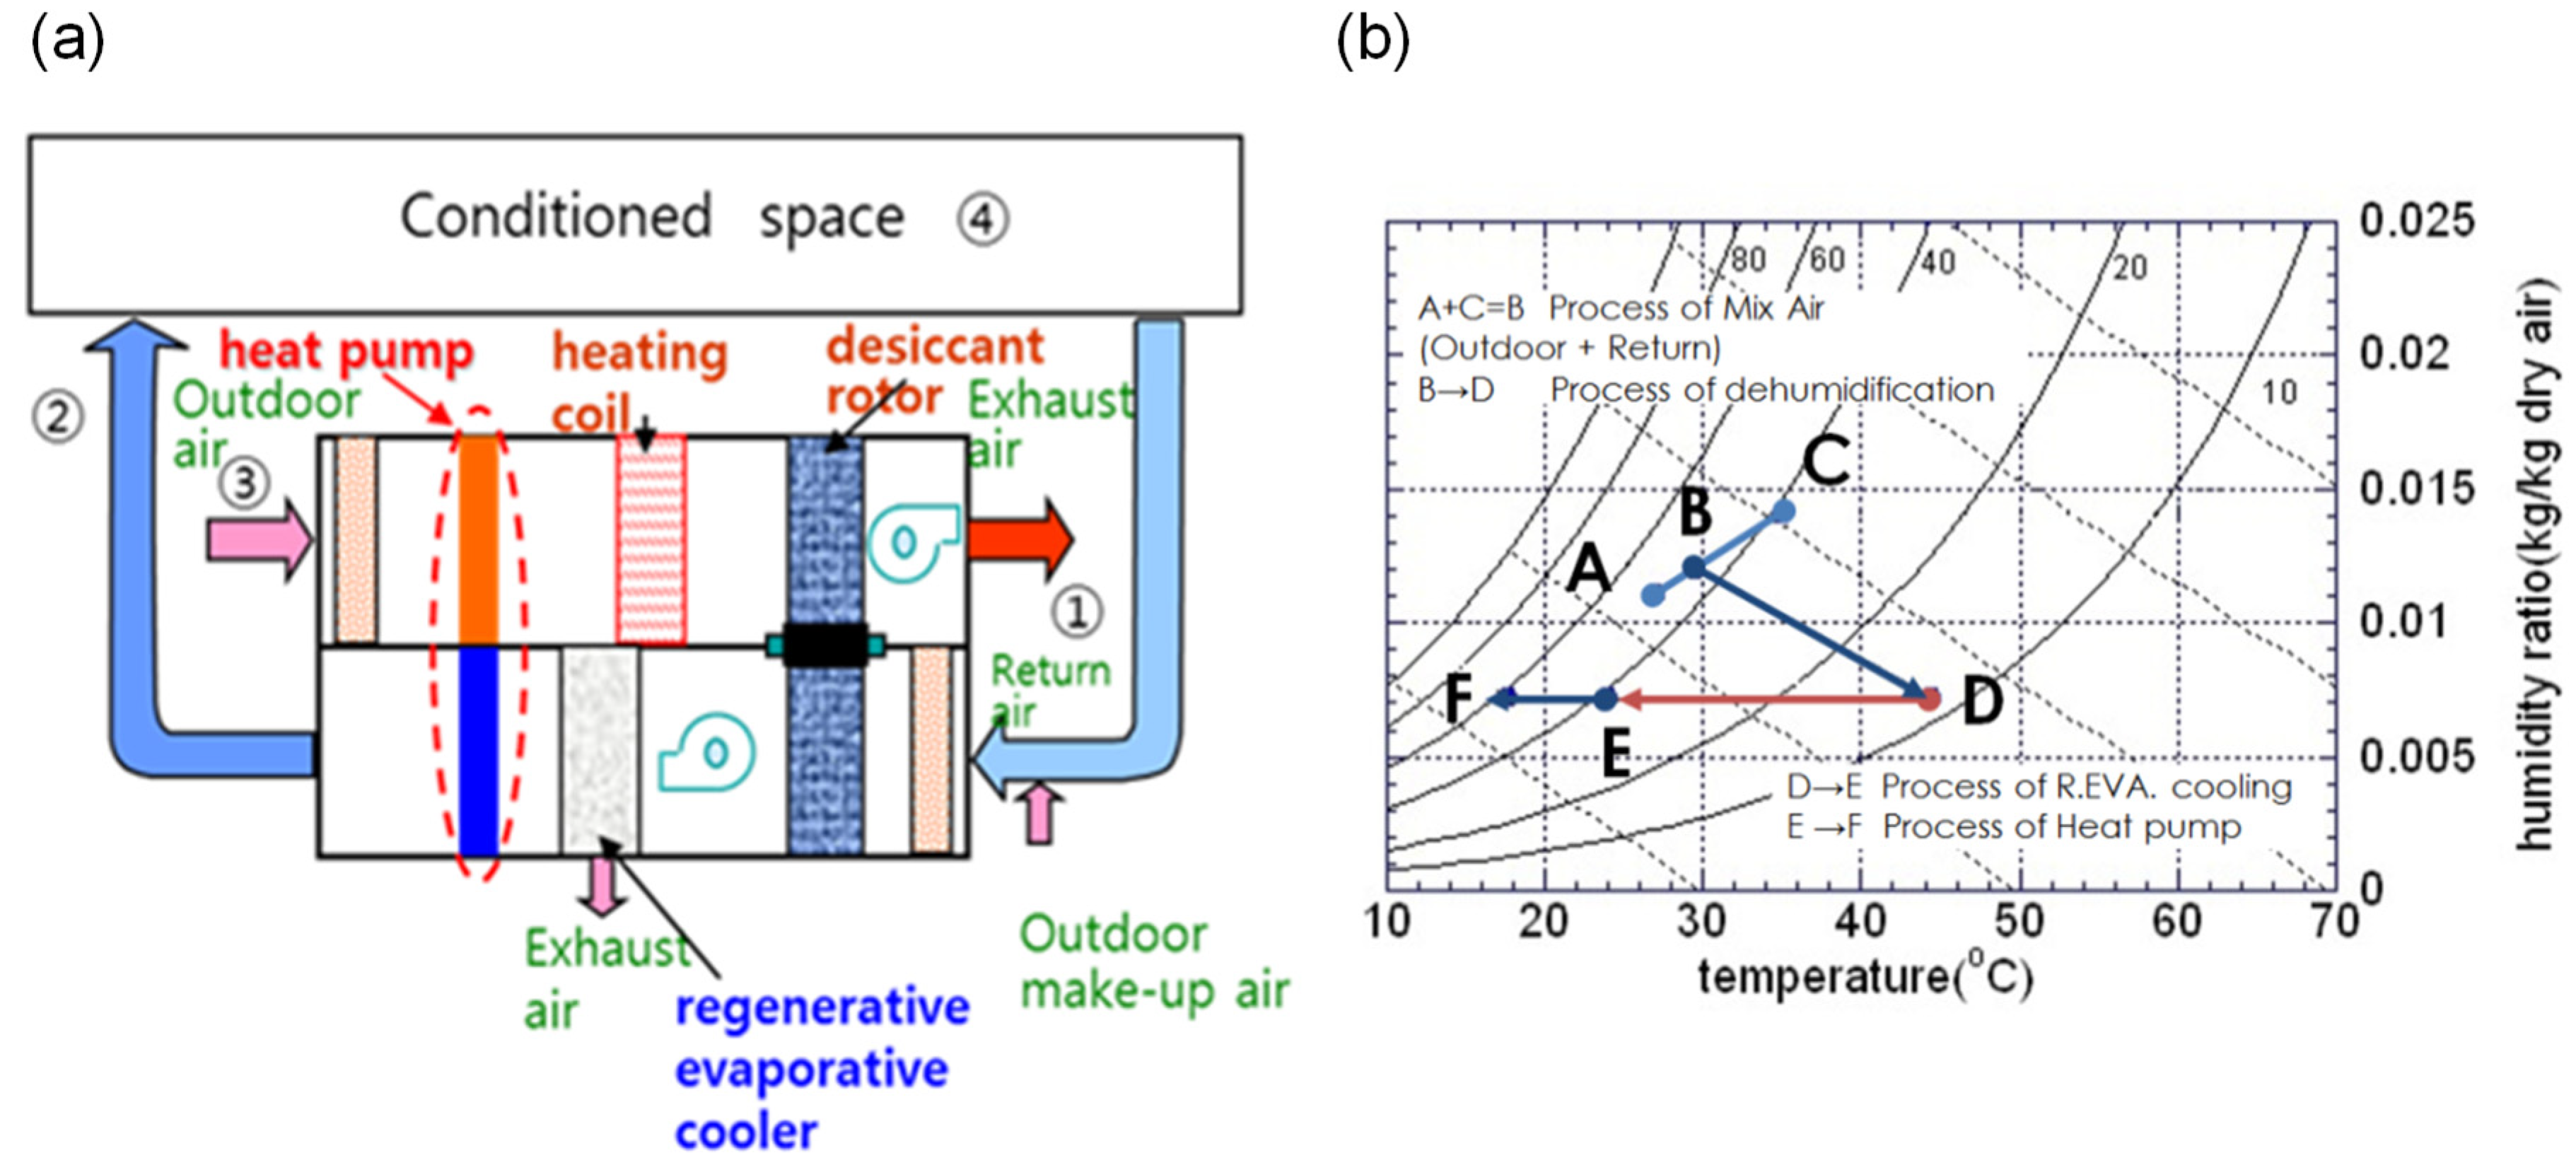
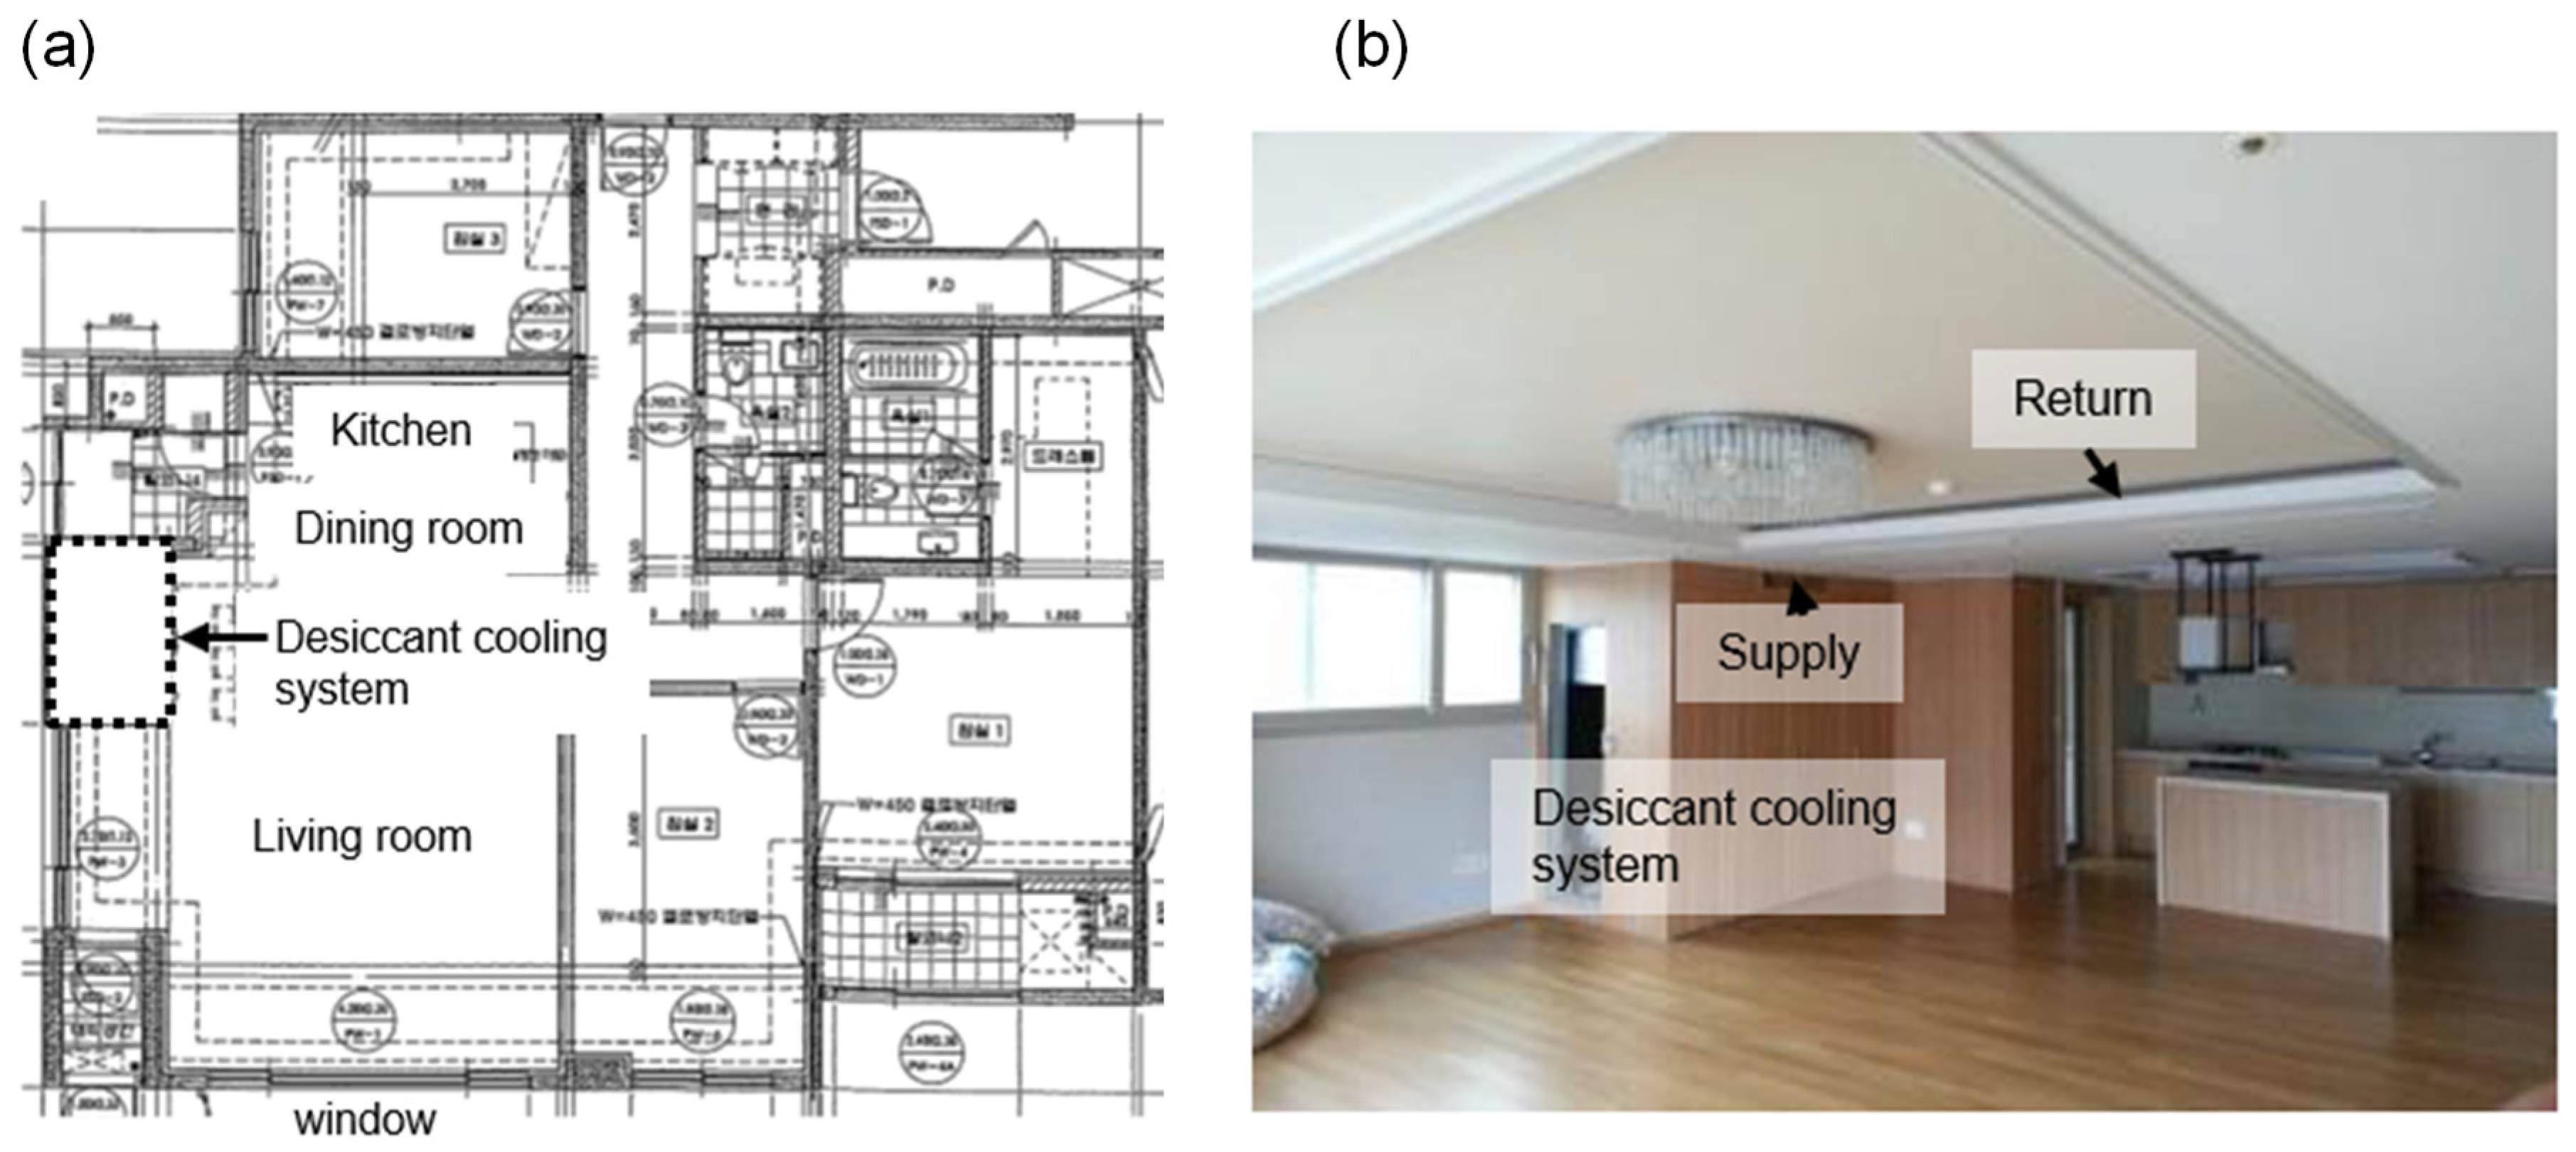
2. Hybrid Desiccant Cooling System and Air-Conditioned Space

The desiccant cooling system consists of a regenerative heat source, a desiccant device, and an evaporative cooler. Herein, district heating supplied to apartment houses was treated as the heat source. The temperature of the hot water supplied from district heating was 70 °C. A solid desiccant manufactured in the form of a rotor was used [6] in the present system. With the desiccant rotor, the hybrid desiccant cooling system [8] shown in Figure 1a was applied to high-humidity climates and residential environments. Its operation process is shown on the psychrometric diagram in Figure 1b.
In Figure 1a, the upper part is the regeneration unit and the lower part is the desiccant unit. In the regeneration unit, the air heated through a heat pump and the district heating (heating coil) regenerates the desiccant rotor. In the desiccant section, a mixture consisting of 70% of the return air (A in Figure 1b) and 30% of the outdoor air (C in Figure 1b) is supplied to the desiccant rotor. The air that has passed through the desiccant rotor (D in Figure 1b) is cooled primarily through the evaporative cooler (E in Figure 1b). Then, it is additionally cooled while passing through the evaporator of the heat pump, and supplied as the cooling air to the room (F in Figure 1b). The design COPs of the evaporative cooler and heat pump are 0.64 and 3, respectively.
The hybrid desiccant cooling system used herein was developed in Korea. Its prototypes were installed in 10 apartment houses located in Yongin-si, Gyeonggi-do, and the performance of each was verified through field tests during the summer of 2013 [9]. The system was designed to have a cooling capacity of 7 kW at the dry and wet bulb temperatures of 35 °C and 23.9 °C, respectively, which are the standard experimental conditions of AHRI [27]. In Korea’s summer outdoor conditions (dry-bulb temperature, 24–34 °C; absolute humidity, 0.012–0.022 kg/kg), the cooling capacity is typically 5.5–7 kW [9]. The heat pumps that make up the hybrid system have a nominal cooling capacity of 1.9 kW.
The test site was one of the apartment houses in Yongin-si, Gyeonggi-do, the floor plan and interior photos from which are shown in Figure 2. Here, the air-conditioning space covers the living room, dining room, and kitchen. The desiccant cooling unit was installed in one corner of the living room, and the cooling air was supplied from the top of the equipment. The total area of the cooling space was 126 m2. The air after cooling was recovered through a slot in the ceiling. Furthermore, there were windows on the front and side of the living room. Thermal comfort was evaluated without curtains on the windows.

3. Methods

3.1. PMV Measurements

Typical Korean summer weather, characterized by a temperature of 31 °C and a relative humidity of 57%, was the outdoor condition on the day of the experiment (see the red dot in Figure 3a). This experiment was conducted on 13 August 2019. In the aforementioned residential space, the desiccant air conditioner was operated from 11 a.m. to 5 p.m. Figure 3b shows the room temperature and return air temperature during the cooling operation period. After the hybrid desiccant cooling system was initiated at 11 a.m., it entered a steady state in approximately 40 min, with the average indoor temperature of the cooling space at 26.7 °C and the absolute humidity at 10 g/kg. Thermal comfort was measured between 1 and 2 p.m.
As shown in Figure 3c, the indoor thermal environment entered the summer comfort zone of ASHRAE. In the desiccant cooling space, there was no noticeable difference in the thermal comfort of each space (kitchen, dining room, and living room in Figure 2) as observed in the ASHRAE comfort zone. The ASHRAE comfort zone (see Figure 3c) is defined by temperature and humidity. However, thermal comfort sensed by the human body is also affected by insolation, metabolism, and clothing, as well as airflow. PMV, the popular thermal comfort index that includes these indicators, is well-predicted by the following set of equations [15,16]:
P M V = [ 0.303 · e x p ( 0.036   M ) + 0.028 ] · { ( M W ) 3.05 × 10 3 [ 5.733 6.99   ( M W ) p a ] 0.42 [ ( M W ) 58.15 ] 1.7 × 10 5   M   ( 5.867 p a ) 0.0014   M   ( 34 t a ) 3.96 × 10 8 · f c l · [ ( t c l + 273 ) 4 ( t r + 273 ) 4 ]   f c l   h c   ( t c l t a ) }
t c l = 35.7 0.028 ( M W ) l c l { 3.98 × 10 8 f c l [ ( t c l + 273 ) 4 ( t r + 273 ) 4 ] } + f c l   h c ( t c l t a )
h c = { 2.38   | t c l t a | 0.25 ,   2.38   | t c l t a | 0.25 < 12.1   v a r 12.1   v a r ,   2.38   | t c l t a | 0.25 > 12.1   v a r
and
f c l = { 1.00 + 1.29   l c l ,   l c l < 0.078   m 2 K / W 1.05 + 0.645   l c l ,   l c l 0.078   m 2 K / W
where M and W in Equation (1) represent metabolism and effective power, respectively. Accordingly, fcl in Equation (4) is the clothing surface area coefficient, tcl in Equation (2) is the clothing surface temperature, and ta, tr, and hc in Equation (3) are the dry-bulb temperature, globe temperature, and heat transfer coefficient, respectively. Moreover, pa represents the vapor partial pressure, which can be obtained from the humidity, whereas var means airflow velocity.
A PMV meter (testo PMV 400) was used to measure the temperature, average radiation temperature, air speed and humidity in the space shown in Figure 2. As for the measuring points (shown in Figure 4a), the kitchen, dining room and living room were divided into 3, 4 and 9 sections, respectively. The height was 1.1 m from the ground, which is a breathing position that senses the thermal comfort when seated in a chair in an office environment [28]. The temperature sensor was separately calibrated before the experiment. In the range in which the measurements were performed, the accuracy of the PMV meter was within 0.1–0.15 °C for temperature and 2% for relative humidity. The velocity sensor of the PMV meter was a hot wire with a resolution of 0.01 m/s and an accuracy of 0.1 m/s.

3.2. Flow Simulaton

As depicted in Equation (3), a local velocity distribution (var) is required to obtain the heat transfer coefficient, hc. It is difficult to measure the airflow velocity in the cooling space because of its very small value, except around the outlet of the air conditioner. CFD is effective in this regard as the flow is easily changed by the measuring device or the person measuring. Thus, CFD was used herein for obtaining the airflow velocity distribution.
To obtain air velocity information in the cooling space, the space shown in Figure 2 was modeled, with the velocity measured with an anemometer at the discharge position of the desiccant cooler as a boundary condition. No-slip boundary conditions were imposed on the solid walls. Pressure outlet boundary conditions were imposed on the exits.
The CFD analysis was performed using commercial software Star CCM+, considering the cooling space shown in Figure 4b as the computational domain for which a grid system was constructed using 3 million hexahedral cells. This was slightly greater than in a recent study by Shan et al. [29], which had used 1.6 million grids. Reynolds-averaged Navier–Stokes analysis was performed to solve the 3D Navier–Stokes equation for incompressible flow. Recently, simulation results, including buoyancy [30] and radiative heat transfer [29], have been published. They were included in the analysis considering heating elements such as occupants and lighting equipment in the cooling space. In the present simulation, these heating elements were not included, so buoyancy and radiant heat transfer were not considered.
The RNG (Re-Normalization Group) kε model, which has been verified for similar problems in previous studies [19,20,22,24,30], was adopted as the turbulence model. Zhu et al. [30] mentioned that the RNG kε model gives the best results because the flow generated by the air conditioner is close to the free jet flow. Pressure–velocity coupling was handled with the SIMPLE (Semi-Implicit Method for Pressure Linked Equations) algorithm. The convection terms were discretized with a second-order upwind scheme. Moreover, the convergence level was set at 10−5.
In Figure 4c, the numerical analysis results were validated based on the velocity profile in the dining room. First, it can be confirmed that the result obtained using 3 million grids agrees well with the result using 2 million grids to obtain a grid converged solution. Next, when comparing with the measurement data, the velocity profiles obtained via simulation at the four velocity measurement points agree well within the measurement error range.

4. Results and Discussion

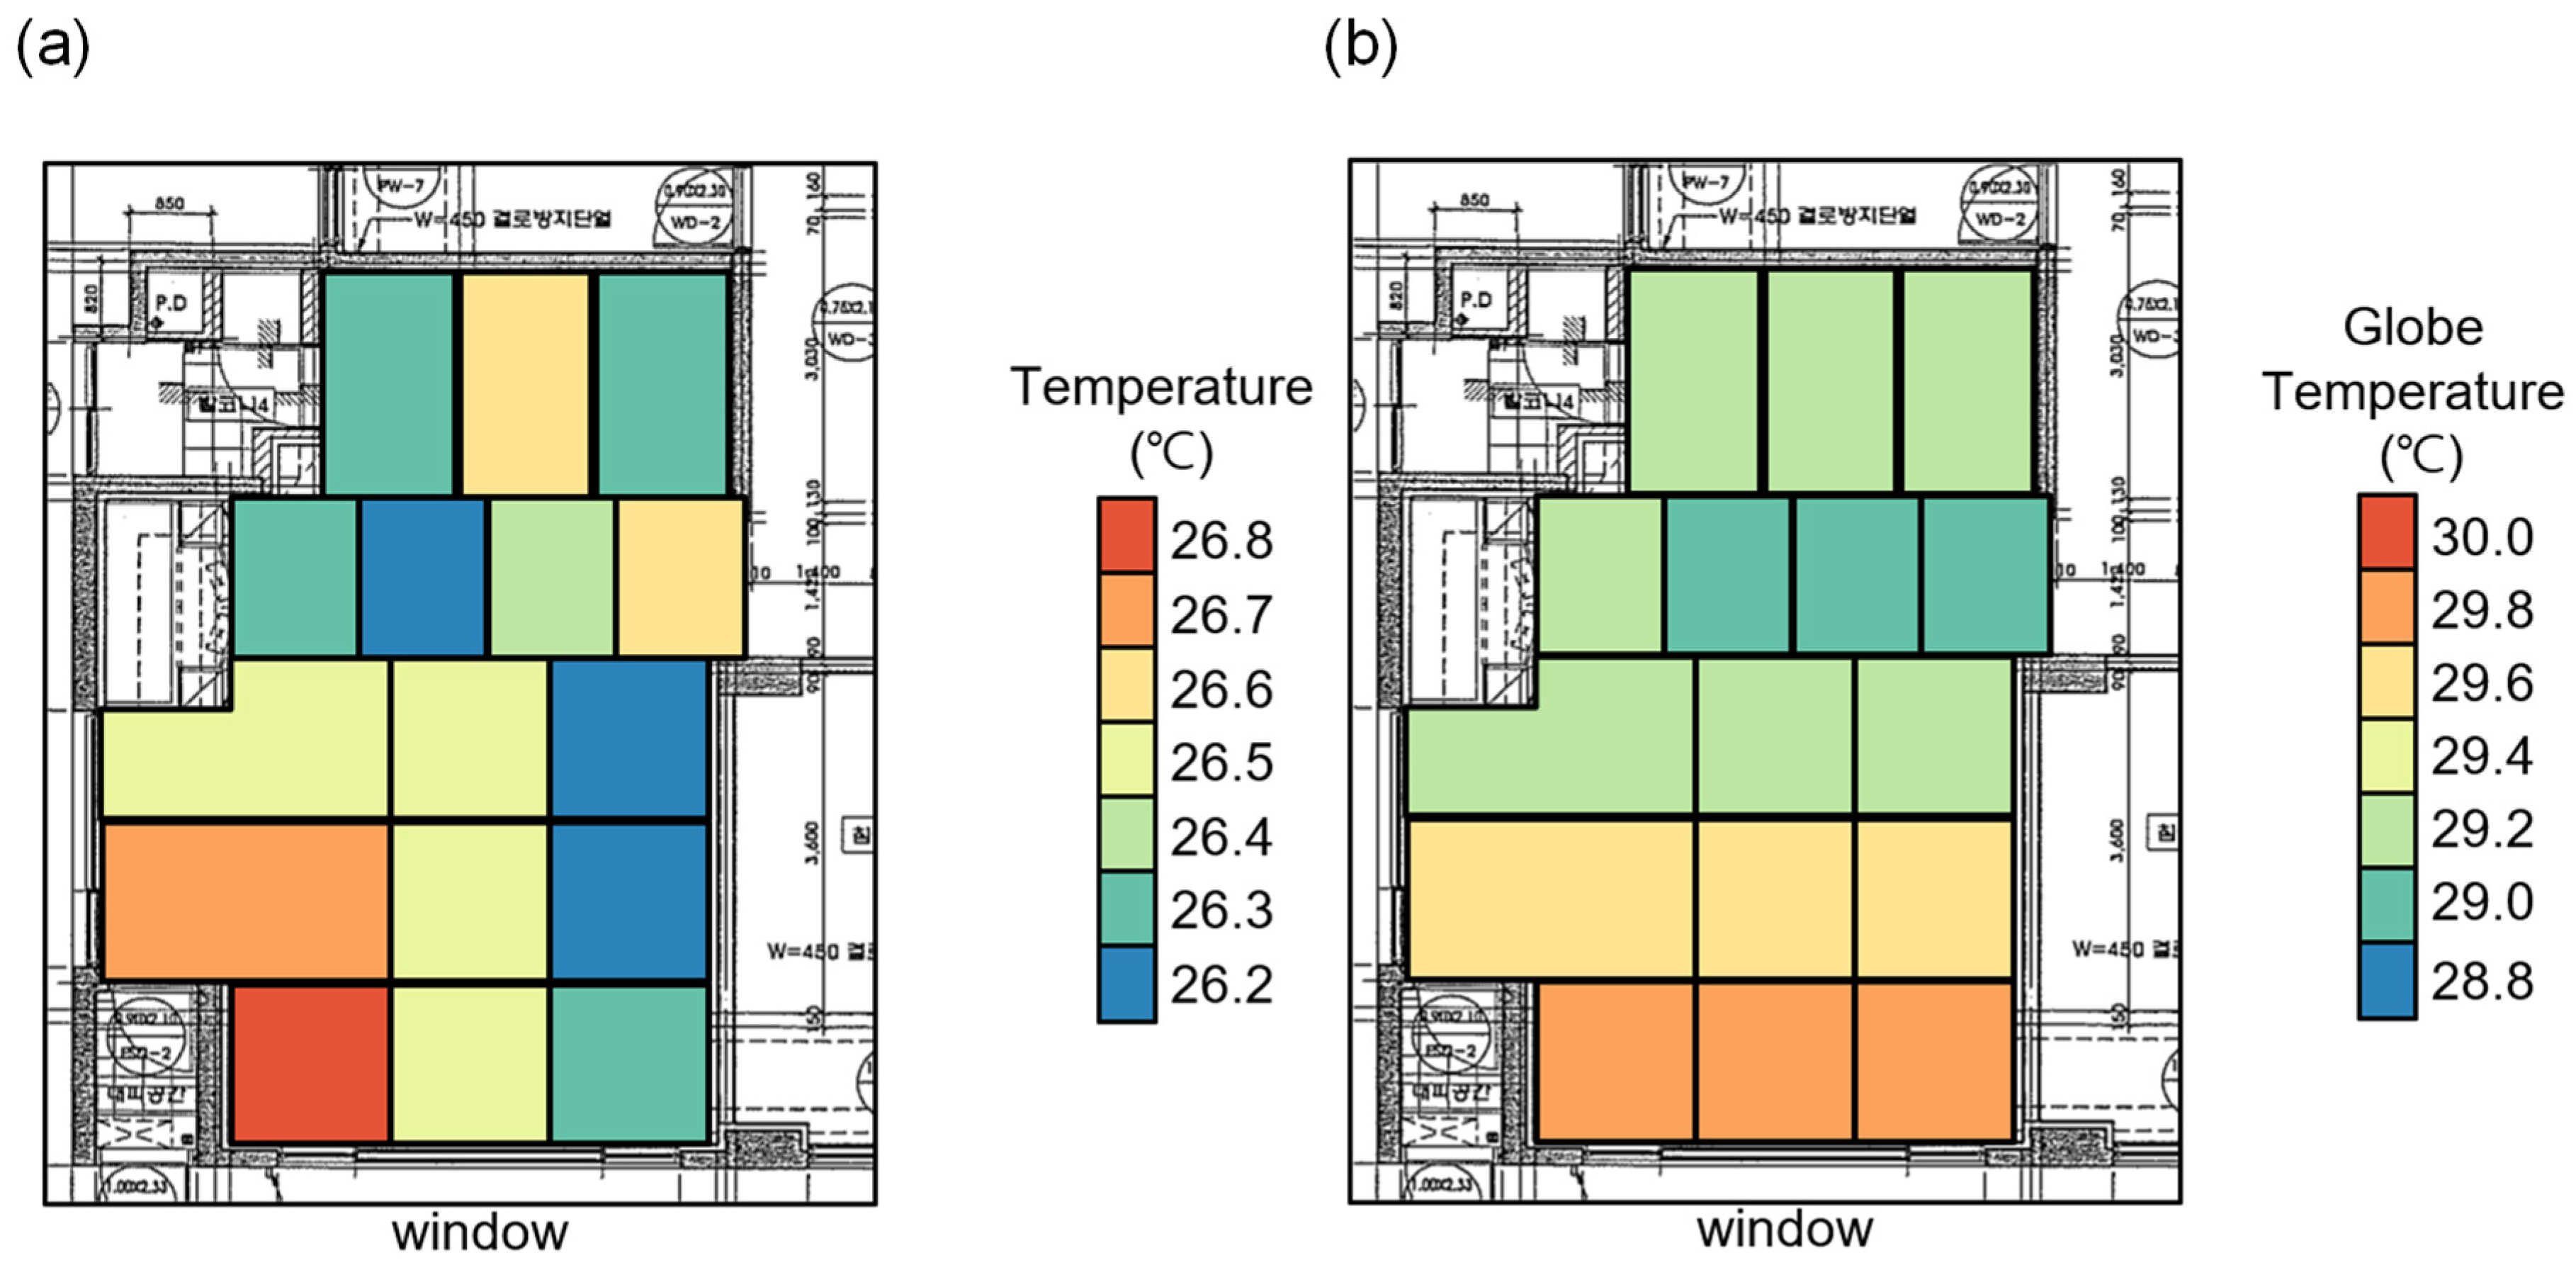
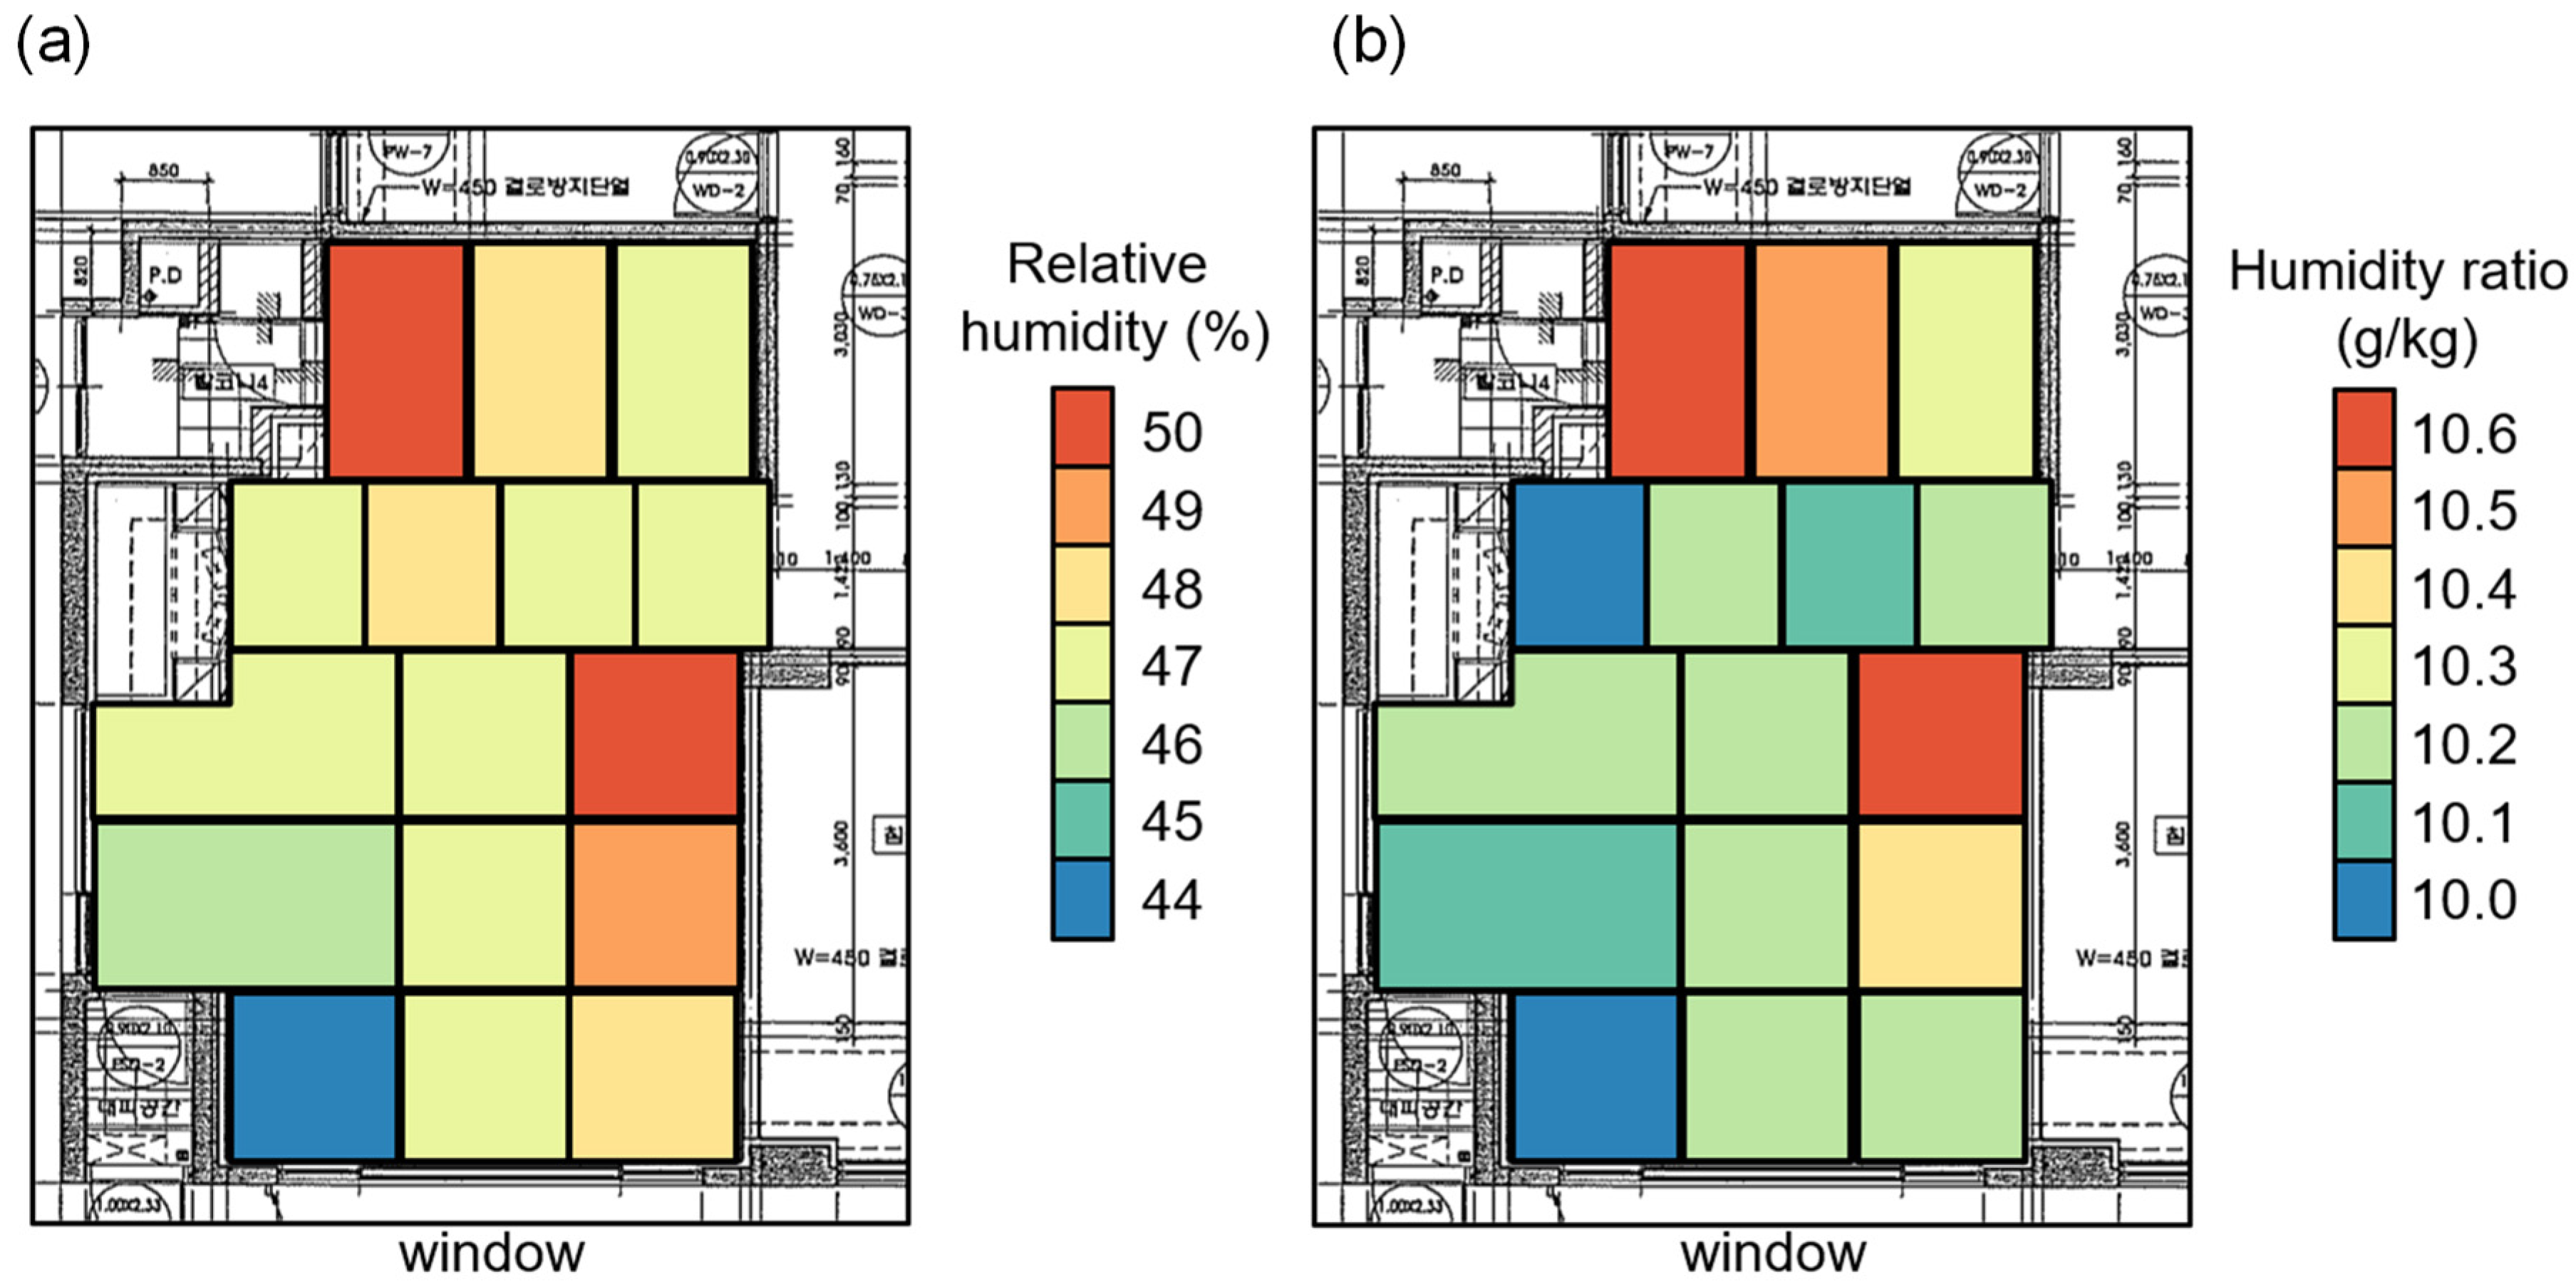
4.1. Temperature and Humidity

The temperature indicated in Figure 5a is the most important thermal environmental factor, as it is the dry-bulb temperature. Accordingly, it displayed a distribution of 26.2–26.8 °C in the air-conditioned space. The temperature was not high for the kitchen, where the cooling flow was not supplied smoothly. However, a high temperature was observed around the corner of the living room. (Air flow distribution will be described later in Section 4.3.)
The thermal comfort evaluation via ASHRAE comfort zone, shown in Figure 3c, was based on the dry-bulb temperature, and the effect of solar radiation was not considered. Unlike the constant temperature and humidity chamber in which the performance of the refrigerator is mainly evaluated, the actual living space is affected by solar radiation owing to the presence of windows. Because of the direct sunlight that enters the living room through the window, the distribution of the black bulb’s temperature measured at the radiation equilibrium state of the black body was different from that of the dry-bulb temperature.
As seen in Figure 2a, the windows of the cooling space can be found in the west and south of the living room. In particular, there are partial windows in the west and full windows in the south. The experiment was conducted around 1 p.m., with the south set as the direction of the solar radiation. Because of the solar radiation, a region with a high average radiant temperature appeared in the area around the southern window. In the absence of sunlight, the radiant temperature was reported to be approximately 1 °C higher than the dry-bulb temperature [29].
It should be noted that at the time of measurement, the average radiant temperature was measured without a shade. Therefore, there is a significant difference of 3.4 °C between the black bulb temperature distribution (shown in Figure 5b) and the dry-bulb temperature distribution (shown in Figure 5a). The globe temperature was clearly higher near the southern window, but was also higher than the dry-bulb temperature in other areas where direct sunlight was not shining. Overall, it showed a distribution of 28.8–29.8 °C, which is at least 2 °C higher than the dry-bulb temperature.
Figure 6 presents the distribution of humidity at the height of 1.1 m from the ground in the cooling space. As depicted in Figure 6a, the overall distribution of relative humidity fell between 44% and 50%; thus, the indoor environment could be located in the upper right part of the ASHRAE comfort zone (as shown in Figure 3). In the case of the local humidity, the saturated water vapor pressure tended to increase with a rise in temperature; thus, the humidity distribution showed similarity with the inversion of the temperature distribution shown in Figure 5a. That is, the relative humidity was lowest in the left corner of the living room where the dry-bulb temperature is high, whereas it was high in the kitchen corner and near the wall opposite the outlet, where the cooling effect was likewise high.
The standard ASHRAE comfort zone is dictated by the dry-bulb temperature and relative humidity; however, in the PMV calculation, humidity is considered as the partial pressure of water vapor, which is known to be directly related to the humidity ratio. Figure 6b shows the humidity ratio obtained from the dry-bulb temperature in Figure 5a and the relative humidity in Figure 6a. Based on the figure, the humidity ratio ranged between 10.0 and 10.6 g/kg, while the shape of the overall spatial distribution was similar to that of the relative humidity depicted in Figure 6a.

4.2. Air Flow and Thermal Comfort

The air supplied from the desiccant cooler was allowed to generate a narrow jet flow towards the opposite wall in the dining room. As depicted in Figure 7, after the collision, it was supplied to the living room and kitchen, and exited through the outlet installed on the ceiling, after the cooling was complete. The large airflow velocity in the vicinity of the jet flow increases the possibility that a human body would feel an unwanted local cooling, i.e., a human body would feel a draft and thermal discomfort. To evaluate this, checking the draft-related thermal comfort indicators, such as the EDT, was deemed necessary. In the region excluding the jet flow, there was no flow observed to evenly supply cooling air; thus, the need to check the local thermal comfort distribution was inferred.
Applying Equation (1), the PMV can be obtained upon the inclusion of metabolism and clothing information, along with the dry-bulb temperature, globe temperature, and humidity obtained through the measurement. Herein, the PMV was calculated by applying 1.0 met (60 W/m2), the metabolism of working in an office environment, and 0.5 clo, the standard of summer clothing. The PMV was determined to range from −3 to 3, whereas the thermally comfortable point should be set as 0; nevertheless, a value between −1 and 1 can be judged as comfortable [15,16]. As shown in Figure 8a, based on PMV, the desiccant cooling space was located at the boundary of the thermally comfortable area.
Considering the structure of the desiccant cooling space shown in Figure 2, the thermal comfort was expected to be poor as a result of direct sunlight entering through the window. Actually, the globe temperature in Figure 5b could be seen to increase to 29.8 °C at the window. Taking into account the globe temperature for the calculation of the PMV, it could be seen that the value of the latter increased at the window, resulting in an average PMV value at the living room that was estimated to increase up to 1.2.
Likewise, the airflow distribution in Figure 7a indicates that cooling air was not supplied smoothly even in the kitchen, resulting in a PMV of 1.22, which is higher by 1.0. Based on the PMV, the most comfortable area was apparently the dining room. However, in Figure 7a, the distribution of airflow caused the generation of a strong jet flow around the dining room, which raised the concern of possible thermal discomfort in relation to the airflow draft. To examine this, the EDT was evaluated using the following equation:
E D T = ( t a t m ) C ( v a r v r e f )
where ta and var represent the local temperature and velocity, respectively. In addition, tm is the spatially averaged temperature, vref is the reference velocity of 0.15 m/s, and C is a coefficient (having a value of 7 or 8 according to the literature for Celsius temperature [16,17]) set in the analysis herein to be 8. For the EDT, a value between −1.7 and 1.0 is judged as comfortable. According to these range criteria, the kitchen and living room can be considered as comfortable areas. Based on the PMV, the dining room that was included in the comfortable region had an EDT value of −2.3, which was less than −1.7, indicating that it was out of the comfortable area.

4.3. Effects of Air Supply Angle on Thermal Environment

Based on the thermal comfort distribution analysis above, there are a number of points that are worthy of discussion. For instance, based on the PMV, the dining room was included in the comfortable area, whereas the living room and kitchen were slightly hot. This contradicts the results based on the EDT, which indicate that the living room and kitchen were comfortable, whereas the dining room was out of the comfort zone.
Upon investigation of the temperature distribution in Figure 5a, an area with a poor cooling effect could be observed in the lower left corner of the living room. As is apparent from the EDT distribution in Figure 8b, the dining room showed a low EDT, where the formation of a jet-like airflow originating from the supply location was noticeable. Liu et al. [21] reported improving the EDT distribution in a space by adjusting the discharge angle of a standing type air conditioner. Herein, an attempt was made to simultaneously solve the two problems mentioned above by changing the supply angle of the cooling air.
Liu et al. [21] reported generally good results when the discharge angle was adjusted upward. Herein, the numerical analysis was first conducted for the case of discharging 45° upward by controlling the exit guide vane (see Figure 7b). The corresponding results are presented in Figure 9. Looking at the airflow distribution shown in Figure 9a, the cooling air was supplied more evenly to the cooling space than it was in the airflow distribution shown in Figure 7a, which was supplied perpendicular to the discharge port’s surface.
Meanwhile, in the EDT distribution shown in Figure 8b, a value of at most −1.7 was recorded in the dining room due to the high-velocity airflow. In Figure 9b, the velocity distribution in the case of supplying the cooling air vertically from the discharge surface, and that of supplying it at a 45° upward angle, were compared at a height of 1.1 m. As can be seen from the two velocity contour plots in Figure 9b, the high-speed area that existed in the dining room (red-to-yellow color) was removed when the cooling air was supplied at a 45° upward angle, as shown on the right.
Furthermore, from Figure 9b, it can be qualitatively expected that the EDT would be improved by removing the high-speed region. However, finding the optimum discharge angle would require a quantitative index that can evaluate the thermal comfort in the entire cooling space. To quantitatively compare the improvement of the local thermal comfort distribution, the air diffusion performance index (ADPI), which describes the percentage of the comfort zone that satisfies the EDT index [21], was used herein.
When evaluating thermal comfort based on ADPI, the ratio of the area wherein the EDT lies between −1.7 and 1 is considered, as this is the comfort range of the cooling area. If it is more than 80% of the space, then thermal comfort is secured. For the calculation of ADPI, Equation (5) was applied in the calculation of the EDT, for the velocity distribution in Figure 9b, to find the area where the EDT is out of the comfort zone. The zone of discomfort obtained through this analysis is shown in Figure 10.
Figure 10a shows the discomfort zone when the cooling air was supplied perpendicular to the discharge port’s surface. In this case, the discomfort area was determined based on the EDT in a large area centered on the dining room with a jet flow. When the cooling air was supplied at an upward angle of 45°, as indicated in Figure 10b, most of the discomfort areas, which existed widely in the dining room, disappeared. Instead, a discomfort zone was observed locally in the living room and kitchen. To compare the change in thermal comfort according to the change in the discharge angle in each space, the ADPI values for the living room, kitchen, and dining room were calculated, along with the average of the total cooling area. A comparison of the results is shown in Figure 11.
From a comparison of the black and gray bars in Figure 11, it could be inferred that the guide vane was adjusted to supply the cooling air at a 45° upward angle (black bar), after which the cooling performance became spatially more uniform. As reflected in Figure 11a, the PMV for the entire cooling space slightly exceeded 1.0 when cooling air was supplied upward by 45°. This means that it had entered a slightly hot area; thus, if the cooling effect is to be even across the space based on PMV, then the cooling capacity should be slightly increased.
When air was supplied vertically to the outlet surface (light gray bar, Figure 11b), the ADPI was significantly below the comfort standard of 80% in the dining room, and the average of the cooling space was also less than 80%. If the cooling air was supplied at a 45° upward angle (black bar), the ADPI would enter the comfort zone at more than 80% in all the cooling spaces. If the cooling air was supplied upwards at 45°, the ADPI would have a positive effect, but there was a problem in raising the average PMV of the space to more than 1.0. To find the most advantageous discharge angle in both indicators, the effect was examined by changing the discharge angle of the cooling air from 0° (vertical injection) to 80° upward at intervals of 10°. For each case, CFD analysis was performed, and the thermal comfort was evaluated by combining the CFD results and measurement data.
Figure 12 shows the changes of PMV and ADPI according to the discharge angle change. PMV is not very sensitive to the discharge angle compared to ADPI, but it does show the most uniform thermal comfort distribution, as the PMV values of all the cooling spaces gather near the discharge angle of 40° (Figure 12a). In terms of PMV, a discharge angle of about 40° is considered appropriate. The ADPI (Figure 12b) showed that more than 90% of all the areas were in the range of 10–60°; therefore, it was determined that it would be appropriate to set the discharge angle between 10° and 60°.
Considering both thermal comfort indicators, the best thermal comfort distribution can be obtained when the discharge angle is 40° upward. In a conventional air conditioner, the best discharge angle was found to be 33° upward when considering the ADPI and energy efficiency [21]. Herein, taking into consideration the effects of PMV and ADPI, the optimum discharge angle obtained for the hybrid desiccant air conditioner, which is 40° upward, was similar or slightly higher.

5. Conclusions

The present study highlighted the evaluation, mainly through local measurement and CFD analysis, of the thermal environment in a residential environment where hybrid desiccant cooling is performed under outdoor conditions, which represent typical summer weather in Korea. Thermal comfort was evaluated based on the following indicators: standard ASHRAE comfort zone, PMV, and EDT. Furthermore, the effect of the discharge angle was evaluated by simulating the airflow change according to the discharge angle using CFD. The main conclusions are as follows:
  • When judged on the basis of the comfort zone of ASHRAE, the residential space where hybrid desiccant cooling takes place enters the comfort zone in the typical summer weather of Korea;
  • Direct sunlight may cause an increase in the globe temperature, which can exhibit a distribution that is more than 2 °C higher than the dry-bulb temperature even for a shaded area. Therefore, when considering globe temperature, it is necessary to evaluate the thermal comfort via an index, i.e., PMV;
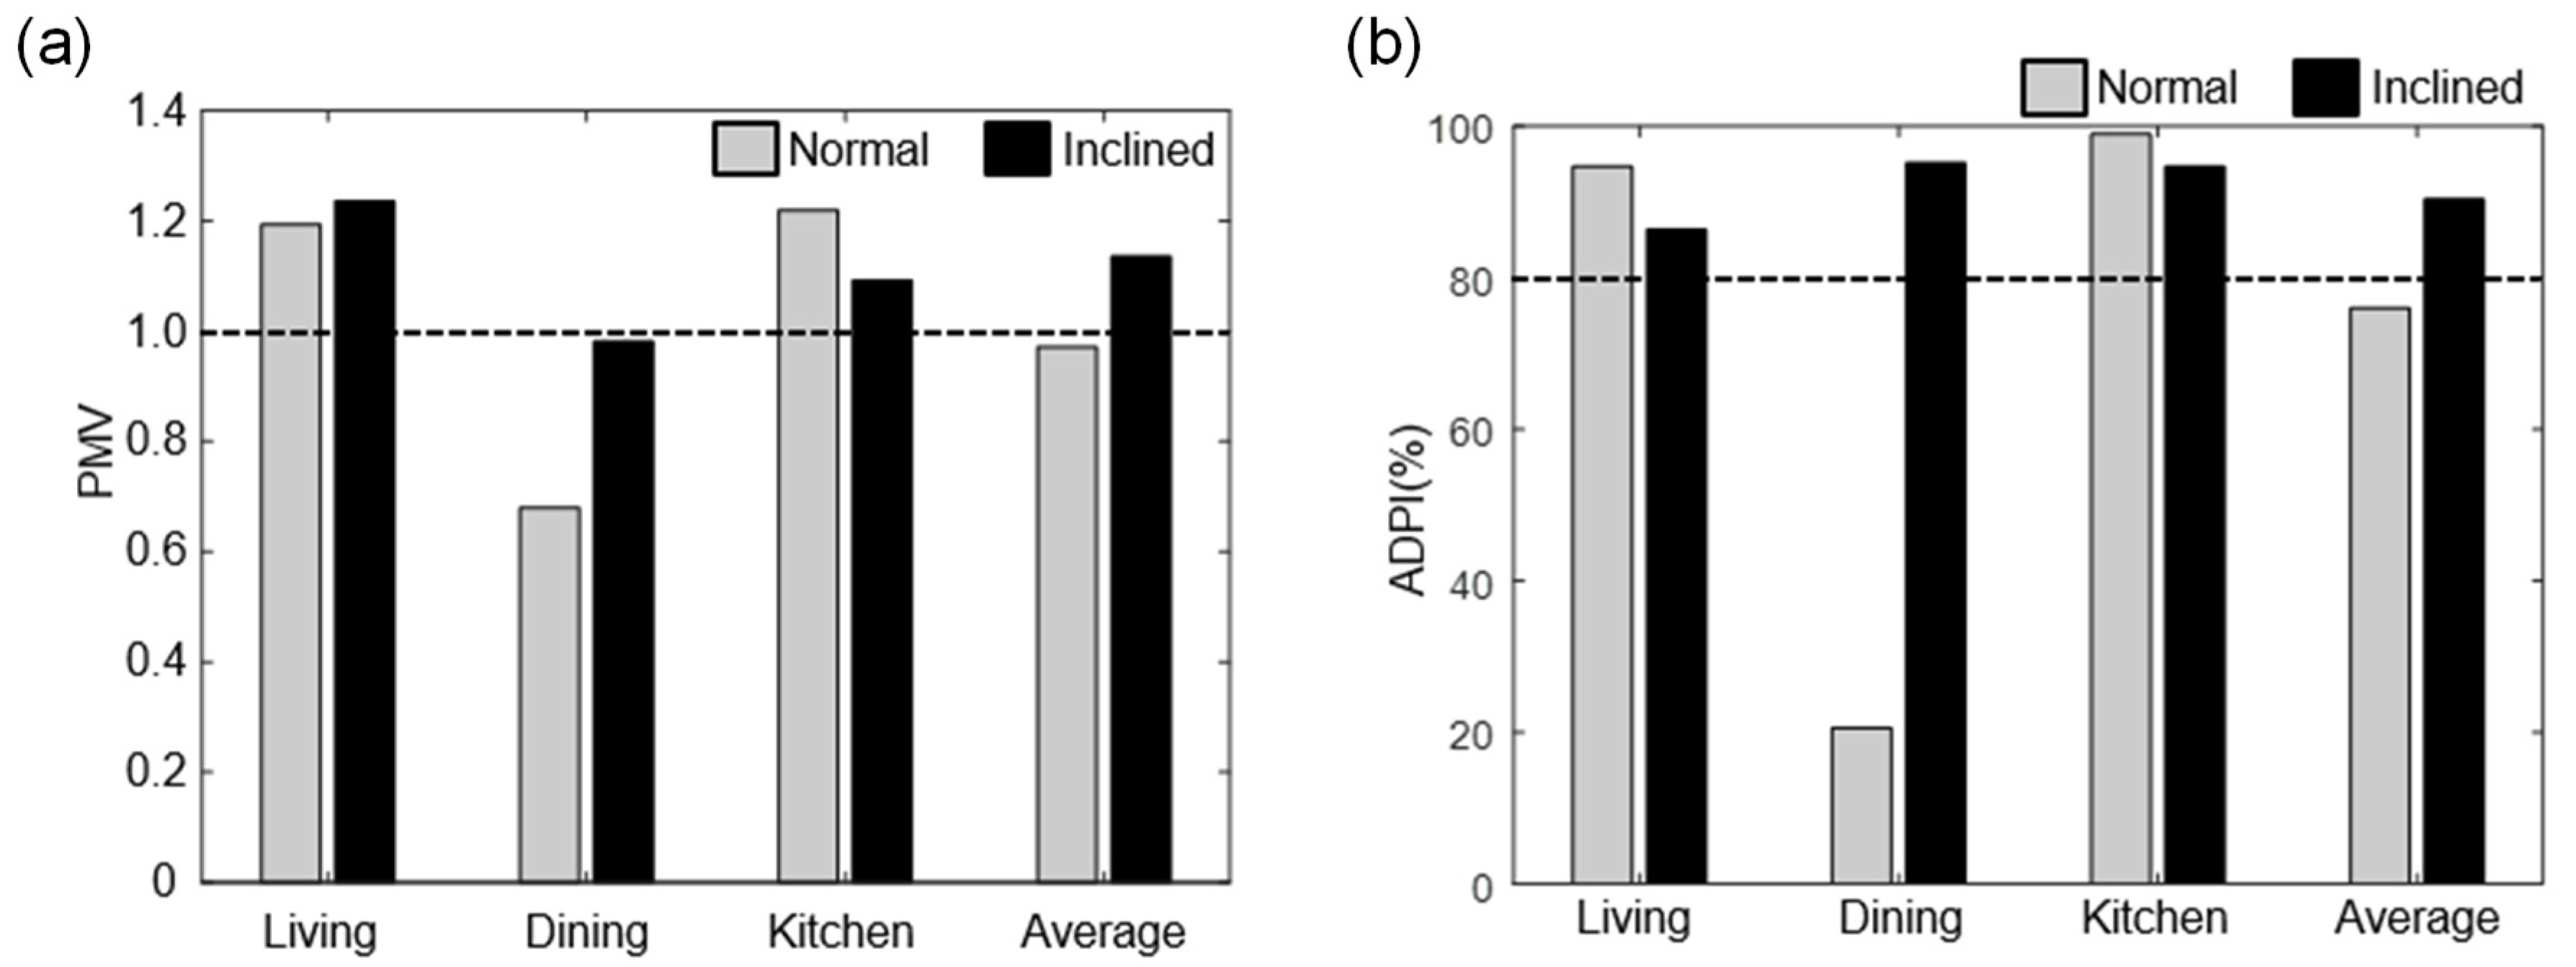
  • In the dining room located in the path of the outlet of the hybrid desiccant air conditioner, the PMV enters the comfort zone, whereas it slightly exceeds 1 in the rest of the space;
  • In contrast, although the EDT in the dining room is lower than −1.7, it still falls within the comfort zone in the rest of the space. Considering this, it is necessary to find an airflow distribution that can secure the PMV and the EDT evenly;
  • Adjusting the discharge angle of the hybrid desiccant air conditioner upward seemingly makes the PMV and EDT more uniform in the cooling space. When both indicators are considered at the same time, the optimum discharge angle is obtained at 40°.

Author Contributions

J.A. supervised the research, conducted the measurements, analyzed the data, and wrote the paper. H.Y.C. performed the CFD simulations and evaluated thermal comfort indices. All authors have read and agreed to the published version of the manuscript.

Funding

This research was supported by Korea Electric Power Corporation. (grant number: R18XA06-36).

Conflicts of Interest

The authors declare no conflict of interest.

References

  1. Bhatt, M. Mapping of general combined heat and power systems. Energy Convers. Manag. 2001, 42, 115–124. [Google Scholar] [CrossRef]
  2. Maiolo, M.; Pirouz, B.; Bruno, R.; Palermo, S.A.; Arcuri, N.; Piro, P. The Role of the Extensive Green Roofs on Decreasing Building Energy Consumption in the Mediterranean Climate. Sustainability 2020, 12, 359. [Google Scholar] [CrossRef] [Green Version]
  3. Riley, J.; Probert, S. Carbon-dioxide emissions from an integrated small-scale CHP and absorption chiller system. Appl. Energy 1998, 61, 193–207. [Google Scholar] [CrossRef]
  4. Jani, D.B.; Mishra, M.; Sahoo, P.K. A Critical Review on Solid Desiccant-Based Hybrid Cooling Systems. Int. J. Air-Cond. Refrig. 2017, 25, 1730002. [Google Scholar] [CrossRef]
  5. Luo, W.J.; Faridah, D.; Fasya, F.R.; Chen, Y.-S.; Mulki, F.H.; Adilah, U.N. Performance Enhancement of Hybrid Solid Desiccant Cooling Systems by Integrating Solar Water Collectors in Taiwan. Energies 2019, 12, 3470. [Google Scholar] [CrossRef] [Green Version]
  6. Chung, J.D.; Lee, D.-Y. Effect of desiccant isotherm on the performance of desiccant wheel. Int. J. Refrig. 2009, 32, 720–726. [Google Scholar] [CrossRef]
  7. Pirouz, B.; Maiolo, M. The Role of Power Consumption and Type of Air Conditioner in Direct and Indirect Water Consumption. J. Sustain. Dev. Energy Water Environ. Syst. 2018, 6, 665–673. [Google Scholar] [CrossRef] [Green Version]
  8. Hwang, W.-B.; Choi, S.; Lee, D.-Y. In-depth analysis of the performance of hybrid desiccant cooling system incorporated with an electric heat pump. Energy 2017, 118, 324–332. [Google Scholar] [CrossRef]
  9. Ahn, J.; Kim, J.; Kang, B.H. Performance of a Hybrid Desiccant Cooling System in a Residential Environment. Heat Transf. Eng. 2015, 37, 633–639. [Google Scholar] [CrossRef]
  10. Ahn, J.; Kim, J.; Kang, B.H. Thermoeconomic Analysis of Hybrid Desiccant Cooling System Driven by District Heating. Trans. Korean Soc. Mech. Eng. B 2014, 38, 721–729. [Google Scholar] [CrossRef]
  11. Angrisani, G.; Roselli, C.; Sasso, M.; Tariello, F. Assessment of Energy, Environmental and Economic Performance of a Solar Desiccant Cooling System with Different Collector Types. Energies 2014, 7, 6741–6764. [Google Scholar] [CrossRef] [Green Version]
  12. Park, J.-Y.; Yoon, D.-S.; Li, S.; Park, J.; Bang, J.-I.; Sung, M.; Jeong, J.-W. Empirical analysis of indoor air quality enhancement potential in a liquid-desiccant assisted air conditioning system. Build. Environ. 2017, 121, 11–25. [Google Scholar] [CrossRef]
  13. Hoovestol, R.A.; Mikuls, T.R. Environmental Exposures and Rheumatoid Arthritis Risk. Curr. Rheumatol. Rep. 2011, 13, 431–439. [Google Scholar] [CrossRef]
  14. Kwok, A.G.; Chun, C. Thermal comfort in Japanese schools. Sol. Energy 2003, 74, 245–252. [Google Scholar] [CrossRef]
  15. Fanger, P.O. Thermal Comfort, Analysis and Applications in Environmental Engineering; McGraw-Hill Book Company: New York, NY, USA, 1970. [Google Scholar]
  16. International Organization for Standardization. ISO7730:2010. Ergonomics of the Thermal Environment-Analytical Determination and Interpretation of Thermal Comfort Using Calculation of PMV and PPD Indices and Local Thermal Comfort Criteria; ISO: Geneva, Switzerland, 2010. [Google Scholar]
  17. Humphreys, M.A.; Nicol, J.F. The validity of ISO-PMV for predicting comfort votes in every-day thermal environments. Energy Build. 2002, 34, 667–684. [Google Scholar] [CrossRef]
  18. Cho, H.-J.; Jeong, J.-W. Evaluation of thermal comfort in an office building served by a liquid desiccant-assisted evaporative cooling air-conditioning system. Energy Build. 2018, 172, 361–370. [Google Scholar] [CrossRef]
  19. Lin, Z. Effective draft temperature for evaluating the performance of stratum ventilation. Build. Environ. 2011, 46, 1843–1850. [Google Scholar] [CrossRef]
  20. Ng, K.; Kadirgama, K.; Ng, E.Y.K. Response surface models for CFD predictions of air diffusion performance index in a displacement ventilated office. Energy Build. 2008, 40, 774–781. [Google Scholar] [CrossRef]
  21. Liu, W.; Lian, Z.; Yao, Y. Optimization on Indoor Air Diffusion of Floor-Standingtype Room Air-conditioners. Energy Build. 2008, 40, 59–70. [Google Scholar] [CrossRef]
  22. Xin, S.; Xu, H.; Li, S.; Wang, W.; Guo, J.; Yang, W. Efficiency evaluation of a floor standing air conditioner with different installation positions and air supply parameters applied to a large laboratory. J. Build. Eng. 2020, 32, 101701. [Google Scholar] [CrossRef]
  23. Lee, S.; Lee, J.; Kato, S. Influence of vane angle on the effectiveness of air conditioning of wall-mounted split-type air conditioners in residential buildings. Sci. Technol. Built Environ. 2016, 23, 761–775. [Google Scholar] [CrossRef]
  24. Awwad, A.; Mohamed, M.H.; Fatouh, M. Optimal Design of a Louver Face Ceiling Diffuser Using CFD to Improve Occupant’s Thermal Comfort. J. Build. Eng. 2017, 11, 134–157. [Google Scholar] [CrossRef]
  25. Noh, K.-C.; Jang, J.-S.; Oh, M.-D. Thermal comfort and indoor air quality in the lecture room with 4-way cassette air-conditioner and mixing ventilation system. Build. Environ. 2007, 42, 689–698. [Google Scholar] [CrossRef]
  26. Cao, G.; Awbi, H.; Yao, R.; Fan, Y.; Sirén, K.; Kosonen, R.; Zhang, J. (Jensen) A review of the performance of different ventilation and airflow distribution systems in buildings. Build. Environ. 2014, 73, 171–186. [Google Scholar] [CrossRef]
  27. AHRI. AHRI Standard 340/360 (I-P)-2019: Performance Rating of Commercial and Industrial Unitary Air-conditioning and Heat Pump Equipment; AHRI: Arlington, VA, USA, 2019. [Google Scholar]
  28. Corruccini, R.S.; Whitley, L.D.; Kaul, S.S.; Flander, L.B.; Morrow, C.A. Facial height and breadth relative to dietary consistency and oral breathing in two populations (North India and U.S.). Hum. Biol. 1985, 57, 151–161. [Google Scholar]
  29. Shan, X.; Xu, W.; Lee, Y.-K.; Lu, W.-Z. Evaluation of thermal environment by coupling CFD analysis and wireless-sensor measurements of a full-scale room with cooling system. Sustain. Cities Soc. 2019, 45, 395–405. [Google Scholar] [CrossRef]
  30. Zhu, S.; Dalgo, D.; Srebric, J.; Kato, S. Cooling efficiency of a spot-type personalized air-conditioner. Build. Environ. 2017, 121, 35–48. [Google Scholar] [CrossRef]
Figure 1. Hybrid desiccant cooling system: (a) system schematics; (b) thermodynamic process on the psychrometric chart.
Applsci 10 07271 g001
Figure 2. A residential space with a hybrid desiccant air-conditioning system: (a) floor plan; (b) actual photograph of the residential space.
Applsci 10 07271 g002
Figure 3. Indoor and outdoor conditions at the time of thermal environment measurement (13 August 2019): (a) outside air conditions at the time of measurement indicated in the distribution of outside air conditions in July and August 2019; (b) room temperature change over time on the day of measurement; (c) thermal environment of the cooling space displayed in the standard ASHRAE comfort zone.
Applsci 10 07271 g003
Figure 4. A measurement location on the cooling space, the computational domain for CFD and code validation data: (a) thermal environmental measurement points (The blue axis represents the line from which the data for code validation were extracted.); (b) computational domain with grid system; (c) comparison of velocity profile obtained by CFD with measured data in dining room.
Applsci 10 07271 g004
Figure 5. Temperature distribution at a height of 1.1 m from the ground in a residential space with hybrid desiccant cooling: (a) dry bulb temperature; (b) globe (black bulb) temperature.
Applsci 10 07271 g005
Figure 6. Humidity distribution at a height of 1.1 m from the ground in a residential space with hybrid desiccant cooling: (a) relative humidity; (b) humidity ratio.
Applsci 10 07271 g006
Figure 7. Airflow distribution and supply angle: (a) three dimensional streamlines from CFD for normal supply (0°); (b) cooling air supply angle.
Applsci 10 07271 g007
Figure 8. Distribution of thermal comfort in residential spaces with hybrid desiccant cooling: (a) PMV; (b) EDT.
Applsci 10 07271 g008
Figure 9. Airflow distribution when the cooling air supply angle is increased by 45°: (a) 3D streamlines; (b) comparison of velocity distribution at a height of 1.1 m above ground.
Applsci 10 07271 g009
Figure 10. Changes in discomfort areas evaluated by EDT (EDT < −1.7 or EDT > 1) according to the change in the cooling air supply angle: (a) normal supply; (b) 45° upward supply.
Applsci 10 07271 g010
Figure 11. Comparison of thermal comfort between the vertically supplied cooling air and that supplied 45° upward: (a) PMV; (b) ADPI.
Applsci 10 07271 g011
Figure 12. Changes in thermal comfort according to cooling air supply angle: (a) PMV; (b) ADPI.
Applsci 10 07271 g012
Publisher’s Note: MDPI stays neutral with regard to jurisdictional claims in published maps and institutional affiliations.

