3.1. Definition of Maximum FSR Function of CA50
In this section, the main results in terms of maximum FSR reached for each of the CA50 in the considered interval and for the two test points considered were discussed.
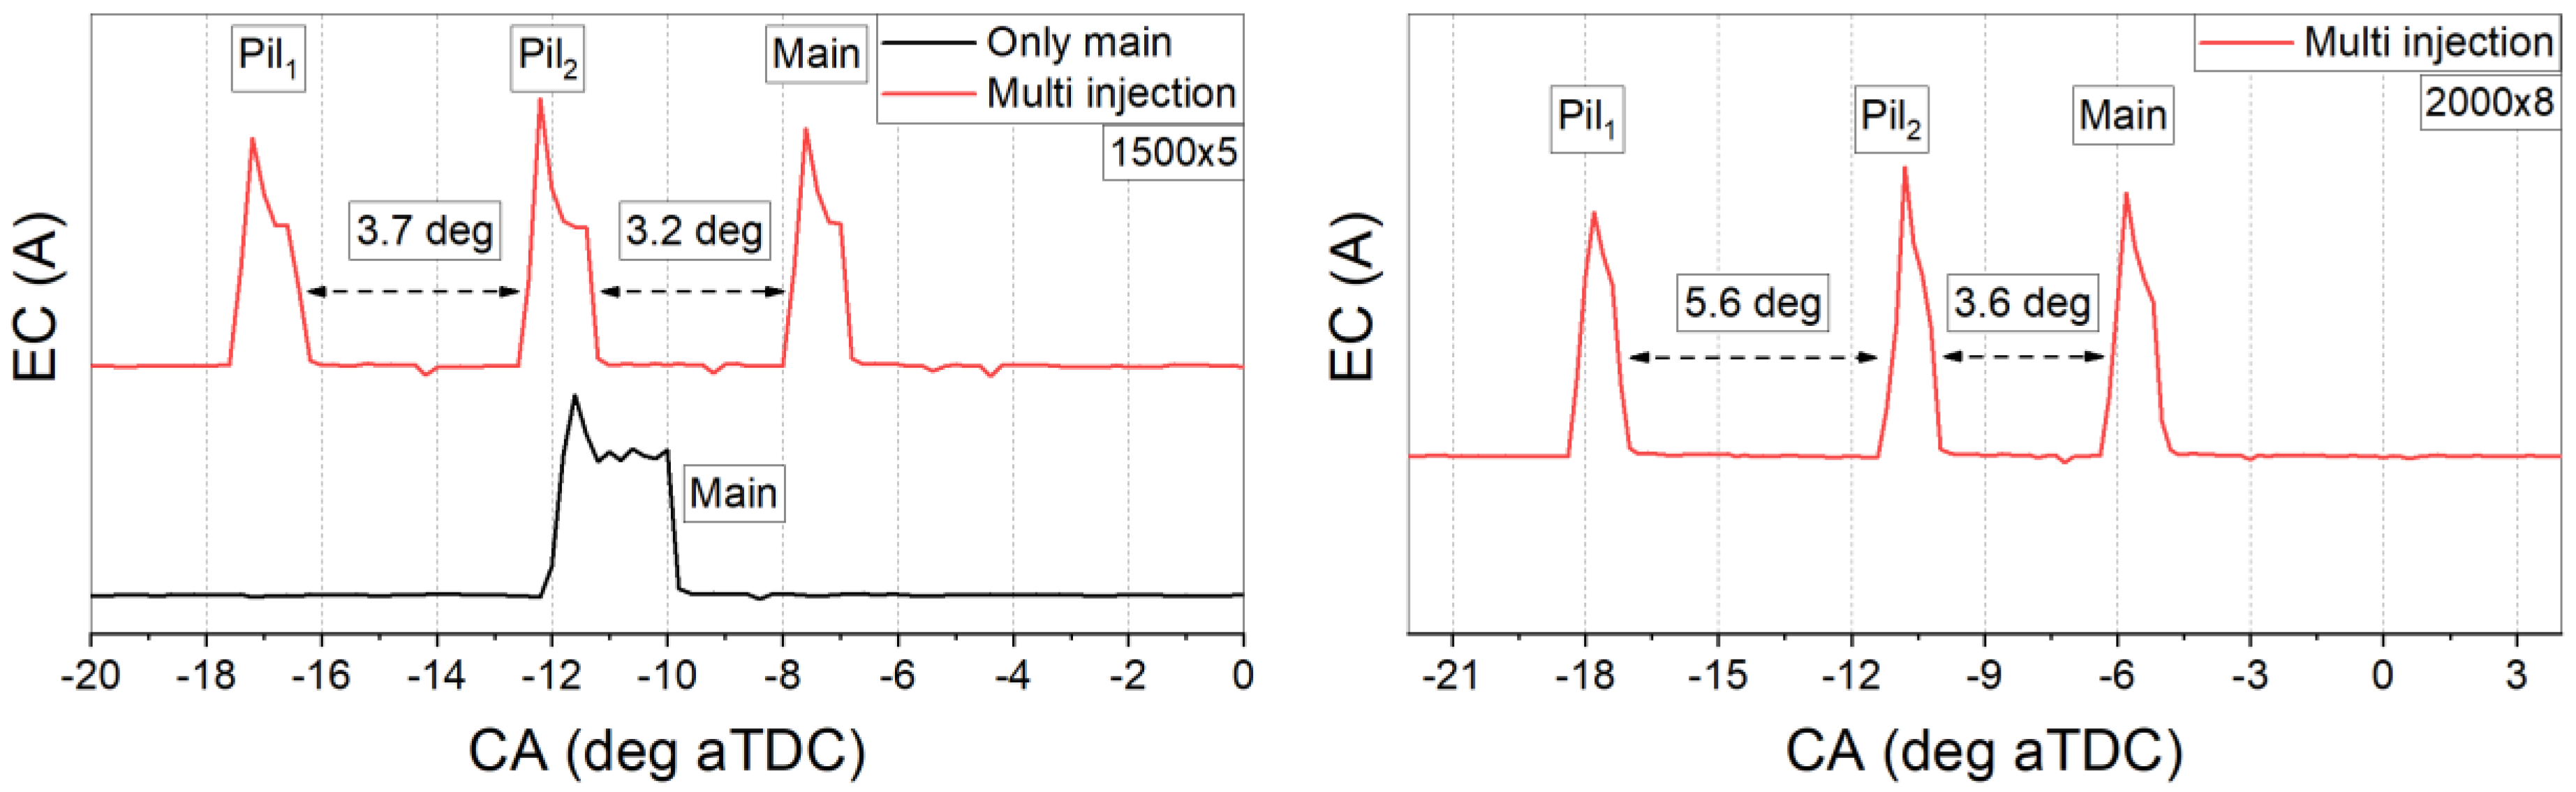
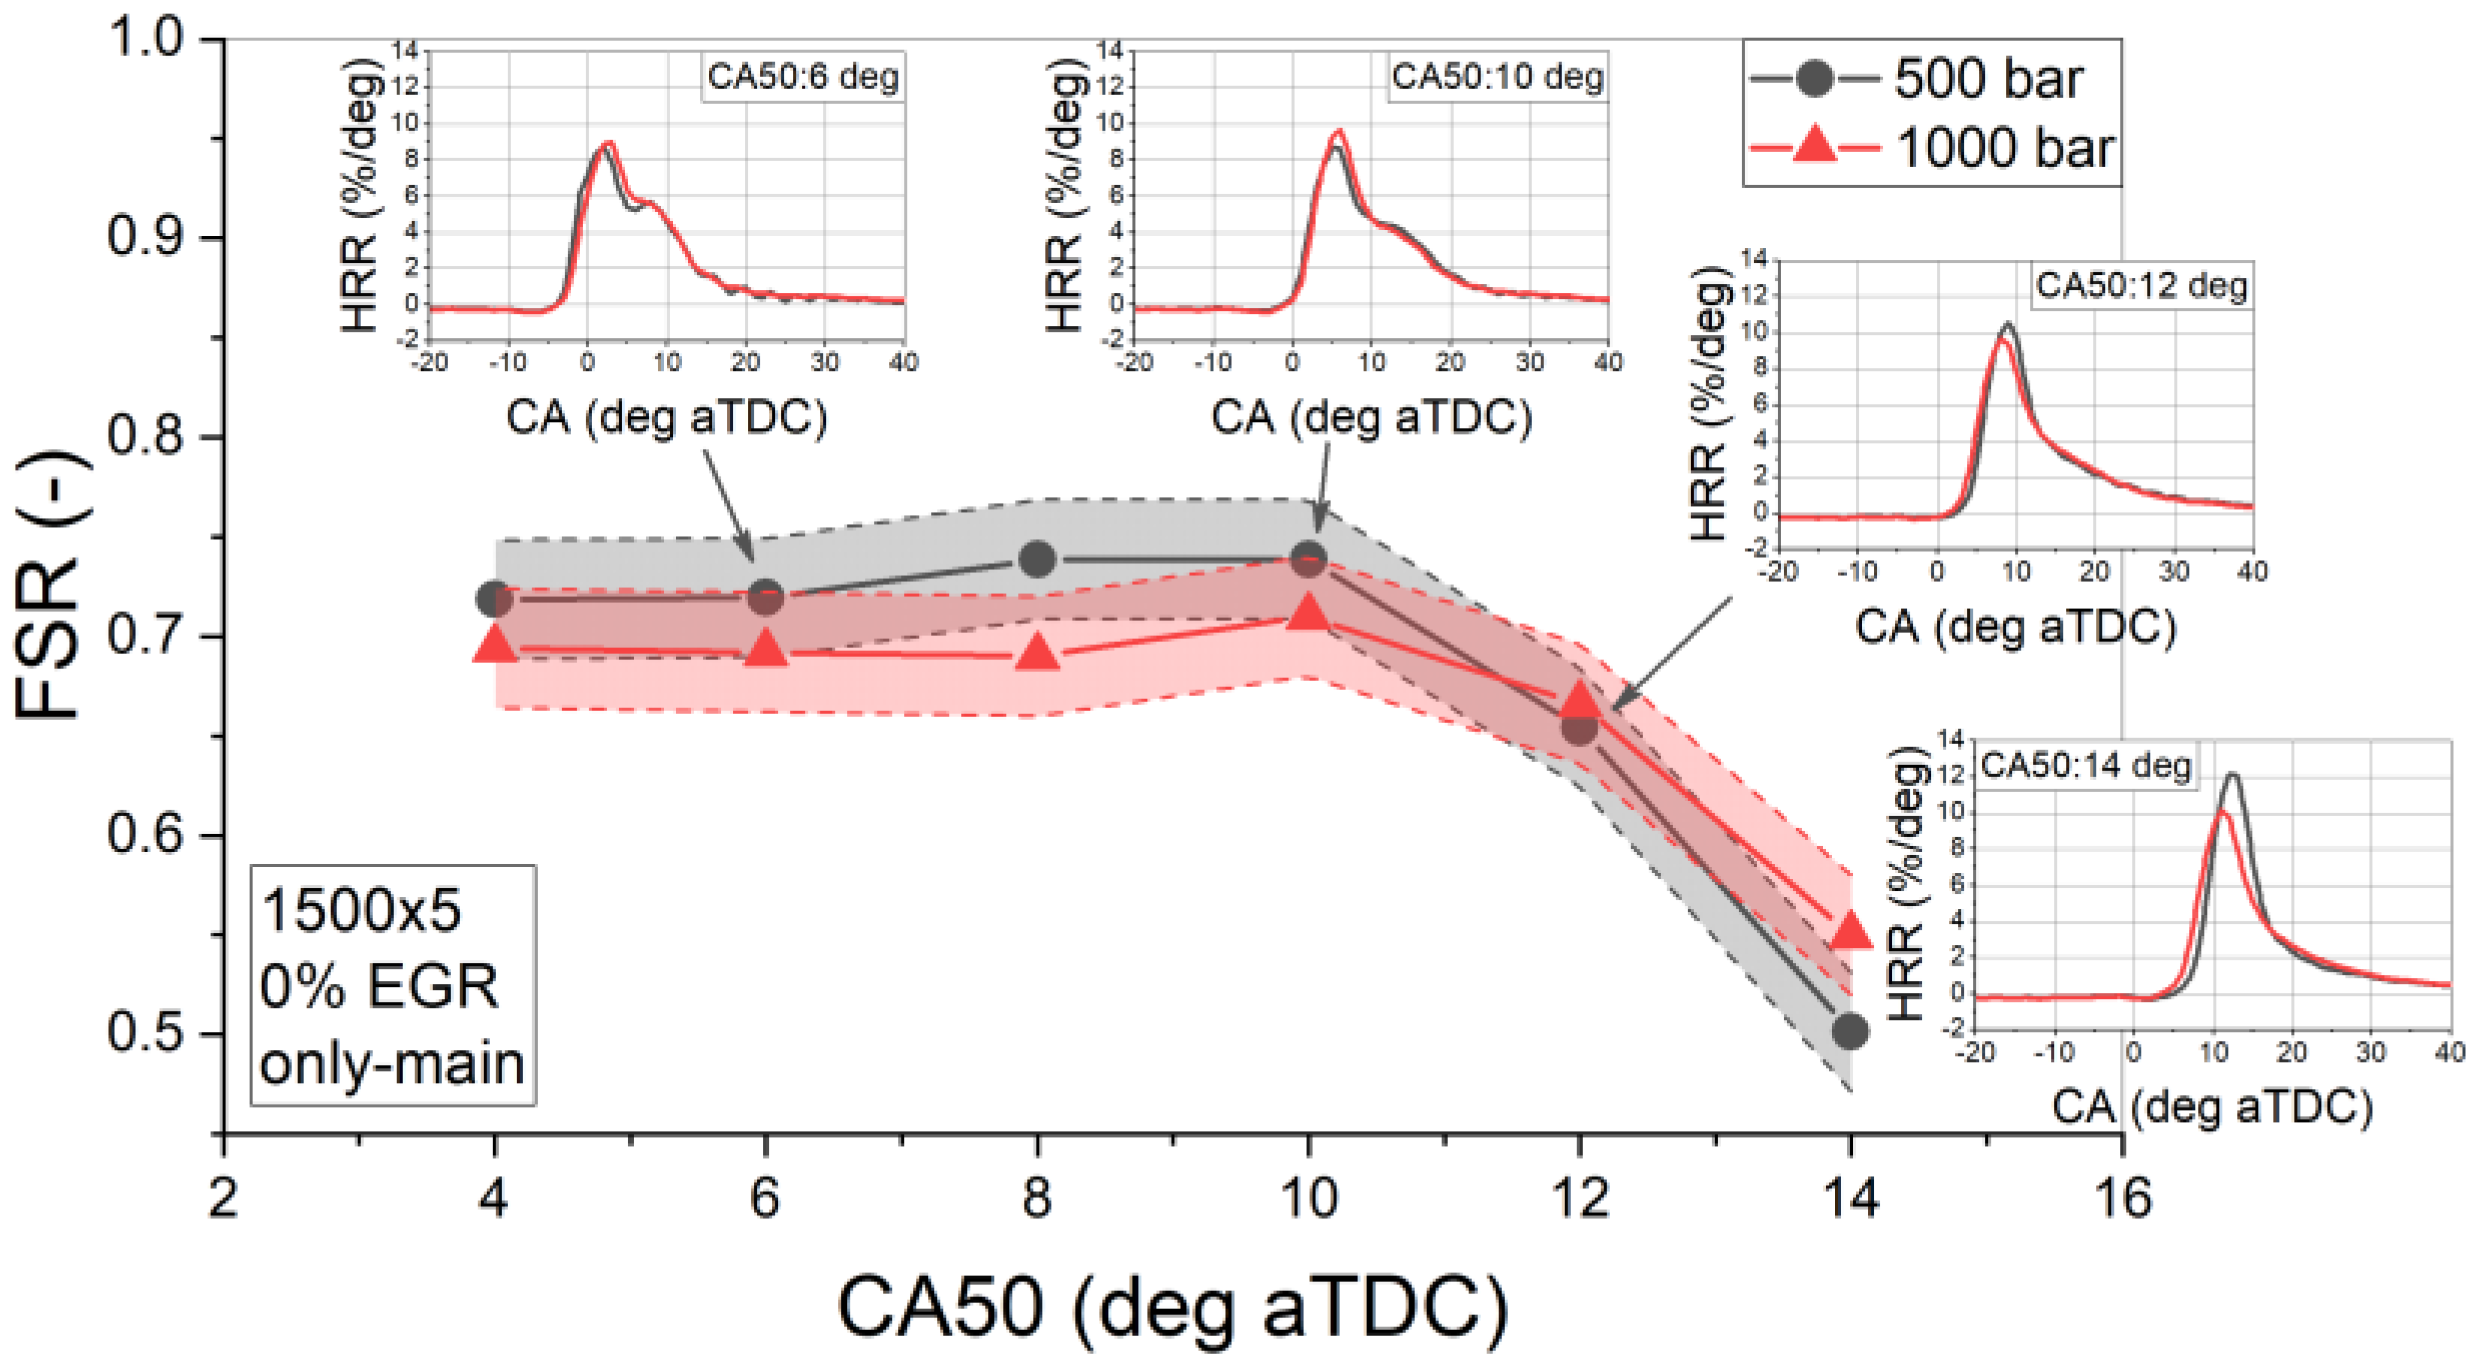
Figure 3 shows the FSR function of the CA50 for the steady state test point at 1500 rpm and 5 bar BMEP. The evaluation was conducted for various levels of combustion phasing, from 4 to 14 deg aTDC, as shown in
Table 3, with no EGR, only the main injection strategy and a diesel injection pressure of 500 bar. SOI
Ethanol was fixed at 360 deg bTDC
firing and an injection pressure of 5 bar. To some extent this setting helped to distinguish the single effect of the CA50 variation on FSR in the DF mode keeping constant the other parameters.
Higher values of FSR were achieved for more advanced CA50. FSR shows a flat trend (70–74%) in the range of 4–10 deg aTDC. For a higher CA50, 10–12 deg aTDC, the ethanol fraction was reduced to observe the imposed combustion noise and COV
IMEP limits. It was necessary to reduce the FSR to keep the pressure rise rate (PRR) constant, as shown in
Figure 3.
To better characterize and understand the constraints in terms of the FSR increment, the combustion process evolutions of significant operating points, heat release rate (HRR) trends with related injection phases, are also depicted in
Figure 3. At 4 deg of CA50, the combustion process showed both a premixed and diffusive combustion phases. With a diesel injection near TDC, the consequently retarded combustion phasing led to faster and prominent premixed combustion phase with a less pronounced diffusive phase as HRR profiles show. A retarded combustion phasing also led to a better air-fuel homogenization, which burns rapidly in the premixed combustion phase and consequently a shorter end of combustion phase was established. Moving to more retarded combustion phasing, the HRR pattern observed is typical of an RCCI (Reactivity Controlled Compression Ignition) combustion process [
6]. With ethanol injection, the diesel fuel burned in the diffusion mode is now combusting in a mixture of ethanol/air, which burns in the premixed mode [
26]. Longer combustion duration was observed, as remarked in
Table 5.
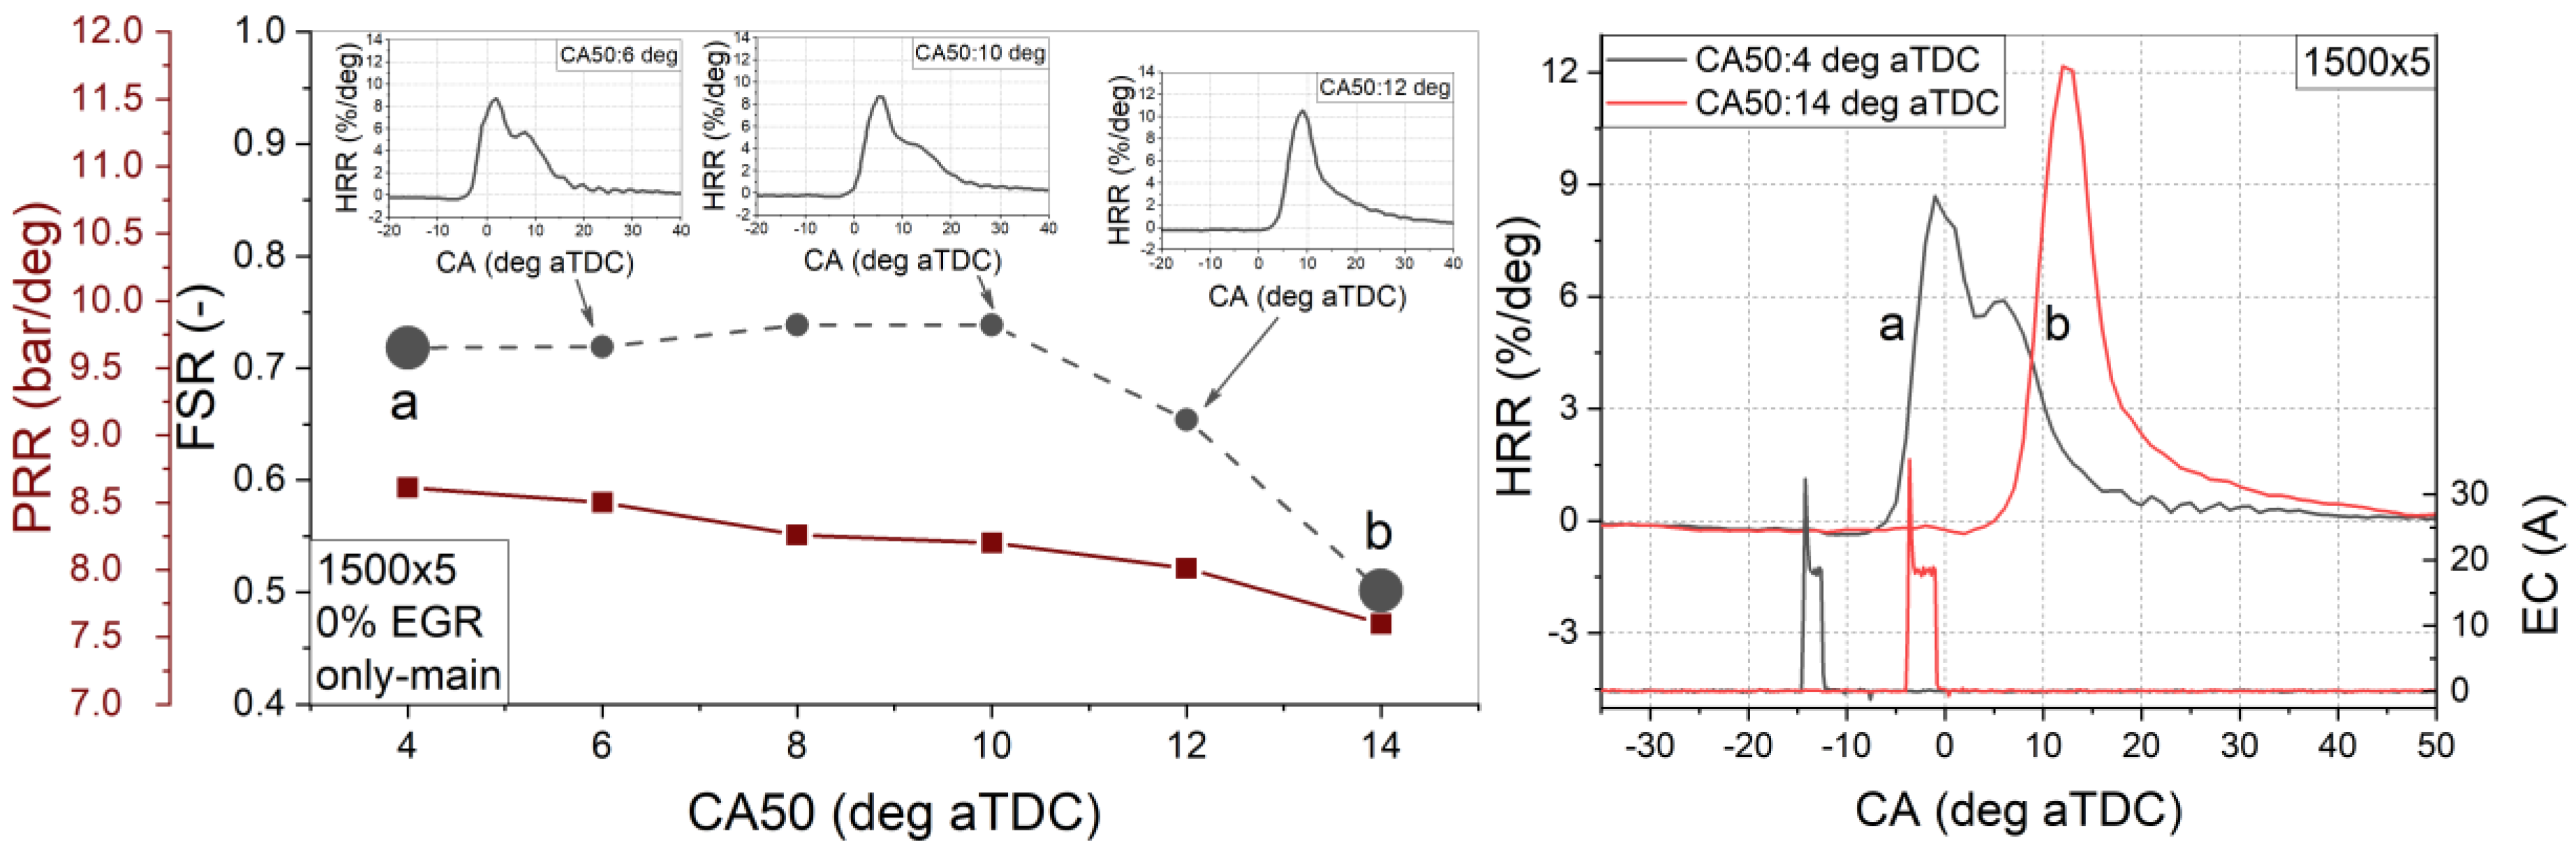
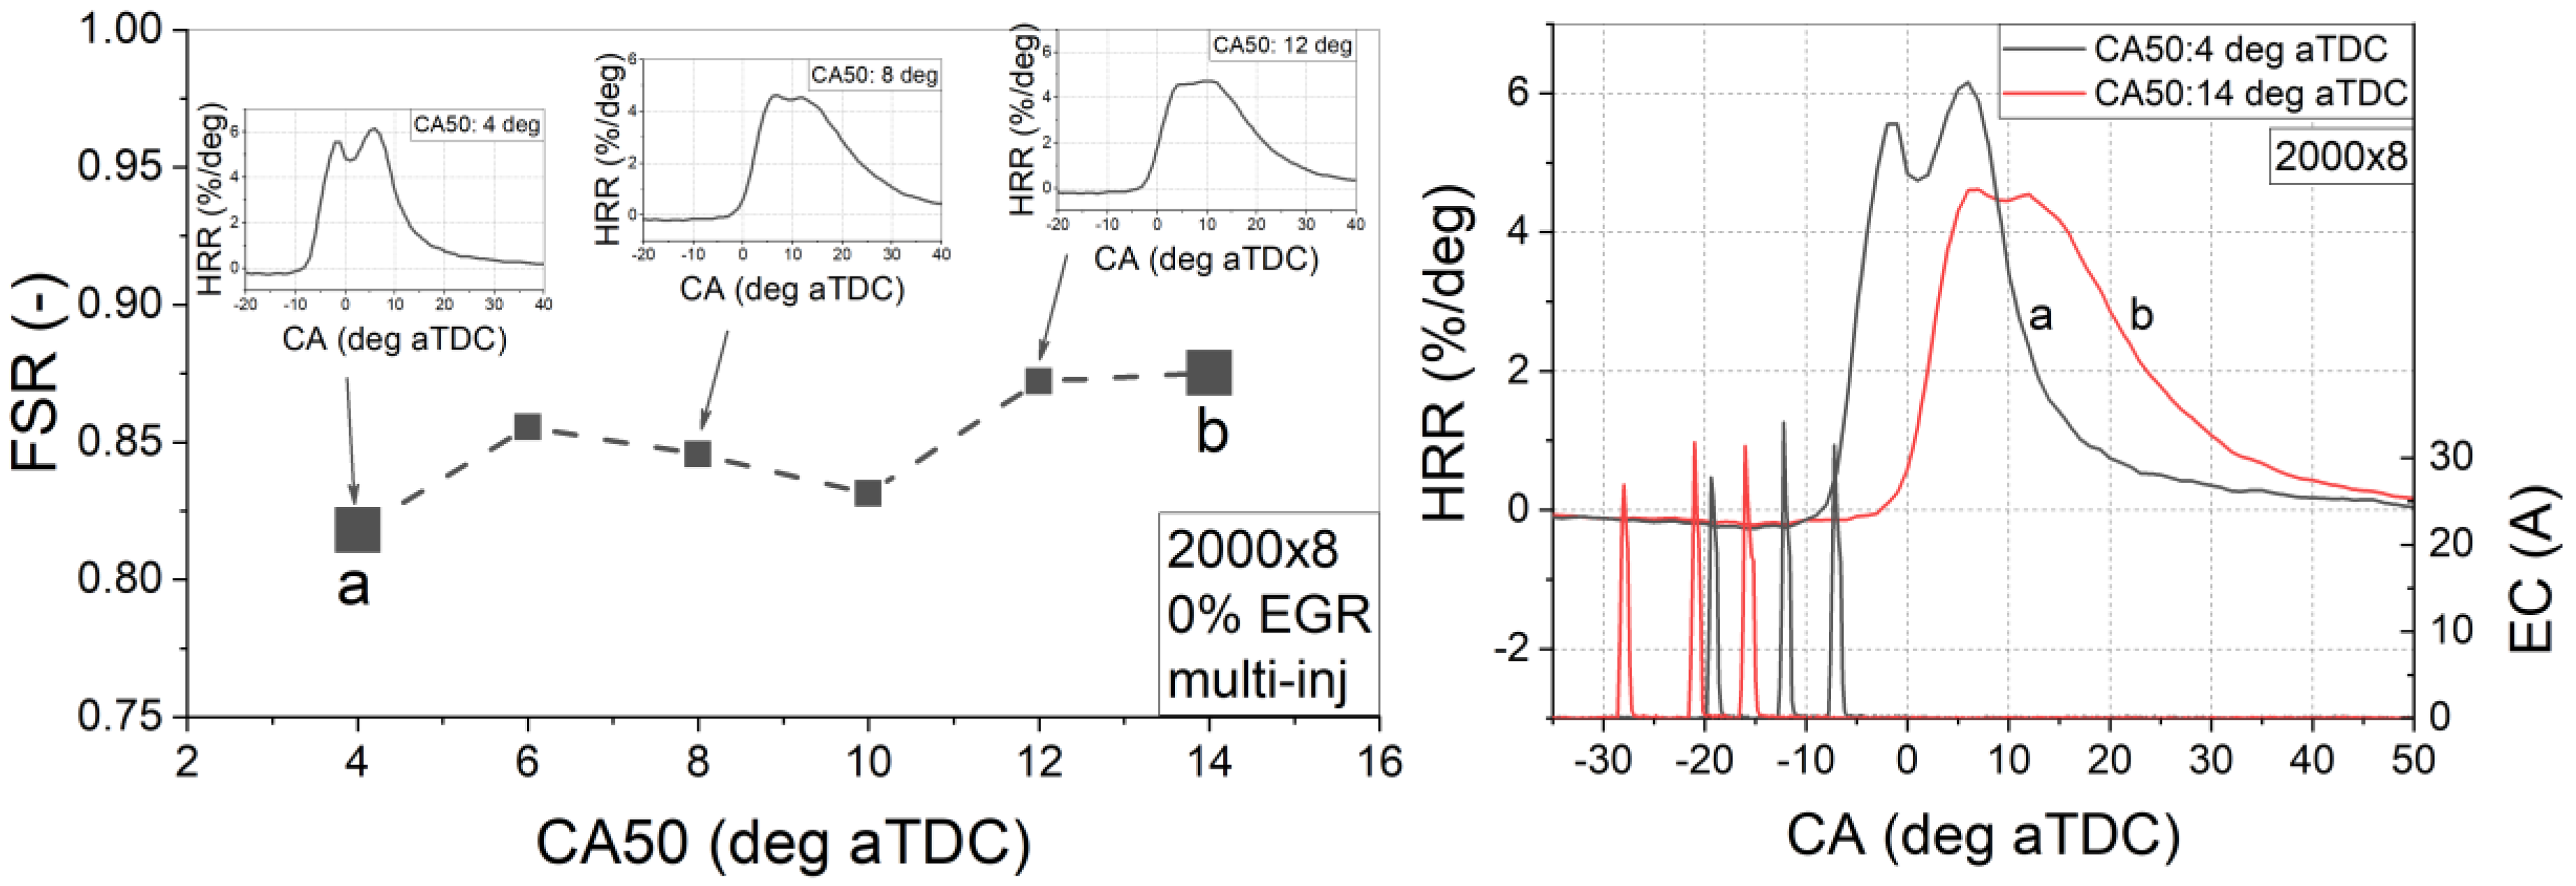
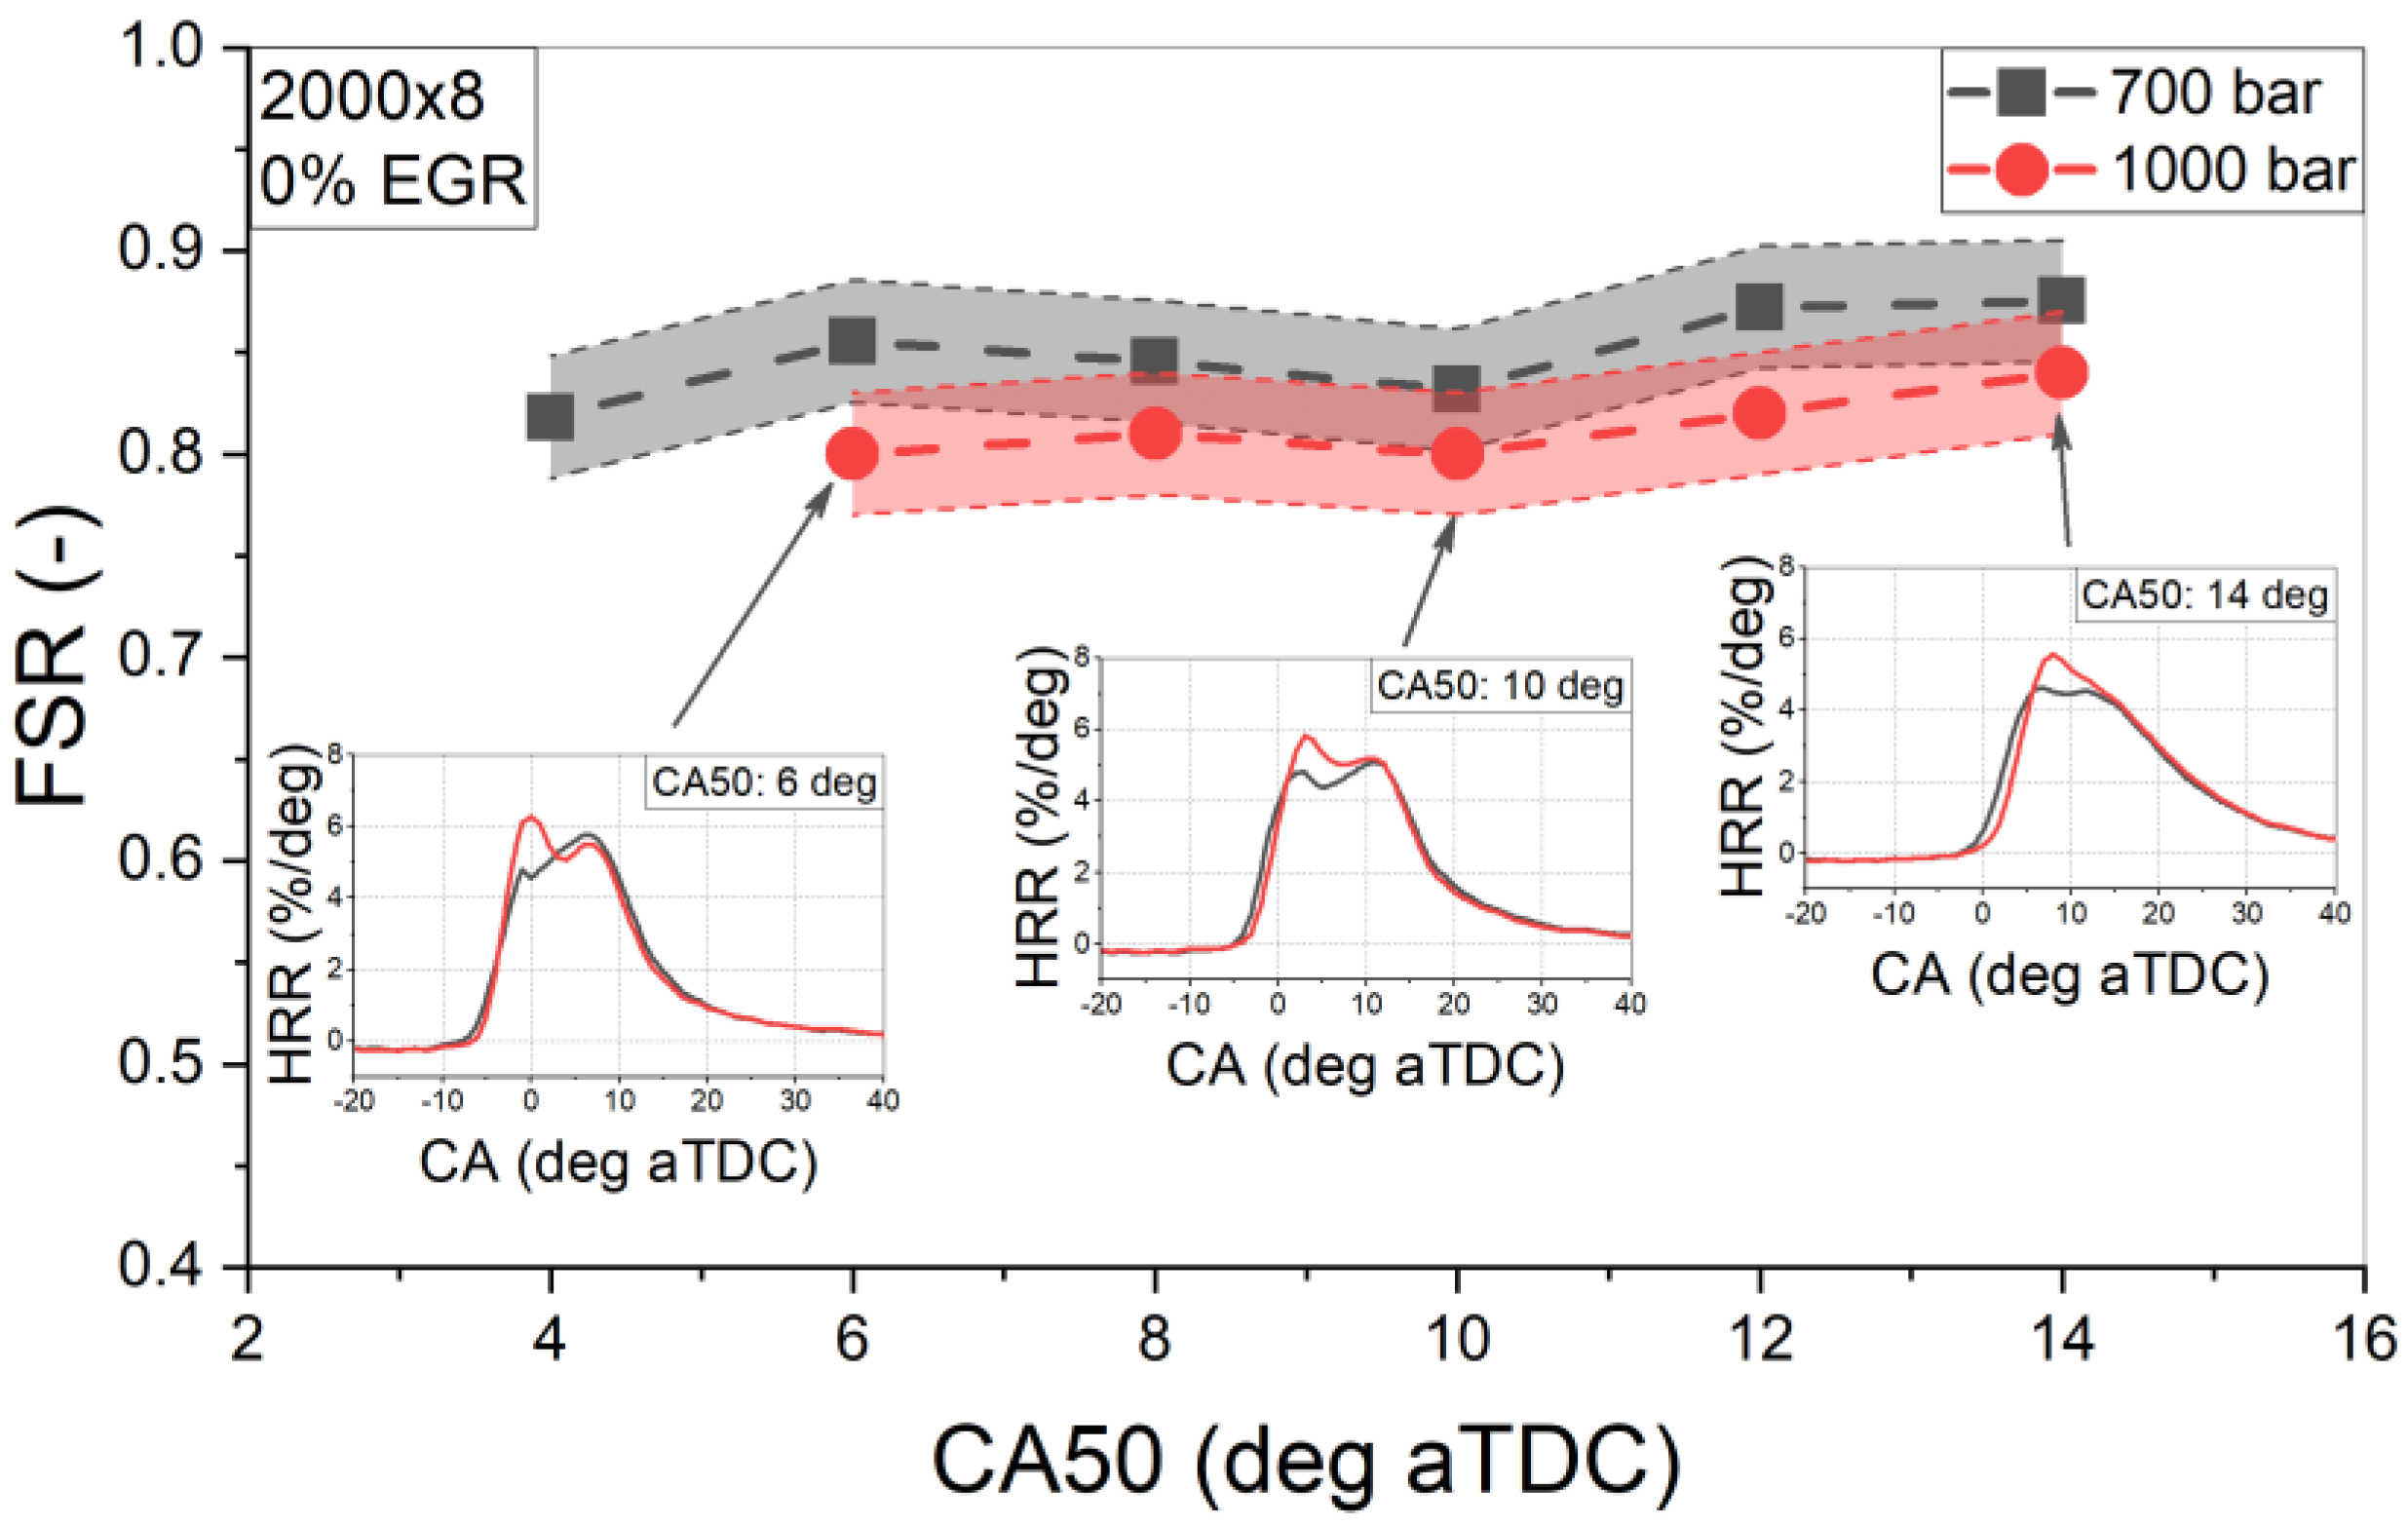
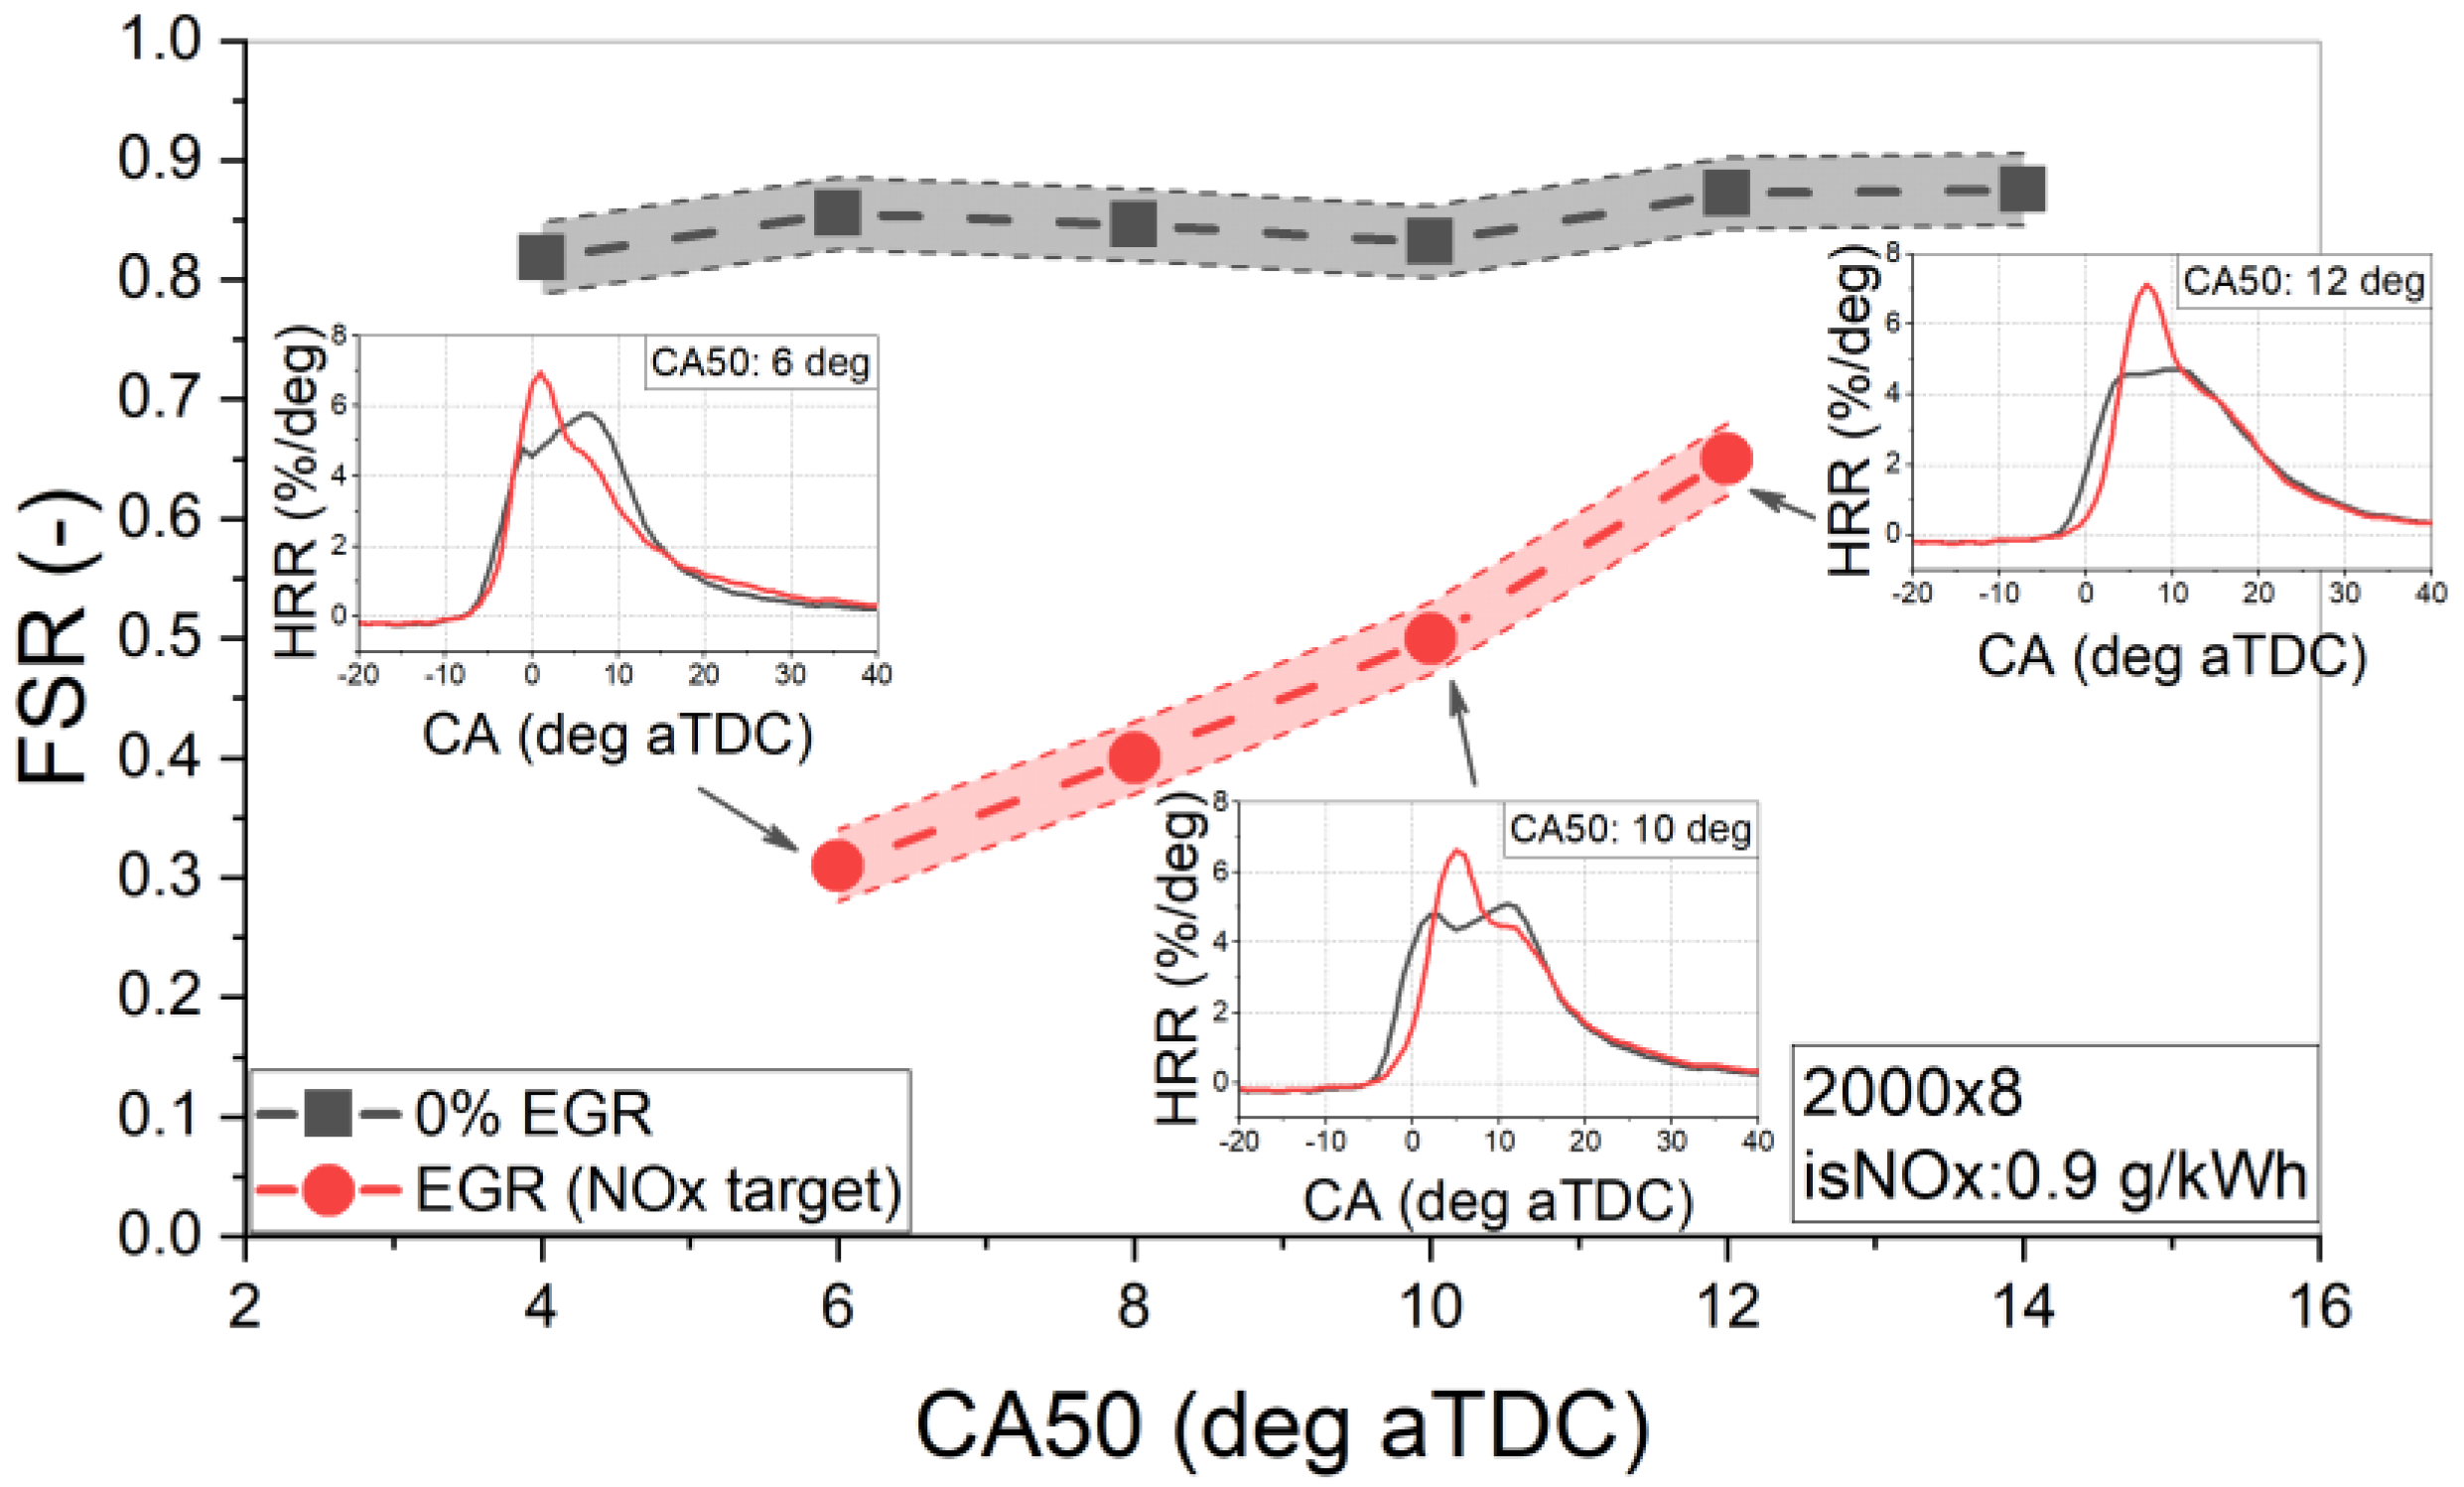
Figure 4 shows the FSR trend as a function of CA50 at 2000 × 8. The evaluation was conducted for the same CA50 range, ethanol injection pressure and SOI
Ethanol introduced in the previous case (
Table 3), with no EGR and a diesel injection pressure of 700 bar. In contrast to the lower load point 1500 × 5, this test point employed a multi injection pattern to ensure acceptable combustion stability. The comparative results among combustion phasing show FSR values ranging in the interval 80–85%, higher compared to the previous case, and its trend can be considered as constant. Further increments were not possible due to ringing and noise limitations. Furthermore, due to a lower fraction of diesel injected longer combustion duration was observed as remarked in
Table 5.
Figure 4 compares the HRR profiles at 4 and 14 deg of CA50. As seen, for more advanced combustion phasing (4 deg) the HRR profile shows two characteristic peaks, the first one was related to the burning of the pilot diesel fuel and the second to the burning of the ethanol as the main energy carrier. HRR profiles lose the two peaks previously observed retarding combustion phase and increasing the ethanol fraction. The progressive loss of the first diesel peak was due to the high heat of vaporization of alcohol injected; hence its cooling effect became more significant on the combustion rate [
27]. The HRR profile comparison indicates a transition to a premixed, homogeneous ethanol-dominated combustion [
22]. Related to the previous point, the cooling effect of ethanol lowered the HRR peak.
3.2. Effects of Diesel Fuel Injection Pressure on FSR in the DF Mode
This section shows the experimental results on the influence of diesel injection pressure on the maximum FSR. To discriminate this effect on the FSR, an injection pressure of 1000 bar was considered, and all the other parameters were kept constant. It is worth highlighting that a different injection strategy was used in the two operating points considered. Furthermore, the maximum FSR assessed in the previous section was used as a reference.
As seen in
Figure 5, in 1500 × 5 test point despite a higher injection pressure, the FSR trend was similar to the reference one over the CA50 range considered. In terms of the combustion process, as HRR profiles show, the higher diesel injection pressure seemed not to produce relevant changes. Important differences can be noticed for 14 deg aTDC, where a lower peak in the HRR trend was observed due to a slight increase in the ethanol fraction. It is also noticed that the change in slope related to higher injection pressure HRR profiles occurred earlier compared to the reference profiles because an increase in injection pressure allows better atomization of diesel injected leading to a better air-fuel mixing [
28], the autoignition and the combustion occur earlier due to a shorter ignition delay (ID) [
26]. HRR traces also show a long diffusive phase that overtakes the reference traces within CA50 range.
Figure 6 shows the effects of the fuel injection pressure in 2000 × 8 test point. With higher diesel injection, the reference trend was replicated, except for 4 deg aTDC due to exceeding the noise and COV
IMEP limits. In this case, HRR profiles show more pronounced peaks, with an increase of about 2%/deg, because the rise of diesel injection pressure allowed better mixing of the charge and improved the first phase of the premixed combustion. It is also noticed that the diffusive phase of higher injection HRR profiles overlapped the reference ones.
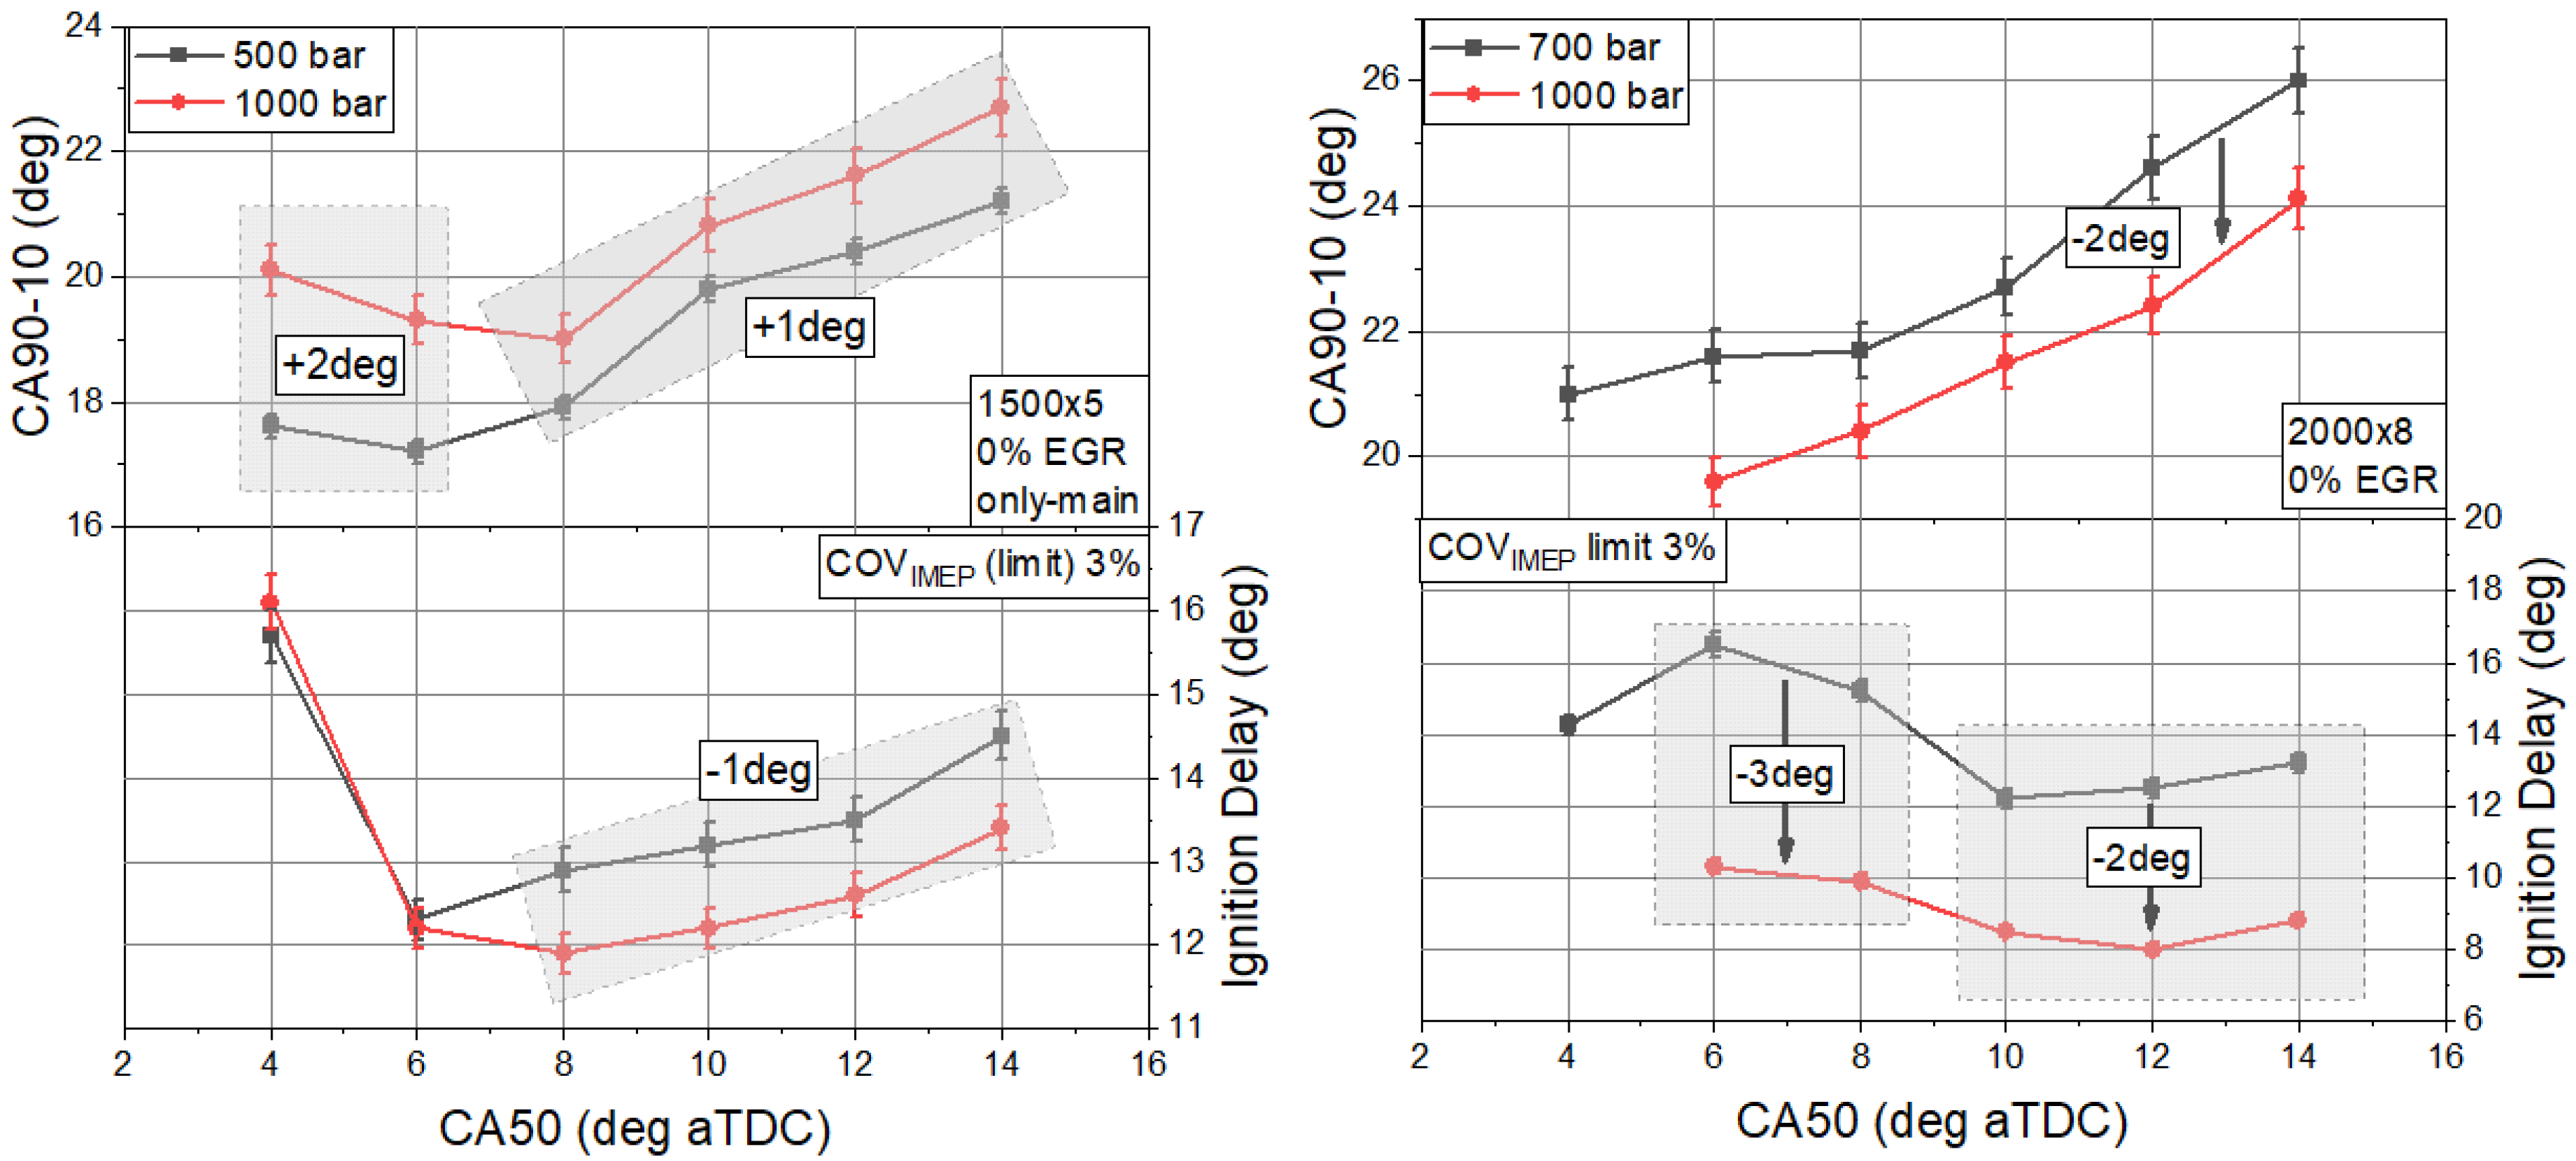
Figure 7 depicts the influence of injection pressure on combustion indicators for both test points in terms of CA10-90, ID. As seen, in 1500 × 5, the combustion duration rose due to the prolonged diffusive phase, as shown by the HRR profiles of
Figure 5. It is reasonable because after the premixed phase, the remaining charge burned in the diffusion phase in a mixture of ethanol/air, which leads to a slower and prolonged combustion phase [
29]. As already stated, with increasing injection pressure, the ignition delay decreased due to smaller particles of atomized fuel, which enhanced the mixing diesel and premixed mixture of ethanol-air hence ID shortened. On average, a shorter ID of about 1 deg CAD could be noticed. For higher loads (2000 × 8) a shorter combustion duration was observed, on average 2 deg less of the reference case. With the increase of the injection pressure and consequently a shorter ID, the greater fuel amount accumulated in the ID period leads to an increase in the premixed heat release [
26], as the higher HRR peaks show in
Figure 6. It is reasonable to assume more rapid combustion of the fuel mixture in the first part of the premixed combustion phase, consequently, shorter combustion duration was observed. Related to this point, retarding combustion phasing led to a rise of combustion duration from a minimum of 20 CAD to a maximum of 24 CAD.
Figure 8 shows the rail pressure effect on PM, for both test points in the DF mode. The consistent reduction that can be observed between the trends comparison at 2000 × 8 was mainly due to two reasons. First, as shown in
Figure 6, a longer premixed phase allowed better PM oxidation. The locally available oxygen content was a key parameter to allow the PM oxidation during combustion process as also reported by Wagner et al. [
30]. The use of oxygenated biofuels [
31], like ethanol, combined with the high level of FSR achieved (
Figure 6) led to less fuel-rich zones hence to a limited PM formation [
32]. The prolonged diffusive phase, observed for 1500 × 5 (
Figure 5), and longer combustion duration (
Figure 7), led to a worsening of the engine-out PM. As can be seen, its trend rose linearly from a minimum value of 0.15 g/kWh to a maximum of about 0.33 g/kWh. As shown in
Figure 5 for lower values of FSR, higher values of PM were reached in the range 12–14 deg of CA50.
This section shows that the combined effect of higher injection pressure and a more complex injection pattern (related to 2000 × 8) led to an improvement in terms of indicated PM emissions. For these reasons, in the following section, the evaluation with a multi injection strategy was also conducted for 1500 × 5 test point.
3.3. Effects of Injection Pattern on FSR in the DF Mode
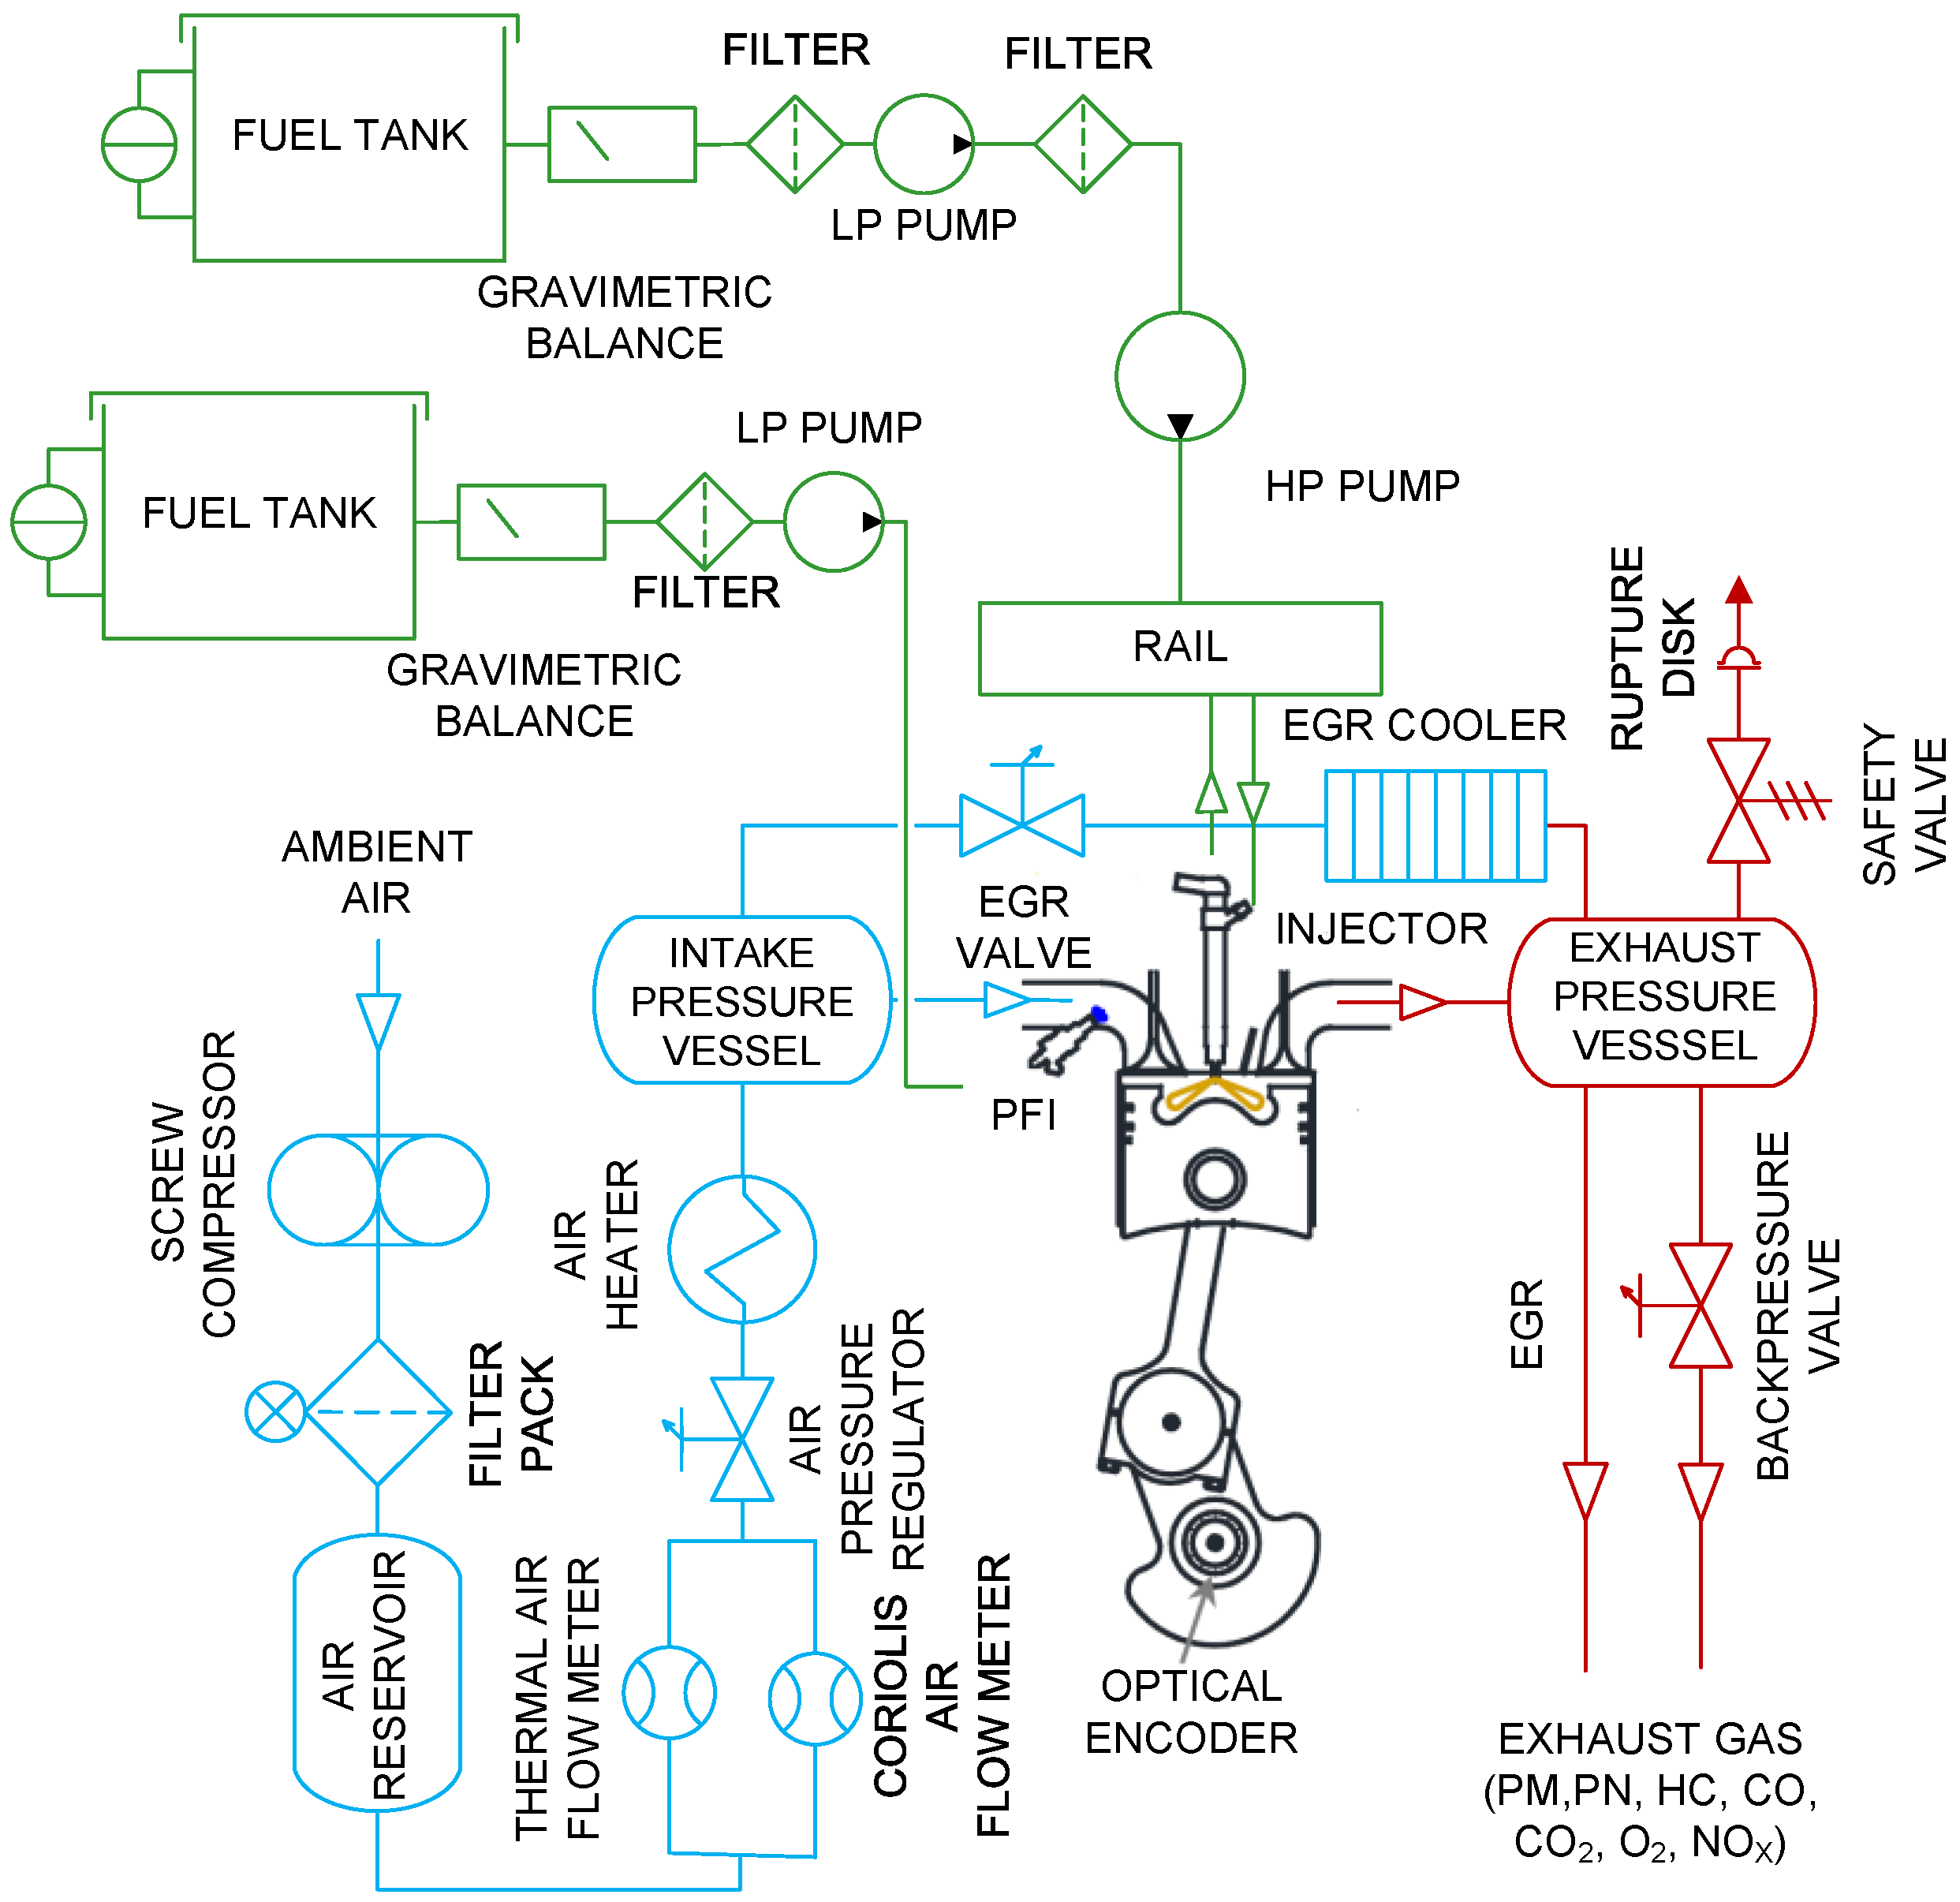
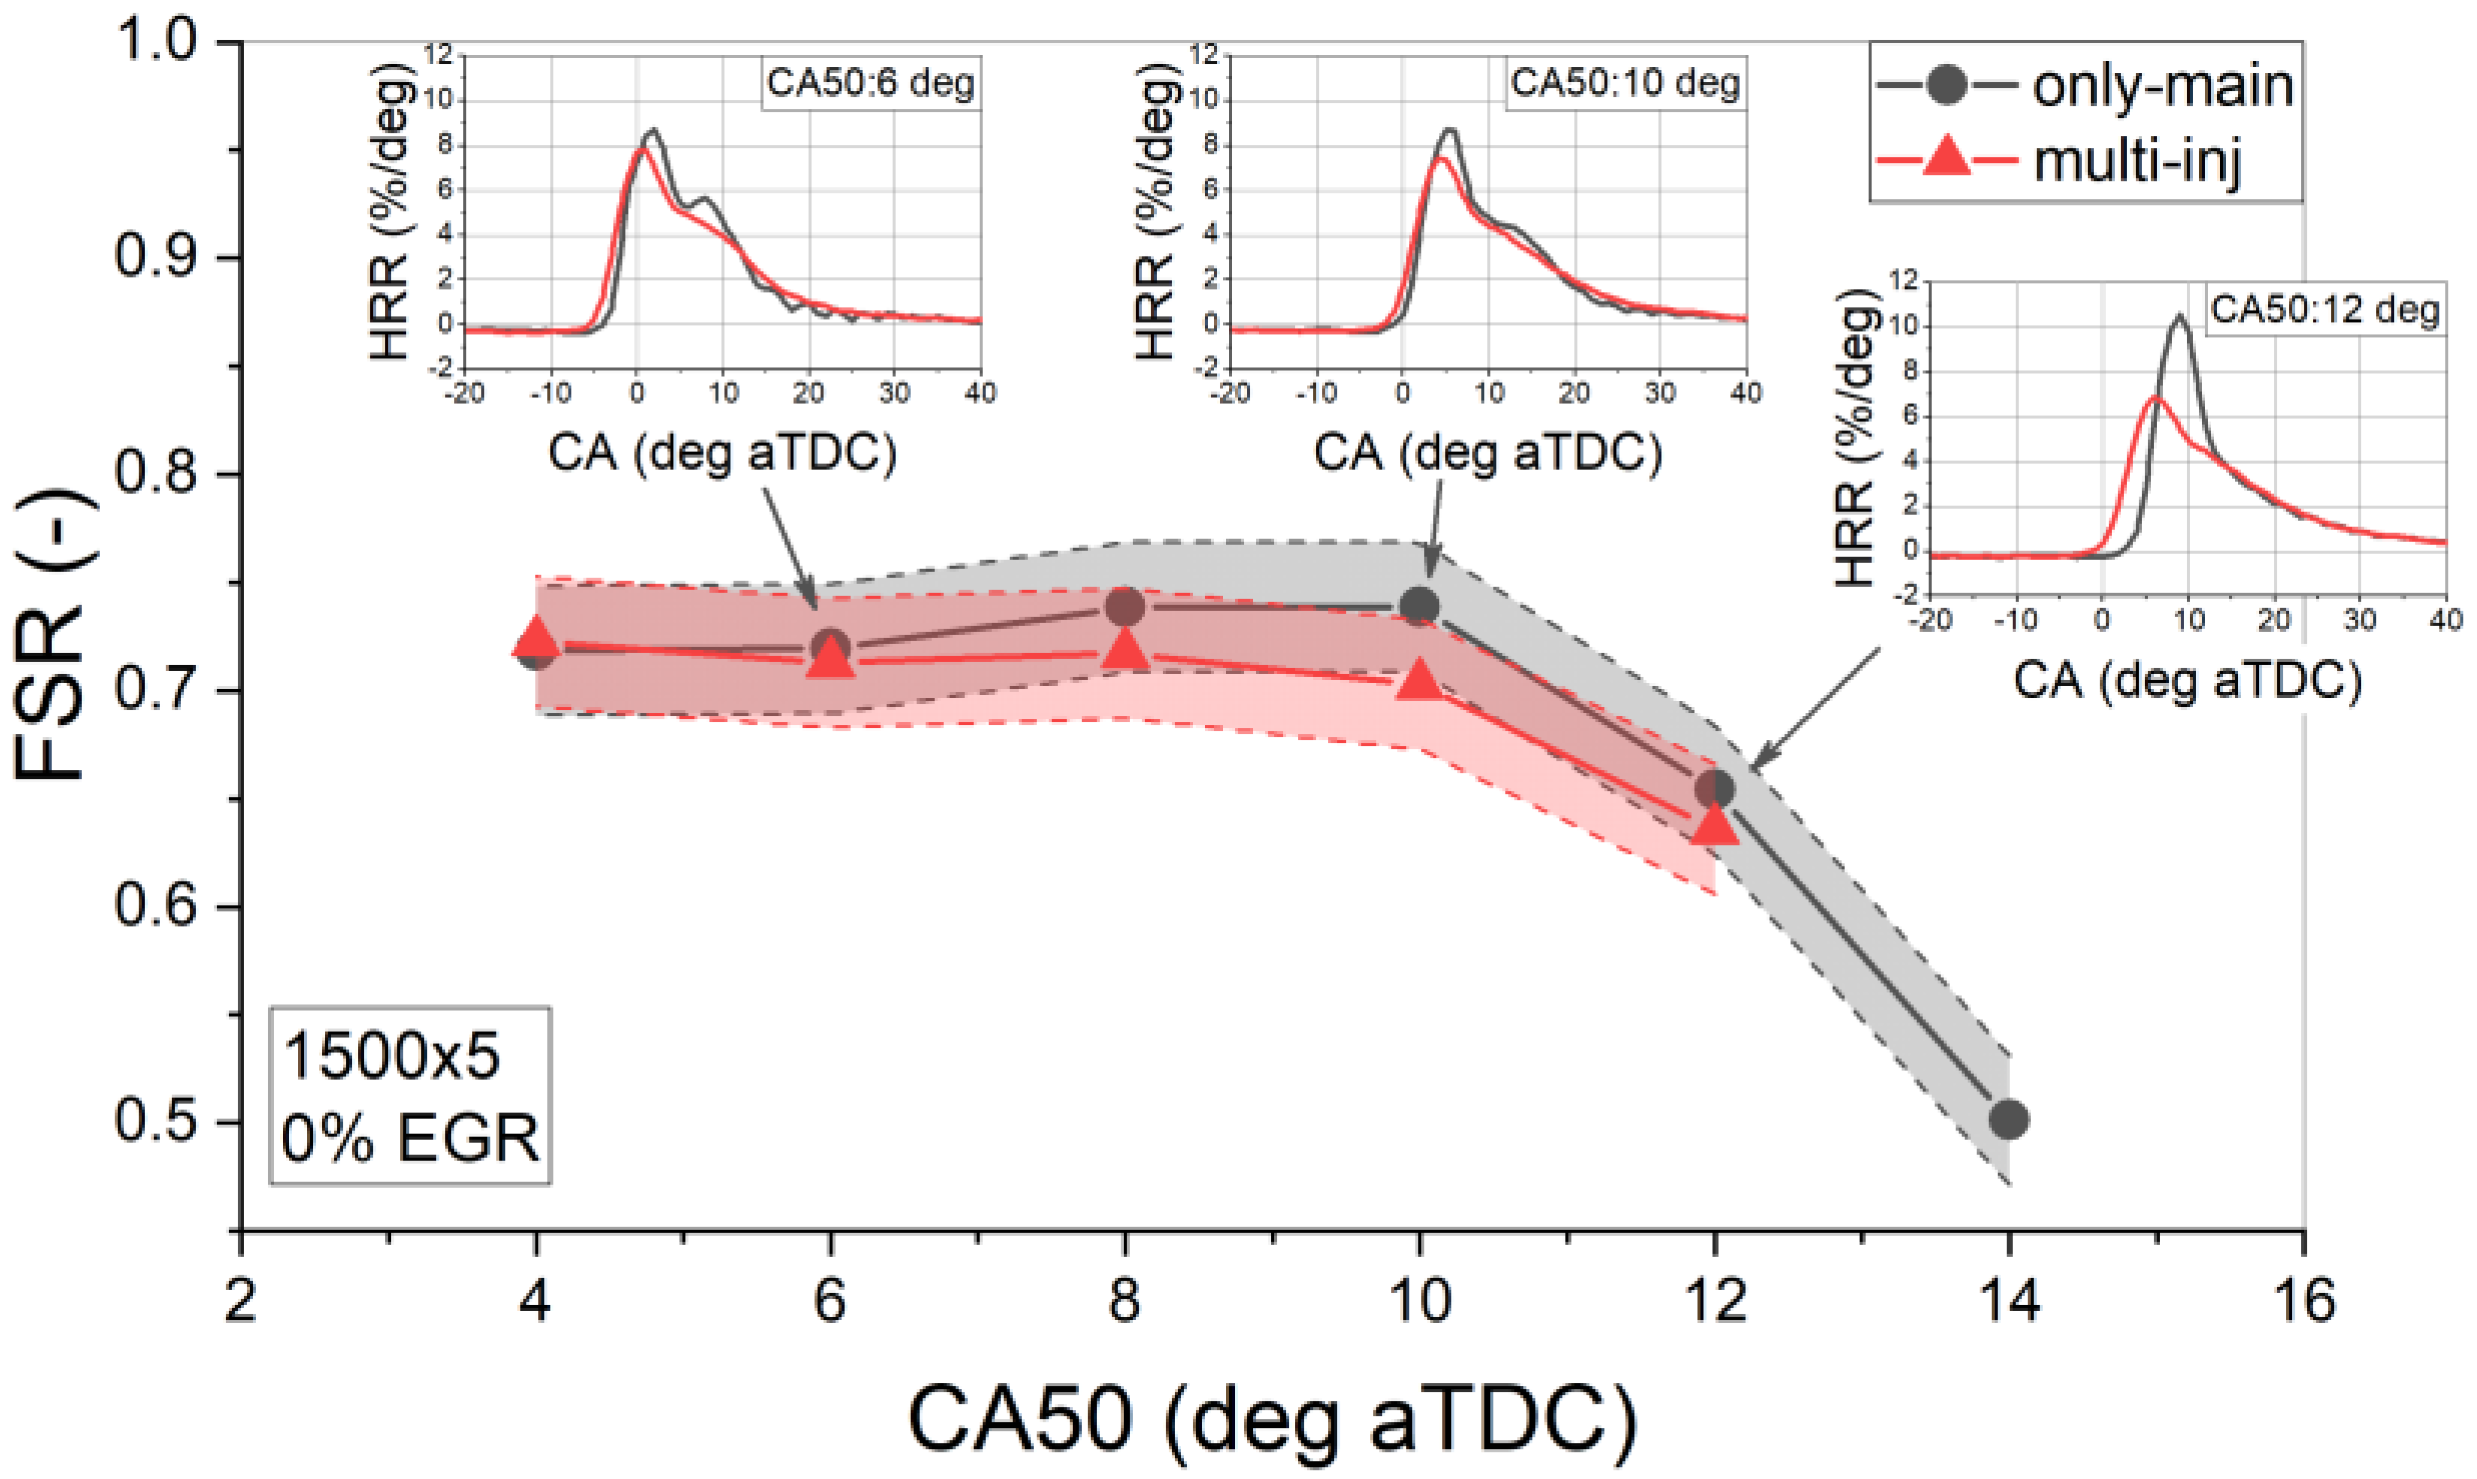
The effects of a multi-injection strategy, characterized by two pilot plus main injection pattern, as reported in
Figure 2, in comparison with the reference one (only main) were evaluated. The investigation was conducted in the range 4–14 of CA50, at constant rail pressure (500 bar), SOI
ethanol, FSR and with no EGR to discriminate the injection pattern effect only. This analysis aimed to replicate the FSR values obtained with the only main and evaluate the effects on parameters.
Figure 9 shows the influence of the injection pattern of FSR varying CA50. The use of a multi-injection pattern led to reach the FSR limit imposed in the range 4–12 of CA50, while at 14 deg, the test point was not performed because misfire occurred. For more retarded combustion phasing, the mixture was below the lower flammability limit due to a too low in-cylinder temperature and an excess of air in the cylinder [
19].
The use of a single pulse strategy, as observed in
Figure 9, led to an increase in the ignition delay, which allowed better air-fuels mixing with a more significant premixed phase [
33]. These aspects justify a completely different HRR, in particular by delaying the combustion phasing [
34]. The multi-injection strategy, as shown in
Figure 9, guaranteed a reduction of the premixed phase, favoring the diffusive one, also assuring a significant decrease of the maximum rate of pressure rise and therefore of the combustion noise [
35].
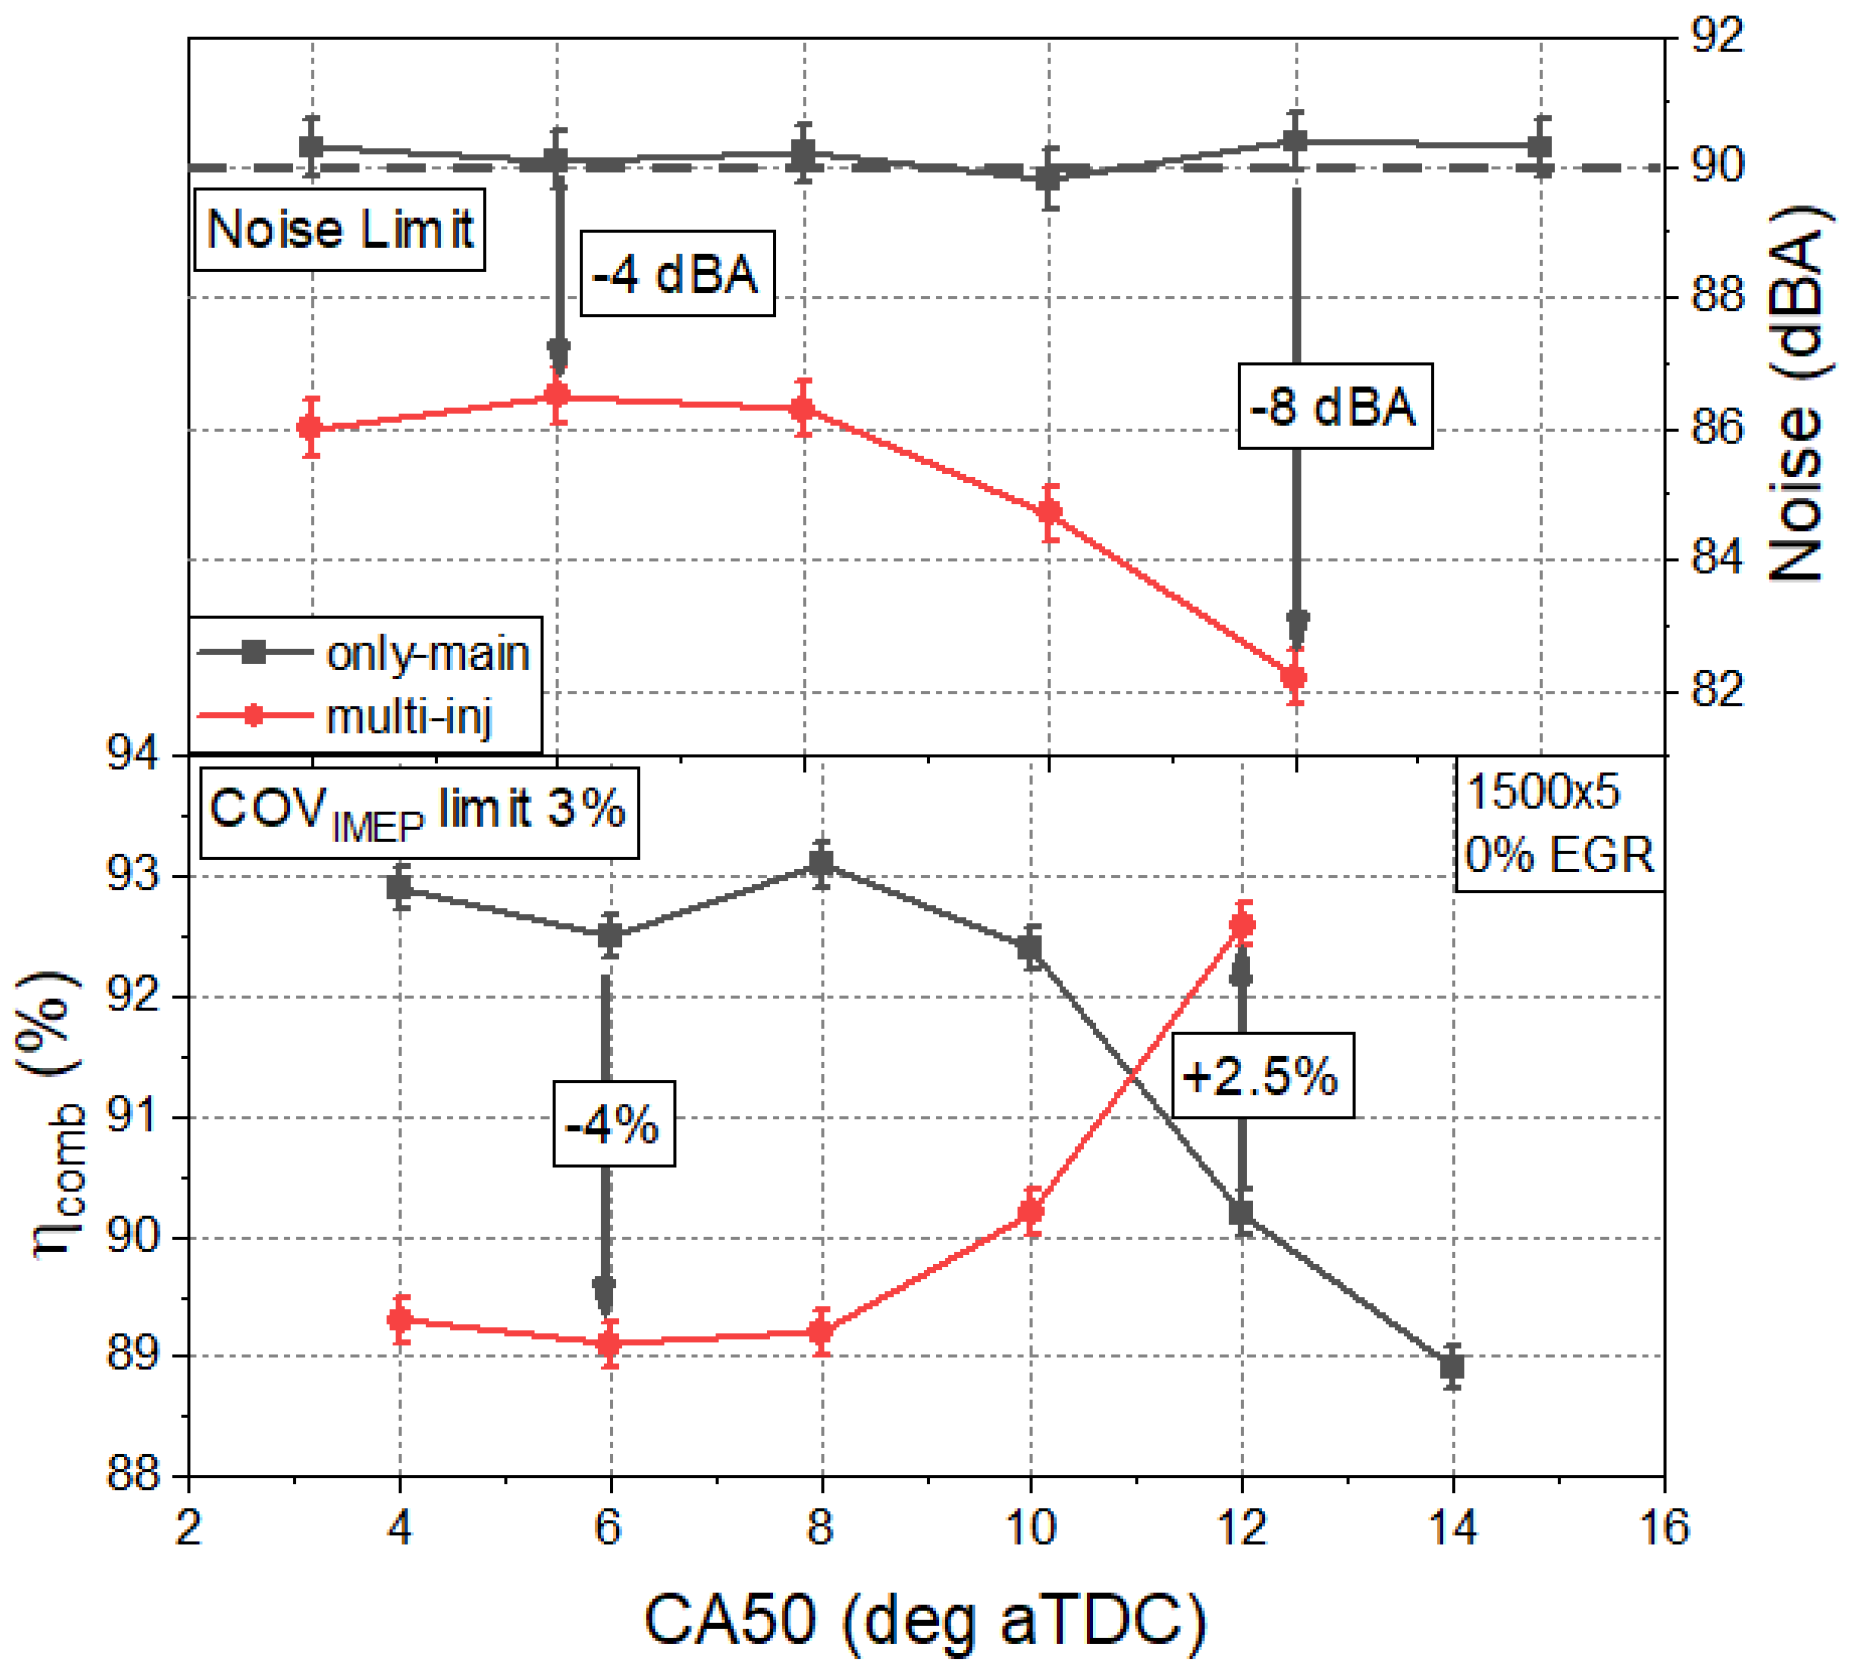
Figure 10 shows the influence of the injection pattern on the combustion indicators in terms of combustion noise and combustion efficiency. As expected, a general decrease of the combustion noise was observed, with a minimum difference of 4 dBA at 6 deg and a maximum reduction of 8 dBA (at 14 deg) retarding combustion phasing.
A trend comparison of combustion efficiency is also depicted in
Figure 10. A reduction for the multi-injection strategy is reasonably due to not full vaporization of the PFI ethanol that can lead to ethanol impinging on the cylinder wall and combustion chamber [
36] and incomplete combustion since an amount of mixture burns in the expansion stroke [
37]. These aspects affect the combustion of the charge and consequently a worsening of HC and CO emissions, which can worsen the combustion efficiency if the diesel flame is extinguished before reaching the combustion chamber wall. For more retarded combustion phasing (12 deg aTDC), splitting the diesel injections helped to maintain higher mean in-cylinder temperature, which improved the oxidation of HC and CO emissions and consequently the combustion efficiency, as depicted in
Figure 10.
No trend analysis was reported for specific indicated PM values due to their values lower than the minimum filter smoke number (FSN) relates to the resolution of smoke meter utilized during the experimental campaigns (
Section 2.1). Despite different values, their order of magnitude is typical of a soot-less zone.
This section shows that the use of a multi-injection strategy also for the lower load case (1500 × 5) guaranteed the respect of FSR target and led to an improvement in terms of combustion noise and efficiency. For these reasons, the multi-injection strategy was also adopted for the subsequent experimental investigations related to 1500 × 5 test point.
3.4. Effects of EGR on FSR in the DF Mode
This section analyzed the EGR influence on FSR and the combustion process in the DF mode. The evaluation was performed imposing typical Euro 6 engine-out NOx limit of 0.6 and 0.9 g/kWh for 1500 × 5 and 2000 × 8, respectively. The goal was to reach the same FSR values obtained by the multi-injection strategy.
Figure 11 compares the FSR trends with and without EGR in 1500 × 5 test point varying combustion phasing in the range 4–12 deg. For a more advanced CA50 (4 deg), the FSR value achieved was very low (0.2) due to the high thermal inertia of ethanol/diesel mixture using a high rate of EGR. Ethanol fraction was reduced to sustain the combustion. Retarding the combustion phasing FSR increased and its trend was closer to the reference point in the range 10–12 deg CA50.
The combined effects of the use of EGR and the high heat of vaporization of ethanol allow a reduction of in-cylinder temperature and pressure [
21] delaying the start of combustion. The dilution effect, when EGR was used, means a decreased oxygen concentration in the intake charge and less favorable thermodynamic conditions to initiate combustion. As a consequence, the combustion process was more premixed, producing a higher rate of heat release, and the trend became more obvious with increasing ethanol fraction [
11]. The higher premixed combustion phase enhanced the in-cylinder mean temperature and accelerated the post-combustion of premixed diesel and alcohol fuel, and thus shortened the combustion duration [
38].
Finally, it can be stated that, at the same engine speed-load, the combustion process, in terms of the HRR pattern, as shown in
Figure 11, was similar within the CA50 range considered.
With an imposed limit of 0.9 g/kWh, in 2000 × 8 test point, over the CA50 range 6–12 deg, the fraction of ethanol injected was always lower than the reference one, as reported in
Figure 12. As previously stated, delayed combustion was observed with a prominent premixed combustion phase, which affected noise, in an average of 1 dBA, in the whole CA50 range considered.
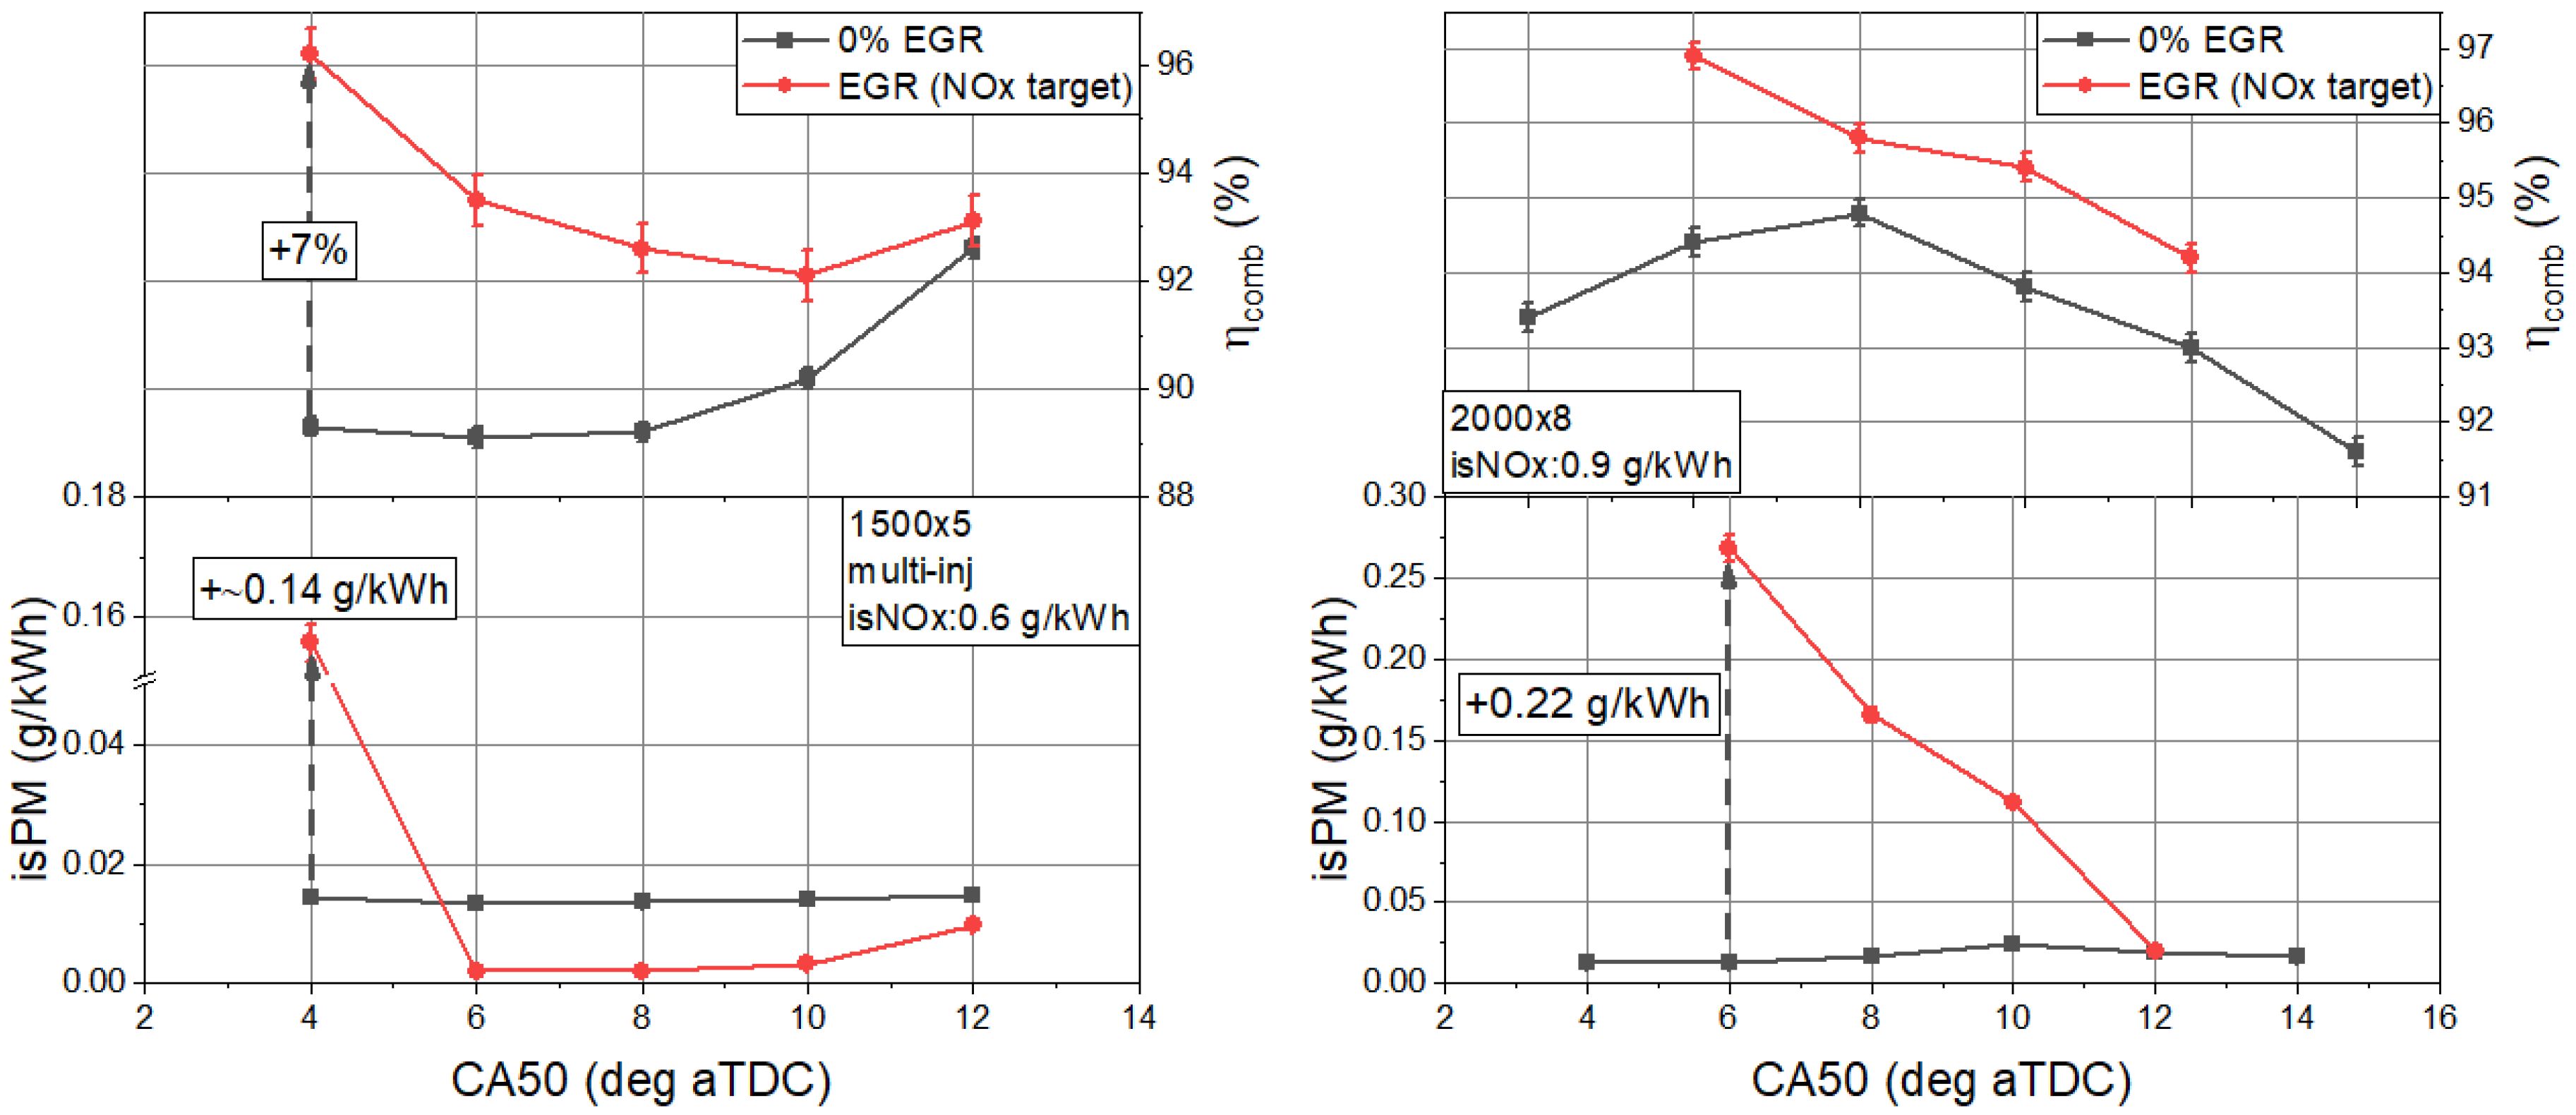
Figure 13 shows the influence of EGR on combustion efficiency, and PM indicated specific emissions for both test points.
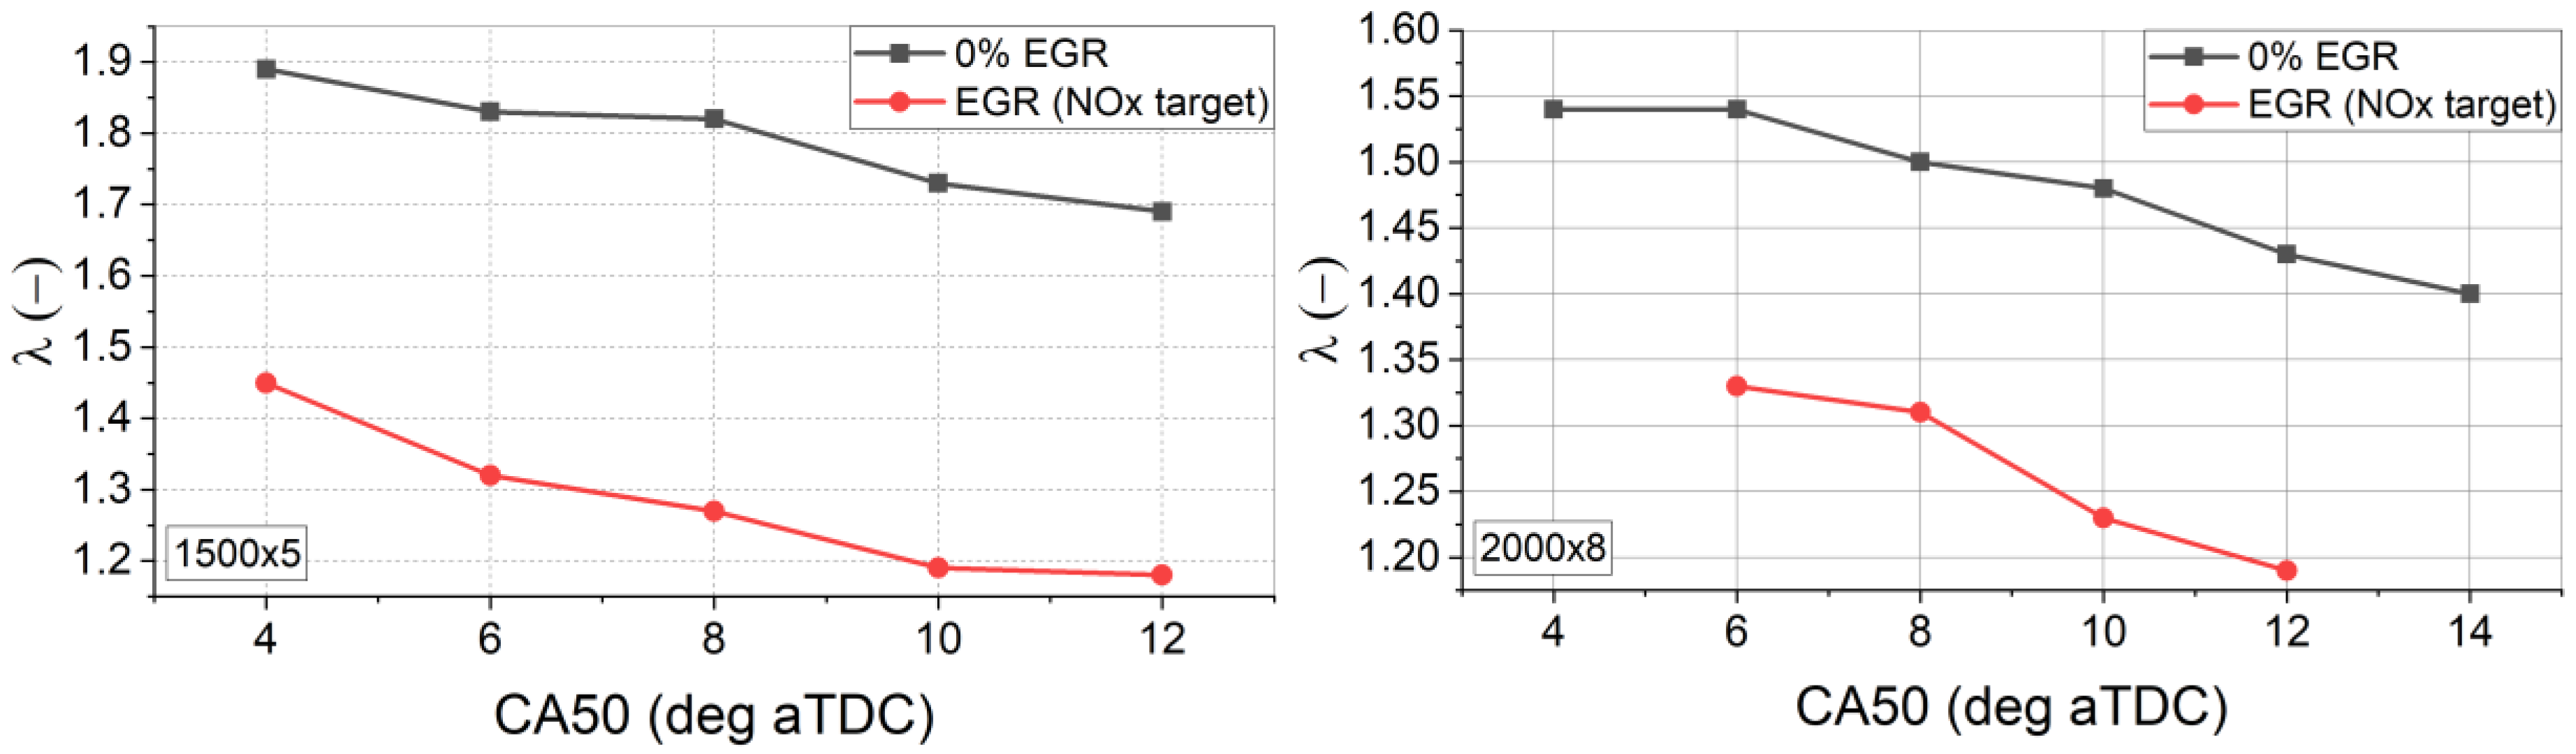
For both test points, a general improvement of the combustion efficiency was observed within the CA50 range considered. It was reasonably due to a richer combustion process as lower air index (λ) values shown in
Figure 14.
The ethanol addition could improve the PM reduction due to lower oxygen availability in the presence of EGR. As can be seen, the PM emission trend adopting EGR, at 1500 × 5, was lower than the reference one except for an abrupt variation at 4 deg of CA50 due to the greater amount of diesel injected. For higher load, at 6 deg of CA50, the lower fraction of ethanol injected led to a PM penalty. Nevertheless, retarding combustion phasing the trend decreased due to the further FSR increment.
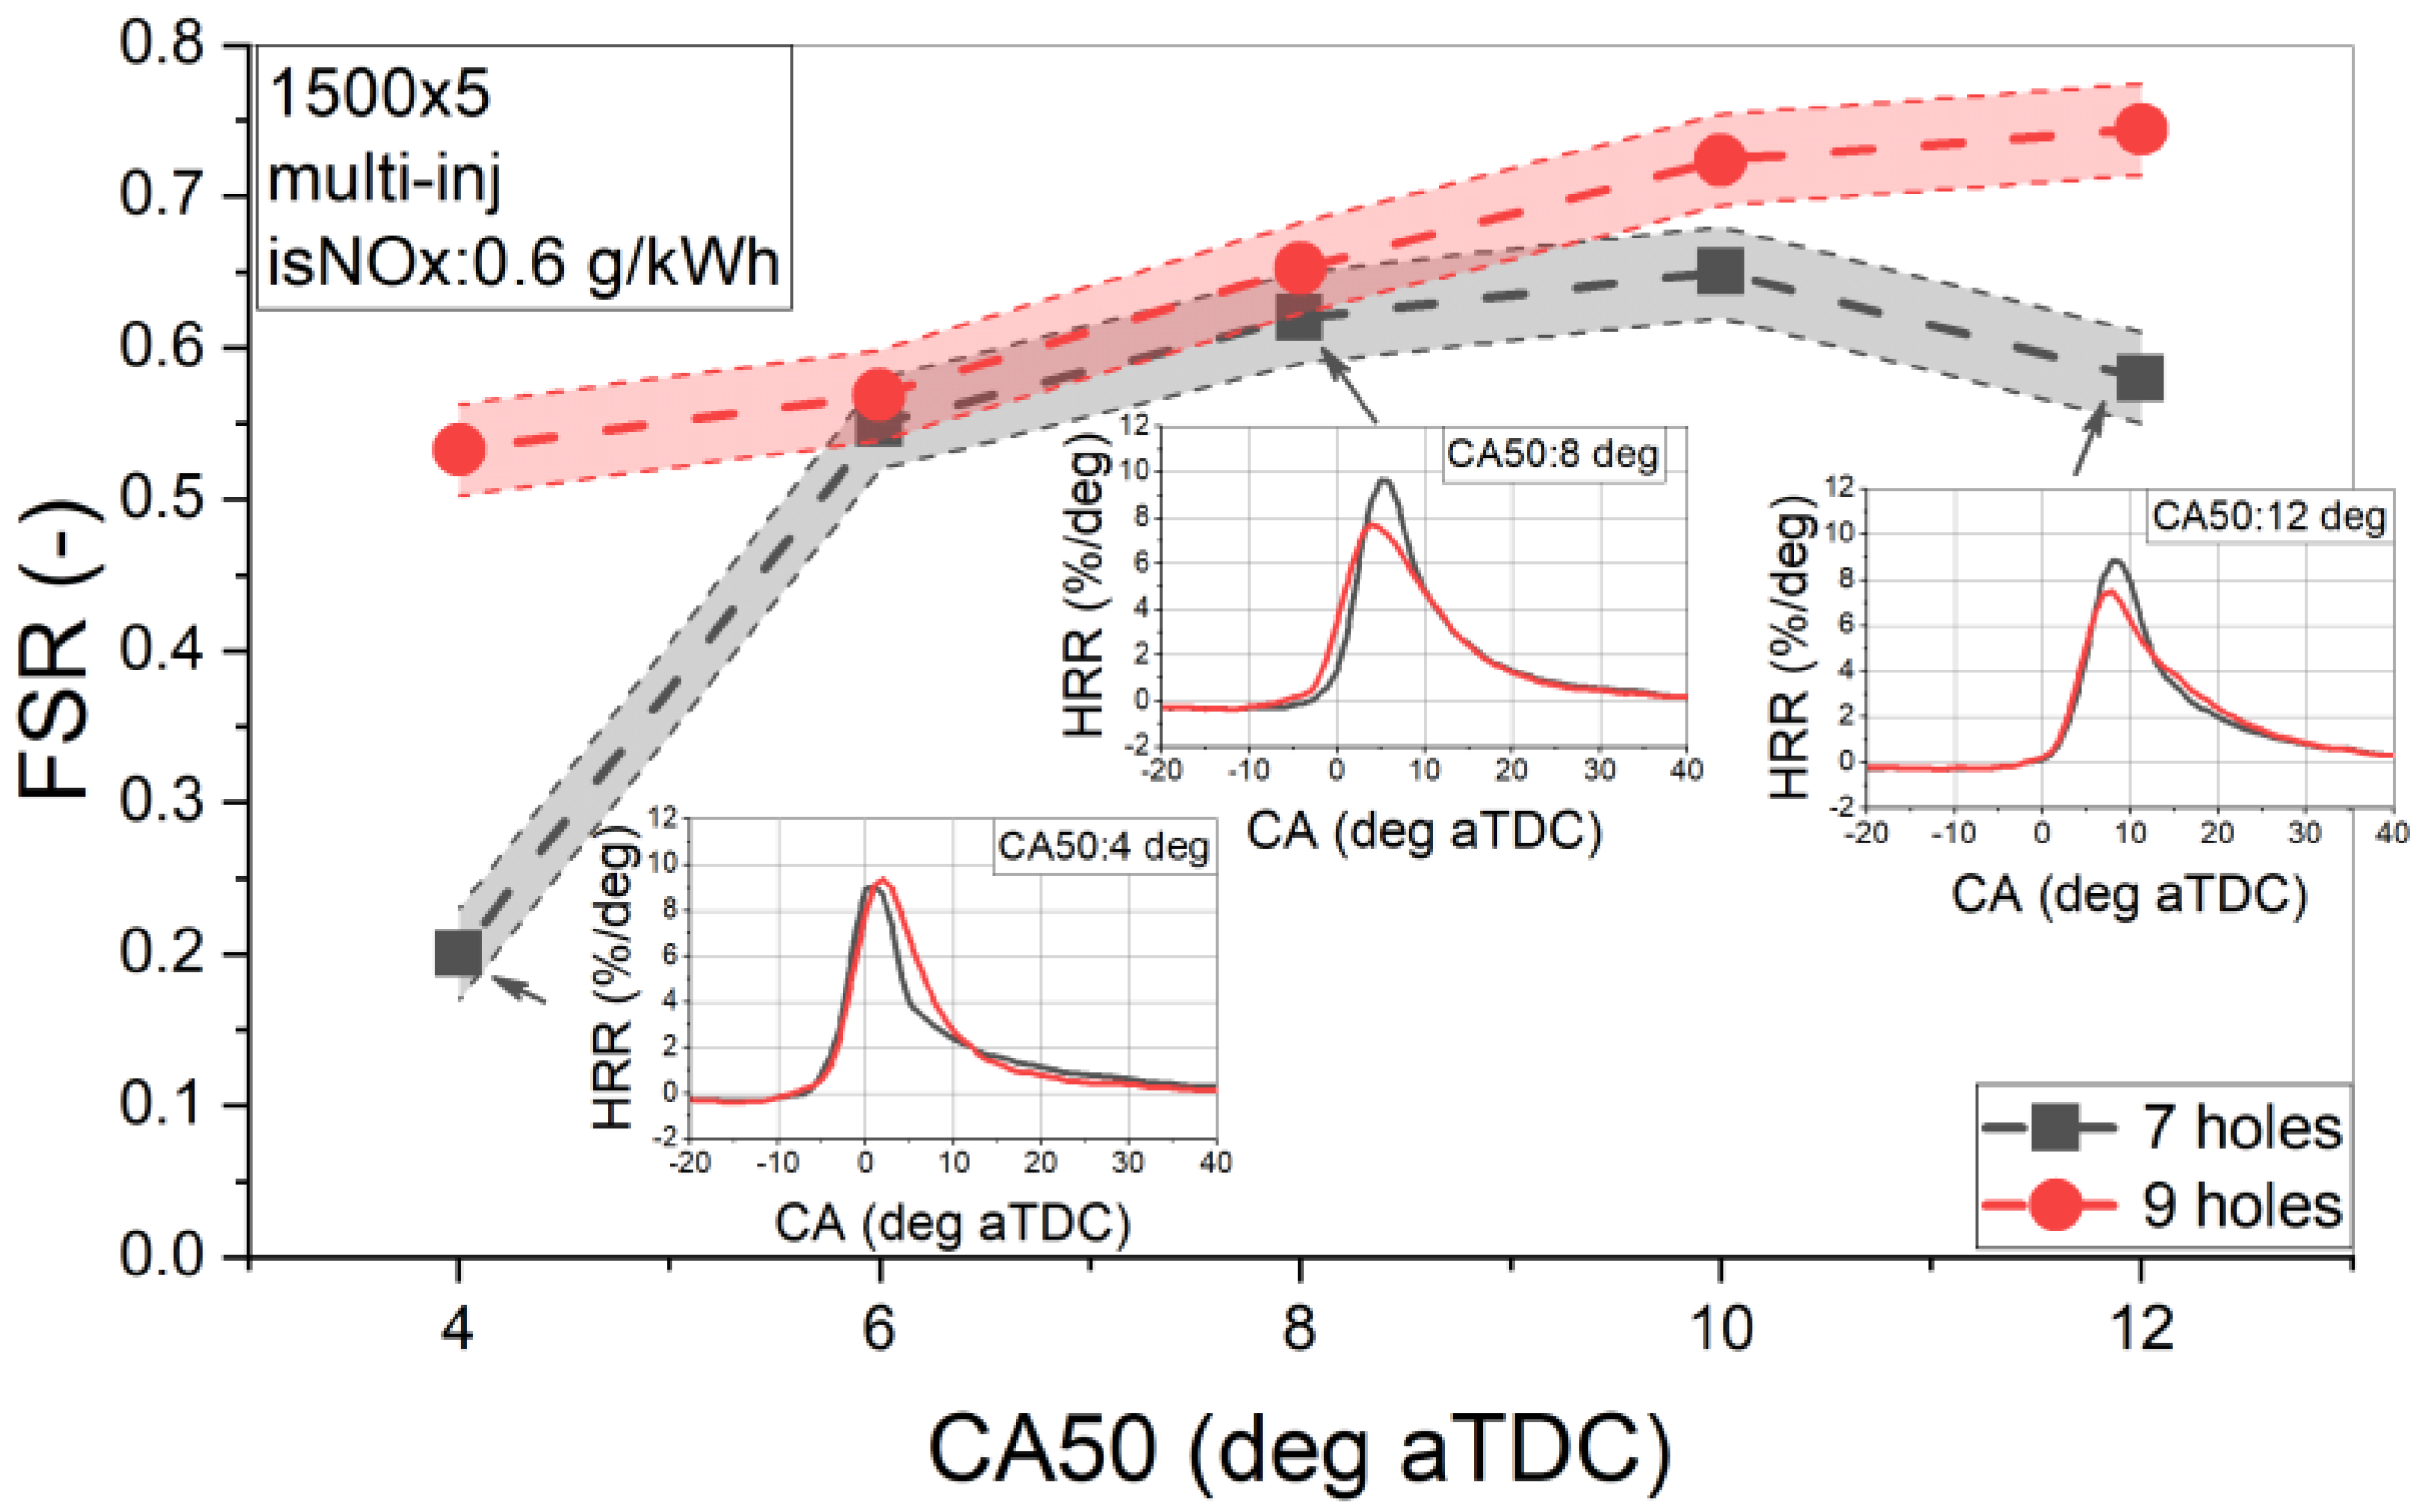
3.5. Effects of the Nozzle Hole Numbers on FSR in the DF Mode
This section aimed to cover the scientific gap in technical literature providing further information and discussion on the influence of the nozzle-hole number, 7 and 9, of the diesel injector on the maximum FSR reachable in the DF combustion mode and the GHG and PM emissions. All test conditions imposed in previous sections were kept constant to discriminate the nozzle effect.
Relating to the 9 nozzle-hole cases, in 1500 × 5, the ethanol fraction increased retarding combustion phasing. On average, the FSR trend showed comparable values with the lower holes case in the range 6–10 deg of CA50, while at 4 and 12 deg higher values were reached as shown in
Figure 15.
The increasing of the nozzle holes diminished the reacting zone at a high temperature because of a more uniform distribution of the fuel and temperature, as confirmed in Lee et al. [
39]. Therefore, retarding combustion phasing a reduction of temperature on average was expected, as the HRR profiles of 9 holes case shown in
Figure 15.
For higher engine speed-load (2000 × 8), instead, the FSR values were not influenced by a different nozzle hole number, as shown in
Figure 16. A slight difference could be observed for more retarded combustion phasing. For both nozzle cases, the FSR trend increased retarding CA50.
In terms of the combustion process, no relevant difference could be noticed in the HRR pattern. An exception was at 12 deg where the combustion occurred earlier with a lower temperature premixed phase as shown by the lower HRR peak. Furthermore, a prominent diffusive phase could be observed.
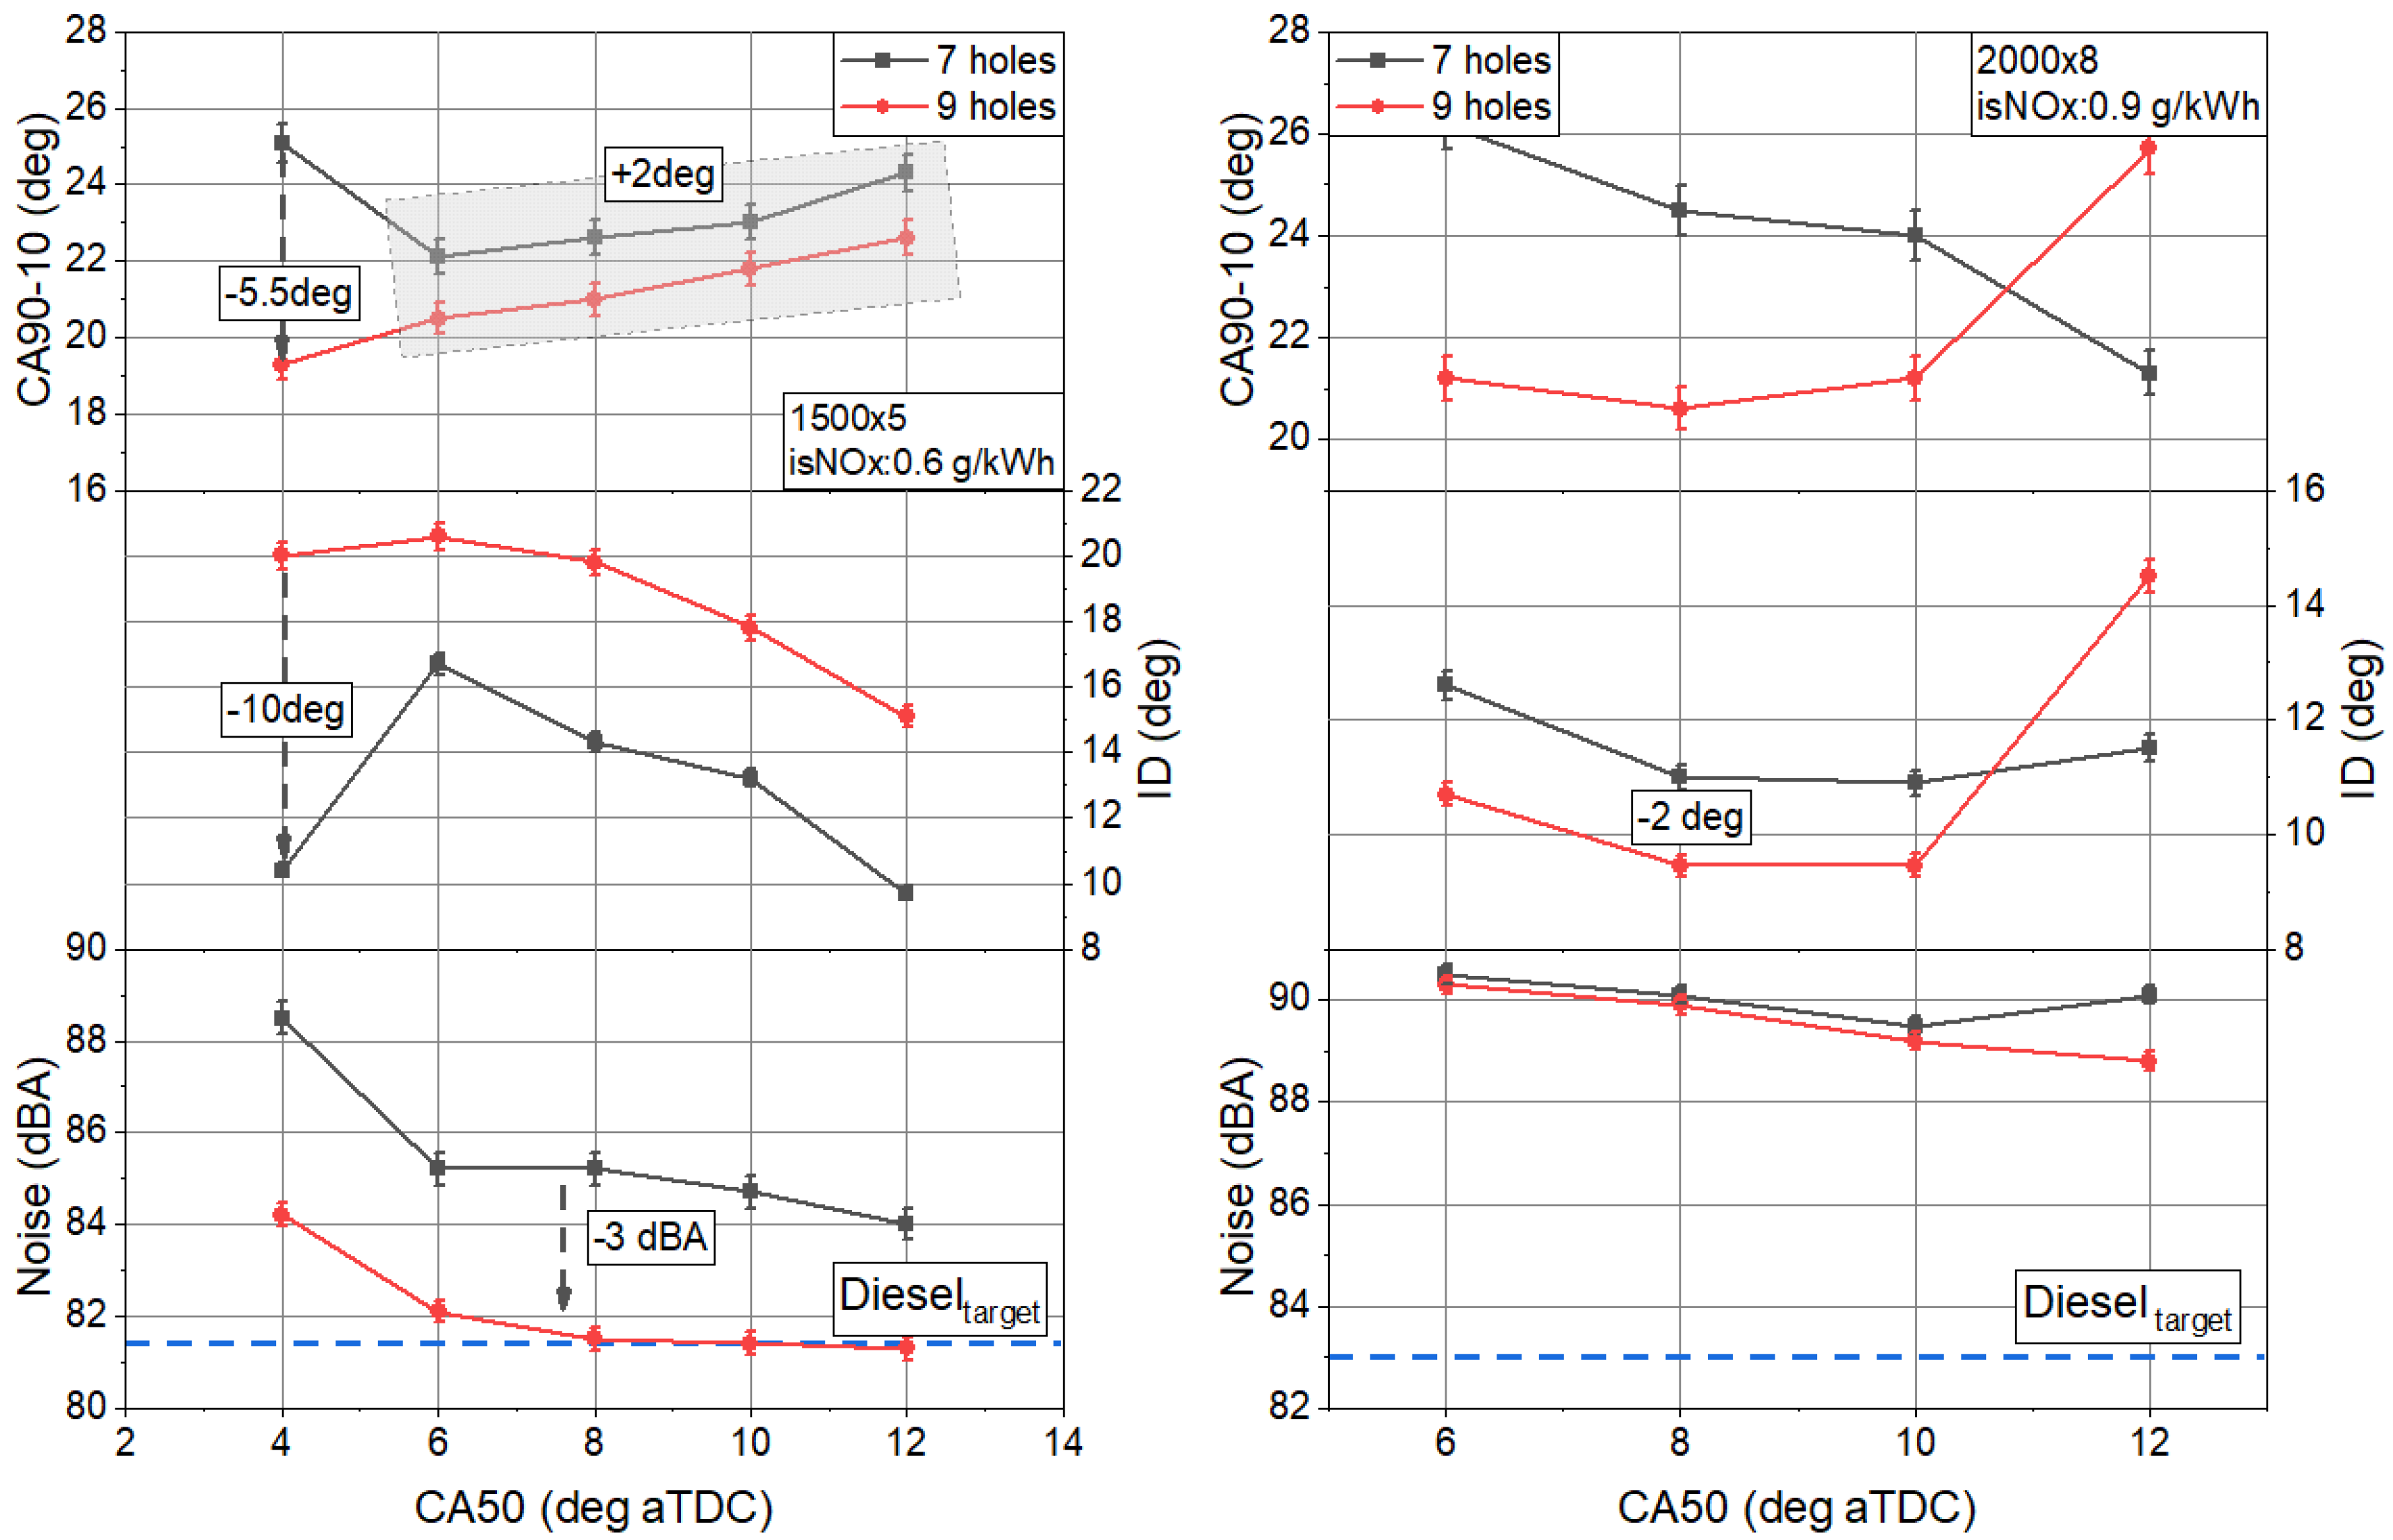
The combustion characteristics related to different nozzle hole number are depicted in
Figure 17. As can be seen, at lower load (5 bar BMEP) the 9 holes case showed the shortest combustion duration compared to the 7 holes case, with a maximum reduction of 5.5 deg at 4 deg aTDC and an average reduction of 2 deg retarding combustion phasing. In the DF combustion mode, when two fuels with different reactivity were involved in the combustion process, the combustion started in the high reactivity regions and gradually evolved towards low reactivity regions [
40]. The increase in the nozzle hole number led to a reduction of the orifice diameter and, since it had the same hydraulic flow rate, an improvement of fuel atomization hence a better mixing of the charge. The formation of a higher reactivity zone in the combustion chamber and the more atomized fuel allowed shorter combustion duration. The charge cooling effect of the ethanol fraction combined with well mixed air-fuel led to an increase of ID.
Shorter combustion duration was also observed for the higher load case. A discrepancy was found at 12 deg of CA50. In this case, due to lower mean temperature and a prolonged diffusive phase, as shown in
Figure 16, increased combustion duration was observed. In the range 6–10 deg, the lower value of FSR shortened the ID.
At a lower load, the 9-hole nozzle shows an improvement in the combustion noise compared to the 7-hole one with values aligned with the conventional diesel mode. In 2000 × 8, for both nozzles tested, the effect of ethanol was more predominant, probably due to the higher injection pressures. Insensitivity to combustion noise was observed, resulting in higher values than the conventional target, in the range of 6–7 dBA in the entire CA50 range considered.
Figure 18 shows the effect of holes numbers on thermal and combustion efficiency, indicated specific PM, and CO
2 emissions.
The different nozzle hole number, for 1500 × 5, had no influence on the indicated specific PM except for more advanced combustion phasing (4 deg) related to fewer nozzle cases. The abrupt variation observed was due to the lower value of FSR achieved, as shown in
Figure 15. For higher load and speed, PM decreased while increasing the ethanol fraction for both nozzle cases.
Figure 18 compares engine-out PM emissions between DF and conventional diesel modes. The ethanol addition significantly reduced them in both cases investigated, in particular at 5 bar of BMEP. These benefits were evident by adopting a high FSR because of the reduced quantity of diesel fuel, which reacted with the ethanol–air mixture leading to dominant premixed combustion, with a consequent reduction of PM, in this case of about 95% in the CA50 range considered. An exception at the lowest CA50, for both, tested points, where a lower FSR justified an important difference in terms of soot, of about 90% and 50%, for 1500 × 5 and 2000 × 8, respectively.
No relevant influence could be noticed in both cases for thermal efficiency, while the combustion efficiency decrease was related to the CO/HC trend. Related to this point, further explanations are given below.
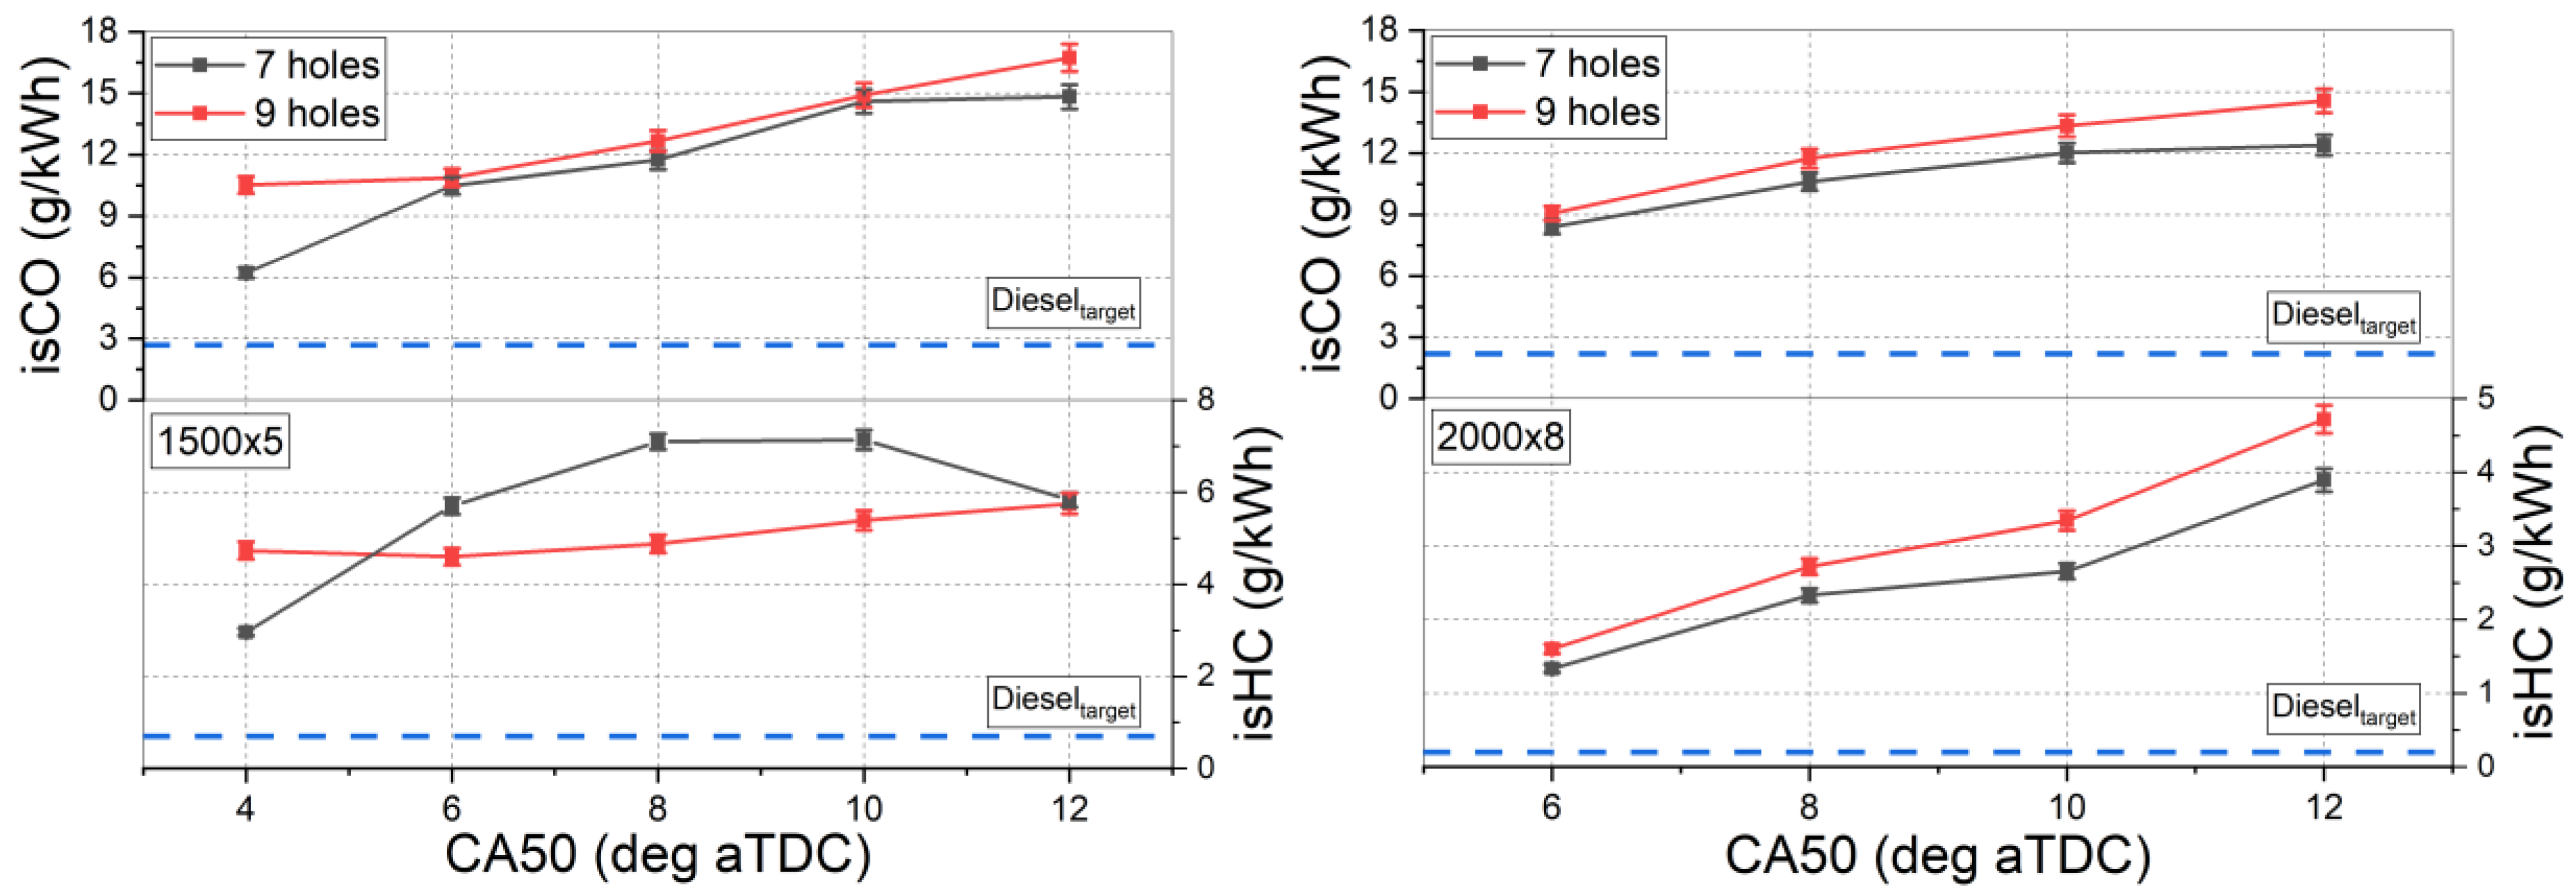
The effect of different nozzle hole numbers on indicated specific CO and HC emissions are illustrated in
Figure 19. As can be seen for both test points, the adoption of 9 holes injector led to an increase of HC emissions retarding combustion phasing. The trend was mainly evident at 2000 × 8. With more jets, since the same hydraulic flow rate, the amount of diesel per zone in the combustion chamber was lower. So, retarding combustion phasing the unburned fraction increased owing to lower mean in-cylinder temperature, as lower peaks of HRR shown in
Figure 15. Despite the HC worsening, the combustion efficiency, as shown in
Figure 18, maintained acceptable values within the CA50 range considered.
For both test points, the CO emissions increased with further increment of ethanol fraction injected, but CO levels decreased increasing the engine load. The high heat of vaporization of ethanol (
Table 2) and the consequent cooling effect on the charge reasonably affected the CO oxidation. The CO
2 emissions (
Figure 18) strongly depended on CO oxidation. In 1500 × 5, the lower mean in-cylinder temperature due to higher FSR reached (
Figure 15), did not allow complete oxidation of CO and a lower level of CO
2 emitted could be observed in the whole operating range observed. For a higher load, no relevant differences comparing the CO
2 trend could be noticed due to an improved combustion process and the higher values of combustion efficiency compared with the lower load case are shown in
Figure 18.
In all cases, as remarked in
Figure 19, the ethanol fumigation increased the CO and HC emissions owing to the cooling effect of the ethanol on the combustion process. For both test points, it was also found that the CO
2 emissions were lower compared to the diesel target due to the lower C/H ratio and the worsening of the fuel oxidation to produce CO
2.
It is worth highlighting that the multi-injection pattern used in this analysis was calibrated for 7 holes case. Reasonably, for 9 holes case, a dedicated calibration can reveal further improvements not visible at this stage.

 ,
, 


