Article

A Framework for Enhancing Big Data Integration in Biological Domain Using Distributed Processing

by
Ameera Almasoud
1,*,
Hend Al-Khalifa
1,
AbdulMalik Al-salman
2 and
Miltiadis Lytras
3
1
Information Technology Department, College of Computer and Information Sciences, King Saud University, Riyadh 11362, Saudi Arabia
2
Computer Science Department, College of Computer and Information Sciences, King Saud University, Riyadh 11362, Saudi Arabia
3
Computer Science Department Effat, College of Engineering, Effat University, P.O. Box 34689, Jeddah 22332, Saudi Arabia
*
Author to whom correspondence should be addressed.
Appl. Sci. 2020, 10(20), 7092; https://doi.org/10.3390/app10207092
Submission received: 11 September 2020 / Revised: 30 September 2020 / Accepted: 6 October 2020 / Published: 12 October 2020
(This article belongs to the Special Issue Data Science for Healthcare Intelligence)

Abstract

:
Massive heterogeneous big data residing at different sites with various types and formats need to be integrated into a single unified view before starting data mining processes. Furthermore, in most of applications and research, a single big data source is not enough to complete the analysis and achieve goals. Unfortunately, there is no general or standardized integration process; the nature of an integration process depends on the data type, domain, and integration purpose. Based on these parameters, we proposed, implemented, and tested a big data integration framework that integrates big data in the biology domain, based on the domain ontology and using distributed processing. The integration resulted in the same result as that obtained from the local integration. The results are equivalent in terms of the ontology size before the integration; in the number of added items, skipped items, and overlapped items; in the ontology size after the integration; and in the number of edges, vertices, and roots. The results also do not violate any logical consistency rules, passing all the logical consistency tests, such as Jena Ontology API, HermiT, and Pellet reasoners. The integration result is a new big data source that combines big data from several critical sources in the biology domain and transforms it into one unified format to help researchers and specialists use it for further research and analysis.

1. Introduction

The term “big data” appeared in the era of the enormous growth of digital data from various resources and formats [1]. Big data can be described by three main attributes or challenges, called the 3 Vs. Laney [2] defined challenges present in big data management in three dimensions (a.k.a., the 3 Vs): volume, variety, and velocity. Volume refers to the increasing size of data. Variety refers to the types of data, including text, graphs, images, video, audio, and other types. Velocity means that data are generated continuously as a stream at high speeds and need to be processed as they are generated. Fan et al. [3] added two more vs. to this model: variability and value. Variability means there are changes in data structure and interpretation. Value is the business value that gives a competitive advantage to the organization. Volume and velocity were the focus of previous research; the variety of available data worldwide has received less attention. Abawajy [4] discussed dimensions in the variety of big data, terming them structure diversity, content diversity, source diversity, and processing diversity. Structure diversity includes three types of data: structured data, semi-structured data, and unstructured data. Content diversity means data are single-media data, multimedia data, or graph data. Source diversity means data are machine-generated, human-generated, or process-generated. Finally, processing diversity represents the data processing types, namely batch processing, stream processing, interactive processing, or graph processing.
Data integration is the combination of data from several different resources to build a united data view [5]. There are several data integration architectures; most systems fall in between data warehousing (DW) and virtual data integration (VDI) [6]. In DW, data from several sources are collected and stored in a single physical data source where queries are answered. In VDI, data remain in their sources and are accessed at query time. Traditional data warehouses are not efficient for big data integration (BDI) [7] due to big data characteristics; it has an enormous number of datasets, which are heterogeneous, dynamic, and have different qualities [8]. Big data integration can be in batch integration or real-time integration. Batch data integration is used when data is grouped by the source and transformed periodically to the target. Real-time data integration is used if data should be sent immediately from the source to complete a particular task [9].
Few studies so far have used the upper layer ontology or domain ontology to improve the semantic integration that is essential to make big data standardized, reusable, and scalable. Still, they have some drawbacks in their solutions that have affected the quality of big data integration. To accomplish the integration process using ontologies, previous research used different methodologies, including semantic rule-based integration, standard semantic similarity measures, or other approaches. Accordingly, we proposed a new semantic big data integration framework that uses the domain ontology based on the distributed processing system to integrate big data on the biology domain. The main goal from the integration and distributed processing is to serve the research community with a new unified source of big data in the biology domain. In addition, to be able to calculate the semantic similarity measures (SSM) of gene pairs from different data sources by the best semantic similarity measures, which only worked easily on a single ontology. In our proposed distributed processing approach, there is no need for very high-performance computers to load the global ontology and calculate the similarity between any gene pairs.
There are several interesting domains for applying big data integration, but because of the difficulties in collecting data due to either data unavailability or difficulty of having permission to access the data. Therefore, we have selected the biological domain, one of the biggest sources of big data. This source has several valid data sources available online such as European Bioinformatics Institute (EBI) and the National Center for Biotechnology Information (NCBI), and others. These data sources store a tremendous amount of information about interactions of genetics and proteins, which are generated from a wide range of experiments with various types, sources, formats, and sizes. When these data are integrated, within or across different heterogeneous sources, new knowledge or hypotheses are generated that cannot be obtained from the analysis of literature or individual data source.
The rest of the paper is organized as follows; Section 2 presents the basic knowledge related to our work, such as ontology and gene ontology (GO). Section 3 reviews the previous works on big data integration and semantic big data integration. Section 4 describes in detail the methodology to build a big data integration framework in the biological domain. It also discusses the experiments’ environmental setup, the evaluation measures and the test cases. Section 5 shows and discusses the results. Finally, Section 6 provides the conclusions, limitations, and future directions.

2. Background

In this section, the basic knowledge related to our work is presented. In the following subsections, we illustrate ontology and gene ontology.

2.1. Ontology

Ontology is a computational structure used to represent entities and relationships in a given domain in a structured format. Ontologies usually consist of classes, attributes, relations, function terms, restrictions, rules, axioms, and events. The essential elements of the gene ontology are classes, metadata, relations, and axioms: [10]
Classes are used to represent a type of thing in a given domain. Each class has a unique identifier within the ontology namespace. If a class is no longer needed, it is not deleted, but it is marked by “obsolete” to save it for historical reasons. Obsolete classes may have some metadata pointing to an alternative class identifier.
Metadata is textual information associated with a class; it may include alternative identifiers, obsolete flags, definitions, synonyms, cross-references to external databases or web data source, textual comments, and other information.
Relations are used to link classes in hierarchal relationships, from more general classes at the higher levels to the more specific ones at the lower levels. Relations should be directional, such as the hierarchical relationships to build a directed acyclic graph (because any class can have multiple parents). The most common relations are “is a,” “part of,” “has parts,” “regulates,” etc.
Axioms are used to define the constraint on the classes’ definitions; this is called description logics. In Web Ontology Language (OWL), they are called logical axioms, and include quantifiers (universal and existential), cardinalities (minimum and maximum), logical connectives (intersection and union), negation, disjointedness, and equivalence.
Ontologies can be stored in different formats; the most common format is the Open Biomedical Ontology (OBO) format, designed specifically for biomedical ontologies. In recent years, a new format called Web Ontology Language (OWL) was designed to be applicable with the semantic web standards. There are some tools to convert OBO to OWL and vice versa [11]. Portégé [12] is the most common ontology editor for editing ontology classes, relationships, logical axioms, and metadata. Moreover, it provides ontology visualization and reasonings, such as HermiT [13] and Pellet [14].

2.2. Gene Ontology

Gene Ontology (GO) is a valuable resource in bioinformatics. GO provides a shared, structured, precisely defined, and controlled vocabulary of terms to describe genes and gene products across different organisms. The main reason to build the Gene Ontology (GO) was the finding that similar genes in different organisms have the same functions [15]. So, there is a need to have one single source that combines these different genes to be able to compare genes and their products. Combining genes from different organisms into one single data source will facilitate finding the relationship and similarities between genes, integrating more gene-related information from various data sources, and finding new genes and functions.
Before going into details, some essential molecular biology knowledge is necessary [16]:
  • A gene is a region of DNA that encodes instructions for the cell to make a large molecule or potentially multiple different macromolecules.
  • A macromolecule is a gene product that is generated according to the gene instructions; it can be a protein or a non-coding RNA.
  • A gene product can work as a molecular machine, such as by performing a chemical action that is called an activity.
  • A macromolecular complex is a set of gene products from different genes combined to represent a larger molecular machine.
In GO, a term is categorized according to three different biological aspects: biological process (BP), molecular function (MF), and cellular components (CC) [17]. Each of the biological aspects is represented by a separate ontology of terms: for example, “rooted Directed Acyclic Graph” (r DAG) [18]. Terms are the nodes, and edges are the relationships that are either “is a,” “part of,” “has part,” or “regulates.” Parents refer to the more general terms and child to the more specific terms. Terms located close together are more similar than those which are farther apart. The current version of GO has 43,835 terms; 73,776 “is a” relations; 7436 “part of” relations; and 8263 “regulates”, “negatively regulates”, or “positively regulates relations” [15]. Frequent revisions and maintenance of terms and relationships are done to maintain the correctness of GO. Furthermore, old terms are not deleted but marked with “Obsoletion,” and any relation related to them is removed [15].
GO was built by GO Consortium, a set of databases working together to define standards and annotations [15]. GO Consortium includes UniProt [19], Mouse Genome Informatics [20], Saccharomyces Genome Database [21], Wormbase [22], Flybase [23], dictyBase [24], and TAIR [25]. Other contributions have been made by EcoCyc and the Functional Gene Annotation group at the University College of London [26].
Each term in GO is associated with annotations describing MF, biological role, and localization. Annotation is defined to represent the association between the gene product and a GO term. Evidence is provided in the annotation to support the association. There are two formats for storing the same information: the association Gene Association File (GAF) and the Gene Product Association Data (GPAD). The annotation object can be a gene, protein, nonprotein-coding RNA, macromolecular complex, or another gene product. Each annotation consists of seventeen fields, seven of which describe the annotation object. Two fields represent the unique identifier, which consists of the database number the annotation is associated with and the database association number. One field represents the gene product form ID. Three fields specify the annotation function. Three more fields are used to describe the evidence that asserts the annotation. An additional field combines more than one term [15].
Annotation can be computationally inferred, i.e., inferred from electronic annotation (IEA), or experimentally determined, which is indicated by an evidence code (EC). EC is more reliable than IEA in representing the type of process that generates the annotation [27].

3. Literature Review
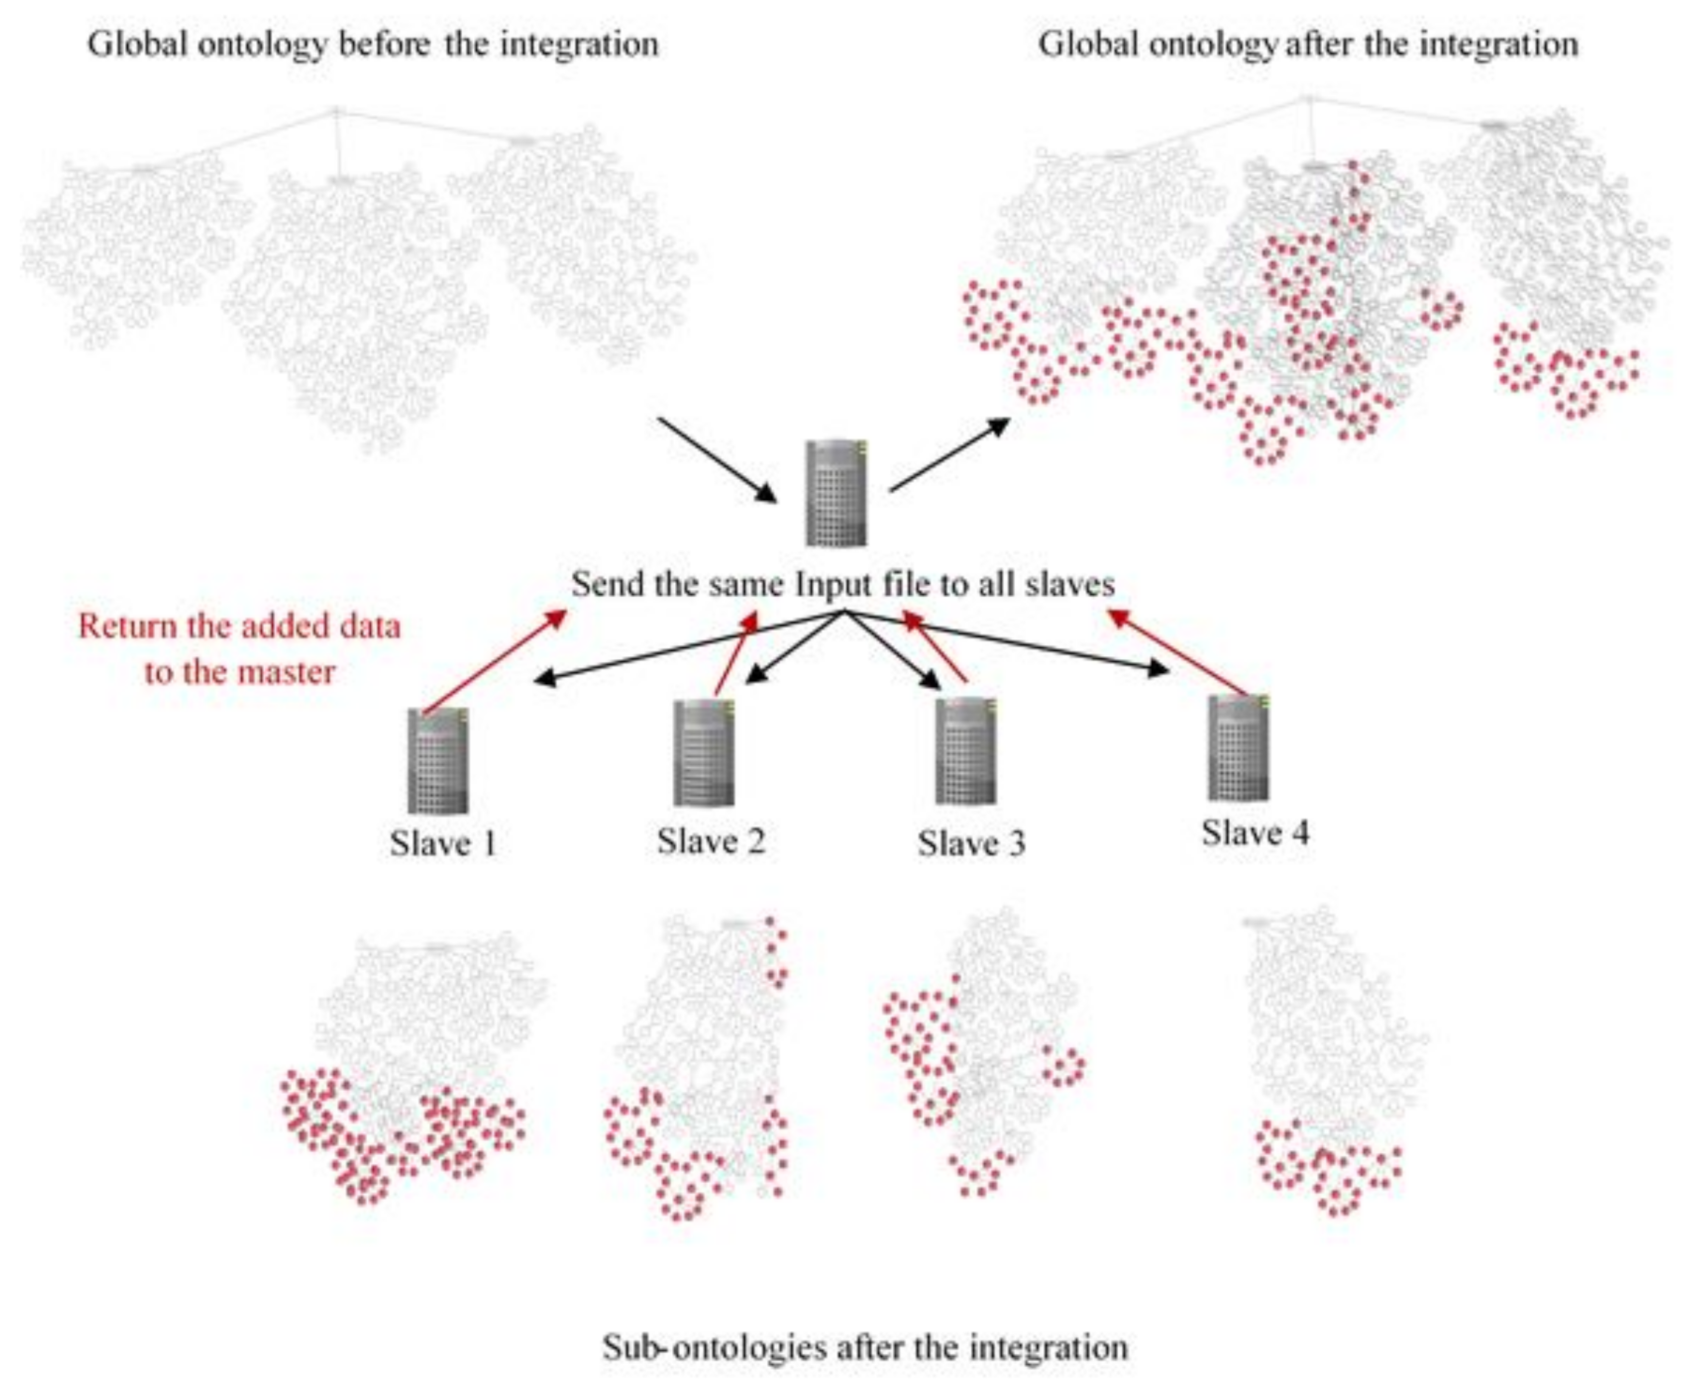
There have been few studies published in the field of big data integration that handle big data integration in general or in a specific domain. Some research has proposed applications, frameworks, query language, case studies, etc. Before the emergence of the term “big data”, large scale data integration started in 2005 in the form of integrating a massive number of data sources on the deep web [8]. Large scale data integration was used either for exploring and integrating data on the web, such as building a map between web forms [28] or for crawling and indexing deep web contents [29,30], in addition to integrating the structural data from web tables [31,32], and web lists [33,34]. In addition, it integrated XML data residing on multiple related XML schemas in one warehouse schema based on relational online analytical processing (ROLAP) [35]. After that, one research study presented a framework that gathered and cleaned linked data on the web [36]. Another framework integrated disaster-related data from several resources and stored it in the cloud [37]. The term “big data” was first used in 2013 in the integration of large-scale data, which proposed the creation of a big graph that manages and facilitates enterprise data integration [38]. Later on, more research appeared in several domains, and some research started to use semantic web technologies to enhance big data integration [39].
Different techniques have been used in the previous works to enhance semantic big data integration. Still, most of these works used ontology as a basis for the semantic integration, while only two used a database and web repository. Regarding the system architecture, most of the research used DW architecture. However, these two studies [40,41] used VDI architecture, which is better in making the data up-to-date, solving storage problems, handling system scalability, and localizing data changes. Another solution handled the scalability issue illustrated in [42], where data stored in distributed clusters were deployed in a cloud environment.
The mediated schemas were built either manually [43], semi-automatically [40,44,45], or automatically [41,42,46,47,48,49,50,51]. The manual method is a time-consuming and inefficient solution in the case of big data, especially in the case of big data having many data sources with a massive number of attributes and relations. The semi-automatic method requires an expert intervention to enhance and approve each step in the integration process. The automatic method is the best approach in the case due to big data characteristics. Some research used upper-layer ontology to handle the semantics in the mediated schema building. One of the studies [40] used WordNet ontology as a base in finding the concepts synonyms, while other research [44,46,50] used domain ontology for the same purpose.
To handle the integration process, some of the research [45,50] used domain-related semantic rules. These rules are application-dependent, where big data integration in a certain application depends on a set of semantic rules that fit the application requirements and data specifications. So it may not be suitable for other applications even if they are from the same domain. Furthermore, semantic rules need an expert to analyze and mine the domain manually to extract the semantic integration rules, which is not practical in big data with many data sources with enormous attributes and relations.
Instead of using the domain-related semantic rules, some research used general similarity measures for calculating the similarity between concepts, such as Wu–Palmer, as in [41], cosine similarity, as in [40,44], and semantic proximity, as in [49,52]. These similarity measures previously used are suitable for calculating the similarity between objects in the surveyed works. However, they are not accurate for calculating the similarity between objects in other domains. For example, cosine similarity measure is not precise, since it just captures overall similarity. In addition, Wu–Palmer similarity measure is designed for simple concepts, but it does not consider how far the concepts are semantical.
Moreover, semantic proximity is context-dependent, leading to uncertainty in cases where objects can be similar in one context and dissimilar in another. Therefore, these similarity measures are not suitable in some fields, such as biomedicine, where similarity measuring is not a simple task; it is achieved by comparing features that describe the objects in addition to the hierarchal relationships between these features. For instance, measuring the similarity between genes or gene products by comparing the gene ontology annotation terms is not enough since there is a relationship between the gene expression’s and gene ontology’s semantic similarity [53]. In addition, gene ontology annotations are not consistent where edges at one level may have various semantic measures; terms at the same level may have a different level of details, and nodes may have a variable density of terms [18]. Therefore, some semantic similarity measures are defined specifically for the biology field to measure the similarity between genes and gene’s products. Moreover, the best SSMs illustrated in the background chapter work in a single ontology, which means that they cannot be used to calculate the semantic similarity of two genes located on two different ontologies. Therefore, we need to integrate these genes into a single ontology to be able to calculate their semantic similarity.
According to the problems we mentioned previously, which are related to big data characteristics, the way in which previous work introduced upper-layer ontology or domain ontology and other issues was related to semantic similarity measures. This is a great opportunity to enhance the semantic big data integration process with a new big data integration framework that integrates big data in the biology domain using distributed processing. In addition, we can advance the biological domain with a new big biological ontology that can be used for further research and for calculating the semantic similarity between genes and gene products.

4. Methodology

This section presents the methodology used to build the big data integration framework in our domain. It also discusses the experiments’ environmental setup, the evaluation measures, and the test cases.
To build a new, unified source of big data in the biology domain, we proposed a framework that uses the domain ontology based on the distributed processing system. Without this framework, we cannot have all related information in a single source to process and calculate the similarity between genes without the need for very high-performance computers. Furthermore, very high-performance computers cannot manage data growth all the time. To this end, our proposed framework will resolve the issue by distributing data integration and processing. After dividing GO into a set of sub- ontologies using the Split GO algorithm [54] and assigning each sub-ontology to one of the slaves, data integration can start for each input incrementally, using the add, check, then compare (ACC) processes:
  • Add: each slave loads its sub-ontology then adds any related data from the input file. Data added to the sub-ontology is also added to the global one.
  • Check: logical consistency of the resulted ontologies (sub-ontologies and the global one) are checked using Jena Ontology API [55], Pellet [14], and HermiT [13] reasoners.
  • Compare: the global ontology resulting from the distributed integration is compared to the global ontology resulting from doing the integration locally.
As we can see in Figure 1. Big Data Integration Framework, in the beginning, the master node has the original global ontology, and each slave has it is own sub-ontology resulting from GO Split algorithm. A master node sends the data input file to all slaves. Each slave adds data related to its sub-ontology and sends the added data to the master node to add it to the global ontology. The master node reads the data sent from the slaves, removes any duplicates, and adds it to the original ontology. So, at the end of the integration, we have one global ontology that has all the data and an equivalent ontology composed of a set of sub-ontologies. The main goal from the integration and distributed processing is to be able to calculate the SSM of gene pairs easily without a need for very high-performance computers to load the global ontology and calculate the similarity between any gene pairs. Now we can search for the gene pairs on a set of sub-ontology and calculate the similarity easily and quickly.

4.1. Environmental Setup

Implementation and testing of the big data integration framework were conducted using the following settings and equipment:
  • Equipment:
    • Dell PowerEdge T620 server with SATA (7.2K) hard drive is and with a VMware Workstation Pro 14 software to create a set of six virtual machines (VM); each machine runs on Ubuntu 16.04 LTS, Intel® Xeon® processor E5-2600 product family × 4 processors. One VM works as a master with 14 GB of RAM and the rest work as slaves with 8 GB.
    • Samba file and print service, which is an open-source implementation of the Server Message Block/Common Internet File System (SMB/CIFS) protocols that provides the sharing of files and printers between master and slaves.
    • Protégé [12] is an open-source ontology editor and knowledge management system. We will use it to validate or test the logical consistency of all ontologies.
  • Programming language:
    • JAVA programming language version 1.8.
    • Libraries:
    • Semantic measure library and toolkit (SML) [56] to read and process the GO.
    • JCIFS library [57] to access and manage shared data on a Samba Server installed on the master node using JAVA.
    • Jena is a Java-based programming toolkit.
    • Pellet and HermiT are used to check the ontology consistency and identifying subsumption relationships between classes. Pellet reasoner is an open-source based on OWL2 reasoner using Java programming language. It is used with Jena and OWL API libraries. HermiT limitations are based on OWL language.
  • Algorithms:
    • GO Split Algorithm to generate N GO Splits, where N ranged from 1 to 5, because in our settings we can have 2, 3, or 5 slaves.
  • Input:
    Due to the hardware limitation (hard drive size) in our system, we cannot integrate all the input data; therefore, a sample of input data was selected. Samples are generated based on collecting a line from an input sample file if its gene ID is in the NCBI genes list that has a relation with any gene in GO. To reduce the sample size, one line for each gene ID is taken because some gene IDs are repeated in many lines. Input sample files are:
    • GO [47] in Open Biomedical Ontologies (OBO) file format [48]; it is composed of 36,638 genes.
    • gene_info [58]: text file of information that has about 2,013,945 NCBI genes. A sample of 56,603 genes was selected.
    • gene2go [59]: text file that reports about 2,070,137 relations between genes from GO and genes from NCBI. A sample of 55,859 relations was selected.
    • gene_neighbors [60]: text file that represents neighboring genes for all genes located on a given genomic sequence. A sample of 56,647 relations was selected.
    • gene2ensembl [61]: text file of 1,907,407 matches between NCBI genes and Ensembl annotations based on the comparison of RNA and protein features. A sample of 56,647 relations was selected.
    • gene2pubmed [62]: text file report that has about 11,165,891 relations to link genes from NCBI to PubMed ID. A sample of 56,044 relations was selected.
    • gene2sts [63]: text file report that has about 1,173,647 relations to link genes from NCBI to UniSTS ID. A sample of 56,647 relations was selected.
    • gene2accession [64]: text file of 18,142,094 accessions related to GeneID of the genes mentioned in the NCBI gene information file. It contains sequences from the international sequence collaboration, Swiss-Prot, and RefSeq. A sample of 56,498 accessions was selected.
    • gene2vega [65]: text file is composed of 84,828 matches between NCBI genes and Vega annotations. A sample of 29,496 matches was selected.
    • gene2unigene [66]: text file report that has about 589,221 relations to link genes from NCBI to the UniGene cluster. A sample of 55,891 relations was selected.

Evaluation Measures

  • Logical Consistency measure: an ontology is marked as passing if ontology passes the logical consistency test and is marked as failing otherwise. Logical consistency tests are Jena, Pellet, and HermiT tests. The Jena test is done by loading ontology/sub-ontology in a Java program using the Jena library. If it is loaded correctly without any errors, this means the ontology/sub-ontology does not violate any logical consistency. Pellet and HermiT tests are done by loading ontology/sub-ontology in the Protégé program and applying Pellet/HermiT reasoners. If there are no errors, this means the ontology/sub-ontology does not violate Pellet/HermiT logical consistency.
  • Equivalence measure: an ontology resulting from the distributed integration is marked as equivalent if it is the same as the ontology resulted from local integration. Otherwise, it is marked as not equivalent. They are equivalent if they have the same ontology size before the integration, number of added items, number of genes after the integration, number of edges, vertices, and roots.

4.2. Test Cases

For each ontology, we applied the Jena Ontology API, Pellet, and Hermit reasoners. Using the Java programming language, we calculated the total time to build an ontology and to perform the Jena test. On the other hand, we cannot calculate the time required to complete Pellet and Hermit reasoners because this service is not available in Protégé. In the first experiment, there were seven ontologies, namely: the original one, and six new ontologies, which were created after adding each input from six input data sources to the original ontology. In the second experiment, there is one global ontology and two sub-ontologies, so we tested three ontologies after adding each input data source, which means we have 54 tests (18 Jena tests and 18 Pellet and 18 Hermit reasoners tests). For the third, fourth, and fifth experiments, we have 24, 30, and 36 ontologies and sub-ontologies, and we performed 72, 90, and 108 tests, respectively.
There were 24 experiments done to compare the global ontology resulting from adding every input from the six input data sources in the distributed VMs to the global ontology resulting from the local integration on a single VM. Details of these test cases, results, and discussions are shown in the following sections.
The two test cases were done to test the proposed big data integration framework:
  • Case 1: testing the logical consistency of the resulted ontologies (sub-ontologies and global ones) iteratively after adding each input data source. Logical consistency is checked using Jena Ontology API, Pellet, and HermiT reasoners.
  • Case 2: comparing the global ontology resulting from the distributed integration to the global ontology resulting from doing the integration locally. Comparison is based on ontology size before the integration, number of added items, number of added roots, total number of genes after integration, number of edges, vertices, and roots.

5. Results and Discussion

This section presents the results and discussion of the test cases shown in the previous section.

5.1. Test Cases 1 and 2: Big Data Integration Framework

In this section, we will compare the global ontology resulting from the distributed integration to the global ontology resulting from doing the integration locally and test the logical consistency of the resulting ontologies.

5.1.1. Local Data Integration

For each input data source, any related information to the original GO is added incrementally. Starting with the original GO, the related data in gene2go is integrated, followed by gene info, gene neighbors, gene2pubmed, gene2ensembl, and finally gene2sts. The gene2accession, gene2unigene, and gene2vega were not integrated because they are related to other genes and not available in GO or NCBI sample files, as shown in Table 1.
After adding each data source, logical consistency is checked iteratively, using Jena Ontology API, HermiT, and Pellet reasoners. Results showed that integration results pass all the tests all the time, as shown Table 2. The final ontology is taken as a model for comparison with ontologies resulting from the distributed integration. Comparison is based on ontology size before the integration, number of added items, number of roots, total number of genes after integration, number of edges, vertices, and roots.

5.1.2. Distributed Data Integration

We did the integration in the case of 2, 3, 4, and 5 slaves. As an example, Table 3 shows the integration results after adding gene2go, gene info, gene neighbors, gene2pubmed, gene2ensembl, and gene2sts in the case of 3 slaves.
After each integration, the logical consistency for the global and sub-ontologies is checked. We got a pass in all the tests. In addition, we got an equivalent in the case of comparing the global ontology results of the distributed integration with the global ontology results after the local integration. This is shown in Table 4.
At the end of the experiments we found that our proposed distributed integration framework gave the same results as the local data integration. Moreover, each global or sub-ontology passes the logical consistency test (Jena Ontology API, HermiT, and Pellets reasoners). This means that our integration method does not violate any logical consistency rules. Additionally, at the end of each integration step, we got a global ontology equivalent to the one we got from the local integration. The resulting ontology is equivalent in ontology size before the integration, in the number of added items, skipped items, and overlapped items, in ontology size after the integration step, in the number of edges, vertices, and roots.
Although we can get the same result as in local integration in a shorter time, with less processing and overhead, we proposed that the distributed integration have a set of distributed sub-ontologies equivalent to the global one, where we can assign each sub-ontology to one of the slaves for further processing and integration such as in the case of similarity calculation. In this case, we can process each sub-ontology without the overhead of loading all the global ontology in a single machine and RAM that require more efficient computers to accomplish that. As we said before, efficient computers will not solve our problem all the time, since data growth will never be expected nor stop. When we have high performance computing (HPC), we may complete the test at a lower time, but using the enhanced SSMs on the HPC will improve the performance, because of our proposed method of introducing parallel and distributed processing.

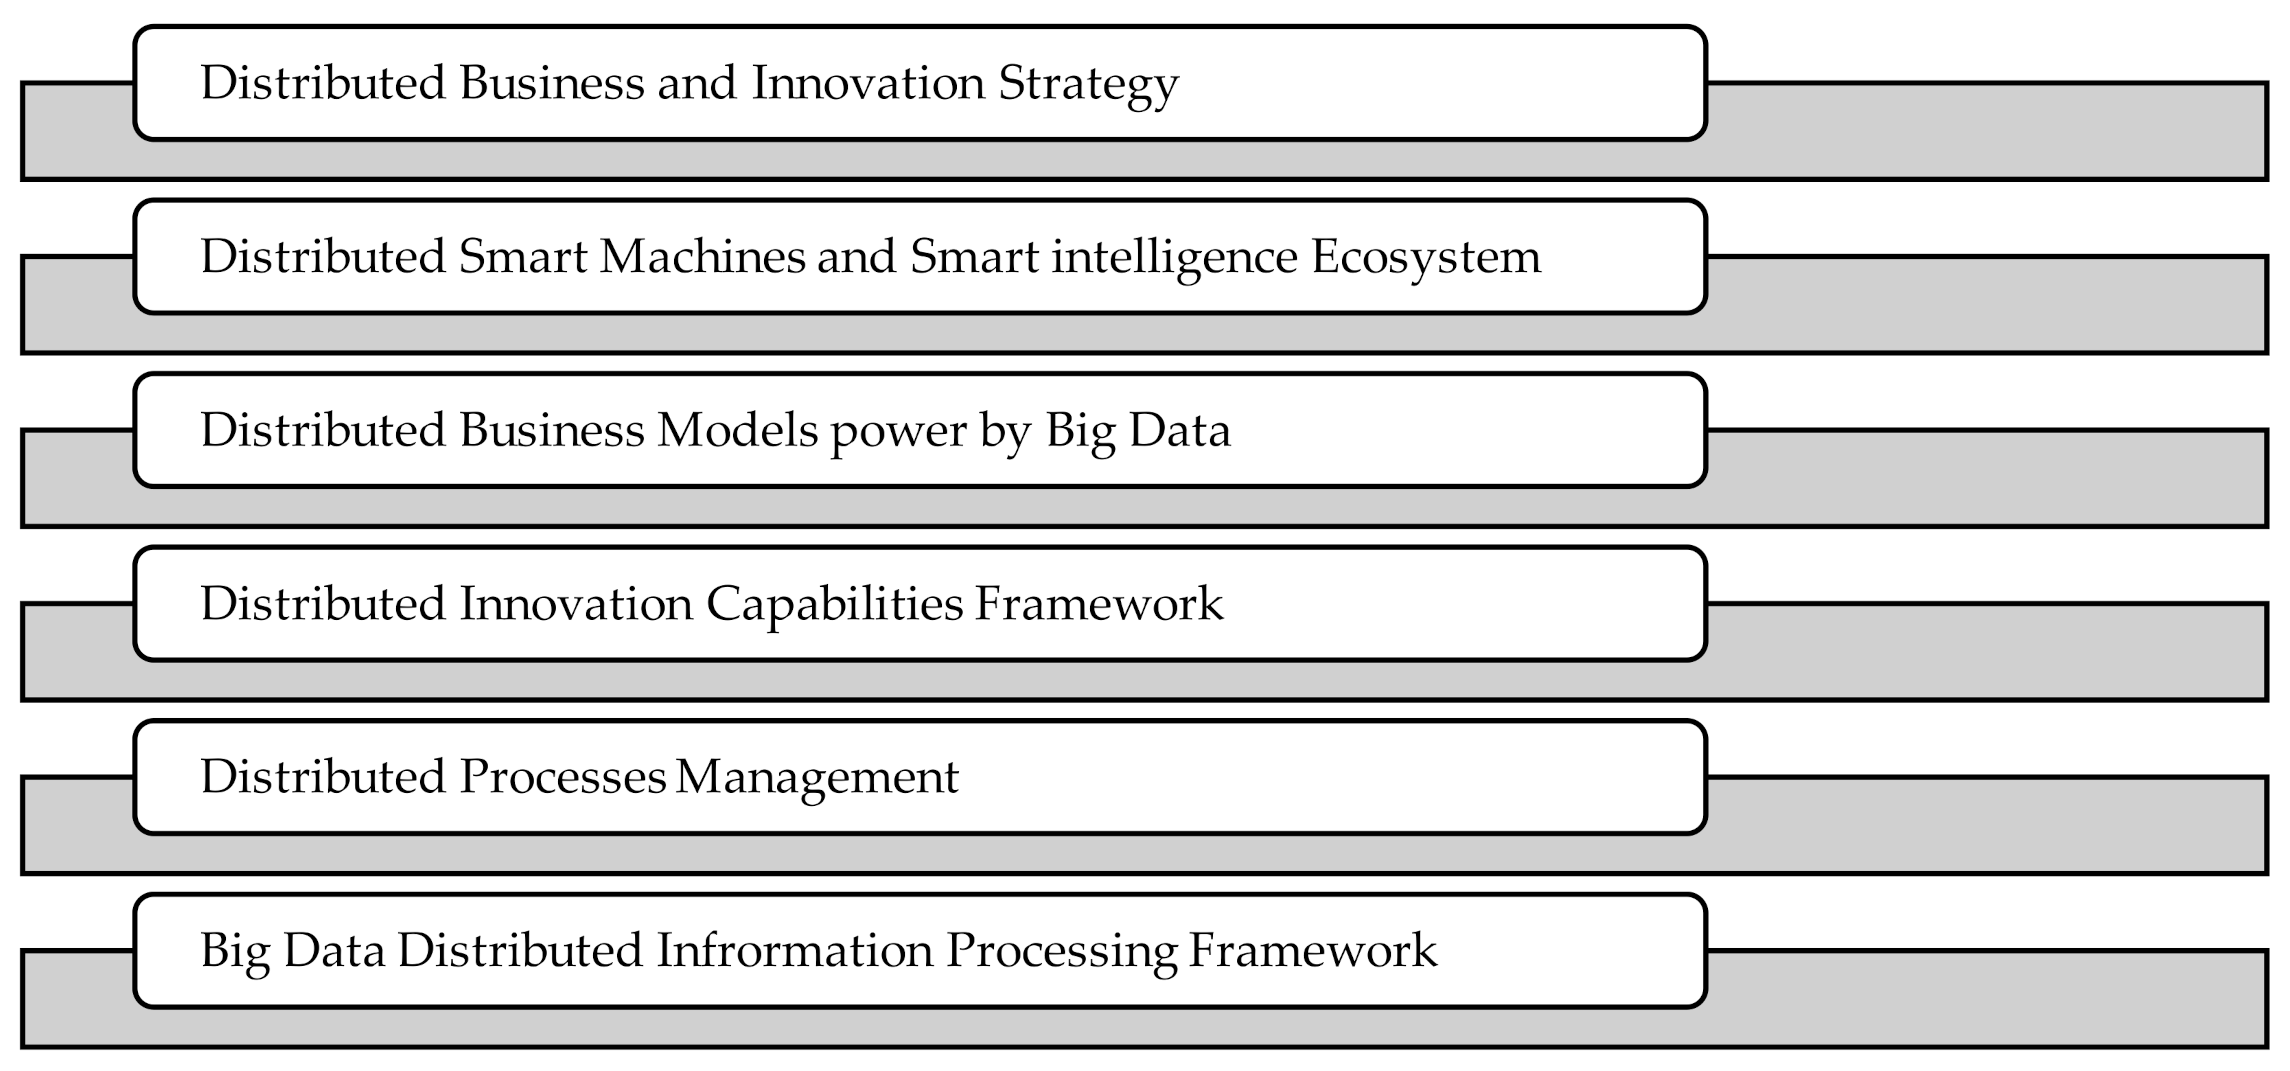
6. Implications of Our Work

In our paper, we have emphasized the capacity of the big data integration framework to provide distributed information processing, providing cost-effective, meaningful ontology integration and interpretation. In fact, the key contribution of our computational framework is summarized in the following sentence: the main goal from the integration and distributed processing is to be able to calculate the SSM of gene pairs easily without a need for very high-performance computers to load the global ontology and calculate the similarity between any gene pairs. Now, we can search for the gene pairs on a set of sub-ontology and calculate the similarity easily and quickly.
The significance of this novel big data integration framework can be seen in various dimensions. First, in the context of contribution to the body of knowledge of bioinformatics, we introduce a sustainable, applied computing approach capable of supporting various added-value services within the context of cloud and edge computing. This is aligned with the vision for smart machines and distributed intelligence [67] and in fact provides a powerful distributed information processing level aiming to support numerous added-value services at a cost-effective manner.
Such a computational distributed information processing framework can also be a bold initiative towards intelligent smart machines capable of exploiting algorithms, logic, and reasoning on the cloud through an integrated IoT, Semantic Web, ontologies and big data ecosystem. This would be an extremely significant contribution for a new generation of smart cities [68] and applied bioinformatics [69] domains.
It also serves as a testbed bed for applications and added-value services in the context of digital transformation. The availability of a reliable, trusted, and efficient big data distributed framework allows the design and implementation of distributed applications and services to empower the digital transformation, as intended by the Vision 2030 in the Kingdom of Saudi Arabia and in other countries around the world today.
We need to emphasize though that this big data distributed framework enables several other value layers, including distributed processes, distributed business models, and distributed strategies for information management and digital transformation.
In the future, we plan to move forward our approach to the next level of analysis, aiming to specify various clusters for distributed intelligence, in all the previous dimensions that are summarized at a high-level of abstraction in Figure 2, below. Six layers of distributed intelligence are highlighted and will be analyzed further in our future combined computer science and business and innovation research:
  • Distributed Business and Innovation Strategy
  • Distributed Smart Machines and Smart intelligence Ecosystem
  • Distributed Business Models power by Big Data
  • Distributed Innovation Capabilities Framework
  • Distributed Processes Management
  • Big Data Distributed Information Processing Framework

7. Conclusion

In this paper, we aimed to show that the distributed big data integration framework gives the same results as those obtained from local integration. Moreover, it did not violate any logical consistency test, including Jena Ontology API, HermiT, and Pellets reasoners. The resulting ontology is equivalent to the ontology resulted from the local integration in terms of: ontology size before the integration, the number of added items, skipped items, and overlapped items, ontology size after integration step, the number of edges, vertices, and roots. This distributed integration framework was not limited to GO; it can be generalized to other areas in biology or any different domain such as medicine, education, pharmacology, weather, or language. Starting from the domain ontology, the Split GO algorithm can be used to divide the domain ontology into a set of sub-ontologies with high similarity within the sub-ontologies and minimum overlap between them, and rendering the split as balanced as possible. Next, each sub-ontology is allocated to one of the slaves before starting the integration process. After that, each slave takes the input data and adds any related data to its sub-ontology and sends the data added to the master node. Finally, the master node removes duplicates and adds the data to the global ontology. As a result, we will have a global ontology that contains all the data and an equivalent version represented by a set of sub-ontologies that can be used for further processing.
The results showed how our proposed approach in the big data integration framework is efficient in integrating data in a distributed manner, and provides the same results as those obtained from the local integration. The distributed integration framework is efficient in solving the issue of big data volume and unceasing growth. These results were mainly limited by the system used to run our assessment. Our system considerably limited our ability to have more VM, processors, and RAM for each virtual machine. If we had had more powerful machines; we could have completed assessments using large sample sizes, which we could not achieve in this study. In future studies, there is a possibility of applying our big data integration framework to other domains, such as pharmacology or medicine.

Author Contributions

A.A. and H.A.-K. proposed the main ideas, A.A. carried out the methodology, results and discussion. Also, A.A. wrote the manuscript, H.A.-K. and A.A-s. administrate project, H.A.-K., A.A.-s. and M.L. provided critical feedback and helped shape the research and enhance the manuscript writing. All authors have read and agreed to the published version of the manuscript.

Funding

This research received no external funding.

Acknowledgments

This research project was supported by a grant from the “Research Center of the Female Scientific and Medical Colleges”, Deanship of Scientific Research, King Saud University.

Conflicts of Interest

The authors declare no conflict of interest.

Acronyms

BDIBig Data Integration
BPBiological Process
CCCellular Components
DWData Warehousing
ECEvidence Code
GAFGene Association File
GOGene Ontology
GPADGene Product Association Data
HPCHigh Performance Computing
IEAInferred from Electronic Annotation
MFMolecular Function
OBOOpen Biomedical Ontology
ROLAPRelational Online Analytical Processing
RDAGRooted Directed Acyclic Graph
SMLSemantic Measure Library and Toolkit
SSMSemantic Similarity Measures
SMB/CIFSServer Message Block/Common Internet File System
VDIVirtual Data Integration
VMVirtual Machines
OWLWeb Ontology Language

References

  1. Sakr, S. Introduction. In Big Data 2.0 Processing Systems: A. Survey; Sakr, S., Ed.; Springer International Publishing: Cham, Switzerland, 2016; pp. 1–13. [Google Scholar]
  2. Laney, D. 3-D Data Management: Controlling Data Volume, Velocity, and Variety, META Group Res. Note 6. J. Data Anal. Inf. Process. 2001, 6, 4. [Google Scholar]
  3. Fan, W.; Bifet, A. Mining big data. ACM SIGKDD Explor. Newsl. 2013, 14, 1–5. [Google Scholar] [CrossRef]
  4. Abawajy, J. Comprehensive analysis of big data variety landscape. Int. J. Parallel Emergent Distrib. Syst. 2014, 30, 5–14. [Google Scholar] [CrossRef]
  5. Cordoba, A. Understanding the Predictive Analytics Lifecycle; John Wiley & Sons: Hoboken, NJ, USA, 2014. [Google Scholar]
  6. Doan, A.; Halevy, A.; Ives, Z. Principles of Data Integration; Elsevier BV: Amsterdam, The Netherlands, 2012. [Google Scholar]
  7. Arputhamary, B.; Arockiam, L. A Review on Big Data Integration. Int. J. Comput. Appl. 2014, 21–26. Available online: https://citeseerx.ist.psu.edu/viewdoc/download?doi=10.1.1.742.2276&rep=rep1&type=pdf (accessed on 1 October 2020).
  8. Dong, X.L.; Srivastava, D. Big data integration. In Proceedings of the 2013 IEEE 29th International Conference on Data Engineering (ICDE), Brisbane, QLD, Australia, 8–11 April 2013; pp. 1245–1248. [Google Scholar]
  9. Reeve, A. Managing Data in Motion; Elsevier BV: Amsterdam, The Netherlands, 2013. [Google Scholar]
  10. Hastings, J. Primer on Ontologies. In Advanced Structural Safety Studies; Springer Science and Business Media LLC: Berlin/Heidelberg, Germany, 2016; Volume 1446, pp. 3–13. [Google Scholar]
  11. Tirmizi, S.H.; Aitken, S.; Moreira, D.A.; Mungall, C.J.; Sequeda, J.F.; Shah, N.H.; Miranker, D.P. Mapping between the OBO and OWL ontology languages. J. Biomed. Semant. 2011, 2, S3. [Google Scholar] [CrossRef] [Green Version]
  12. Protégé. Available online: https://protege.stanford.edu/products.php (accessed on 20 November 2019).
  13. Glimm, B.; Horrocks, I.; Motik, B.; Stoilos, G.; Wang, Z. HermiT: An OWL 2 Reasoner. J. Autom. Reason. 2014, 53, 245–269. [Google Scholar] [CrossRef] [Green Version]
  14. Sirin, E.; Parsia, B.; Grau, B.C.; Kalyanpur, A.; Katz, Y. Pellet: A practical OWL-DL reasoner. J. Web Semant. 2007, 5, 51–53. [Google Scholar] [CrossRef]
  15. Gaudet, P.; Škunca, N.; Hu, J.C.; Dessimoz, C. Primer on the Gene Ontology. Viruses Hum. Cancer 2016, 1446, 25–37. [Google Scholar] [CrossRef] [Green Version]
  16. Thomas, P.D. The Gene Ontology and the Meaning of Biological Function. Methods Mol. Biol. 2016, 1446, 15–24. [Google Scholar] [CrossRef] [Green Version]
  17. Ashburner, M.; Ball, C.A.; Blake, J.A.; Botstein, D.; Butler, H.; Cherry, J.M.; Davis, A.P.; Dolinski, K.; Dwight, S.S.; Eppig, J.T.; et al. Gene Ontology: Tool for the unification of biology. Nat. Genet. 2000, 25, 25–29. [Google Scholar] [CrossRef] [Green Version]
  18. Ehsani, R.; Drabløs, F. TopoICSim: A new semantic similarity measure based on gene ontology. BMC Bioinform. 2016, 17, 296. [Google Scholar] [CrossRef] [Green Version]
  19. The UniProt Consortium UniProt: A hub for protein information. Nucleic Acids Res. 2014, 43, D204–D212. [CrossRef]
  20. Blake, A.J. MGD: The Mouse Genome Database. Nucleic Acids Res. 2003, 31, 193–195. [Google Scholar] [CrossRef] [PubMed] [Green Version]
  21. Cherry, J.M. SGD: Saccharomyces Genome Database. Nucleic Acids Res. 1998, 26, 73–79. [Google Scholar] [CrossRef] [PubMed]
  22. Harris, T.; Antoshechkin, I.; Bieri, T.; Blasiar, D.; Chan, J.; Chen, W.J.; De La Cruz, N.; Davis, P.; Duesbury, M.; Fang, R.; et al. WormBase: A comprehensive resource for nematode research. Nucleic Acids Res. 2009, 38, D463–D467. [Google Scholar] [CrossRef] [PubMed] [Green Version]
  23. McQuilton, P.; Pierre, S.E.S.; Thurmond, J. The FlyBase Consortium FlyBase 101—The basics of navigating FlyBase. Nucleic Acids Res. 2011, 40, D706–D714. [Google Scholar] [CrossRef]
  24. Chisholm, R.L. DictyBase, the model organism database for Dictyostelium discoideum. Nucleic Acids Res. 2006, 34, D423–D427. [Google Scholar] [CrossRef] [Green Version]
  25. Lamesch, P.; Berardini, T.Z.; Li, D.; Swarbreck, D.; Wilks, C.; Sasidharan, R.; Muller, R.; Dreher, K.; Alexander, D.L.; Garcia-Hernandez, M.; et al. The Arabidopsis Information Resource (TAIR): Improved gene annotation and new tools. Nucleic Acids Res. 2011, 40, D1202–D1210. [Google Scholar] [CrossRef]
  26. Altenhoff, A.M.; Studer, R.A.; Robinson-Rechavi, M.W.; Dessimoz, C. Resolving the Ortholog Conjecture: Orthologs Tend to Be Weakly, but Significantly, More Similar in Function than Paralogs. PLoS Comput. Biol. 2012, 8, e1002514. [Google Scholar] [CrossRef] [Green Version]
  27. Guzzi, P.H.; Mina, M.; Guerra, C.; Cannataro, M. Semantic similarity analysis of protein data: Assessment with biological features and issues. Briefings Bioinform. 2011, 13, 569–585. [Google Scholar] [CrossRef] [Green Version]
  28. Chang, K.; He, B.; Zhang, Z. Toward Large Scale Integration: Building a MetaQuerier over Databases on the Web. In Proceedings of the CIDR 2005 Second Biennial Conference on Innovative Data Systems Research, Asilomar, CA, USA, 4–7 January 2005; pp. 44–55. [Google Scholar]
  29. Madhavan, J.; Jeffery, S.R.; Cohen, S.; Dong, X.L.; Ko, D.; Yu, C.; Halevy, A. Web-scale data integration: You can only afford to pay as you go. In Proceedings of the Conference on Innovative Data Systems Research (CIDR), Asilomar, CA, USA, 7–10 January 2007; pp. 342–350. [Google Scholar]
  30. Madhavan, J.; Ko, D.; Kot, Ł.; Ganapathy, V.; Rasmussen, A.; Halevy, A. Google’s Deep Web crawl. Proc. VLDB Endow. 2008, 1, 1241–1252. [Google Scholar] [CrossRef] [Green Version]
  31. Cafarella, M.J.; Halevy, A.; Wang, D.Z.; Wu, E.; Zhang, Y. Webtables: Exploring the power of tables on the web. Proc. VLDB Endow. 2008, 1, 538–549. [Google Scholar] [CrossRef]
  32. Pimplikar, R.; Sarawagi, S. Answering table queries on the web using column keywords. Proc. VLDB Endow. 2012, 5, 908–919. [Google Scholar] [CrossRef]
  33. Gupta, R.; Sarawagi, S. Answering table augmentation queries from unstructured lists on the web. Proc. VLDB Endow. 2009, 2, 289–300. [Google Scholar] [CrossRef]
  34. Elmeleegy, H.; Madhavan, J.; Halevy, A. Harvesting relational tables from lists on the web. Proc. VLDB Endow. 2009, 2, 1078–1089. [Google Scholar] [CrossRef] [Green Version]
  35. Sen, S. Integrating XML Data into Multiple Rolap Data Warehouse Schemas. Int. J. Softw. Eng. Appl. 2012, 3, 197–206. [Google Scholar] [CrossRef] [Green Version]
  36. Schultz, A.; Matteini, A.; Isele, R.; Mendes, P.N.; Bizer, C.; Becker, C. LDIF-a framework for large-scale Linked Data integration. In Proceedings of the 21st International World Wide Web Conference (WWW 2012), Lyon, France, 16–20 April 2012. [Google Scholar]
  37. Grolinger, K.; Capretz, M.A.; Mezghani, E.; Exposito, E. Knowledge as a Service Framework for Disaster Data Management. In Proceedings of the 2013 Workshops on Enabling Technologies: Infrastructure for Collaborative Enterprises, Hammamet, Tunisia, 17–20 June 2013; pp. 313–318. [Google Scholar]
  38. Naseer, A.; Laera, L.; Matsutsuka, T. Enterprise BigGraph. In Proceedings of the 2013 46th Hawaii International Conference on System Sciences, Wailea, HI, USA, 7–10 January 2013; pp. 1005–1014. [Google Scholar]
  39. Bansal, S.K. Towards a Semantic Extract-Transform-Load (ETL) Framework for Big Data Integration. In Procession of the 2014 IEEE International Congress on Big Data, Anchorage, AK, USA, 27 June–2 July 2014; pp. 522–529. [Google Scholar]
  40. Aggoune, A.; Bouramoul, A.; Kholladi, M.-K. Big data integration: A semantic mediation architecture using summary. In Proceedings of the 2016 2nd International Conference on Advanced Technologies for Signal and Image Processing (ATSIP), Monastir, Tunisia, 21–24 March 2016; pp. 21–25. [Google Scholar]
  41. Williams, J.W.; Cuddihy, P.; McHugh, J.; Aggour, K.S.; Menon, A.; Gustafson, S.M.; Healy, T. Semantics for Big Data access & integration: Improving industrial equipment design through increased data usability. In Proceedings of the 2015 IEEE International Conference on Big Data (Big Data), Santa Clara, CA, USA, 29 October–1 November 2015; pp. 1103–1112. [Google Scholar]
  42. Mezghani, E.; Exposito, E.; Drira, K.; Da Silveira, M.; Pruski, C. A Semantic Big Data Platform for Integrating Heterogeneous Wearable Data in Healthcare. J. Med Syst. 2015, 39, 185. [Google Scholar] [CrossRef]
  43. Ostrowski, D.; Rychtyckyj, N.; Macneille, P.; Kim, M. Integration of Big Data Using Semantic Web Technologies. In Proceedings of the 2016 IEEE Tenth International Conference on Semantic Computing (ICSC), Laguna Hills, CA, USA, 4–6 February 2016; pp. 382–385. [Google Scholar]
  44. Sandhya, H.; Roy, M.M. Data Integration of Heterogeneous Data Sources Using QR Decomposition. In Advances in Intelligent Systems and Computing; Springer Science and Business Media LLC: Berlin/Heidelberg, Germany, 2015; Volume 385, pp. 333–344. [Google Scholar]
  45. Legaz-García, M.D.C.; Miñarro-Giménez, J.A.; Menárguez-Tortosa, M.; Fernández-Breis, J.T. Generation of open biomedical datasets through ontology-driven transformation and integration processes. J. Biomed. Semant. 2016, 7, 32. [Google Scholar] [CrossRef] [Green Version]
  46. Bortoli, S.; Bouquet, P.; Pompermaier, F.; Molinari, A. Semantic big data for tax assessment. In Proceedings of the International Workshop on Software Engineering in Healthcare Systems—SEHS ’16, Austin, TX, USA, 14–15 May 2016; Association for Computing Machinery (ACM): New York, NY, USA, 2016; pp. 1–6. [Google Scholar]
  47. Sheokand, V.; Singh, V. Modeling Data Heterogeneity Using Big DataSpace Architecture. In Software Engineering in Intelligent Systems; Springer Science and Business Media LLC: Berlin/Heidelberg, Germany, 2016; Volume 452, pp. 259–268. [Google Scholar]
  48. Iyappan, A.; Kawalia, S.B.; Raschka, T.; Hofmann-Apitius, M.; Senger, P. NeuroRDF: Semantic integration of highly curated data to prioritize biomarker candidates in Alzheimer’s disease. J. Biomed. Semant. 2016, 7, 45. [Google Scholar] [CrossRef] [Green Version]
  49. Obitko, M.; Jirkovský, V. Big Data Semantics in Industry 4.0. In Lecture Notes in Computer Science; Springer Science and Business Media LLC: Berlin/Heidelberg, Germany, 2015; pp. 217–229. [Google Scholar]
  50. Bansal, S.K.; Kagemann, S. Integrating Big Data: A Semantic Extract-Transform-Load Framework. IEEE Comput. 2015, 48, 42–50. [Google Scholar] [CrossRef] [Green Version]
  51. Abbes, H.; Gargouri, F. Big Data Integration: A MongoDB Database and Modular Ontologies based Approach. Procedia Comput. Sci. 2016, 96, 446–455. [Google Scholar] [CrossRef] [Green Version]
  52. Jirkovsky, V.; Obitko, M.; Mařík, V. Understanding Data Heterogeneity in the Context of Cyber-Physical Systems Integration. IEEE Trans. Ind. Informatics 2016, 13, 660–667. [Google Scholar] [CrossRef]
  53. Sevilla, J.; Segura, V.; Podhorski, A.; Guruceaga, E.; Mato, J.M.; Martínez-Cruz, L.A.; Corrales, F.; Rubio, A. Correlation between Gene Expression and GO Semantic Similarity. IEEE ACM Trans. Comput. Biol. Bioinform. 2005, 2, 330–338. [Google Scholar] [CrossRef] [PubMed]
  54. Almasoud, A.M.; Al-Khalifa, H.S.; Al-Salman, A.M.S. Handling Big Data Scalability in Biological Domain Using Parallel and Distributed Processing: A Case of Three Biological Semantic Similarity Measures. BioMed Res. Int. 2019, 2019, 6750296. [Google Scholar] [CrossRef]
  55. Jena Ontology API—Apache Jena. Available online: https://jena.apache.org/documentation/ontology/ (accessed on 11 November 2019).
  56. Harispe, S.; Ranwez, S.; Janaqi, S.; Montmain, J. The semantic measures library and toolkit: Fast computation of semantic similarity and relatedness using biomedical ontologies. Bioinformatics 2013, 30, 740–742. [Google Scholar] [CrossRef] [Green Version]
  57. JCIFS. Available online: https://jcifs.samba.org/ (accessed on 5 May 2018).
  58. Gene_Info. Available online: Ftp://ftp.ncbi.nlm.nih.gov/gene/DATA/gene_info.gz (accessed on 11 November 2019).
  59. Gene2go. Available online: Ftp://ftp.ncbi.nlm.nih.gov/gene/DATA/gene2go.gz (accessed on 11 November 2019).
  60. Gene_Neighbors. Available online: Ftp://ftp.ncbi.nlm.nih.gov/gene/DATA/gene_neighbors.gz (accessed on 11 November 2019).
  61. “gene2ensembl”. Available online: Ftp://ftp.ncbi.nlm.nih.gov/gene/DATA/gene2ensembl.gz (accessed on 11 November 2019).
  62. Gene2pubmed. Available online: Ftp://ftp.ncbi.nlm.nih.gov/gene/DATA/gene2pubmed.gz (accessed on 11 November 2019).
  63. Gene2sts. Available online: Ftp://ftp.ncbi.nlm.nih.gov/gene/DATA/gene2sts (accessed on 11 November 2019).
  64. Gene2accession. Available online: Ftp://ftp.ncbi.nlm.nih.gov/gene/DATA/gene2accession.gz (accessed on 11 November 2019).
  65. Gene2vega. Available online: Ftp://ftp.ncbi.nlm.nih.gov/gene/DATA/gene2vega.gz (accessed on 11 November 2019).
  66. Gene2unigene. Available online: Ftp://ftp.ncbi.nlm.nih.gov/gene/DATA/gene2unigene (accessed on 11 November 2019).
  67. Lytras, M.D.; Raghavan, V.; Damiani, E. Big Data and Data Analytics Research. Int. J. Semantic Web Inf. Syst. 2017, 13, 1–10. [Google Scholar] [CrossRef]
  68. Visvizi, A.; Lytras, M.D. Rescaling and refocusing smart cities research: From mega cities to smart villages. J. Sci. Technol. Policy Manag. 2018, 9, 134–145. [Google Scholar] [CrossRef]
  69. Spruit, M.; Lytras, M.D. Applied data science in patient-centric healthcare: Adaptive analytic systems for empowering physicians and patients. Telemat. Inform. 2018, 35, 643–653. [Google Scholar] [CrossRef]
Figure 1. Big Data Integration Framework.
Applsci 10 07092 g001
Figure 2. Six layers of distributed intelligence.
Applsci 10 07092 g002
Table 1. Local Data Integration Summary.
Ontology Size beforeSample SizeAdded ItemsAdded RootsOntology Size afterEdgesVerticesRoots
Original GO36,63936,6390036,63971,57736,6393
gene2go36,63955,85955,964192,604239,470148,5684
gene_info92,60456,60355,9641148,569295,435148,5695
gene_neighbors148,56956,64755,9641204,534407,364204,5346
gene2pubmed204,53456,04455,9641260,499519,293260,4997
gene2ensembl260,49956,64755,9641316,464631,222316,4648
gene2sts316,46456,64756,6471373,112744,517403,9549
gene2accession373,11218,142,09400373,112744,517403,9549
gene2unigene373,11258922100373,112744,517403,9549
gene2vega373,1128482800373,112744,517403,9549
Table 2. Logical Consistency Tests and Results.
Jena Ontology APIHermiT ReasonerPellet Reasoner
Original GOpasspasspass
gene2gopasspasspass
gene_infopasspasspass
gene_neighborspasspasspass
gene2pubmedpasspasspass
gene2ensemblpasspasspass
gene2stspasspasspass
Table 3. Results of adding input sample files in the case of 3 slaves.
Ontology Size beforeAdded ItemsAdded RootsSkipped ItemsOverlapped ItemOntology Size afterEdgesVerticesRoots
Results of adding gene2go
Master36,63955,9641112,35092,604239,470148,5684
Slave 114,2818,279147,74312,35022,56159,22232,433434
Slave 212,34316,023139,99912,35028,36770,99545,036692
Slave 315,82744,012112,01012,35059,840156,785104,797123
Results of adding gene info
Master92,60455,9641112,350148,569295,435148,5695
Slave 122,5618,279148,36912,35030,84167,50232,434435
Slave 228,36716,023140,62512,35044,39187,01945,037693
Slave 359,84044,012112,63612,350103,853200,798104,798124
Results of adding gene_ neighbors
Master148,56955,9641112,349204,534407,364204,5346
Slave 130,8418,279148,36912,34939,12184,06140,714436
Slave 244,39116,023140,62512,34960,415119,06661,061694
Slave 3103,85344,012112,63612,349147,866288,823148,811125
Results of adding gene2pubmed
Master204,53455,9641112,349260,499519,293260,4997
Slave 139,1218,279148,36912,34947,401100,62048,994437
Slave 260,41516,023140,62512,34976,439151,11377,085695
Slave 3147,86644,012112,63612,349191,879376,848192,824126
Results of adding gene2ensembl
Master260,49955,9641112,349316,464631,222316,4648
Slave 147,4018,279148,36912,34955,681117,17957,274438
Slave 276,43916,023140,62512,34992,463183,16093,109696
Slave 3191,87944,012112,63612,349235,892464,873236,837127
Results of adding gene2sts
Master316,46456,6471111,112373,112744,517403,9549
Slave 155,6818,220147,98411,11263,902133,62073,061439
Slave 292,46315,894140,31011,112108,358214,949123,144697
Slave 3235,89243,646112,55811,112279,539552,166311,612127
Table 4. Logical consistency tests and comparing the global ontology to the one generated from the local integration in the case of 3 slaves.
Jena APIHermiT ReasonerPellets ReasonerCompared to Local Integration
Masterpasspasspassequivalent
Slave 1passpasspassNA
Slave 2passpasspassNA
Slave 3passpasspassNA

