Article

Investigation of the Electroluminescence Mechanism of GaN-Based Blue and Green Light-Emitting Diodes with Junction Temperature Range of 120–373 K

Jiangsu Provincial Key Laboratory of Advanced Photonic and Electronic Materials and the School of Electronic Science and Engineering, Nanjing University, Nanjing 210023, China
*
Author to whom correspondence should be addressed.
Appl. Sci. 2020, 10(2), 444; https://doi.org/10.3390/app10020444
Submission received: 10 December 2019 / Revised: 31 December 2019 / Accepted: 3 January 2020 / Published: 8 January 2020
(This article belongs to the Section Applied Physics General)

Abstract

:
Junction temperature (Tj) and current have important effects on light-emitting diode (LED) properties. Therefore, the electroluminescence (EL) spectra of blue and green LEDs were investigated in a Tj range of 120–373 K and in a current range of 80–240 mA based on accurate real-time measurements of Tj using an LED with a built-in sensor unit. Two maxima of the emission peak energy with changing Tj were observed for the green LED, while the blue LED showed one maximum. This was explained by the transition between the donor-bound excitons (DX) and free excitons A (FXA) in the green LED. At low temperatures, the emission peak energy, full width at half maximum (FWHM), and radiation power of the green LED increase rapidly with increasing current, while those of the blue LED increase slightly. This is because when the strong spatial potential fluctuation and low exciton mobility in the green LED is exhibited, with the current increasing, more bonded excitons are found in different potential valleys. With a shallower potential valley and higher exciton mobility, excitons are mostly bound around the potential minima. The higher threshold voltage of the LEDs at low temperatures may be due to the combined effects of the band gap, dynamic resistance, piezoelectric polarization, and electron-blocking layer (EBL).

1. Introduction

GaN-based light-emitting diodes (LEDs) have been widely used for industrial lighting and outstanding backlight in liquid crystal displays and have become an increasingly important technology [1,2,3]. In particular, tunable white-light engines (changing color temperature), high-quality display, and tunable color lighting (changing color) have attracted intense interest [4]. Generally, LEDs are tuned by adjusting the injection currents of the different color LEDs. In addition, the driving current, and thus the light output power (LOP), can also be changed to obtain higher current density and light intensity. However, changing the current will lead to a change in the junction temperature (Tj) and emission peak wavelength [5], and the Tj itself is also a key factor influencing the LED emission peak [6]. For some use in manufacturing applications, LED lighting must be able to function in extreme ambient conditions, such as a high-temperature environment (furnace lighting) and freezing environment (hyperborean lighting). In the future, LED may be used in the much lower temperature, such as aerospace engineering. To fabricate a LED module with better color quality or better color coordinates, or with application in extreme temperature range, it is necessary to understand the electroluminescence mechanism in LEDs under wide range of the Tj and the injection current.
Investigation of photoluminescence (PL) and electroluminescence (EL) properties of InGaN LED in the low temperature attracted lots of research for years because it is necessary for better understanding of the mechanism of the luminescence. Kazlauskas et al. had used the PL to study the dynamics of photoexcited excitons in InGaN/GaN with different indium compositions in the temperature range of 10–300 K [7]. Wang et al. had measured the PL properties in the temperature range of 6–300 K, and found the temperature dependences of the peak energy and linewidth are induced by the localized carrier hopping and thermalization process [8]. PL was used by Sabbar et al. to calculate the spontaneous emission quantum efficiency (QE) of blue, green, and red LED from temperature 77 K to 800 K [9]. However, there are few reports about the EL properties of InGaN/GaN LEDs in the low temperature (below 220 K) because Tj is hard to determine. Generally, it is difficult to determine Tj with high current injection for temperatures under 213 K due to the self-heating of the LED, and it is also difficult to perform EL measurements at such low temperatures. Peter et al. used a highly spectrally and spatially resolved scanning electroluminescence microscopy to trace detailed spectra of an InGaN/GaN LED at 300 K [10]. Hetzel et al. have measured the spectra of the LEDs at 4.2 and 77 K, rather than in a continuous range of low temperatures [11].
In this work, we investigated the electroluminescence (EL) properties of blue and green GaN-based LEDs in the temperature range of 120–373 K, using specially designed LEDs with a built-in Tj sensor unit. To the best of our knowledge, this work is the first detailed report of the changes of the EL spectra with changes in Tj and current. We investigated the mechanisms of the LED peak energy changes, and in particular the effect of the injection current and Tj on the emission peak energy. It was found that the EL and electrical properties of blue LED are different from those of green LED, and the origins of these differences are elucidated and described in detail.

2. Materials and Methods

2.1. LED Epilayer Structure

One typical blue LED sample and one typical green LED sample fabricated based on commercial epi-wafers were measured. The commercial epi-wafers with InGaN/GaN multiple quantum well (MQW) active layers were grown on sapphire substrates. The details of the LED structure are shown in Figure 1. There were 11 periods of InGaN/GaN MQW layers in blue LED, and there were 9 periods of InGaN/GaN MQW layers in green LED. Due to the commercial secrets, the detailed width and composition of MQW are not clear.

2.2. Chip and Package Strucure and Tj Measurement Method

Due to nanoscale dimensions of the junction, Tj is hard to determine directly and accurately, especially at low temperatures [11,12]. In the recent years, many researchers have sought to develop methods for accurate Tj measurements at high temperatures [12,13]. Lee and Park reported an advanced direct measurement technique using the nematic liquid crystals thermography in 2004, the measurement accuracy was within ±1 K [14]. Xi et al. had developed a theoretical model for the relationship between the forward voltage (VF) of LED and the Tj, the theory was verified by experimental data, and they had accurately measured the Tj of ultraviolet LEDs using the VF [15,16,17].
In this work, Tj was accurately measured in wide range with a built-in Tj sensor unit. The structure and dimensions of the LED with the Tj sensor unit have been described elsewhere [18,19]. The designed chip was composed of a single light-emitting unit with the dimensions of 750 × 430 μm2, and a single sensor unit. The chips were packaged without phosphor using a four-lead high-power lead frame, and the packages were mounted on the metal-core printed circuit board (MCPCB).
Since the sensor unit is smaller and is located next to the LED unit, the Tj of the LED unit was approximately equal to that of the sensor unit. In the experiment described below, the forward voltage (VF) of the sensor diode was used to characterize the Tj [15,17]. In the ambient temperature range from 77 K to room temperature, the temperature was controlled by placing the samples in a liquid nitrogen tank at different distances above the liquid nitrogen level. For the ambient temperatures in the range from room temperature to ~350 K, the temperature was controlled by placing the samples into an oven whose temperature resolution was 0.1 K and temperature fluctuation within ±0.5 K.
First, the VFTj relationship of the sensor unit was calibrated. A Keithley 2636B SourceMeter was used as the current source and voltage/current meter. The package temperature was measured using a thermocouple closely attached to the heat slug of the package. To avoid the generation of a temperature difference between the heat slug and the p–n junction caused by the self-heating during the calibration, a weak testing current of 500 μA was used. The VF of the sensor unit was measured after the reading of the thermocouple was stable for at least 15 min.

2.3. EL Measurement under Different Tj

After VFTj calibration, the EL spectra were measured using an Everfine ATA-500 auto-temperature LED opto-electronic analyzer (Hangzhou, China). In the ambient temperature range from 77 K to room temperature, the EL spectra were measured using a 4 inch polytetrafluoroethylene (PTFE) integrating sphere (IS). PTFE was used because of its good reflectivity and excellent stability at low temperatures. The samples were mounted on the lower hole of the IS and the fiber was mounted onto the upper hole of the IS, and a PTFE slice was placed in the middle to block the direct light from the LED to the fiber. The IS was connected to the Everfine ATA-500 instrument with a fiber and their positions were fixed during the measurements. The ambient temperature was adjusted by changing the height of the liquid nitrogen tank. For the ambient temperature in the range of ~290–350 K, the auto-temperature stage and IS within the ATA-500 instrument were used for temperature control and EL spectra measurements, respectively. The VF of the sensor unit and the EL spectra were collected simultaneously.
EL spectra were measured in the Tj range of about 110 K to about 380 K and with forward current (IF) of 80~240 mA at 40 mA interval.

2.4. VF Measurement of LED Unit under Different Tj

Since real-time Tj could be measured by our method, we repeatedly recorded VF of the LED unit and the real-time Tj under certain IF at time intervals of 10 s when Tj slowly changed. Then, we got the VF at certain Tj and forward current from the recorded data.

3. Results

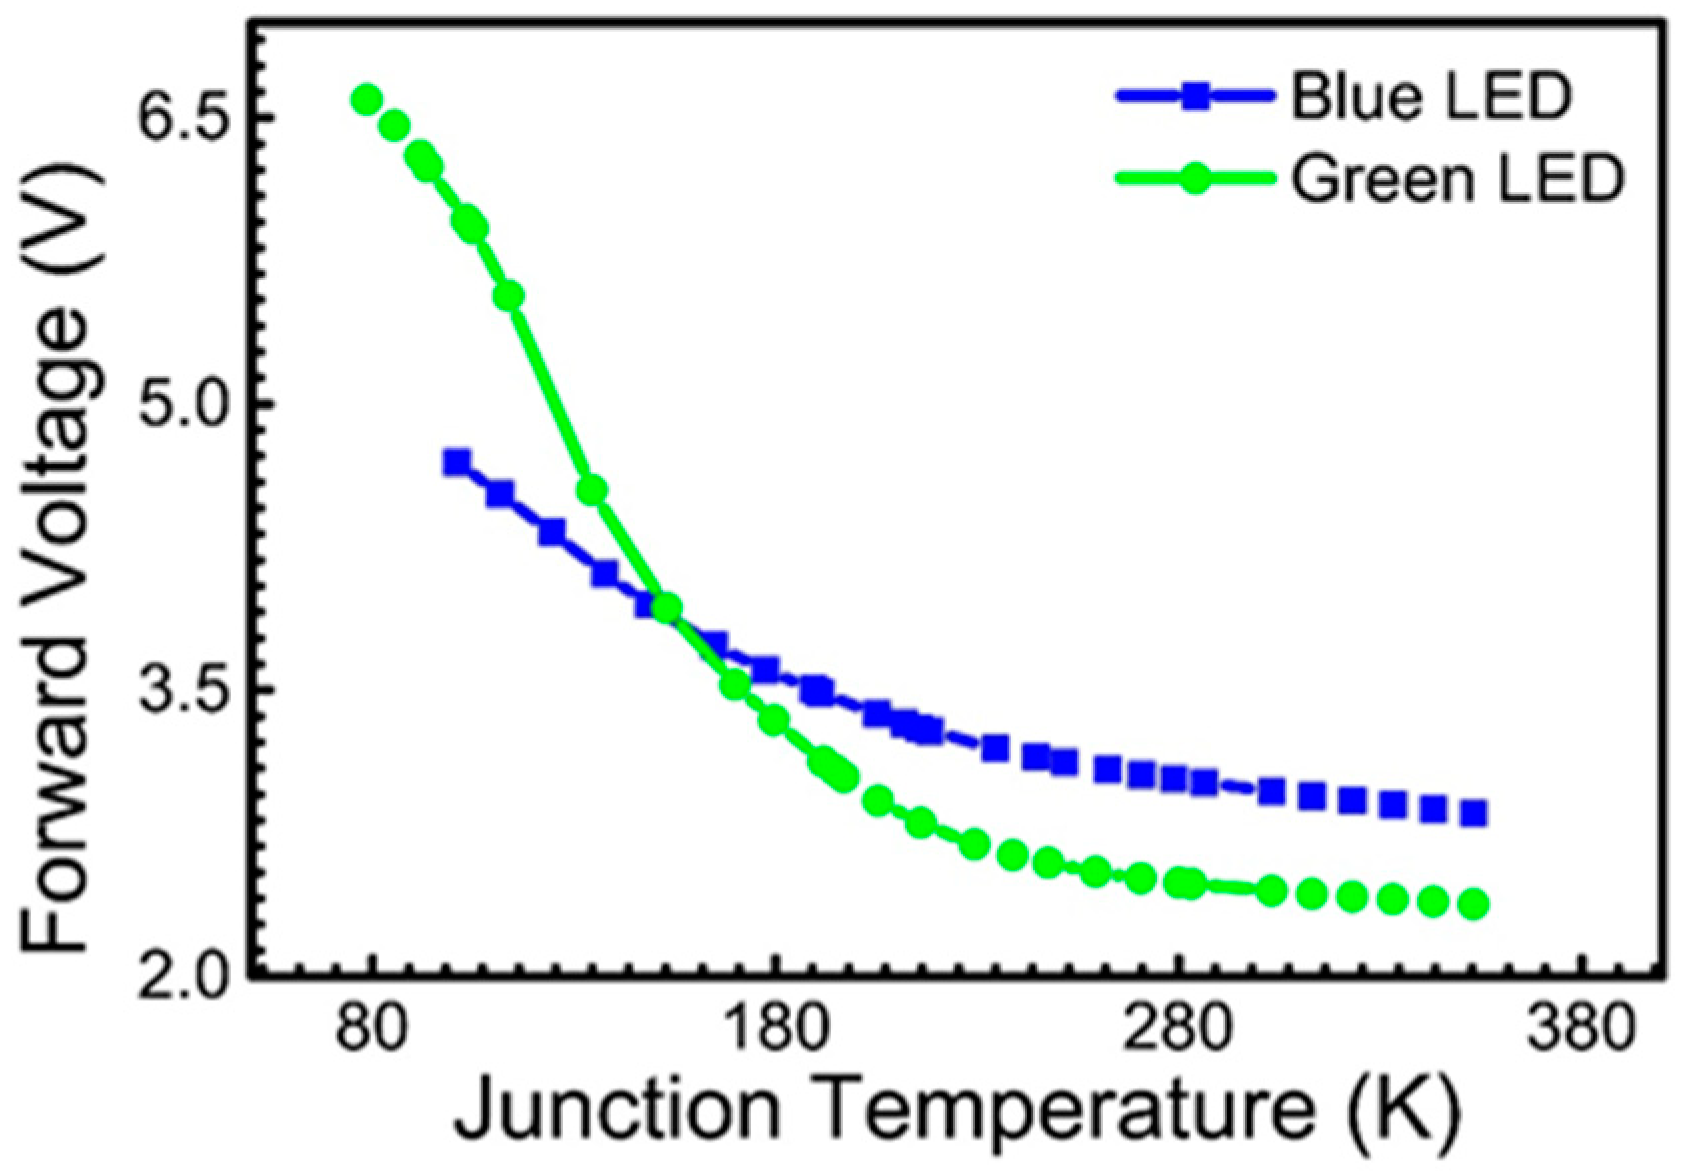
3.1. VF-Tj Calibration

Figure 2 shows the VFTj relationship of the sensor unit. The results show that VF decreased monotonically with Tj. Therefore, Tj was calculated by simply using the linear interpolation of the data presented in Figure 2. It was observed that at high temperatures (above 150 K), VF of the green LED was lower than that of the blue LED. This can be attributed to the different energy band diagrams of the blue LED and the green LED. At the low temperature limit, the VF value and the slope of VF plotted versus Tj of the green LED were both higher than those of the blue LED, which may be due to the difference in the energy band diagrams and p-GaN doping of the two LEDs, and the difference in the ohmic contacts between the green and blue LEDs [17,20,21].

3.2. EL Spectra, Peak Energy, Full Width at Half Maximum, and Radiation Power

Part of the normalized EL spectra at selected Tj for the blue and green LED at 80 mA and 240 mA are presented in Figure 3 for demonstration. We extracted the emission peak energies, full width at half maximum (FWHM), and radiation power from the EL spectra. Figure 4 shows the plot of the emission peak energy of the blue and green LEDs versus Tj at different forward currents. As Tj increased, the emission peak energy first showed a blueshift and then a redshift. Green LED showed two maxima, while blue LED showed only one maximum. Figure 5 shows the plot of FWHM of EL spectra for the blue and green LEDs versus Tj at different forward currents. Figure 6 shows the radiation power for the blue and green LEDs versus Tj at different forward currents.

3.3. Electrical Properties of LEDs

VF of the LED unit at different Tj and IF for blue and green LEDs are shown in Figure 7.

4. Discussions

4.1. Emission Peak Energy vs. Tj

The emission peak shift can be described by a band-tail model [22]:
E g T = E g ( 0 ) α T 2 β + T σ 2 k T
where α and β are Varshni parameters, and Eg(0) and Eg(T) are the band gap values at 0 K and at temperature T, respectively. The second term is about the band gap shrinkage with increasing temperature, leading to the redshift of the emission peak in the temperature range of ~175–373 K. The last term describes the redshift of the Stokes type, where σ is the degree of the localized effect of the carriers, and k is the Boltzmann constant [23]. Indium composition fluctuations lead to the spontaneous formation of indium-rich regions, and the presence of such regions in addition to the presence of doping elements and crystalline quality of the hetero- and homoepitaxial material lead to potential fluctuations in the InGaN alloy layers [24]. The band-tail states also mean the potential fluctuations in energy band structure, and they would capture the carriers and excitons to generate the localized carriers and bound excitons. The larger the σ value is, the deeper extension of the tails into the forbidden band and the greater degree of the localized effect of the carriers [25]. The potential fluctuations are sufficiently strong to provide efficient luminescence centers because these states can confine electrons and holes at the same sites [26]. Due to the fact that the density-of-states of the tails is much lower, the occupation of the higher energy states of the tails is more obvious than the occupation in regular energy bands with the increasing Tj [24]. In the temperature range of ~120–175 K, thermalized bound excitons occupy higher energy states, and the effect of the blueshift is stronger than the effect of the temperature-induced band gap shrinkage with temperature increasing, leading to the blueshift of the emission peak energy [22,27].
Using Equation (1) to fit the blue LED data, the fitting curve is presented in Figure 8a and shows good agreement with the experimental data.
Two maxima were found in the curve of the emission peak energy as a function of the Tj of green LED, indicating that a transition between two different main luminescence mechanisms occurs as the Tj of the green LED changes. Therefore, the data cannot be fitted with a single set of parameters. As reported previously, excitons play an important role in light emission in GaN and related alloys [28,29,30]. Compared to the blue LEDs, larger potential fluctuations, and thus deeper band tails in the green LEDs, cause easier caption of the excitons by defect states. At low temperatures, the recombination of the donor-bound excitons (DX) may be the main source of light emission. As the exciton localization energy of DX is low, the DX escape the trap states as the temperature increases, transforming into free excitons (FX), and the amount of free excitons A (FXA) increases rapidly [31]. Therefore, FXA start to play an increasingly important role in the luminescence at high temperatures. Due to its large exciton binding energy, FXA is dominant even at room temperature [30]. To fit the data for the green LED in Figure 8b, we used two groups of parameters for the data near the left extreme value and in the low temperature region, and for the data near the right extreme value and in the high temperature region, respectively. Since the exciton localization energy of DX was previously reported to be approximately 6 meV [31], the band width difference between the two fitting curves was set to 6 meV in our curve fitting. The fitting curves of the green LED are shown in Figure 8b and agree well with the experimental data, except that due to the transition of the main luminescence mechanism from DX-based to FXA-based, the data in the intermediate temperature region are not fitted very well. Thus, we concluded that the main luminescence mechanism of green LED is dominated by DX at low temperatures, and transitions to FXA-dominated at high temperatures, giving rise to two extreme values.
The value of the fit σ of the blue LED was approximately 30 meV, and that of the green LED was approximately 34.3 meV. A larger σ means a stronger localization effect on average, which is mainly caused by the indium composition fluctuation [25]. In this work, the transition between the FXA-dominated mechanism and DX-dominated mechanism was not observed in the blue LED. This is because of the weaker localization effect of the blue LED, meaning the DX is not a dominant luminescence mechanism as in green LED at low temperatures of this experiment. Therefore, a single peak energy was observed for the blue LED. Meanwhile, based on the previous studies, it is likely that the transition between FXA-dominated and DX-dominated mechanism should appear at lower temperatures [32,33]. Due to the limitations of the experimental setup used in this work, studies of such a low-temperature experimental range have not been completed and will be the subject of future research.

4.2. Difference of the Infucence of the Current at the High Temperature and the Low Temprature

Figure 9a shows the relationship between the emission peak energies of the blue and green LEDs and the current for Tj of 250 K, derived from Figure 4a. It was observed that the emission peak energy has a linear relationship with the current and increases with increasing current. This relationship is attributed to the electric field formed by the increased carrier concentration that decreases the impact of the quantum-confined Stark effect (QCSE) [26,34] and the energy band filling effect [35,36]. The excitons’ lifetime decreased in the high-temperature range, and therefore, as the current increased the excitons could not occupy the lower energy state prior to the recombination, leading to the blue shift of the emission peak [27]. Since many higher energy extended states may be present, this kind of recombination will be accompanied by the linewidth broadening, as shown in Figure 9c, which is derived from Figure 5a. The same reason can also cause increase of the radiation power, as can be figured out in Figure 6. The slope of the emission peak energy plotted versus the current of the green LED was 1.59 × 10⁻⁴ eV/mA, and that of the blue LED was 6.34 × 10⁻⁵ eV/mA. A higher slope implies a stronger potential fluctuation, indicating that the potential fluctuation of the green LED is much stronger than that of blue LED. Thus, compared to the blue LED, the potential valley of the green LED is deeper and contains more states, leading to a higher slope.
Comparison of Figure 6 and Figure 9a,c shows that in the high-temperature range (200 K or higher), the emission peak energy, FWHM, and radiation power of both the blue and green LEDs increased with increasing current density. The reason is discussed in the last paragraph. However, in the low-temperature range (below 150 K), the emission peak energy, FWHM, and the radiation power of the blue LED showed only a slight change with increasing current, while the corresponding values of the green LED still increased strongly with increasing current, as shown in Figure 6 and Figure 9b,d. This difference can be explained by the band filling in real space of the LED at low temperatures, as will be discussed below.
Compared to high temperatures, for current injection at low temperatures, the exciton lifetime is long enough for the excitons to relax to the potential minima [8,37,38]. Due to the strong spatial potential fluctuations and the low exciton mobility in the green LED, the excitons in the potential minima were restricted and bound. As mentioned above, the excitons play an important role in light emission in InGaN. Thus, exciton recombination mainly occurs at the position of the potential valley [28]. Figure 10 shows a two-dimensional diagram depicting the conduction band, motion of electrons in excitons, and radiative combination due to the potential fluctuation along the real space x-axis. It is a simplified version of the three-dimensional diagram depicting the potential fluctuation along the real space xy-plane [39]. The black solid dots represent excitons (electrons), the curved lines interpret the conduction band, and the dashed line stands for different filling levels of the excitons (electrons) at different currents (I1, I2 and I3). As shown in Figure 10a, when the current increased from I1 to I2 and I3, the increased excitons were distributed among the higher-energy potential minima, leading to the existence of more radiative centers and more recombination excitons. Since potential minima are deep and mobility of excitons is relative low in the green LEDs (due to large potential fluctuation), excitons are inclined to be bound by potential minima with different positions and different energy levels. This leads to the greater FWHM and radiation power of the green LED with the increase of IF.
The smaller indium content in the blue LED leads to weaker potential fluctuation and higher exciton mobility. Therefore, the excitons can easily move between the shallower potential valleys, are less likely to be bound in the shallower potential valleys, and thus, those shallower potential valleys do not contribute to the LED luminescence. Only the deeper potential can capture excitons and release radiation emission. A schematic of the blue LED is shown in Figure 10b, and it was observed that when the current was I1, the filling of the potential minima reached saturation. Even when the current increased to I2, the number of excitons participating in radiative recombination did not increase. As the current increased, the increased carriers circulated from the conduction band and the valence band, forming a leakage current and not participating in radiative recombination [40]. Therefore, the current has no significant influence on the peak energy, FWHM, and the radiation power of the blue LED at low temperatures. Consequently, the difference in the electrooptical properties between the green LED and the blue LED can be explained.

4.3. Electrical Analysis

We fitted the linear relationship between the forward current in the 80–240 mA range and VF and calculated the intercept at the VF axis. The fitting and deriving of intercept with Tj = 193 K for blue LED is shown in Figure 7a. We mention the intercept as threshold voltage (VTH) below. Figure 11a shows the calculated threshold voltages of the blue and green LEDs at different Tj, and it is observed that the threshold voltage increased rapidly with decreasing Tj. The relationship between the band gap and Tj was fitted by Equation (1), as discussed above. Based on the aforementioned data, the increase in the band gap was much smaller than the increase in the threshold voltage. Dynamic resistance is the reciprocal of the slope of the above-mentioned I–V curve, and the dynamic resistance results are shown in Figure 7b. It was observed that when Tj decreased from 350 to 200 K, the dynamic resistance of the blue LED remained basically unchanged, while that of the green LED increased. When Tj dropped from 200 to 150 K, the dynamic resistance of the blue LED increased, while that of the green LED changed slightly. Overall, the increased dynamic resistance was a minor cause of the increased threshold voltage. The increase in the threshold voltage was much larger than the voltage due to the band gap and dynamic resistance. Due to the fact that the lattice expansion coefficient of GaN was larger than that of InGaN, the piezoelectric polarization caused by lattice mismatch was greater at low temperatures than at higher temperatures [41,42,43]. An electron-blocking layer (EBL) can decrease the injection efficiency of holes at low temperatures, requiring high voltage to overcome the barrier [44]. The higher threshold voltage of the LED at a low temperature compared to that at a high temperature may be caused by the combined effects of the band gap, dynamic resistance, piezoelectric polarization, and EBL.

5. Conclusions

EL spectra of blue and green LEDs at various junction temperatures and forward currents were investigated. The Tj was measured by a built-in sensor on the LED chip, enabling accurate real-time Tj measurements and EL spectrum measurements for the LEDs under a high forward current and in a wide range of Tj. To the best of our knowledge, this work is the first investigation of the changes in the EL spectrum under high current density in a large temperature range, particularly in the range of 120–220 K. Both blue and green LEDs first showed a blueshift and then a redshift of the emission peak as the temperature increased from ~120 K to ~350 K. Green LED showed two maxima in the plot of the emission peak energy versus temperature, which can be explained by the transition of the main luminescence mechanism of the green LED from DX recombination to FXA recombination. No change in the main luminescence mechanism was observed in the blue LED in the similar temperature range. We attribute this to the higher degree of localization and lower exciton mobility in the green LED compared to those in the blue LED. The transition of the luminescence mechanism from FXA-dominated to DX-dominated occurred at approximately 180 K in the green LED, and it is possible that in the blue LED, this transition occurs at a temperature that is lower than the temperature range examined in this work, which needs to be investigated in the future work. According to the band-tail model, in the low-temperature region, excitons are mainly bonded around the potential minima. Therefore, in the green LED with strong potential fluctuation and lower exciton mobility, an increase in the current supplied a greater number of excitons to be bound at the potential minima at different positions and different energy levels, so that the emission peak energy, FWHM, and radiation power increased rapidly with increasing current at low temperatures (below 150 K). By contrast, in the blue LED, the potential fluctuation was weaker and exciton mobility was higher, leading to only a slight change of the emission peak energy, the FWHM, and radiation power of blue LED at low temperatures (below 150 K). The threshold voltages of the blue and green LEDs were higher at low temperatures, and the increased voltage was most likely due to the combined effect of the band gap, dynamic resistance, piezoelectric polarization, and EBL.

Author Contributions

Conceptualization, Y.Z. (Yugang Zhou); methodology, Y.Z. (Yugang Zhou), S.P., and C.S.; validation, C.S. and W.C.; formal analysis, C.S., W.C., and S.P.; investigation, S.P. and C.S.; resources, Y.Z. (Yugang Zhou); data curation, C.S.; writing—original draft preparation, S.P. and C.S.; writing—review and editing, Y.Z. (Yugang Zhou); supervision, Y.Z. (Yugang Zhou); funding acquisition, Y.Z. (Yugang Zhou), R.Z., and Y.Z. (Youdou Zheng). All authors have read and agreed to the published version of the manuscript.

Funding

This research was funded by the National Natural Science Foundation of China under Grant (Grant Nos. 61634005), National Key R&D Program of China (Grant No. 2016YFB0400904).

Acknowledgments

This work was supported by Collaborative Innovation Center of Solid-State Lighting and Energy-Saving Electronics and a project funded by the Priority Academic Program Development of Jiangsu Higher Education Institutions (PAPD).

Conflicts of Interest

The authors declare no conflict of interest.

References

  1. Jang, E.; Jun, S.; Jang, H.; Lim, J.; Kim, B.; Kim, Y. White-light-emitting diodes with quantum dot color converters for display backlights. Adv. Mater. 2010, 22, 3076–3080. [Google Scholar] [CrossRef]
  2. Olivier, F.; Daami, A.; Licitra, C.; Templier, F. Shockley-Read-Hall and Auger non-radiative recombination in GaN based LEDs: A size effect study. Appl. Phys. Lett. 2017, 111. [Google Scholar] [CrossRef]
  3. Nakamura, S. Nobel Lecture: Background story of the invention of efficient blue InGaN light emitting diodes. Rev. Mod. Phys. 2015, 87, 1139–1151. [Google Scholar] [CrossRef]
  4. Chakrabarti, M.; Pedersen, H.C.; Petersen, P.M.; Poulsen, C.; Poulsen, P.B.; Dam-Hansen, C. High-flux focusable color-tunable and efficient white-light-emitting diode light engine for stage lighting. Opt. Eng. 2016, 55. [Google Scholar] [CrossRef] [Green Version]
  5. Wang, J.C.; Fang, C.H.; Wu, Y.F.; Chen, W.J.; Kuo, D.C.; Fan, P.L.; Jiang, J.A.; Nee, T.E. The effect of junction temperature on the optoelectrical properties of InGaN/GaN multiple quantum well light-emitting diodes. J. Lumin. 2012, 132, 429–433. [Google Scholar] [CrossRef]
  6. Tao, X.; Hui, S.Y.R. Dynamic Photoelectrothermal Theory for Light-Emitting Diode Systems. IEEE Trans. Ind. Electron. 2012, 59, 1751–1759. [Google Scholar] [CrossRef] [Green Version]
  7. Kazlauskas, K.; Tamulaitis, G.; Pobedinskas, P.; Žukauskas, A.; Springis, M.; Huang, C.-F.; Cheng, Y.-C.; Yang, C.C. Exciton hopping inInxGa1−xNmultiple quantum wells. Phys. Rev. B 2005, 71. [Google Scholar] [CrossRef]
  8. Wang, H.; Ji, Z.; Qu, S.; Wang, G.; Jiang, Y.; Liu, B.; Xu, X.; Mino, H. Influence of excitation power and temperature on photoluminescence in InGaN/GaN multiple quantum wells. Opt. Express 2012, 20, 3932–3940. [Google Scholar] [CrossRef]
  9. Sabbar, A.; Madhusoodhanan, S.; Al-Kabi, S.; Dong, B.; Wang, J.; Atcitty, S.; Kaplar, R.; Ding, D.; Mantooth, A.; Yu, S.-Q.; et al. High Temperature and Power Dependent Photoluminescence Analysis on Commercial Lighting and Display LED Materials for Future Power Electronic Modules. Sci. Rep. 2019, 9, 16758. [Google Scholar] [CrossRef]
  10. Fischer, P.; Christen, J.; Zacharias, M.; Schwegler, V.; Kirchner, C.; Kamp, M. Direct imaging of the spectral emission characteristic of an InGaN/GaN-ultraviolet light-emitting diode by highly spectrally and spatially resolved electroluminescence and photoluminescence microscopy. Appl. Phys. Lett. 1999, 75, 3440–3442. [Google Scholar] [CrossRef]
  11. Hetzel, R.; Leising, G. Current density impact on the emission behavior of GaN-based blue emitting LEDs in the temperature range of 4.2–400 K. Phys. Status Solidi A Appl. Mater. Sci. 2014, 211, 1660–1667. [Google Scholar] [CrossRef]
  12. Keppens, A.; Ryckaert, W.R.; Deconinck, G.; Hanselaer, P. High power light-emitting diode junction temperature determination from current-voltage characteristics. J. Appl. Phys. 2008, 104. [Google Scholar] [CrossRef]
  13. Todoroki, S.; Sawai, M.; Aiki, K. Temperature distribution along the striped active region in high-power GaAlAs visible lasers. J. Appl. Phys. 1985, 58, 1124–1128. [Google Scholar] [CrossRef]
  14. Lee, C.C.; Park, J. Temperature Measurement of Visible Light-Emitting Diodes Using Nematic Liquid Crystal Thermography with Laser Illumination. IEEE Photonics Technol. Lett. 2004, 16, 1706–1708. [Google Scholar] [CrossRef]
  15. Xi, Y.; Schubert, E.F. Junction–temperature measurement in GaN ultraviolet light-emitting diodes using diode forward voltage method. Appl. Phys. Lett. 2004, 85, 2163–2165. [Google Scholar] [CrossRef] [Green Version]
  16. Xi, Y.; Xi, J.Q.; Gessmann, T.; Shah, J.M.; Kim, J.K.; Schubert, E.F.; Fischer, A.J.; Crawford, M.H.; Bogart, K.H.A.; Allerman, A.A. Junction and carrier temperature measurements in deep-ultraviolet light-emitting diodes using three different methods. Appl. Phys. Lett. 2005, 86. [Google Scholar] [CrossRef]
  17. Xi, Y.; Gessmann, T.; Xi, J.; Kim, J.K.; Shah, J.M.; Schubert, E.F.; Fischer, A.J.; Crawford, M.H.; Bogart, K.H.A.; Allerman, A.A. Junction Temperature in Ultraviolet Light-Emitting Diodes. Jpn. J. Appl. Phys. 2005, 44, 7260–7266. [Google Scholar] [CrossRef] [Green Version]
  18. Li, J.M.; Zhou, Y.G.; Qi, Y.D.; Miao, Z.L.; Wang, Y.M.; Xiu, X.Q.; Liu, B.; Zhang, R.; Zheng, Y.D. In-Situ Measurement of Junction Temperature and Light Intensity of Light Emitting Diodes with an Internal Sensor Unit. IEEE Electron. Device Lett. 2015, 36, 1082–1084. [Google Scholar] [CrossRef]
  19. Wang, X.L.; Zhou, Y.G.; Tian, R.B.; Liu, B.; Xie, Z.L.; Zhang, R.; Zheng, Y.D. Study of LED Thermal Resistance and TIM Evaluation Using LEDs With Built-in Sensor. IEEE Photonics Technol. Lett. 2017, 29, 1856–1859. [Google Scholar] [CrossRef]
  20. Mao, Q.H.; Liu, J.L.; Quan, Z.J.; Wu, X.M.; Zhang, M.; Jiang, F.Y. Influences of p-type layer structure and doping profile on the temperature dependence of the foward voltage characteristic of GaInN light-emitting diode. Acta Phys. Sin. 2015, 64, 6. [Google Scholar] [CrossRef]
  21. Meyaard, D.S.; Cho, J.; Fred Schubert, E.; Han, S.-H.; Kim, M.-H.; Sone, C. Analysis of the temperature dependence of the forward voltage characteristics of GaInN light-emitting diodes. Appl. Phys. Lett. 2013, 103. [Google Scholar] [CrossRef] [Green Version]
  22. Eliseev, P.G.; Perlin, P.; Lee, J.; Osiński, M. “Blue” temperature-induced shift and band-tail emission in InGaN-based light sources. Appl. Phys. Lett. 1997, 71, 569–571. [Google Scholar] [CrossRef]
  23. Eliseev, P. The red σ2/kT spectral shift in partially disordered semiconductors. J. Appl. Phys. 2003, 93, 5404–5415. [Google Scholar] [CrossRef]
  24. Eliseev, P.G.; Osinski, M.; Lee, J.Y.; Sugahara, T.; Sakai, S. Band-tail model and temperature-induced blue-shift in photoluminescence spectra of InxGa1-xN grown on sapphire. J. Electron. Mater. 2000, 29, 332–341. [Google Scholar] [CrossRef]
  25. Liu, W.; Zhao, D.G.; Jiang, D.S.; Chen, P.; Liu, Z.S.; Zhu, J.J.; Shi, M.; Zhao, D.M.; Li, X.; Liu, J.P.; et al. Localization effect in green light emitting InGaN/GaN multiple quantum wells with varying well thickness. J. Alloys Compd. 2015, 625, 266–270. [Google Scholar] [CrossRef]
  26. Chichibu, S.; Azuhata, T.; Sota, T.; Nakamura, S. Spontaneous emission of localized excitons in InGaN single and multiquantum well structures. Appl. Phys. Lett. 1996, 69, 4188–4190. [Google Scholar] [CrossRef]
  27. Xu, X.; Wang, Q.; Li, C.; Ji, Z.; Xu, M.; Yang, H.; Xu, X. Enhanced localisation effect and reduced quantum-confined Stark effect of carriers in InGaN/GaN multiple quantum wells embedded in nanopillars. J. Lumin. 2018, 203, 216–221. [Google Scholar] [CrossRef]
  28. Gurioli, M.; Vinattieri, A.; Martinez-Pastor, J.; Colocci, M. Exciton thermalization in quantum-well structures. Phys. Rev. B Condens. Matter 1994, 50, 11817–11826. [Google Scholar] [CrossRef]
  29. Rodina, A.V.; Dietrich, M.; Göldner, A.; Eckey, L.; Hoffmann, A.; Efros, A.L.; Rosen, M.; Meyer, B.K. Free excitons in wurtzite GaN. Phys. Rev. B 2001, 64. [Google Scholar] [CrossRef]
  30. Monemar, B.; Paskov, P.P.; Bergman, J.P.; Toropov, A.A.; Shubina, T.V.; Malinauskas, T.; Usui, A. Recombination of free and bound excitons in GaN. Phys. Status Solidi B 2008, 245, 1723–1740. [Google Scholar] [CrossRef]
  31. Kornitzer, K.; Ebner, T.; Thonke, K.; Sauer, R.; Krichner, C.; Schwegler, V.; Kamp, M.; Leszczynski, M.; Grzegory, I.; Porowski, S. Photoluminescence and reflectance spectroscopy of excitonic transitions in high-quality homoepitaxial GaN films. Phys. Rev. B 1999, 60, 1471–1473. [Google Scholar] [CrossRef]
  32. Leroux, M.; Grandjean, N.; Beaumont, B.; Nataf, G.; Semond, F.; Massies, J.; Gibart, P. Temperature quenching of photoluminescence intensities in undoped and doped GaN. J. Appl. Phys. 1999, 86, 3721–3728. [Google Scholar] [CrossRef]
  33. Calleja, E.; Sanchez-Garcia, M.A.; Sanchez, F.J.; Calle, F.; Naranjo, F.B.; Munoz, E.; Jahn, U.; Ploog, K. Luminescence properties and defects in GaN nanocolumns grown by molecular beam epitaxy. Phys. Rev. B 2000, 62, 16826–16834. [Google Scholar] [CrossRef] [Green Version]
  34. Wang, C.K.; Chiang, T.H.; Chen, K.Y.; Chiou, Y.Z.; Lin, T.K.; Chang, S.P.; Chang, S.J. Investigating the Effect of Piezoelectric Polarization on GaN-Based LEDs With Different Quantum Barrier Thickness. J. Disp. Technol. 2013, 9, 207–211. [Google Scholar] [CrossRef]
  35. Ling, S.C.; Wang, T.C.; Chen, J.R.; Liu, P.C.; Ko, T.S.; Chang, B.Y.; Lu, T.C.; Kuo, H.C.; Wang, S.C.; Tsay, J.D. Characteristics of a-Plane Green Light-Emitting Diode Grown on r-Plane Sapphire. IEEE Photonics Technol. Lett. 2009, 21, 1130–1132. [Google Scholar] [CrossRef] [Green Version]
  36. Arnaudov, B.; Domanevskii, D.S.; Evtimova, S.; Ivanov, C.; Kakanakov, R. Band-filling effect on the light emission spectra of InGaN/GaN quantum wells with highly doped barriers. Microelectron. J. 2009, 40, 346–348. [Google Scholar] [CrossRef]
  37. Binder, J.; Korona, K.P.; Wysmołek, A.; Kamińska, M.; Köhler, K.; Kirste, L.; Ambacher, O.; Zając, M.; Dwiliński, R. Dynamics of thermalization in GaInN/GaN quantum wells grown on ammonothermal GaN. J. Appl. Phys. 2013, 114. [Google Scholar] [CrossRef]
  38. Li, Y.; Deng, Z.; Ma, Z.; Wang, L.; Jia, H.; Wang, W.; Jiang, Y.; Chen, H. Visualizing carrier transitions between localization states in a InGaN yellow–green light-emitting-diode structure. J. Appl. Phys. 2019, 126. [Google Scholar] [CrossRef]
  39. Alexandrov, D. Excitons of the structure in wurtzite InxGa1-xN and their properties. J. Cryst. Growth 2002, 246, 325–340. [Google Scholar] [CrossRef]
  40. Cho, J.; Schubert, E.F.; Kim, J.K. Efficiency droop in light-emitting diodes: Challenges and countermeasures. Laser Photonics Rev. 2013, 7, 408–421. [Google Scholar] [CrossRef]
  41. Jain, S.C.; Willander, M.; Narayan, J.; Overstraeten, R.V. III–nitrides: Growth, characterization, and properties. J. Appl. Phys. 2000, 87, 965–1006. [Google Scholar] [CrossRef] [Green Version]
  42. Chuang, S.L.; Chang, C.S. k center dot p method for strained wurtzite semiconductors. Phys. Rev. B 1996, 54, 2491–2504. [Google Scholar] [CrossRef] [PubMed]
  43. Chuang, S.L. Optical gain of strained wurtzite GaN quantum-well lasers. IEEE J. Quantum Electron. 1996, 32, 1791–1800. [Google Scholar] [CrossRef]
  44. Jia, X.; Zhou, Y.; Liu, B.; Lu, H.; Xie, Z.; Zhang, R.; Zheng, Y. A simulation study on the enhancement of the efficiency of GaN-based blue light-emitting diodes at low current density for micro-LED applications. Mater. Res. Express 2019, 6. [Google Scholar] [CrossRef]
Figure 1. Scheme of the InGaN/GaN light-emitting diode (LED) in this work.
Applsci 10 00444 g001
Figure 2. Relationship of forward voltage (VF) and junction temperature (Tj) for blue and green LEDs with the sensor unit.
Applsci 10 00444 g002
Figure 3. Normalized electroluminescence (EL) spectra at selected Tj for the blue LED at (a) 80 mA and (b) 240 mA, and for the green LED at (c) 80 mA and (d) 240 mA.
Applsci 10 00444 g003
Figure 4. Relationship between the emission peak energy and Tj for the (a) blue LED and (b) green LED.
Applsci 10 00444 g004
Figure 5. Relationship between the full width at half maximum (FWHM) of the EL spectra and Tj for the (a) blue LED and (b) green LED.
Applsci 10 00444 g005
Figure 6. Relationship between radiation power and Tj of (a) blue and (b) green LEDs at different currents.
Applsci 10 00444 g006
Figure 7. Forward current vs. forward voltage at different Tj for blue LED (a) and green LED (b). The linear fitting (dotted line) at Tj = 193 K for blue LED is shown in Figure 7a. The intercept of the fitting line at the x-axis is VTH.
Applsci 10 00444 g007
Figure 8. Fitting curves of Varshni’s formula for (a) blue LED and (b) green LED at 80 mA.
Applsci 10 00444 g008
Figure 9. Relationship between the emission peak energy and current for the blue and green LEDs at (a) 250 K and (b) 150 K. Relationship between the FWHM and current of the blue and green LEDs at (c) 250 K and (d) 150 K.
Applsci 10 00444 g009
Figure 10. Transport mechanism of the excitons in quantum wells at low temperatures for (a) green LED and (b) blue LED.
Applsci 10 00444 g010
Figure 11. (a) Relationship between the threshold voltage and Tj. (b) Relationship between the dynamic resistance and Tj.
Applsci 10 00444 g011

