Article

Field-Applicable Pig Anomaly Detection System Using Vocalization for Embedded Board Implementations

1
Department of Computer Information Science, Korea University, Sejong Campus, Sejong City 30019, Korea
2
Department of Computer Convergence Software, Korea University, Sejong Campus, Sejong City 30019, Korea
*
Authors to whom correspondence should be addressed.
Appl. Sci. 2020, 10(19), 6991; https://doi.org/10.3390/app10196991
Submission received: 9 September 2020 / Revised: 5 October 2020 / Accepted: 5 October 2020 / Published: 7 October 2020
(This article belongs to the Special Issue Deep Learning-Based Smart Farm Techniques)

Abstract

:
Failure to quickly and accurately detect abnormal situations, such as the occurrence of infectious diseases, in pig farms can cause significant damage to the pig farms and the pig farming industry of the country. In this study, we propose an economical and lightweight sound-based pig anomaly detection system that can be applicable even in small-scale farms. The system consists of a pipeline structure, starting from sound acquisition to abnormal situation detection, and can be installed and operated in an actual pig farm. It has the following structure that makes it executable on the embedded board TX-2: (1) A module that collects sound signals; (2) A noise-robust preprocessing module that detects sound regions from signals and converts them into spectrograms; and (3) A pig anomaly detection module based on MnasNet, a lightweight deep learning method, to which the 8-bit filter clustering method proposed in this study is applied, reducing its size by 76.3% while maintaining its identification performance. The proposed system recorded an F1-score of 0.947 as a stable pig’s abnormality identification performance, even in various noisy pigpen environments, and the system’s execution time allowed it to perform in real time.

1. Introduction

In Korea, the share of the livestock industry in the agriculture sector accounts for 41.8% of approximately 40 billion dollars, of which the largest portion is pig breeding. Despite this being an important industry, Korea’s marketed-pigs per sow per year (MSY) is merely 17.8, which is very low compared to 31 in Denmark, a country advanced in livestock production [1]. One of the main reasons for this low performance in Korea is the difficulty of a small number of managers of small and medium-sized pig farms to effectively and meticulously manage numerous pigs in enclosed pigpens with very poor air quality, which is a bad living condition that negatively affects the animals’ welfare and that unfortunately still exists in countries underdeveloped in the livestock industry such as Korea. Therefore, it is difficult for those farms to quickly and accurately detect two of the most common causes of swine mortality, namely pig respiratory diseases and aggressive behaviors between pigs, resulting from financial and practical challenges.
Recently, several studies have been reported to detect abnormalities in livestock using sound sensors to guarantee animals’ health and welfare without affecting farm budgets. These methods are not only cost effective, as they are cheaper than other sensors, but also more practical and animal friendly because they collect data constantly for 24 h a day without causing any stress or discomfort to the animals [2,3,4,5,6,7,8]. In the case of chickens, certain studies that employed sound data include a study of hens’ stress caused by temperature changes based on the results of vocalization analysis [2]; studies on the detection of respiratory diseases based on broilers’ sneezing and coughing [3,4]; and a study that attempted to detect avian influenza using chicken sound data [5]. Similarly, in the case of cattle, certain studies employed sound to detect cows’ estrous [6] and respiratory diseases [7,8]. In conclusion, sound data are important as they allow retrieving information that can be useful for detecting abnormalities in livestock.
In this study, we focus on a new method to quickly and accurately detect abnormalities in pigs based on sound data to effectively manage and eliminate anomalies in livestock. Studies that detect abnormalities using sound also exist in the swine research field. Table 1 summarizes the qualitative characteristics of recent studies [9,10,11,12,13,14,15,16] that focused on sound-based pig abnormality detection. These studies are largely divided into detecting coughing sounds caused by diseases and screams caused by stress because a failure in early detection of respiratory diseases and aggressive behaviors among weaning pigs owing to social conflict will result in serious financial damage [14,15,16,17]. In early studies, abnormal pig sounds were detected using the statistical significance of time domain or frequency domain features [9,10,11,12]. However, recent studies have employed machine learning techniques to improve the accuracy of abnormality detection [13,16].
There were shortcomings and restrictions in the applied usage of previous studies because their main purpose was solely to verify whether the vocalization of pigs could be employed to detect abnormal behaviors in the pigpen. Some of the most relevant limitations of existing sound-based pig abnormality detection studies include the following:
  • Majority of studies presented methods that can only be performed and reproduced in restricted laboratory environments.
  • Only a few studies have applied the automatic detection and localization of pig sound events in untrimmed sound data, without manual editing.
  • Though a study reported the effects of noise on cough sound detection performance [10], studies that attempted to detect abnormal situations while guaranteeing robustness to noise are rare.
  • No previous study explored the feasibility of implementing a real-time economic abnormality detection system in a low-cost computing environment for small/medium-size farms. The term “real-time” was used to describe a study in one paper [10], but the content did not specify any measurement of the execution time for us to verify the real-time processing status.
However, when the research team interviewed the managers of small/medium-sized pig farms to better understand their needs, they put forward the following conditions to be met by the pig abnormality detection system: (1) Low price; (2) 24-hours monitoring; (3) The false alarm rate must be low whereas the abnormality detection performance must be high; (4) The system must be noise robust if it relies on sound, as there is a considerable amount of noise in piggeries; and (5) The sensors must be periodically replaced because their data collection functionalities deteriorate from the constant exposure to gases such as ammonia, hydrogen sulfide, and methane generated in pigpens with poor air circulation.
In this study, we propose a low-cost real-time sound-based pig abnormality monitoring system that can be installed in real pigpens and operate for 24 h a day in an embedded environment that has limited computing resources, without needing a personal computer (PC) environment. First, the system employs an adaptive context attachment model (ACAM)-based noise-robust voice activity detection (VAD) algorithm, which can effectively detect sound regions even in noisy environments, to detect the sound regions in the data received from the sound sensor [18,19,20,21]. Then, each detected sound region is converted into a spectrogram, containing both frequency and time information, before feeding it to the lightweight deep learning model, MnasNet [22]. The filter or kernel of the neural network is pruned using the filter clustering method proposed in this study that improves the processing speed while maintaining the abnormality detection performance. In addition, we used a convolutional neural network (CNN) based deep learning structure in this study because it guarantees an effective abnormality detection performance even in various noisy environments [23,24,25]. The remainder of this paper is organized as follows. In Section 2, we describe the noise-robust sound-based pig anomaly detection system that is deployed in an embedded board and can process data in real time. In Section 3, we present the performance and experimental results of the proposed system. In Section 4, we draw conclusions and discuss future research.

2. Embedded Board-Based Real-Time Pig Abnormality Detection System

The structure of the sound-based real-time pig anomaly detection system proposed in this study is illustrated in Figure 1. Data acquisition, preprocessor, and anomaly detector were implemented in the embedded system TX-2 board [26].

2.1. Data Acquisition and Preprocessor

Various sounds produced by pigs were collected using the audio sensor installed in the pigpen and then transmitted to the preprocessing module where the end point detector was employed to detect the area where sound is present in the signal. In general, traditional techniques using the time domain or frequency domain characteristics of a signal have a low sound region detection rate performance when a strong signal to noise ratio (SNR) is present in the sound signal [19]. In addition, they are highly vulnerable to background noise in the case of threshold-based end point detection [19]. However, in this study, pig sounds had to be acquired from pigpens where various environmental noises (such as the footsteps of pigs and the music played inside pigpens) were constantly present.
In this study, to detect sounds inside piggeries, we applied a VAD [18] algorithm that used a deep learning-based pattern-matching algorithm and guaranteed good and noise-robust sound detection performance. This VAD model was implemented based on ACAM, and the introduction of the attention technique further improved the sound detection performance, even in noisy situations [19,20,21]. In the VAD system, during the initialization process, the algorithm first converts the sound signal into overlapped frame information with 25   ms and 10   ms shifts, and then, adds context information before inputting the signal to the decoder. Thereafter, through the decoder, attention, encoder, and long short-term memory (LSTM)-based core processes, it is determined whether the corresponding signal frame region is sound (see Figure 2). In this study, we modified certain parameters of the algorithm and used it to acquire the sound generated by pigs in pigpens. The specifics of the algorithm and user-defined parameters are fully described in [18]. Once the sound region was detected in the signal, it was converted into a spectrogram and transmitted to the anomaly detector.

2.2. Anomaly Detector

In this module, the CNN-based MnasNet structure generated sound features and classified them to detect the sound anomalies of pigs. At this level, and to deploy it to the embedded system, the smaller the amount of filter calculation of the deep learning structure is, the better it is. To this end, the number of filters of the basic structure of MnasNet was controlled using a filter clustering method.

2.2.1. MnasNet

The CNN algorithm is considered an important breakthrough in the image classification field, and the application of models based on it showed a remarkable increase in image recognition performance. This resulted in the CNN algorithm being employed in various fields of study [27,28,29,30]. Recently, different attempts to run such high-performance CNN models in a low-computing environment such as mobile ones have been reported [31,32]. The representative hand-crafted CNN models in low-computing environments include MobileNet and MobileNetV2, which demonstrated stable identification performances in a mobile environment [31,32]. In addition, studies on neural architecture search (NAS), which automatically generates suitable models for specific target problems based on reinforcement learning (RL) rather than by hand-crafting a CNN model, has been conducted [33,34]. Based on this concept, studies have attempted to automatically generate a model to apply such an NAS to a mobile environment rather than a PC environment, and the representative result of this study is known as mobile neural architecture search (MNAS) [22]. Unlike NAS, which emphasizes only the high accuracy of the generated model, the process of retrieving the CNN model using MNAS considers the hardware in which the generated model will be deployed. The search process for MNAS is optimized using Equation (1) [22].
m a x i m i z e m   A C C m   ×   L A T m T w
To generate and optimize model m , MNAS attempts to maximize the value obtained by calculating the accuracy of m , A C C m , multiplied by the latency measured by the target hardware, L A T m , and divided by the target latency T . W denotes a variable that determines the tradeoff between A C C and L A T .
Tan et al. [22] set up MNAS to generate an optimized model capable of performing image recognition in a Google Pixel 1 mobile phone, resulting in the creation of MnasNet, a lightweight model that showed higher efficiency and accuracy than models specifically hand-crafted for mobile environments (MobileNet and MobileNetV2) [22,35]. In this study, we employed the MnasNet model proposed by Tan et al. [22] as a sound-based pig anomaly detector.
The structure of MnasNet employed in the experiment is illustrated in Figure 3. Furthermore, the mobile bottleneck convolution (MBConv) and separable convolution (SepConv) layers used in MobileNetV2 are used here [22,28]. Each block receives an input vector of shape H × w × F ( H refers to height, w to width, and F to the number of channels). The MBConv block is calculated by expanding the number of channels F by three times (MBConv3; H × w × 3 F ) or six times (MBConv6; H × w × 6 F ) before going through depthwise convolution (DWConv), and then the number of channels is restored back to F . The hierarchical structure of MnasNet is composed of repeating blocks with different channel expansion ratios (MBConv3; MBConv6), filter sizes ( 3 × 3 ; 5 × 5 ), and number of filters. In Figure 3, symbols × 2 / × 3 / × 4 on the right side of each layer numbered ①–⑤ represent the number of times that specific block is repeated. In this study, a spectrogram image of size 128 × 128 × 3 was used as an input. It was dimensionally reduced to 4 × 4 × 320 (the output of the last MBconv block) and fed as an input to a fully connected layer (FC). Thereafter, the FC was used to calculate the probability of belonging to each class to obtain the result of the classification.

2.2.2. Filter Clustering and Pruning

Although MnasNet is an optimized model for the target hardware, it is sometimes necessary to expand the model to obtain higher accuracy or reduce it to decrease computing power consumption. The easiest model scaling method is to reduce the overall latency by resizing the input image fed to MnasNet from 224 × 224 to 128 × 128 [22,32]. Another method operates by removing the convolution layer filters at a fixed rate [33,36,37,38,39]. MnasNet employs a depth multiplier (DM) as a model scaling hyper-parameter that removes the filters and decreases or increases the number of channels in each layer of the model to control its size [22]. If the DM is set to 0.5, the number of filters in each layer is reduced to half, thereby reducing the latency.
Recently, there has been a study that, instead of using the algorithm with the DM described earlier, which removes filters at a fixed rate before training the CNN-based deep learning model, applied a clustering method to remove filters of low importance among the ones present at the level of each layer of the trained neural network model [29]. This clustering method was first applied to the detector You Only Look Once (YOLO) [40], and the results proved that the network size was effectively reduced while the identification performance was maintained. In this study, an 8-bit filter clustering algorithm is proposed to further improve the model compression ratio of the filter clustering algorithm proposed in [29], which relied on a 9-bit filter, while maintaining the detection performance. The algorithm proceeds in the following order:
  • Except for the center of the filter, the weights in 3 × 3 filters belonging to a specific layer of the deep learning model are converted to binary values— 0 if the value of the weight is less than the value at the center of the filter and 1 if greater than or equal to the value at the center of the filter (see Figure 4). Then, as shown in Figure 4c, 8-bit binary pattern values of the corresponding filters are obtained by converting them to 8-bit binary numbers. These 8-bit binary pattern values possess a maximum of 256 patterns.
  • After defining the 256 patterns that can be generated through the 8-bit binary filtering as individual clusters, all filters belonging to a specific layer of the deep learning model are classified into their corresponding clusters. For example, if a specific filter that has undergone the process described in Figure 4 has the binary pattern 11010110(2), it is classified in the 214th cluster.
  • After clustering all the filters in a specific layer and using the original filter values shown in Figure 4a before the binary patterning is applied, we calculate the value l 2 N o r m ( 0.1 2 + 1.3 2 +   1.4 2 +   1.2 2 +   0.7 2 +   2.1 2 +   1.7 2 + 1.1 2 +   2.3 2 4.40 ) of the filters belonging to each cluster and sort them based on the calculated value in their corresponding clusters.
  • At this stage, in each cluster, the filter with the highest l 2 N o r m value is considered the most relevant and important filter for the identification performance [37,41] and hence retained, whereas all the remaining ones are removed because they are regarded as less important filters that will not affect the model’s performance.
  • Steps 1 to 4 are performed in all the convolutional layers of the deep learning model.
After the algorithm is applied to the entire network, only the highly important and relevant filters among the 3 × 3 filters in each layer will remain. This will improve the speed performance of the deep learning network by reducing its size while maintaining its classification performance. The 8-bit filter clustering algorithm for convolutional layers consisting only of 3 × 3 filters proposed in this study is described in Algorithm 1.
Algorithm 1. 8-bit filter clustering for convolutional layers consisting only of 3 × 3 filters
Input: Pre-trained weight W
Output: Filter-Clustered weight WFC
Initialize: 3 × 3 filter f in 3 × 3 convolution layer,
save filter list f l , L2Norm list   L
 
for i = 1 to number of filters in   3 × 3 convolution layer do
   b = 1 , c = 0
  for   j = 1 to 9 do
    if   f i j 0 do
       c + = b
    end if
     b * = 2
  end for
   l 2 = L 2 N o r m value of f i
  if   f l c = = n u l l do
     f l c = i
  end if
  else if l 2 > L c do
     f l c = i
   end else if
end for
prune 3 × 3 filter in convolution layer, except filter in fl
The 8-bit filter clustering algorithm proposed in this paper was implemented with the purpose of being used on 3 × 3 filters in convolutional layers. However, unlike YOLO, which includes only 3 × 3 filters, the MnasNet structure also has convolutional layers that use 5 × 5 filters, which makes it impossible to apply the 8-bit filter clustering algorithm to all the layers of MnasNet. To solve this problem, in this study, at the level of the convolutional layers composed of MnasNet’s 5 × 5 filters, the DWConv layers inside MBConv (see Figure 3c) were replaced with DWConv layers with a stack of two 3 × 3 filters that used the same receptive field. This method allows us to apply the 8-bit clustering algorithm proposed in this paper in all the layers of the neural network while minimizing the change to the existing MnasNet structure, which helps increase the compression ratio of the model. However, the following should be noted when changing the MBConv structure and applying the filter clustering method: DWConv, which plays the same role as the depthwise separable convolution layer proposed by Chollet [42], is a dependency that is mapped 1 1 with the Conv 1 × 1 layer located at the top of the MBConv to which the DWConv belongs. If filters belonging to the DWConv layer in MBConv are removed according to the result of filter clustering and the filters belonging to the Conv 1 × 1 layer, which is the upper layer of DWConv, are maintained, the dependency is damaged. To solve this dependency problem, in this study, whenever a filter belonging to the DWConv layer of MBConv is removed, the filter of the Conv 1 × 1 layer mapped 1 1 with the removed filter is also removed. The process of compressing MnasNet by applying the 8-bit filter clustering algorithm is shown in Algorithm 2.
Algorithm 2. Compression of MnasNet
Input: Pre-trained weight of MnasNet W
Output: Filter-Clustered weight of MnasNet WFC
Initialize: Convolution layer of MnasNet l
 
for i = 1 to number of layers in MnasNet
  if l i . f i l t e r _ s i z e = = 9 do
    execute 8-bit filter clustering algorithm for  l i
    if l i = = d e p t h w i s e   c o n v o l u t i o n do
      prune corresponding filters of  l i 1
    end if
  end if
end for
do Fine-tuning through re-training

3. Results

3.1. Data Collection and Datasets

The data were obtained from 36 pigs (Yorkshire, Landrace, and Duroc), each weighing 25 35   kg and kept inside four pigpens (with dimensions of 1.8 × 4.8   m and temperature of 23 °C) at pig farms located in Chungnam, Korea. One study [
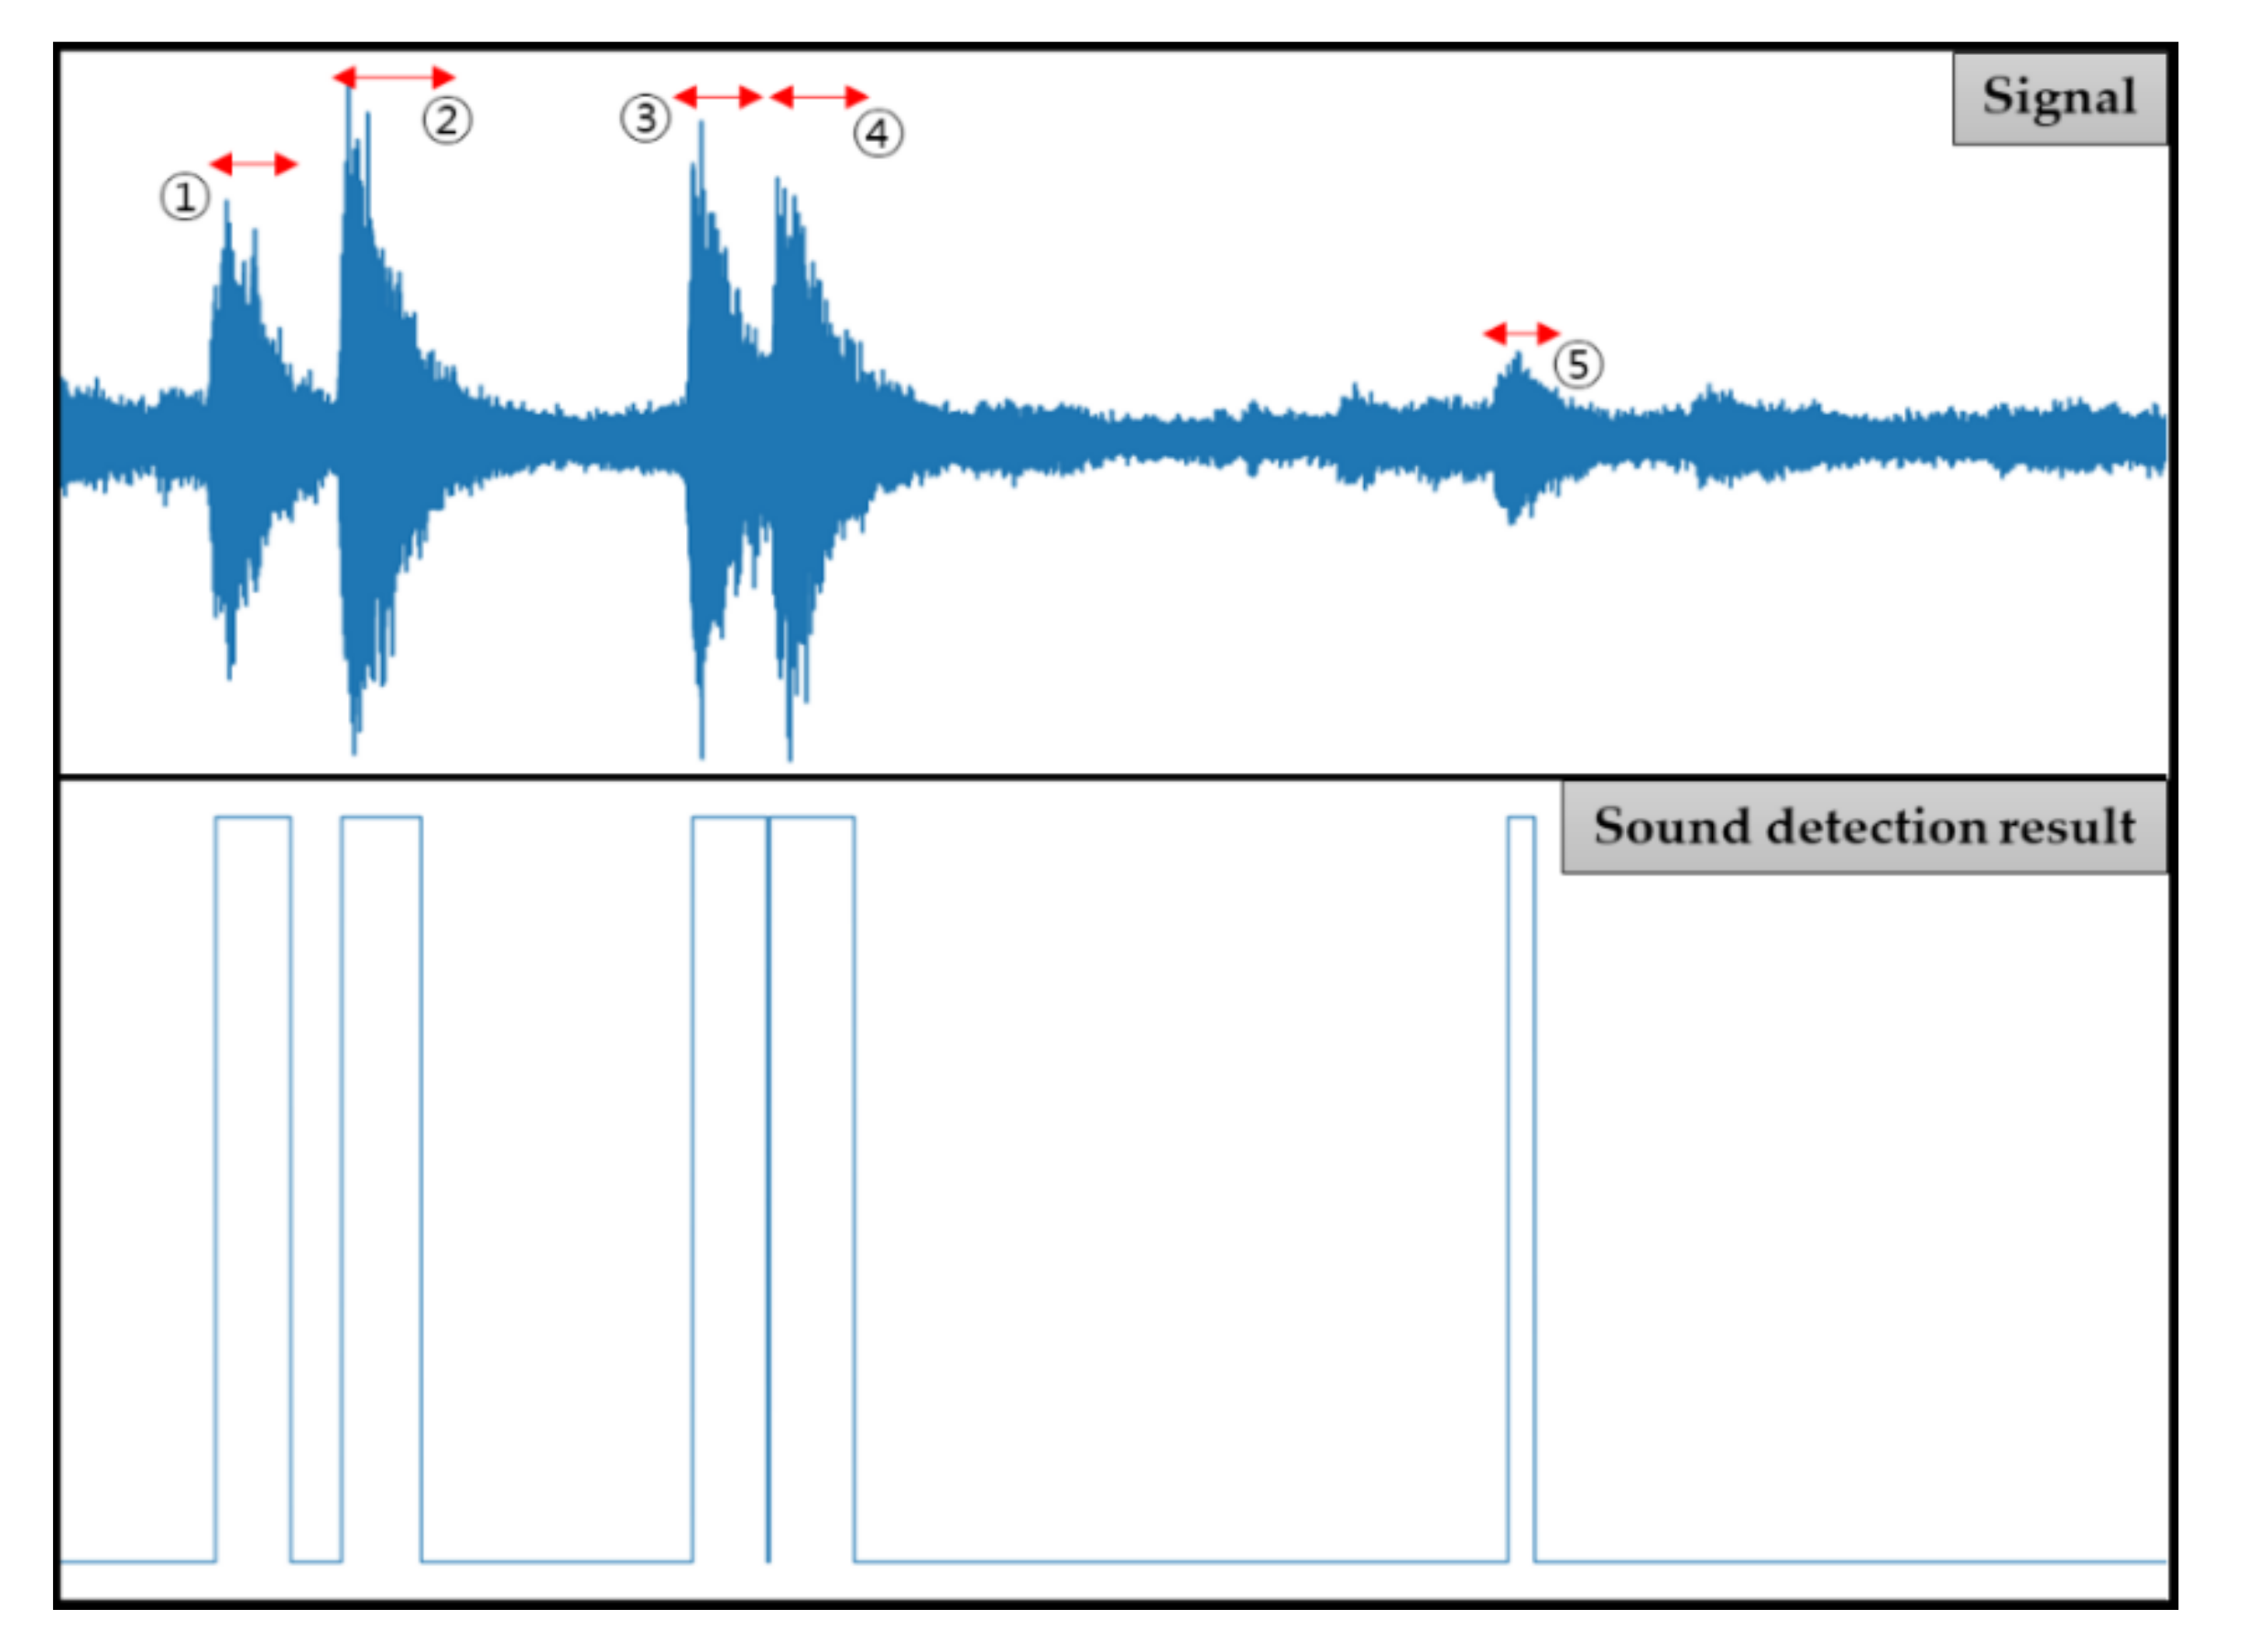
13] details the data collection and organization of the targeted respiratory diseases, including mycoplasma hyopneumoniae (MH), porcine reproductive and respiratory syndrome (PRRS), and postweaning multisystemic wasting syndrome (PMWS). When labeling the data, and in situations where the data included irrelevant sound caused by pigs’ footprint or aggressiveness and attacks among themselves, the video recorded was analyzed along with the sound to ensure that the label accurately matched the class. The sound region was detected using the algorithm proposed by Kim and Hanh [18] through the VAD system previously mentioned. The detected sound data was 0.127 to 2.627 s long, and the sample rate was 44,100 Hz.
To check the detection performance of pig abnormalities in noisy situations, white Gaussian noise (SNR: 20, 15, 10, 5, and 0 dB) and environmental noise (radio operation, door opening, weak footsteps, and strong footsteps) were synthesized with pig sounds. The radio sound refers to the music played inside the pigsty to suppress stress in pigs and maintain their psychological state at a stable level. The strong footsteps are sounds made by several pigs running around excitedly in the pigsty, and the weak footsteps are those made by a few pigs walking or running around under normal circumstances. Lastly, the sound of the door opening is the one that occurs when the manager enters or leaves the pigpen. Table 2 lists certain basic information related to environmental noise, and 
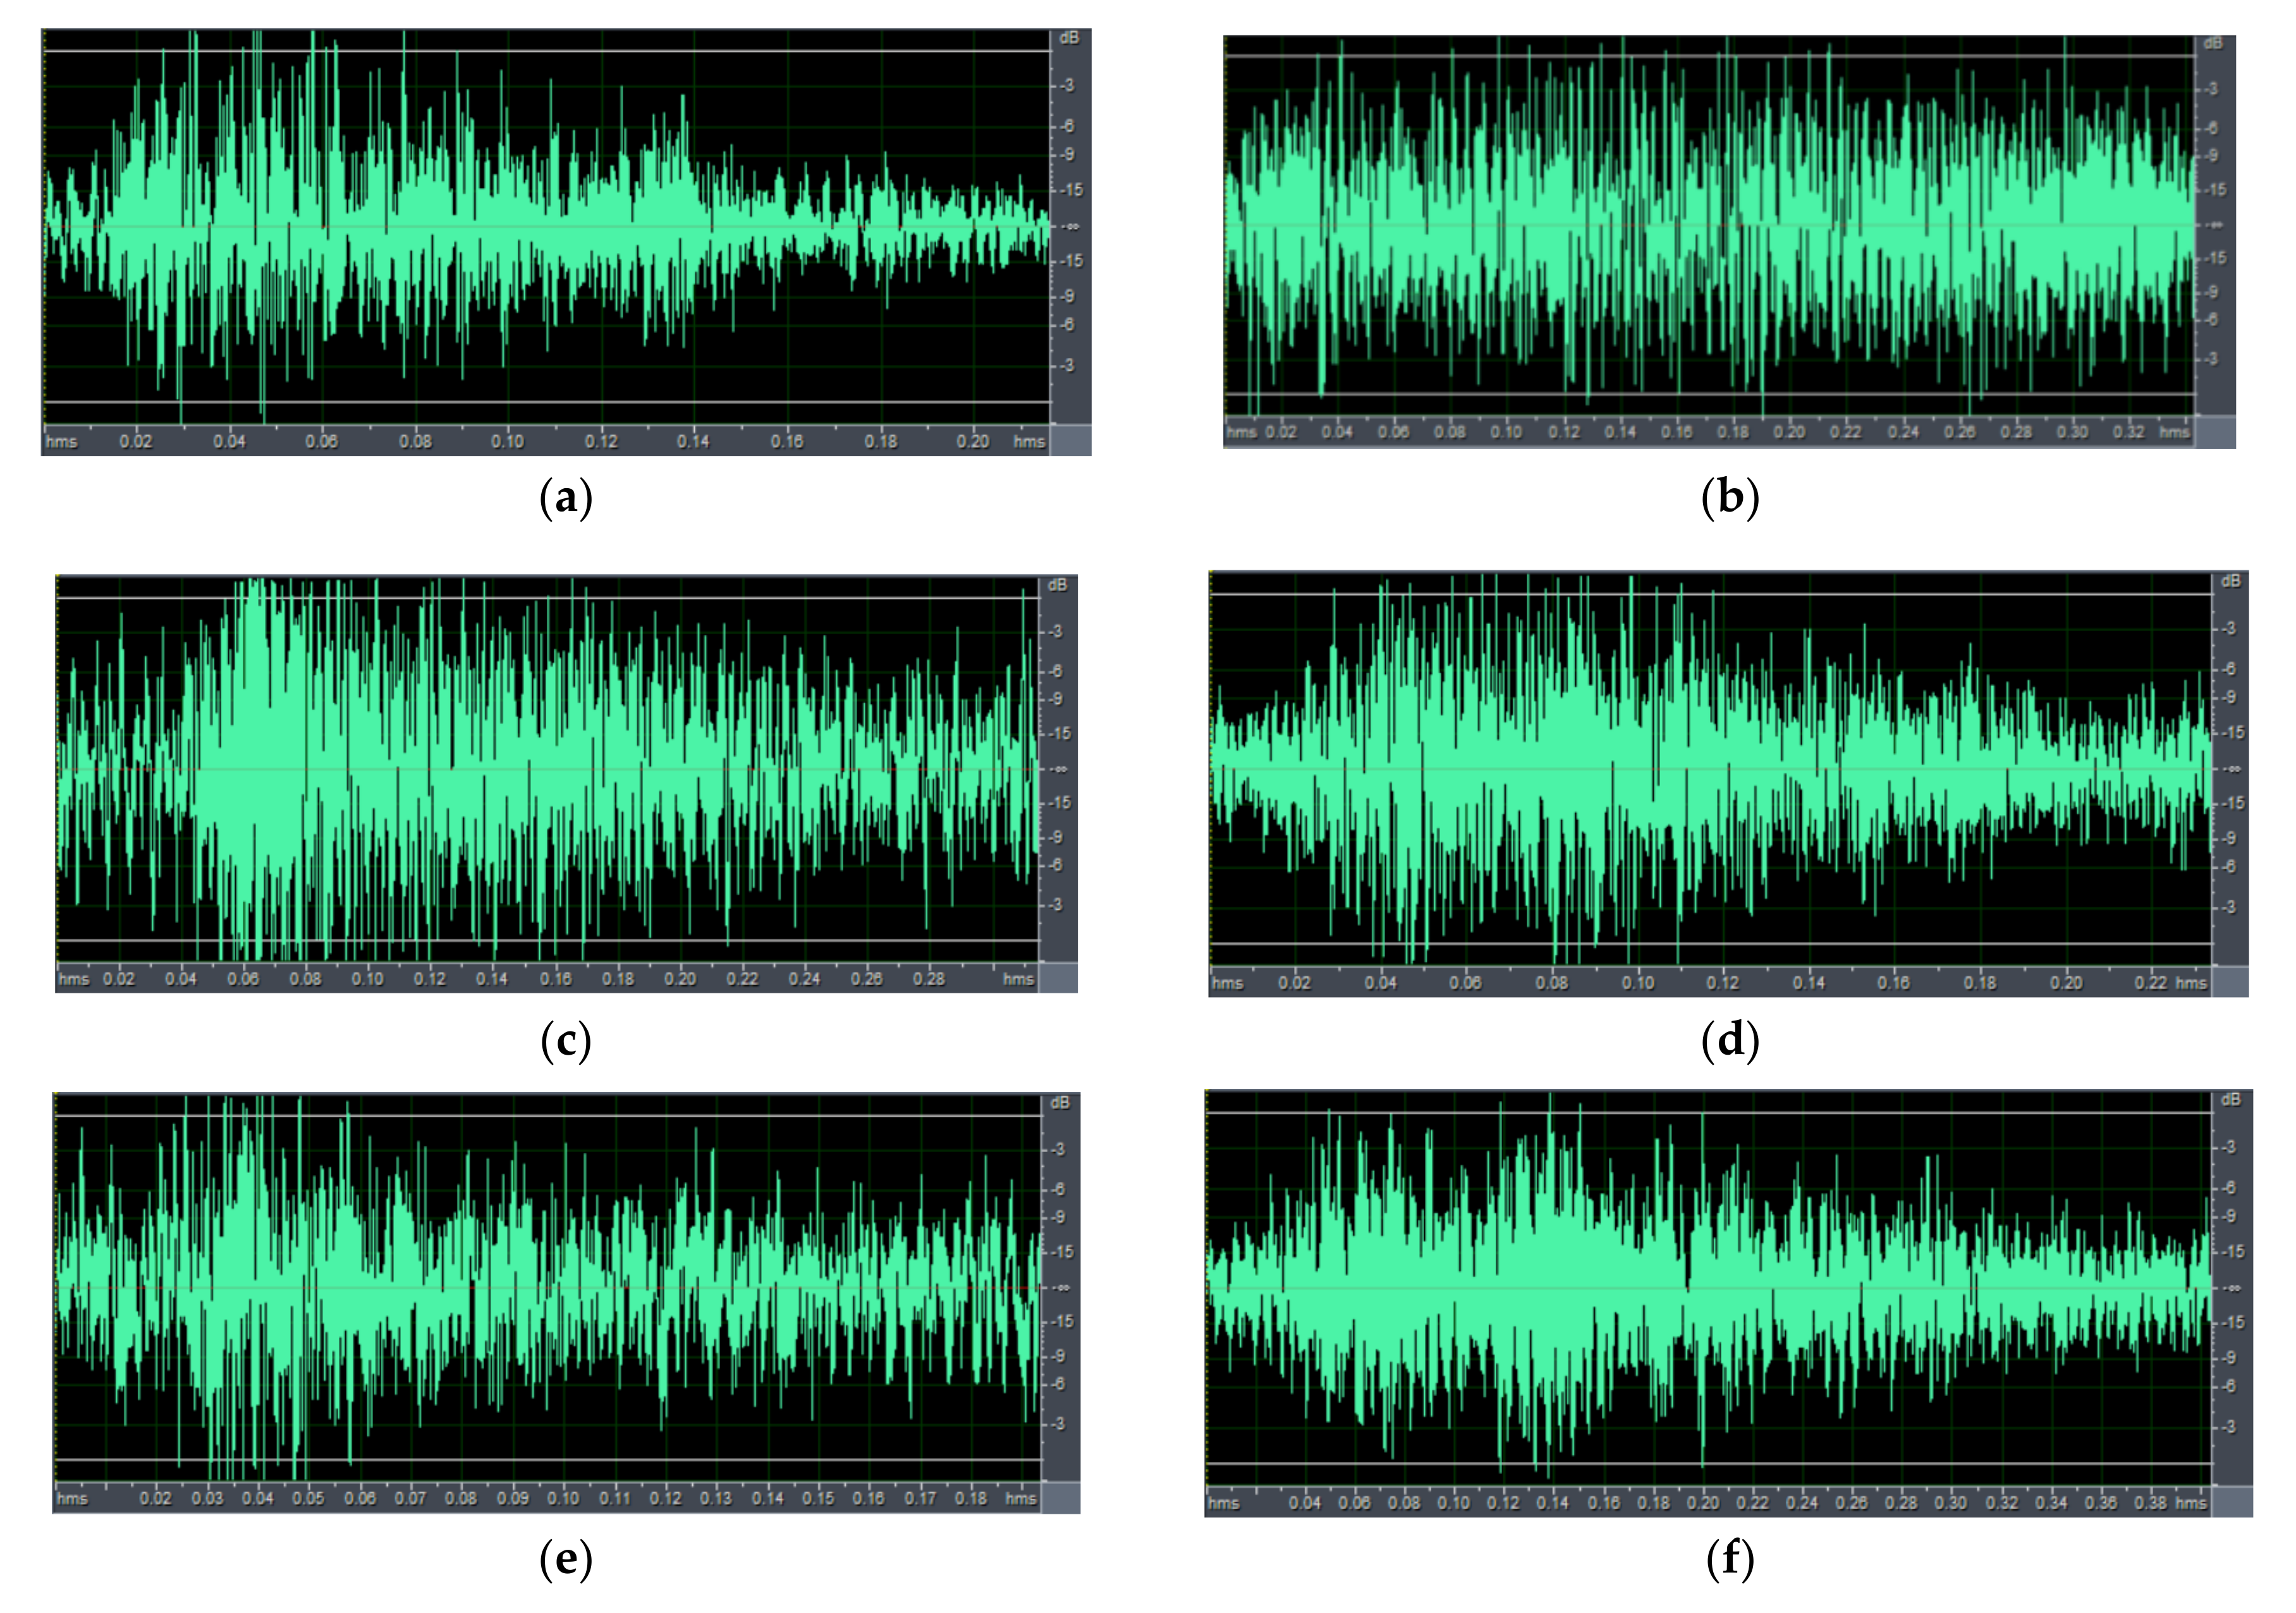
Figure 5 displays examples of signals for various sounds that can be produced by a pig.

3.2. End Point Detection

To detect sound-based pig anomalies, the first process involves localizing the sound generated from the sound signal acquired through the sound sensor installed in the pig house. In this study, the VAD algorithm proposed by Kim and Hanh [18] was used for that purpose, allowing the detection of all sounds generated in pig houses. The values of the settings used to detect sound were as follows: the length of the fast Fourier transform (FFT) window was 512, window size was 0.025 s, hop size was 0.01 s, and threshold was set to 0.75. Figure 6 depicts the 12.669 s long signal that represents five pig coughs and the result of the coughing sound detection in the signal. The results indicated that continuous coughing sounds such as ①, ②, ③, and ④, and coughing sounds with a small signal sound size such as ⑤ were effectively detected. In addition, the time taken to detect a sound region in a sound signal of 12.669 s in length in the TX-2 embedded board (CPU: ARM Cortex-A57, GPU: Pascal with 256 CUDA cores, and RAM: 8 GB) was 4.391 s. The sound region detected through this process was converted into a spectrogram, and then, input to the MnasNet-based abnormality detector. Librosa Python package 0.7.2 [43] with its default setting values was used to convert the sound signals to spectrograms. At this stage, the time required to convert a 2.005 s sound signal into a spectrogram in the TX-2 board was 1.095 s.

3.3. Pig Anomaly Classification Results

The data used for sound-based pig anomaly detection included 100 samples of cough, 110 of grunt, 70 of MH, 150 of PMWS, 140 of PRRS, and 140 of Scream, adding up to 710 samples of data. The dataset was divided in the ratio of 8:2, with 8 (568) as the training set and 2 (142) as the testing set. Furthermore, to confirm whether abnormal situations could be detected robustly in various noisy situations, five steps of white Gaussian noise and four environmental noise sounds were used ( 142 × 9 ) by synthesizing them with the original test data.
In the first experiment, MnasNet was trained only with the original data for training that did not contain noise. As mentioned in the Introduction, the CNN-based deep learning structure is known to be robust to noise, but it is still necessary to secure more robust anomaly detection performance. Consequently, in the second experiment, the original data for training and the data obtained by synthesizing SNR 0 with the corresponding data were used in the MnasNet model training. Subsequently, an experiment was conducted to confirm the effectiveness of the filter clustering technique proposed in this study for the corresponding MnasNet structure. Then, another experiment, in which the DM option was applied to MnasNet models before training them, was conducted to be used for performance comparison. For MnasNet, Keras 2.2.4 [44] and TensorFlow 1.12.0 [45] were used, and an Adam Optimizer with decay rates β-1 = 0.9 and β-2 = 0.999, a learning rate of 0.001, and a batch size of 142 were used. The first experiment was trained for 80 epochs, whereas the second one for 100 epochs, and default settings were used as hyper-parameters for the training. After filter clustering was applied to MnasNet, additional training was performed on the pruned MnasNet model for fine-tuning. The evaluation index used in the experimental results is the F1-score, which is calculated as follows [46]:
P r e c i s i o n = T P T P + F P × 100
R e c a l l = T P T P + F N × 100
F 1   s c o r e = 2   ×   p r e c i s i o n   ×   r e c a l l p r e c i s i o n + r e c a l l
where true positive (TP) represents the data accurately classified as true, false positive (FP) represents the inaccurate identification of data as true, and false negative (FN) represents the data inaccurately identified as false. Precision indicates the ratio of how much of the data predicted as a specific class actually belongs to it, and recall indicates the ratio of accurately detecting a specific class.
Table 3 presents the experimental results of identifying abnormalities in pigs after training with only clean data (not containing any synthesized noise). The table illustrates the results of three experiments with MnasNet using different DM values and three experiments related to filter clustering. The DM values in the first three experiments represent the rate at which the filters are maintained. DM 1.0 represents the training performed without pruning any filters of MnasNet, which we will refer to as the basic structure of MnasNet for the remainder of the paper, and DM set to 0.75 and 0.5 are the ones where MnasNet filters are removed at rates of 25% and 50%, respectively, before the training. However, the remaining three experiments are the result of applying the filter clustering technique to the trained model of the basic structure of MnasNet. In the order of listing, the first experiment uses the model resulting from applying the initial filter clustering algorithm [29], the second one uses the result of applying the 8-bit filter clustering technique to only the convolutional layer comprising 3 × 3 filters of the MnasNet, and the last one uses the model resulting from applying the 8-bit filter clustering technique to all layers of MnasNet to identify abnormalities in pig sounds.
The experimental results indicated that when DM was set to 0.75 or 0.5, the model’s identification performance could not be maintained because the results showed a significant drop. In contrast, the three experiments using the filter clustering technique showed that the identification performance was well maintained despite a decrease in the number of filters in the neural network. This demonstrated that the MnasNet model’s identification performance was not affected by the removal of filters that were not relevant for the identification, which was different from removing filters randomly from MnasNet using the DM. However, for SNRs 15, 10, 5, and 0, with strong white Gaussian noise and door opening noise (environmental noise), we noticed that the identification performance was generally low for all algorithms.
Unlike the previous experiments, the experimental results listed in Table 4 are from the training performed using a dataset containing data obtained by synthesizing white Gaussian noise SNR 0 and clean data. As shown in Table 4, compared to the previous experimental results, the F1-score has considerably increased with values ranging from 0.107 to 0.277, and the pig’s abnormality is stably identified not only in white Gaussian noise conditions but also in environments containing environmental noise. In particular, the average F1-score result of the 8-bit filter clustering method proposed in this study is 0.947, the highest identification result, which is 0.025 higher than the result obtained using the basic structure of MnasNet (DM 1.0). In addition, as presented in Table 5, the number of parameters of the neural network is 646,624 and the execution time for detecting a pig’s abnormality from sound converted to spectrogram images on the TX-2 board is 0.253 s/image. While this model has a size that is 76.3% smaller than the basic structure of MnasNet, its execution time is 0.220 s faster, which proves that the proposed method produces the most optimized model. Thus, this model can be executed in real time, and as shown in Table 4, provides the best identification results.
Table 6 displays a confusion matrix of the results after applying the 8-bit filter clustering method, shown in Table 4, to all layers of MnasNet. The results confirmed that it effectively detected abnormalities related to pigs’ respiratory diseases and screams resulting from attacks between pigs.
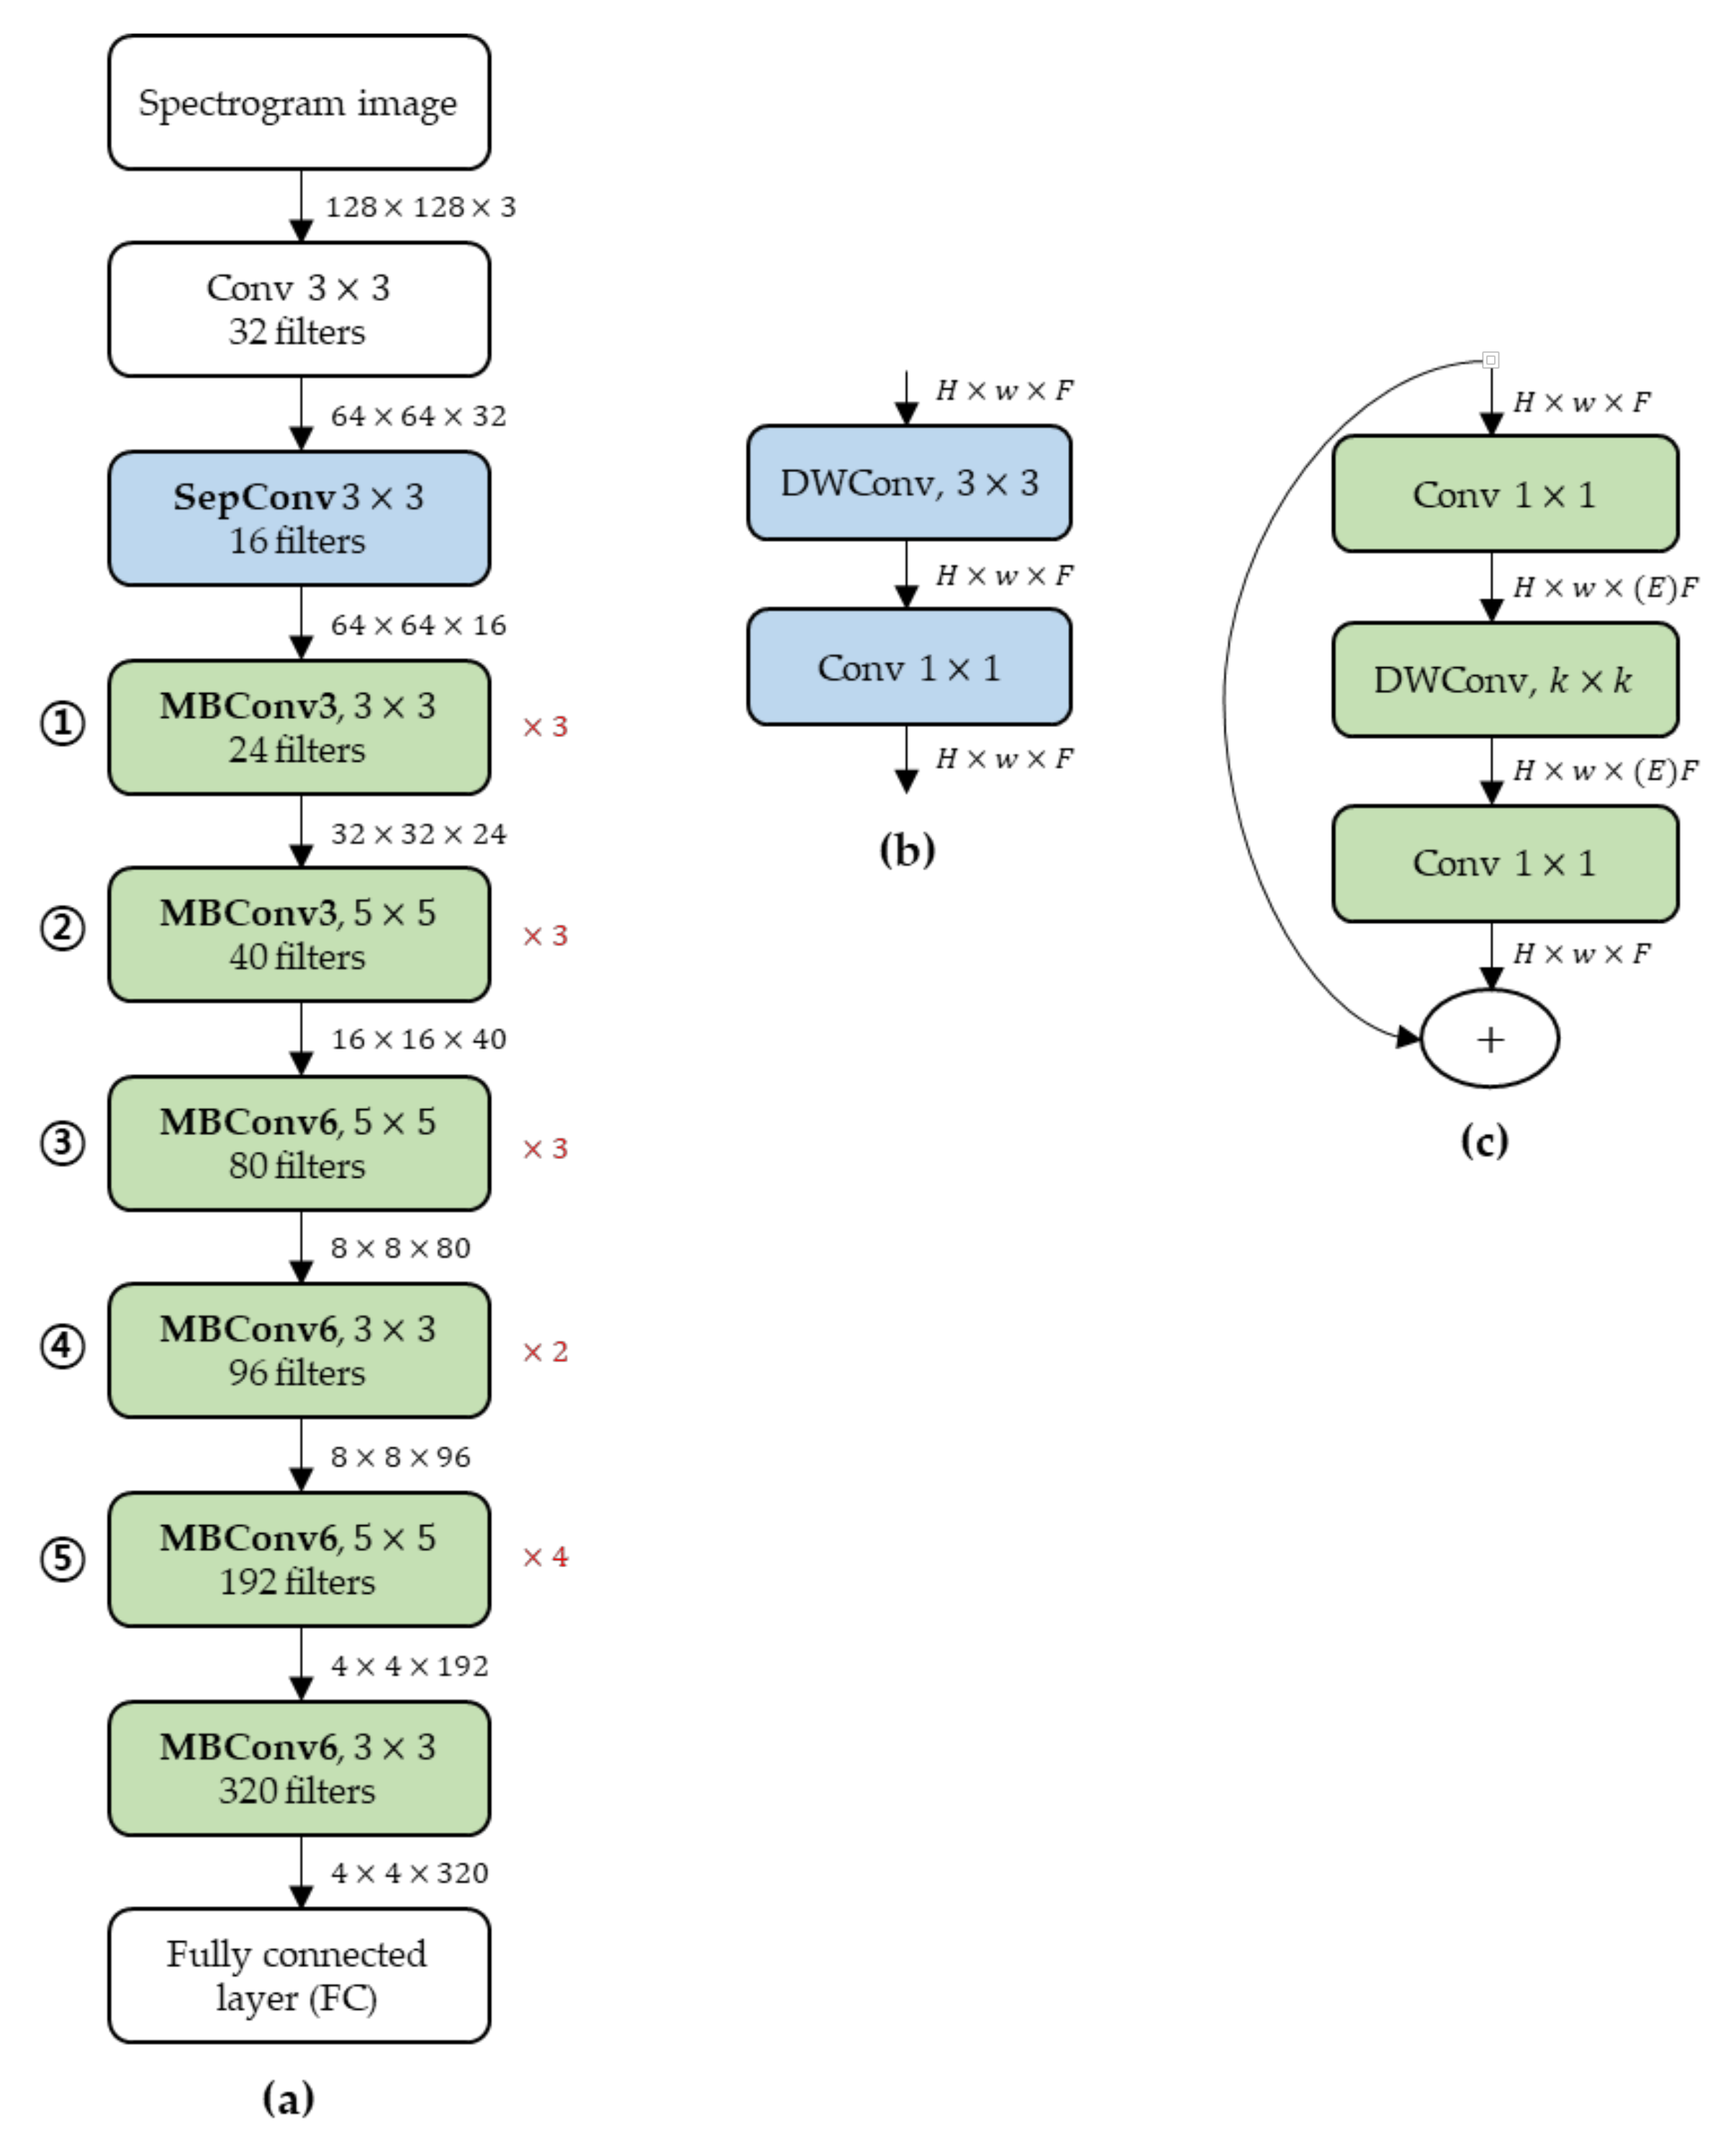
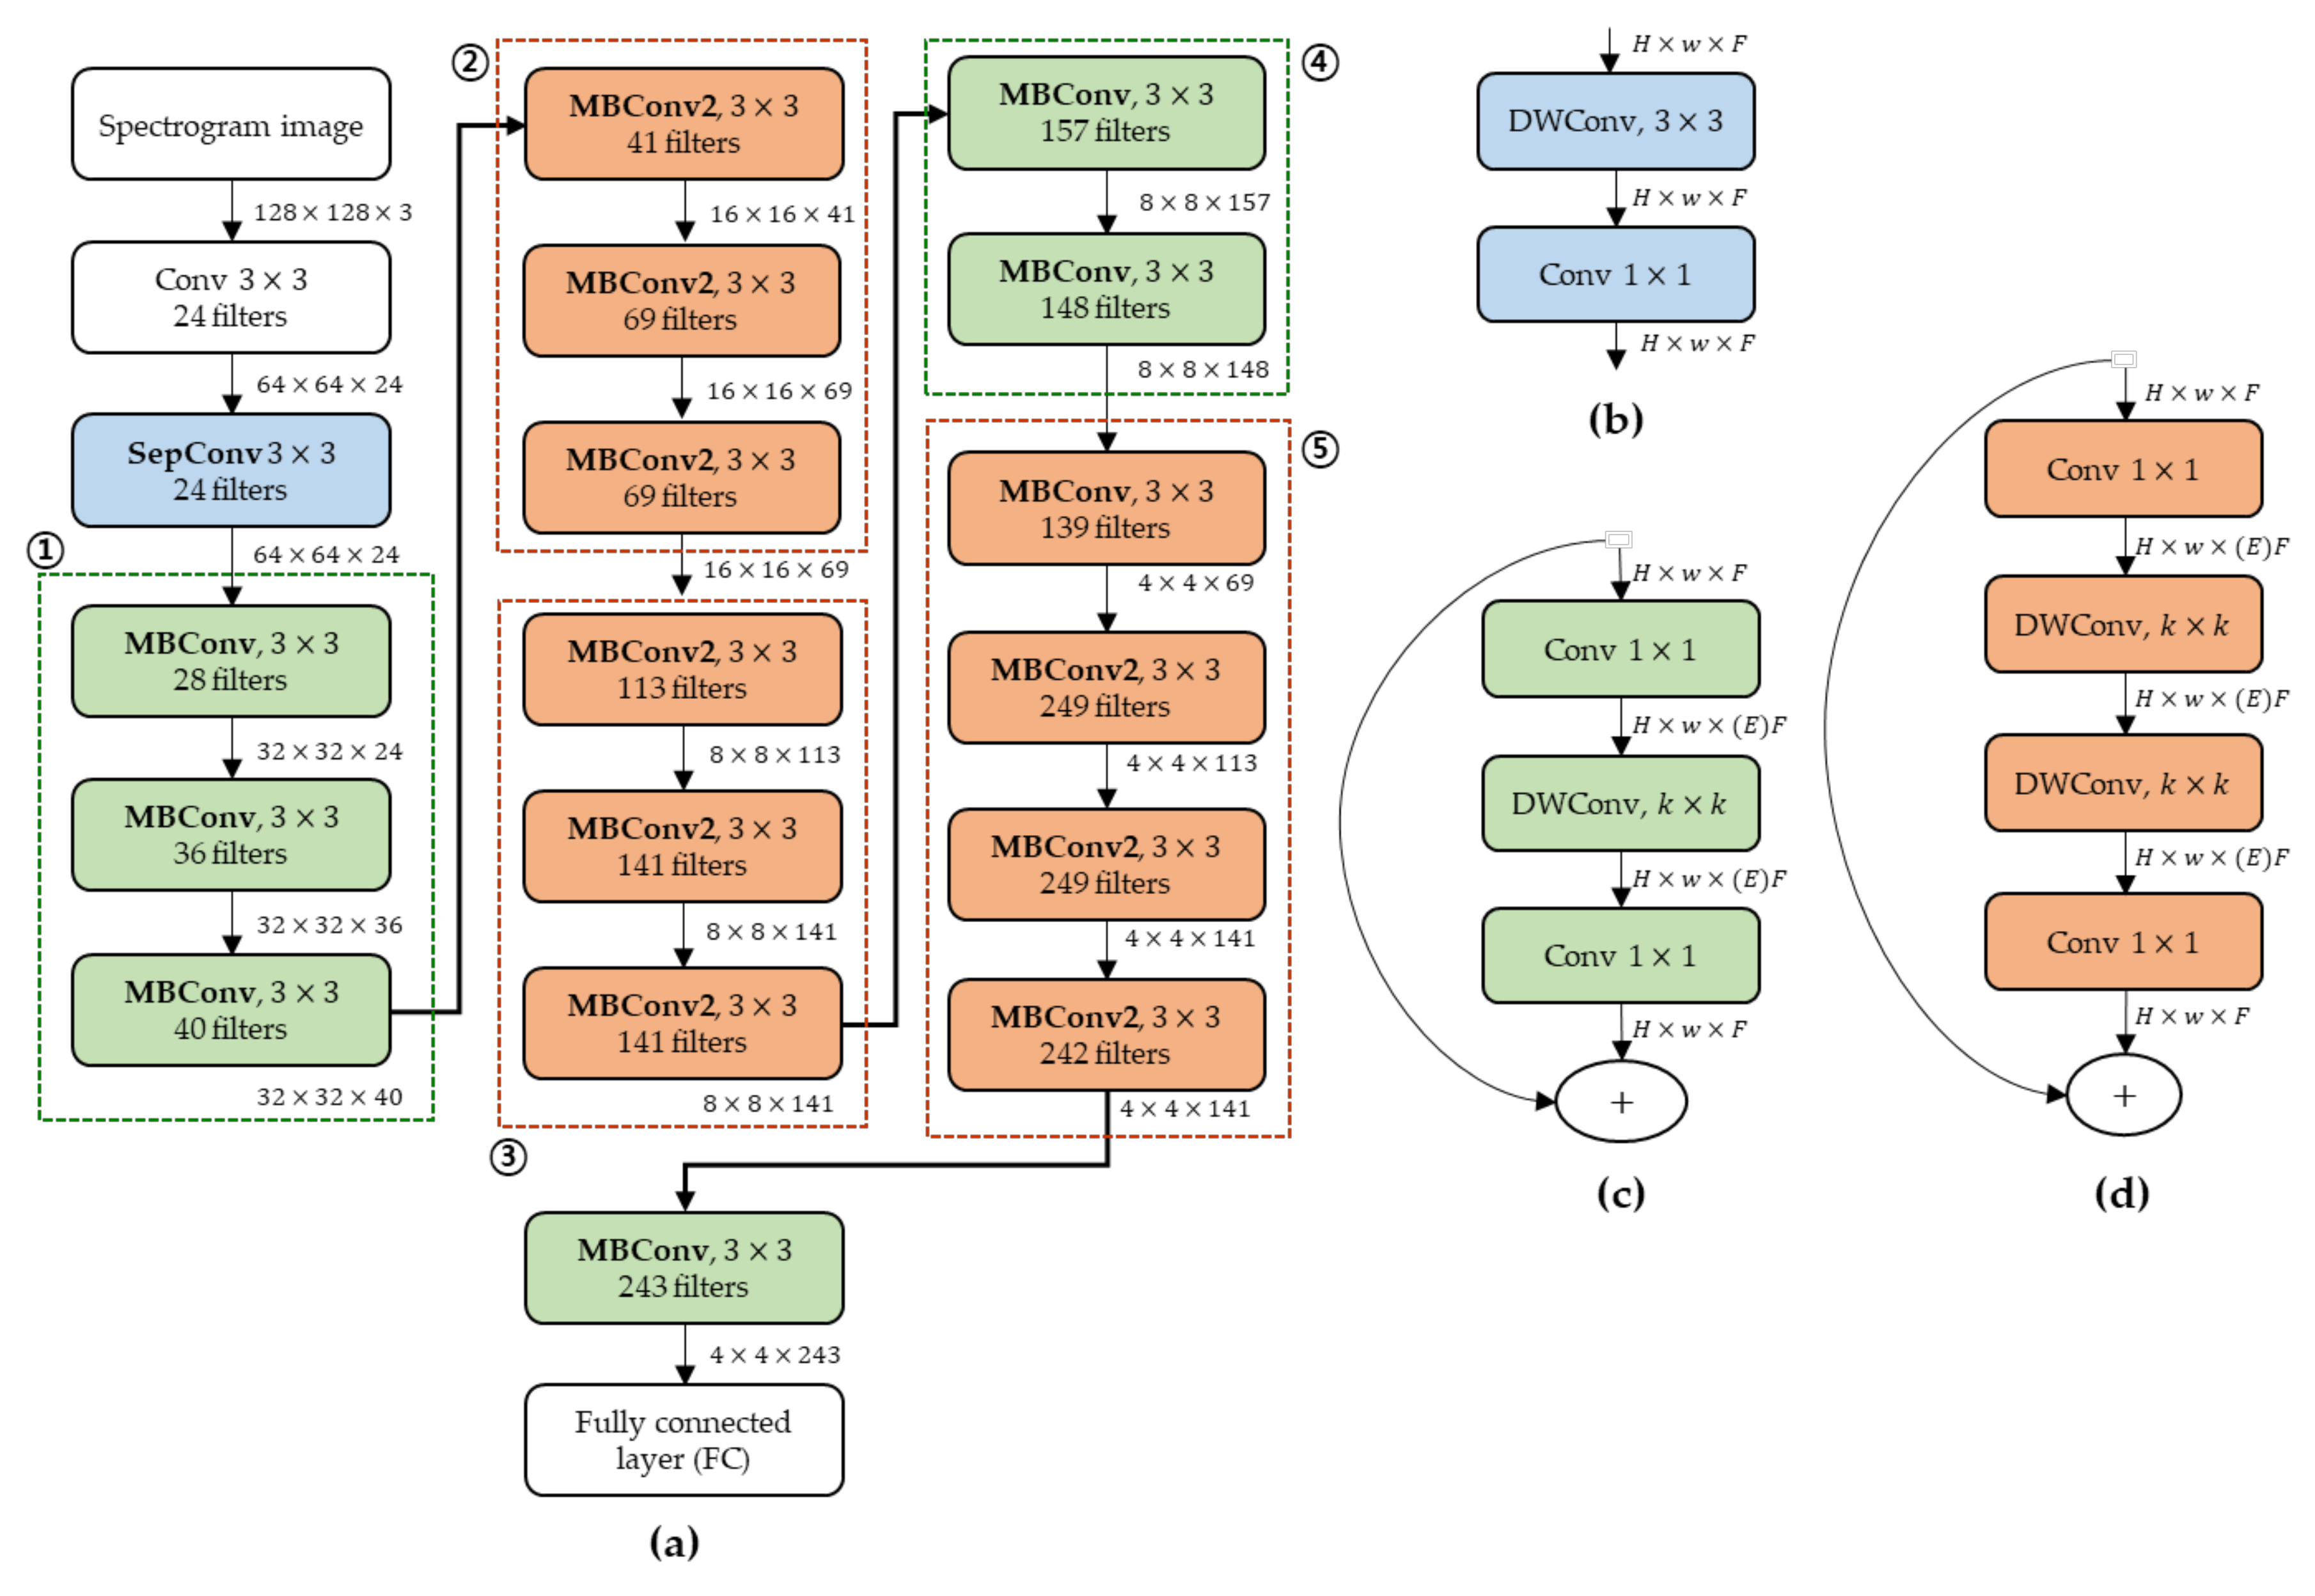
Figure 7 illustrates the compressed MnasNet structure after pruning the filters that are irrelevant to the identification performance using the 8-bit filter clustering method. As previously described in Section 2.2.2, to apply the 8-bit filter clustering method to all layers of MnasNet, the MBConv layers composed of 5 × 5 filters were changed to comprise two hierarchical 3 × 3 filters. Therefore, the interior of the existing MBConv structure was changed to a structure with two DWConvs, named MBConv2, as shown in Figure 7d. In addition, in MBConv in the MnasNet model, layers having the same number of filters were repeated; hence, we represented them as one and added symbols × 2 / × 3 / × 4 on the right side of the layers (see Figure 3a). However, when the 8-bit filter clustering algorithm is applied to MnasNet, the number of filters belonging to each layer of the repeated MBConv changes. Therefore, the MBConv, which had the same number of filters that was repeated 3 times in the basic MnasNet structure, was drawn only once and marked with the symbol × 3 on its right side (see ① in Figure 3a). The same MBConv had to be expressed by dividing it into 3 MBConvs with different numbers of filters after applying our proposed method (see ① in Figure 7a).
Table 7 and Table 8 summarize a comparison of results between other studies and our proposed method. However, because the previous studies conducted experiments without considering the noise generated in pigpens, the results using only clean data in the test dataset were used to ensure a fair and accurate comparison. For cough detection, the following three performance indicators were used: cough by disease detection rate (CDR), false-positive rate (FPR), and false-negative rate (FNR). The description of the performance index is described in detail by Chung et al. [13]. Table 7 presents a comparison of the results of detecting cough caused by disease using our proposed method and that used by other studies. Table 8 presents a comparison of the results of identifying respiratory diseases in pigs using our proposed method and that used by Chung et al. [13].

4. Conclusions

Failure to quickly and accurately detect various abnormalities (porcine respiratory diseases, aggressive behaviors among pigs, etc.) occurring in pigpens will cause considerable damage to the pig farms and national economy. In particular, and unlike large-scale enterprise farms, small and medium-sized farms are relatively negligent when preparing for and dealing with such abnormal situations. To provide them with a suitable solution, we propose a system that employs sound data to effectively detect abnormal situations in pigs. The system was designed specifically to be executed in real time using a low-cost sound sensor and run on an embedded board TX-2, instead of relying on relatively expensive video sensors and general PCs, such that small farms with limited budgets could purchase them without having to bear any financial burden. In addition, the system was implemented to be robust against various noises generated inside pigpens, such that it could be applied in real-life pig farms.
The proposed system included a pipeline that connected the entire process starting from sound acquisition to the detection of anomalies in pigs as follows: (1) effective sound signal acquisition from a sound sensor mounted in an environment with possible noise occurrences; (2) signal-to-sound area detection and conversion to a spectrogram; and (3) application of the 8-bit filter clustering algorithm proposed in this paper to MnasNet, a light-weight deep learning model, to remove filters that did not affect the identification performance. As a result, a model 76.3% lighter than the original MnasNet model was created and used to receive the spectrogram as input to detect and identify abnormal pig situations. The results of the abnormality identification experiment demonstrated an F1-score of 0.947, achieving the best identification performance even in pigpens where various noises were generated. In addition, the execution time of the abnormality identification algorithm on the TX-2 board was 0.253 s, which was 0.220 s faster than the basic MnasNet model; this allowed real-time execution. In our next study, we intend to implement a more reliable pig abnormality monitoring system by combining sound and video data acquired from sensors installed in pigpens.

Author Contributions

Conceptualization, M.H., J.L., D.P., and Y.C.; methodology, M.H., H.A., and J.L.; validation, J.L., D.P., and Y.C.; data curation, M.H, H.A., and O.A.; writing—original draft preparation, O.A, J.L., and D.P.; writing—review and editing, O.A, J.L., and D.P. All authors have read and agreed to the published version of the manuscript.

Funding

This research was supported by the Basic Science Research Program through the National Research Foundation of Korea (NRF) funded by the Ministry of Education (NRF-2018R1D1A3B07044938 and NRF-2020R1I1A3070835).

Conflicts of Interest

The authors declare no conflict of interest.

References

  1. MAFRA (Ministry of Agriculture, Food and Rural Affairs). Agricultural and Forestry Production Index. (In Korean). Available online: https://www.mafra.go.kr/marfa/357/subview.do. (accessed on 24 May 2020).
  2. Lee, J.; Noh, B.; Jang, S.; Park, D.; Chung, Y.; Chang, H.-H. Stress detection and classification of laying hens by sound analysis. Asian-Australas. J. Anim. Sci. 2015, 28, 592–598. [Google Scholar] [CrossRef]
  3. Norton, T.; Chen, C.; Larsen, M.L.V.; Berckmans, D. Precision livestock farming: Building ‘digital representations’ to bring the animals closer to the farmer. Animal 2019, 13, 3009–3017. [Google Scholar] [CrossRef] [PubMed] [Green Version]
  4. Liu, L.; Li, B.; Zhao, R.; Yao, W.; Shen, M.; Yang, J. A novel method for broiler abnormal sound detection using WMFCC and HMM. J. Sensor 2020, 1–7. [Google Scholar] [CrossRef] [Green Version]
  5. Huang, J.; Wang, W.; Zhang, T. Method for detecting avian influenza disease of chickens based on sound analysis. Biosyst. Eng. 2019, 180, 16–24. [Google Scholar] [CrossRef]
  6. Chung, Y.; Lee, J.; Oh, S.; Park, D.; Chang, H.H.; Kim, S. Automatic detection of cow’s oestrus in audio surveillance system. Asian-Australas. J. Anim. Sci. 2013, 26, 1030–1037. [Google Scholar] [CrossRef] [PubMed] [Green Version]
  7. Vandermeulen, J.; Bahr, C.; Johnston, D.; Earley, B.; Tullo, E.; Berckmans, D. Early recognition of bovine respiratory disease in calves using automated continuous monitoring of cough sounds. Comput. Electron. Agric. 2016, 129, 15–26. [Google Scholar] [CrossRef]
  8. Carpentier, L.; Berckmans, D.; Youssef, A.; van Waterschoot, T.; Johnston, D.; Guarino, M. Automatic cough detection for bovine respiratory disease in a calf house. Biosyst. Eng. 2018, 173, 45–56. [Google Scholar] [CrossRef]
  9. Guarino, M.; Jans, P.; Costa, A.; Aerts, J.M.; Berckmans, D. Field test of algorithm for automatic cough detection in pig houses. Comput. Electron. Agric. 2008, 62, 22–28. [Google Scholar] [CrossRef]
  10. Exadaktylos, V.; Silva, M.; Aerts, J.-M.; Taylor, C.J.; Berckmans, D. Real-time recognition of sick pig cough sounds. Comput. Electron. Agric. 2008, 63, 207–214. [Google Scholar] [CrossRef]
  11. Silva, M.; Exadaktylos, V.; Ferrari, S.; Guarino, M.; Aerts, J.M.; Berckmans, D. The influence of respiratory disease on the energy envelope dynamics of pig cough sounds. Comput. Electron. Agric. 2009, 69, 80–85. [Google Scholar] [CrossRef]
  12. Gutierrez, W.M.; Kim, S.; Kim, D.H.; Yeon, S.C.; Chang, H.H. Classification of porcine wasting diseases using sound analysis. Asian Australas. J. Anim. Sci. 2010, 23, 1096–1104. [Google Scholar] [CrossRef]
  13. Chung, Y.; Oh, S.; Lee, J.; Park, D.; Chang, H.H.; Kim, S. Automatic detection and recognition of pig wasting diseases using sound data in audio surveillance systems. Sensors 2013, 13, 12929–12942. [Google Scholar] [CrossRef] [PubMed] [Green Version]
  14. Vandermeulen, J.; Bahr, C.; Tullo, E.; Fontana, I.; Ott, S.; Kashiha, M.; Berckmans, D. Discerning pig screams in production environments. PLoS ONE 2015, 10, e0123111. [Google Scholar] [CrossRef] [PubMed] [Green Version]
  15. Cordeiro, A.F.D.S.; Nääs, I.D.A.; da Silva Leitão, F.; de Almeida, A.C.; de Moura, D.J. Use of vocalisation to identify sex, age, and distress in pig production. Biosyst. Eng. 2019, 173, 57–63. [Google Scholar] [CrossRef]
  16. Wang, X.; Zhao, X.; He, Y.; Wang, K. Cough sound analysis to assess air quality in commercial weaner barns. Comput. Electron. Agric. 2019, 160, 8–13. [Google Scholar] [CrossRef]
  17. Lee, J.; Jin, L.; Park, D.; Chung, Y. Automatic recognition of aggressive behavior in pigs using a kinect depth sensor. Sensors 2016, 16, 631. [Google Scholar] [CrossRef] [Green Version]
  18. Kim, J.; Hahn, M. Voice activity detection using an adaptive context attention model. IEEE Signal Process. Lett. 2018, 25, 1181–1185. [Google Scholar] [CrossRef]
  19. Zhang, T.; Shao, Y.; Wu, Y.; Geng, Y.; Fan, L. An overview of speech endpoint detection algorithms. Appl. Acoust. 2020, 160, 107133. [Google Scholar] [CrossRef]
  20. Sassatelli, L.; Winckler, M.; Fisichella, T.; Dezarnaud, A.; Lemaire, J.; Aparicio-Pardo, R.; Trevisan, D. New interactive strategies for virtual reality streaming in degraded context of use. Comput. Graph. 2020, 86, 27–41. [Google Scholar] [CrossRef]
  21. Mao, J.; Zhu, S.; Liu, J. An inaudible voice attack to context-based device authentication in smart IoT systems. J. Syst. Architect. 2020, 104, 101696. [Google Scholar] [CrossRef]
  22. Tan, M.; Chen, B.; Pang, R.; Vasudevan, V.; Sandler, M.; Howard, A.; Le, Q.V. MnasNet: Platform-aware neural architecture search for mobile. In Proceedings of the IEEE Conference on Computer Vision and Pattern Recognition, Long Beach, CA, USA, 18–23 June 2019; pp. 2820–2828. [Google Scholar]
  23. Qian, Y.; Bi, M.; Tan, T.; Yu, K. Very deep convolutional neural networks for noise robust speech recognition. IEEE/ACM Trans. Audio Speech Lang. Process. 2016, 24, 2263–2276. [Google Scholar] [CrossRef]
  24. Pervaiz, A.; Hussain, F.; Israr, H.; Tahir, M.A.; Raja, F.R.; Baloch, N.K.; Zikria, Y.B. Incorporating noise robustness in speech command recognition by noise augmentation of training data. Sensors 2020, 20, 2326. [Google Scholar] [CrossRef] [PubMed] [Green Version]
  25. Ozer, I.; Ozer, Z.; Findik, O. Noise robust sound event classification with convolutional neural network. Neurocomputing 2018, 272, 505–512. [Google Scholar] [CrossRef]
  26. NVIDIA. NVIDIA Jetson TX2. Available online: http://www.nvidia.com/object/embedded-systems-dev-kits-modules.html (accessed on 30 June 2020).
  27. Roy, S.S.; Rodrigues, N.; Taguchi, Y. Incremental dilations using CNN for brain tumor classification. Appl. Sci. 2020, 10, 4915. [Google Scholar] [CrossRef]
  28. Choi, H.H.; Kang, H.S.; Yun, B.J. CNN-based illumination estimation with semantic information. Appl. Sci. 2020, 10, 4806. [Google Scholar] [CrossRef]
  29. Seo, J.; Ahn, H.; Kim, D.; Lee, S.; Chung, Y.; Park, D. EmbeddedPigDet—Fast and accurate pig detection for embedded board implementations. Appl. Sci. 2020, 10, 2878. [Google Scholar] [CrossRef]
  30. Kim, K.I.; Lee, K.M. Convolutional neural network-based gear type identification from automatic identification system trajectory data. Appl. Sci. 2020, 10, 4010. [Google Scholar] [CrossRef]
  31. Sandler, M.; Howard, A.; Zhu, M.; Zhmoginov, A.; Chen, L.C. Mobilenetv2: Inverted residuals and linear bottlenecks. In Proceedings of the IEEE Conference on Computer Vision and Pattern Recognition, Salt Lake City, UT, USA, 18–23 June 2018; pp. 4510–4520. [Google Scholar]
  32. Howard, A.G.; Zhu, M.; Chen, B.; Kalenichenko, D.; Wang, W.; Weyand, T.; Adam, H. Mobilenets: Efficient convolutional neural networks for mobile vision applications. arXiv 2017, arXiv:1704.04861. [Google Scholar]
  33. Zoph, B.; Vasudevan, V.; Shlens, J.; Le, Q.V. Learning transferable architectures for scalable image recognition. In Proceedings of the IEEE Conference on Computer Vision and Pattern Recognition, Salt Lake City, UT, USA, 18–23 June 2018; pp. 8697–8710. [Google Scholar]
  34. Zoph, B.; Le, Q.V. Neural architecture search with reinforcement learning. arXiv 2016, arXiv:1611.01578. [Google Scholar]
  35. Tan, M.; Le, Q.V. Efficientnet: Rethinking model scaling for convolutional neural networks. arXiv 2019, arXiv:1905.11946. [Google Scholar]
  36. Yang, T.; Howard, A.; Chen, B.; Zhang, X.; Go, A.; Sandler, M.; Sze, V.; Adam, H. Netadapt: Platform-aware neural network adaptation for mobile applications. In Proceedings of the European Conference on Computer Vision, Munich, Germany, 8–14 September 2018; pp. 285–300. [Google Scholar]
  37. Li, H.; Kadav, A.; Durdanovic, I.; Samet, H.; Graf, H.P. Pruning filters for efficient convnets. arXiv 2016, arXiv:1608.08710 2016. [Google Scholar]
  38. Hu, Y.; Sun, S.; Li, J.; Wang, X.; Gu, Q.A. Novel channel pruning method for deep neural network ompression. arXiv 2018, arXiv:1805.11394. [Google Scholar]
  39. Prakash, A.; Storer, J.; Florencio, D.; Zhang, C. RePr: Improved training of convolution filters. In Proceedings of the IEEE Conference on Computer Vision and Pattern Recognition, Long Beach, CA, USA, 18–23 June 2019; pp. 10666–10675. [Google Scholar]
  40. Redmon, J.; Farhadi, A. YOLO9000: Better, faster, stronger. In Proceedings of the IEEE Conference on Computer Vision and Pattern Recognition, Honolulu, HI, USA, 21–26 July 2017; pp. 7263–7271. [Google Scholar]
  41. He, Y.; Dong, X.; Kang, G.; Fu, Y.; Yan, C.; Yang, Y. Asymptotic soft filter pruning for deep convolutional neural networks. IEEE Trans. Cybern. 2019, 3594–3604. [Google Scholar] [CrossRef] [PubMed] [Green Version]
  42. Chollet, F. Xception: Deep learning with depthwise separable convolutions. In Proceedings of the IEEE Conference on Computer Vision and Pattern Recognition, Honolulu, HI, USA, 21–26 July 2017; pp. 1251–1258. [Google Scholar]
  43. McFee, B.; Raffel, C.; Liang, D.; Ellis, D.P.; McVicar, M.; Battenberg, E.; Nieto, O. librosa: Audio and music signal analysis in python. In Proceedings of the 14th Python in Science Conference, Austin, TX, USA, 6–12 July 2015; pp. 18–25. [Google Scholar]
  44. Keras. Available online: https://keras.io (accessed on 6 May 2020).
  45. Abadi, M.; Barham, P.; Chen, J.; Chen, Z.; Davis, A.; Dean, J.; Kudlur, M. Tensorflow: A system for large-scale machine learning. In Proceedings of the 12th Symposium on Operating Systems Design and Implementation OSDI’ 16, Savannah, GA, USA, 2–4 November 2016; pp. 265–283. [Google Scholar]
  46. Powers, D.M.W. Evaluation: From Precision, Recall and F-Factor to ROC, Informedness, Markedness and Correlation. J. Mach. Learn. Technol. 2011, 2, 2229–3981. [Google Scholar]
Figure 1. Overall structure of the pig anomaly detection system used to detect postweaning multisystemic wasting syndrome (PMWS), porcine reproductive and respiratory syndrome (PRRS), mycoplasma hyopneumoniae (MH) and scream.
Applsci 10 06991 g001
Figure 2. Voice activity detection (VAD) block diagram.
Applsci 10 06991 g002
Figure 3. MnasNet architecture for pig abnormality classification: (a) MnasNet: 8-bit filters clustering algorithm applied to all layers; (b) SepConv; and (c) MBConv(E), k × k .
Applsci 10 06991 g003
Figure 4. 8-bit binary patterning of 3 × 3 filter: (a) original value; (b) binary value; and (c) 8-bit binary pattern value.
Applsci 10 06991 g004
Figure 5. Examples of pig sound signals: (a) Normal (healthy cough); (b) Normal (grunt); (c) mycoplasma hyopneumoniae (MH); (d) postweaning multisystemic wasting syndrome (PMWS); (e) porcine reproductive and respiratory syndrome (PRRS); and (f) Scream. The horizontal axis denotes the time in seconds and the vertical axis denotes the sound signal in dB.
Applsci 10 06991 g005
Figure 6. Sound detection result in pigsty using the VAD algorithm.
Applsci 10 06991 g006
Figure 7. MnasNet architecture after applying the 8-bit clustering method: (a) MnasNet: 8-bit filters clustering algorithm applied to all layers; (b) SepConv; (c) MBConv(E), k × k ; and (d) MBConv2(E), k × k .
Applsci 10 06991 g007
Table 1. Some of the recent pigs’ abnormality detection research (published between 2008–2019).
Target PlatformEnd Point DetectionActive Noise ControlSignal FeatureDetection TargetDetection TechniqueReal-Time PerformanceReference
PCNot specifiedNoFrequency domainCough by diseaseDynamic time warpingNot specified[9]
Not specifiedNoFrequency domainCough by diseaseStatistical analysisSpecified[10]
Not specifiedNoTime domainCough by diseaseStatistical analysisNot specified[11]
NoNoFrequency domainCough by diseaseStatistical analysisNot specified[12]
NoNoFrequency domainCough by diseaseMachine learningNot specified[13]
YesNoFrequency domainScream by stressStatistical analysisNot specified[14]
NoNoTime domainScream by stressStatistical analysisNot specified[15]
NoNoFrequency domainCough by air qualityMachine learningNot specified[16]
Table 2. Basic statistical information about the environmental noise in pigsty.
Weak FootstepsRadio OperationStrong FootstepsDoor Opening
SNR (dB)9.11728.79717.46814.6820
Mean intensity2.9 × 10−5−9.5 × 10⁻⁶−1.1 × 10⁻⁵−3.7 × 10⁻⁵
Max intensity0.45940.36820.91980.8978
Min intensity−0.5862−0.3615−0.9794−0.8593
Table 3. Sound-based pig abnormality identification results (Train: clean dataset).
Noise ConditionF1-Score
MnasNet DM 1.0MnasNet DM 0.75MnasNet DM 0.5Filter Clustering [29]Proposed Method Only 3 × 3 Layers Proposed Method All Layers
Clean 10.9430.9160.8410.9930.9930.993
SNR 200.9400.7480.6560.8850.8880.935
SNR 150.8650.6960.5710.7600.7860.860
SNR 100.8130.5930.43000.6760.6860.680
SNR 50.8130.5060.3250.5050.5060.598
SNR 00.5580.4600.2160.4780.3880.603
Radio operation0.8410.8680.6930.9930.9460.971
Weak footsteps0.8130.9060.6400.9330.9080.897
Strong footsteps0.9030.8510.7410.9360.9200.940
Door opening0.6600.7630.4630.7810.6960.680
Average0.8150.7310.5580.7940.7720.816
Standard deviation0.1210.1640.1950.1900.2010.157
1 Clean refers to the original data without noise synthesis.
Table 4. Sound-based pig abnormality identification results (Train: clean + SNR 0 synthesized dataset).
Noise ConditionF1-Score
MnasNet DM 1.0MnasNet DM 0.75MnasNet DM 0.5Filter Clustering [29]Proposed Method Only 3 × 3 Layers Proposed Method All Layers
Clean0.9850.9600.9130.9910.9760.993
SNR 200.9350.9350.8930.9910.9700.987
SNR 150.9810.9230.9100.9730.9760.978
SNR 100.9540.9060.8300.9910.9850.993
SNR 50.9630.8910.8550.9730.9730.993
SNR 00.9310.8630.7730.9830.9860.987
Radio operation0.8760.7900.8700.8630.7960.820
Weak footsteps0.8710.8200.8350.8330.8460.917
Strong footsteps0.9160.8600.7680.9060.9580.958
Door opening0.7830.7210.7100.7350.8610.845
Average0.9220.8670.8350.9240.9330.947
Standard deviation0.0620.0720.0670.0880.0700.065
Table 5. Comparison between the number of parameters of the pig-anomaly detector model and the execution time of the model on the TX-2 board (Train: clean + SNR 0 synthesized dataset).
MnasNet DM 1.0MnasNet DM 0.75MnasNet DM 0.5Filter Clustering [29]Proposed Method Only 3 × 3 Layers Proposed Method All Layers
No. of Model Parameters2,727,3101,607,106749,1182,268,7132,094,722646,624
TX-2 Average Execution Time0.473 s/image0.373 s/image0.268 s/image0.412 s/image0.378 s/image0.253 s/image
Table 6. Confusion matrix for identification of pig abnormalities (Test: Clean + All synthesized noise dataset).
Predicted
Healthy CoughGruntMHPMWSPRRSScream
Healthy Cough17910000
Grunt51790602
MH04121100
PMWS39123910
PRRS53002592
Scream123000237
Table 7. Performance comparison between proposed method and other disease detection studies regarding cough detection.
Guarino et al. [9]Exadaktylos et al. [10]Chung et al. [13]Proposed Method
CDR (%)85.582.294.099.0
FPR (%)13.412.05.44.0
FNR (%)14.517.86.01.0
FeatureFrequency domainPower spectral densityMFCCSpectrogram
Detection methodDynamic time warpingStatistical analysisSupport vector data descriptionDeep learning
Table 8. Comparison of respiratory disease identification performance between proposed method and that used by Chung et al. [13].
Chung et al. [13]Proposed Method
Precision (%)Recall (%)Precision (%)Recall (%)
MH85.782.096.099.1
PMWS94.896.494.497.1
PRRS92.097.896.299.6
Average90.892.095.598.6
FeatureMFCCSpectrogram
Detection methodSparse representation classifierDeep learning

