1. Introduction
It is well known that the dynamic thermal performance of building structural components, interior fabric, and enclosure significantly influence whole-building energy consumption, dynamic thermal response of a building, and consequently, peak energy demands. In buildings, the thermal mass effect determines the ability to store energy as either sensible or latent heat. This can have a significant influence on indoor temperatures, building energy dynamics and power requirements, as well as occupant comfort. Today, in response to the growing worldwide interest in energy dynamics, building designers, many research institutions, government agencies, and energy companies are rediscovering the principles of building thermal response [
1,
2,
3,
4,
5] and passive solar architecture [
6,
7] which have been known for half a century [
8,
9]. This is in addition to a variety of more or less advanced building energy efficiency strategies based on thermal mass [
10,
11,
12,
13]. The terms thermal mass, thermal capacitance, and building thermal response have recently gained wide interest in discussions about the temperature buffering effects and reduction of the rate of changes in internal comfort conditions [
14]. Thermal mass in buildings is of special importance because of dynamic environmental loads caused by dynamic operation, space conditioning, and the resulting dynamic power demand. Therefore, thermal mass and building energy dynamics are becoming dominant factors in building design and the operation of a majority of buildings globally [
15,
16]. Very few new buildings are being operated in steady-state conditions. Residential buildings, for example, which are occupied by working residents, are continuously space conditioned only during the weekends, while, during the weekdays, space conditioning is used during mornings, evenings, and nights [
17]. The situation is different for many commercial buildings that operate continuously [
18,
19,
20]. A large volume of studies has shown how thermal mass can lead to the reduced space conditioning loads. A technology review performed by Balaras [
13] concluded that thermally massive components had a significant impact on the thermal response of buildings. Specifically, buildings with high thermal mass had lower interior air temperature fluctuations as compared with lightweight buildings. In another study, Zaki and Hassan [
21] analyzed a simplified two-layer wall model exposed to periodic changes in ambient temperature and solar radiation with a parametric analysis of wall material characteristics and the orientation and internal placement of thermal insulation. The general conclusion was that these parameters affected the peak heat flux density on the interior surface, which was reduced when insulation was placed on the envelope’s interior side. Furthermore, thermal mass impacted human comfort and well-being. A building’s response to external climatic conditions impacts inhabitants’ physical and psychological needs, which is essential to give them a sense of self-worth, safety, and privacy. In addition, a healthy environment delights and uplifts the spirt, promotes relaxation, and provides contact with nature [
22,
23].
The goal of much of the above institutional research has been to optimize the interplay between building loads and an electric power grid. This approach builds on energy efficiency research and developments that also consider the impact of distributed energy resources, including building-integrated renewable power generation, demand response, and energy storage, to enhance the flexibility and effectiveness of demand-side management [
24,
25]. Furthermore, dynamic operation of thermally massive building components can be triggered in response to forecasted needs for reserve capacity, changes in renewable generation output, or actual variations in electricity demand. Responses to these grid service demands for water heating, HVAC, and lighting systems have motivated the creation of control strategies. From another perspective, because buildings are the primary users of electricity, they have substantial potential to provide cost-effective grid services through a variety of advanced demand-side management systems. In the United States, end-uses associated with opaque building envelopes account for about 40% of residential and commercial electricity use [
26].
Thermal storage in buildings plays an important role in energy conservation. This includes the use of latent heat storage (phase transition) in different types of structural components, environmental barriers, and surface finish materials. It has been observed that building components that store heat generated by solar radiation could reduce space conditioning energy consumption and resulted in a shift and reduction in peak-hour energy consumption. In high performance massive buildings, this capability for peak-period demand reduction often requires no additional transient controls or enabling technologies. However, phase change materials (PCMs) are one of the key thermal control technologies used today in buildings using lightweight envelopes. PCMs have been examined as thermal mass components in buildings since the 1940s, when the first-ever residential house utilizing PCM heat storage was built in Massachusetts [
27]. A key goal in low-energy building research is to find ways to manage differences in time between energy generation and energy consumption (i.e., building loads). According to the International Energy Agency (IEA) Annex 24/42, energy conservation through solar energy utilization, conventional energy, and advanced PCM thermal storage, is essential for energy efficiency. PCMs are emerging with the potential to dramatically reduce energy consumption for comfort conditioning and peak utility demand in buildings.
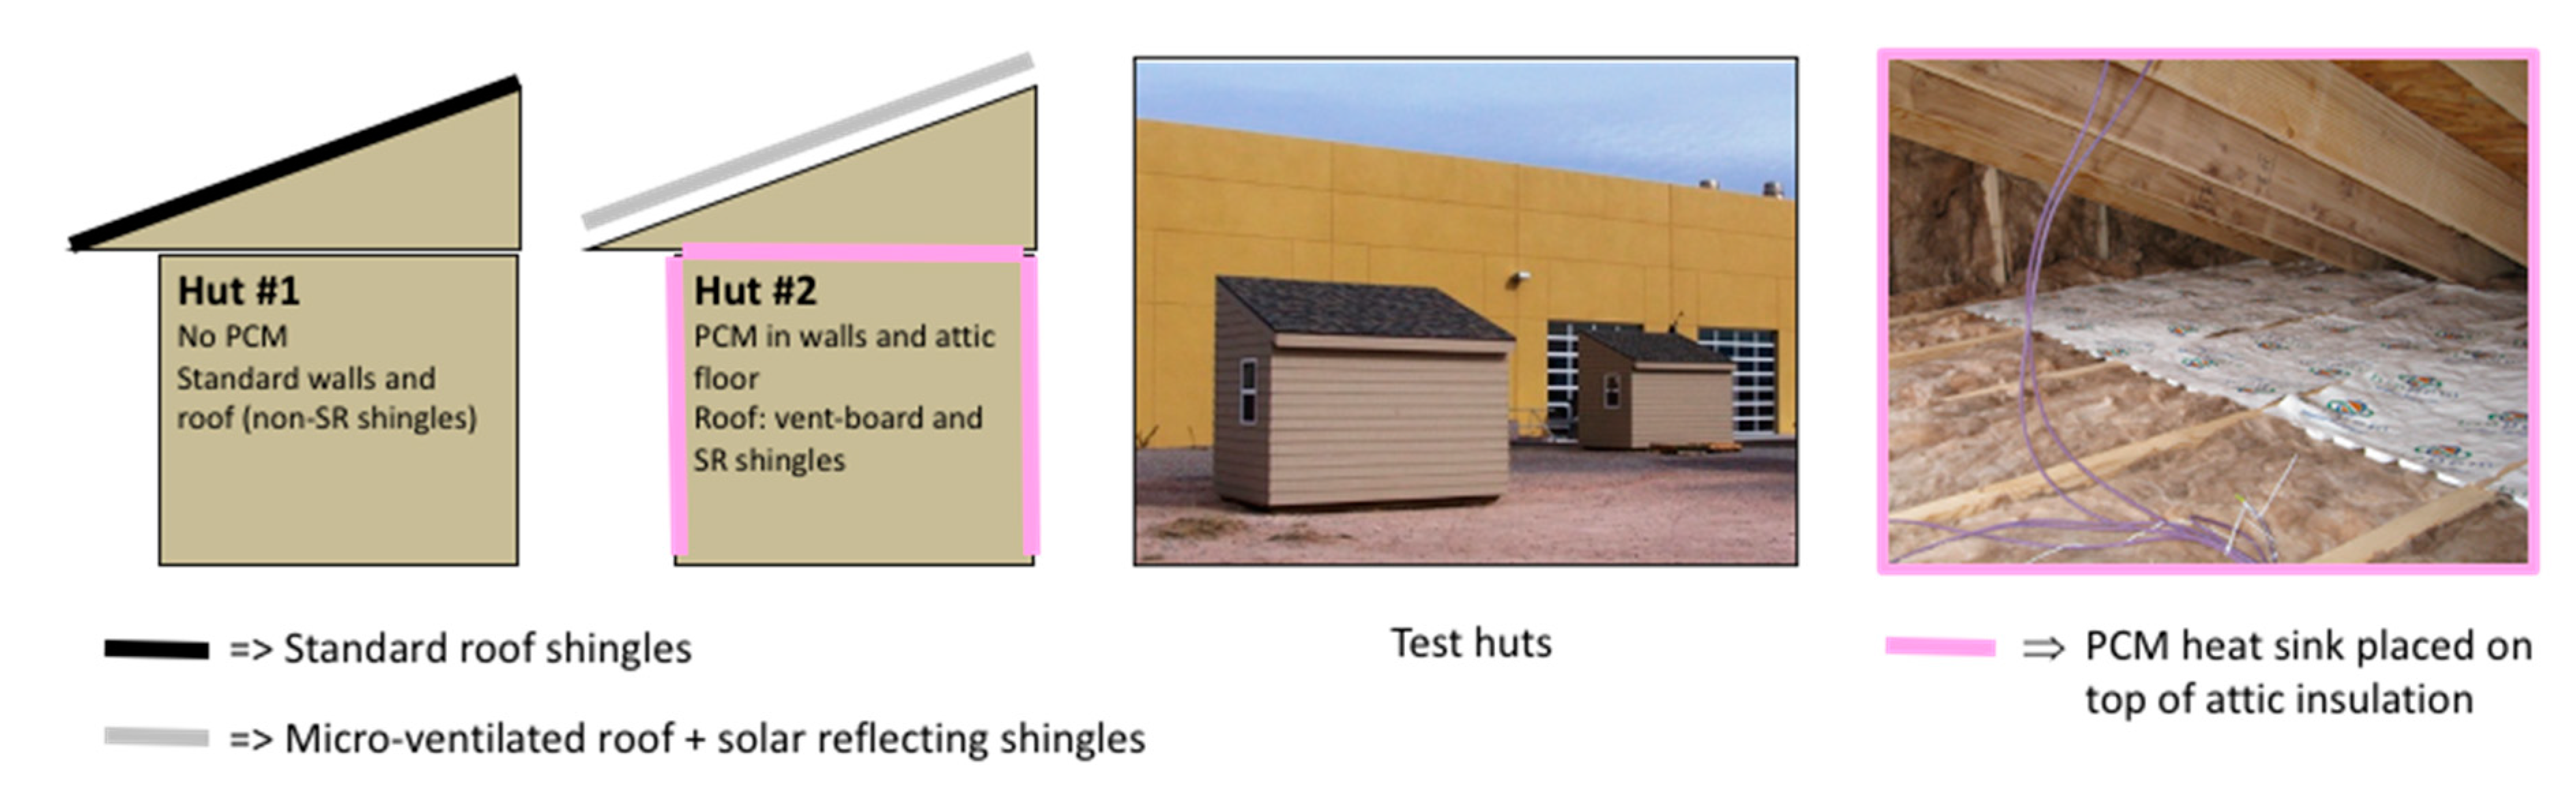
The magnitude of the impact of PCMs on the cooling season electric power demand of high-performance building envelopes was recently demonstrated in Albuquerque, NM, USA. Fraunhofer CSE constructed two well-insulated wood framed test huts (shown in
Figure 1) that were operated during the summer and fall of 2011. In addition to fiberglass insulation, one of these near-identical huts contained layers of PCM integrated into the attic and wall cavity insulation as follows:
- (i)
between two layers of insulation on the ceiling, i.e., on top of R-3.7 (m2∙K/W) fiberglass insulation and under another R-2.3 (m2∙K/W) layer of fiberglass insulation;
- (ii)
inside the wall cavities, i.e., within R-2.3 (m2∙K/W) fiberglass insulation at about 3 cm from the internal surface of the cavities in between two layers of fiberglass batts of custom thickness.
The amount of thermal insulation in the huts was the same. The test hut containing PCM also had reflective (cool) roof shingles and a layer of microchannel board installed on top of the roof deck and both test huts had very similar air-leakage rates, as confirmed with blower door testing.
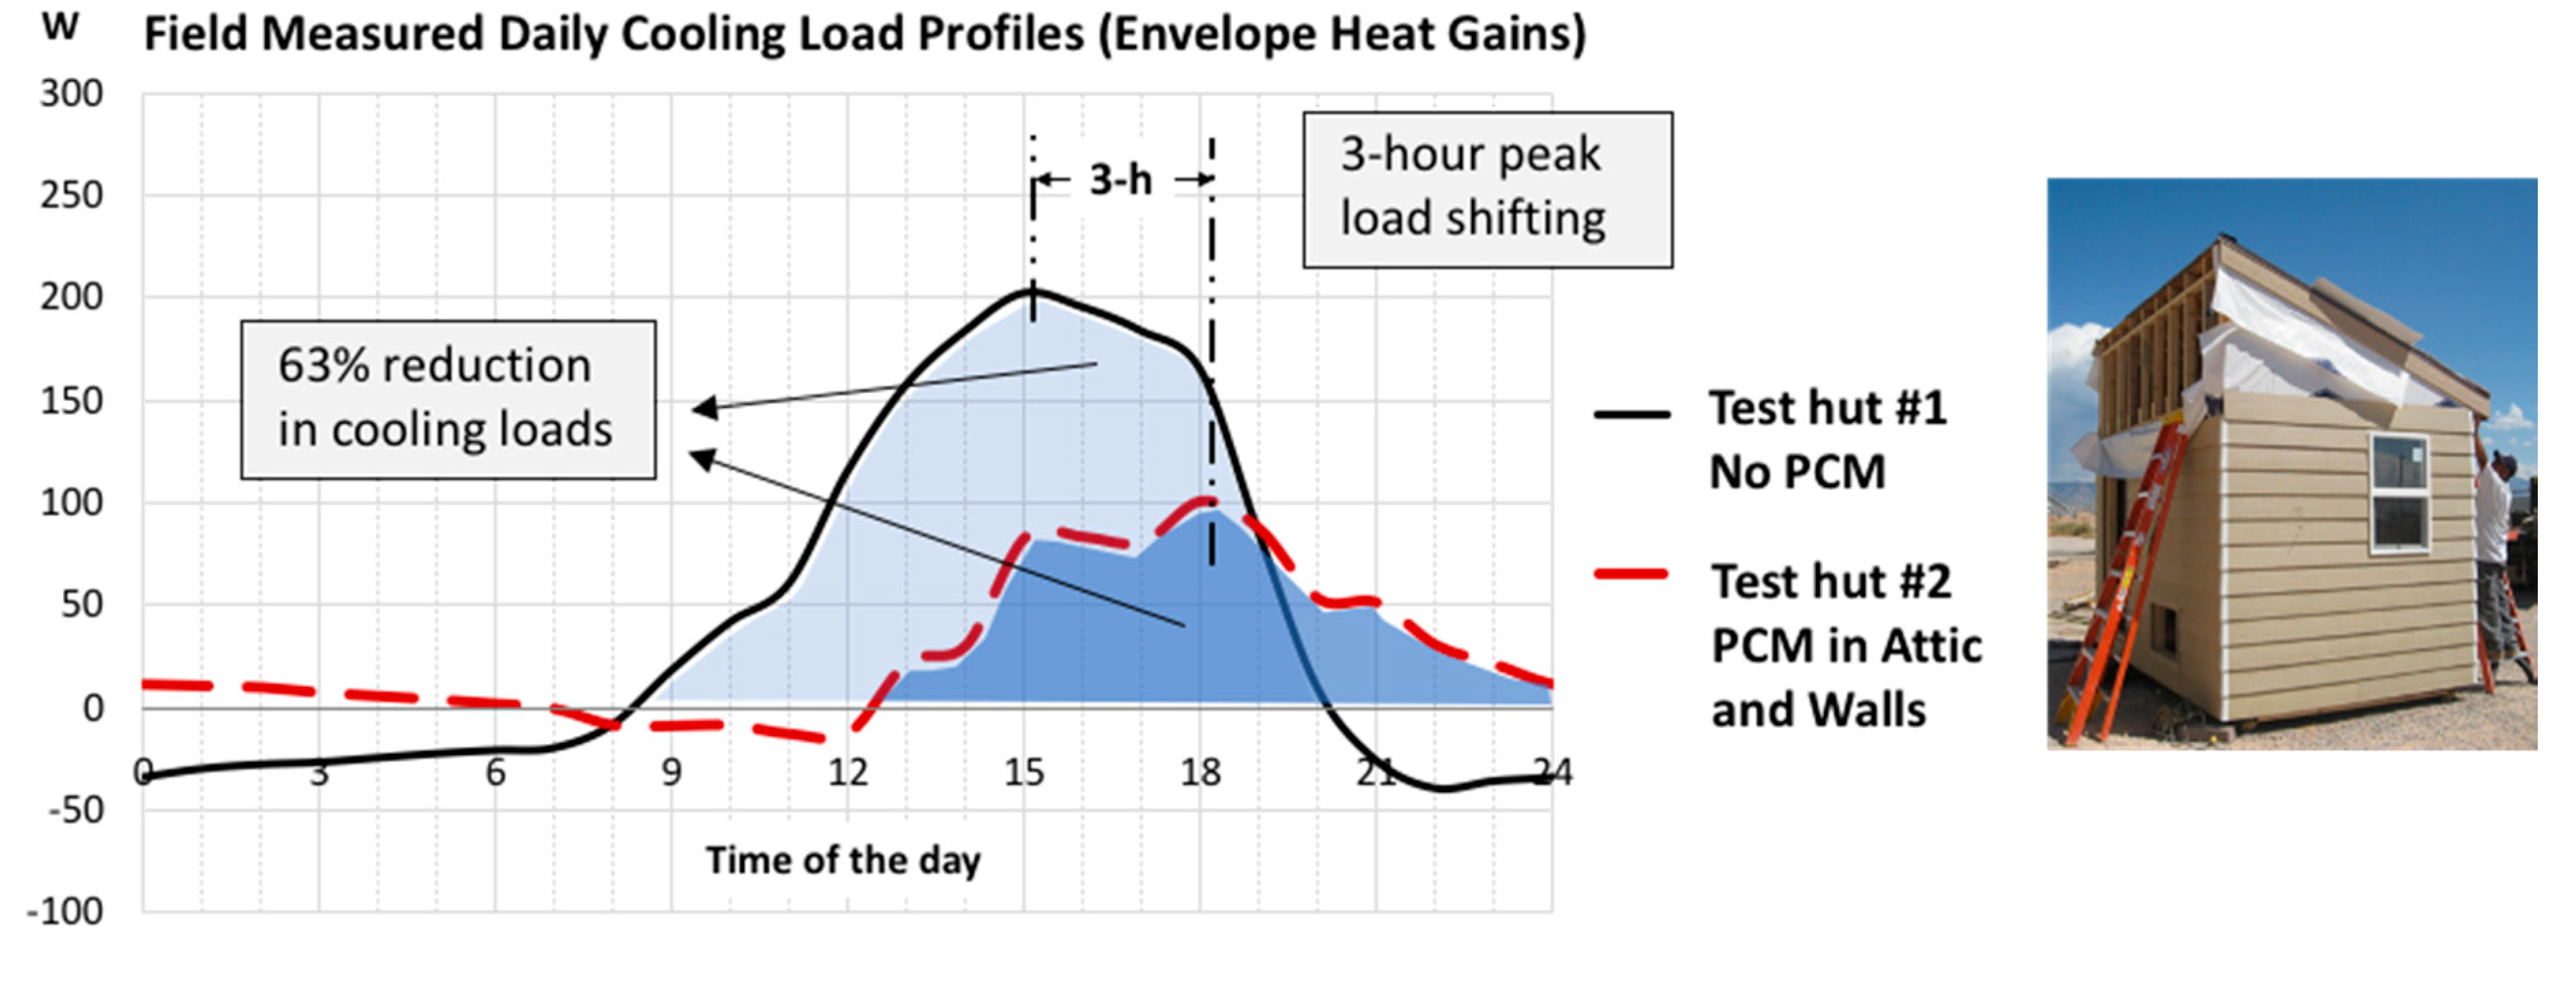
The whole-hut results presented in
Figure 2 demonstrate that envelope-related cooling loads are similar during the early morning hours for the test huts. However, during and a few hours after peak solar irradiance, in the test hut with PCM (Hut #2) the heat flow across the envelope was dramatically reduced as compared with the other hut. As a result, the hut’s load peak was shifted three hours in the afternoon and the total whole-hut cooling load was reduced by 63%. This shows the great potential for using dynamic, thermally enhanced envelopes containing PCMs, combined with thermal break (microchannel board) and reflective surface (cool roof shingles) to control building energy dynamics and peak-energy demand.
Meaningful predictions of the heat flow crossing the attic floor require accurate field measurements because of the multiplicity of variables affecting the thermal performance of the roof and attic. Several generations of novel roof designs, developed by the authors, have demonstrated as much as 90% reduction in roof-generated peak-hour cooling loads, significant peak-load time shifting, and reductions in overall cooling loads as compared with traditional roof-attic systems using the same level of thermal insulation [
28]. In many historical PCM studies, the major interest invariably tilted toward the building operators’ or owners’ interest in energy savings associated load reductions. However, most recently, these interests have shifted to include building thermal response characteristics, energy consumption dynamics, peak-energy load management, and analyses of the dynamic thermal response of building structures. Specifically, a major focus of this paper is on time shifting of peak thermal loads and decrease in their maximum value. To illustrate the vast potential of thermally massive envelopes using latent heat storage, in energy conservation and power demand control, this paper discusses an assortment of advanced designs of roofs and attics that utilize PCMs and conventional thermal mass for short-term energy storage and control of roof-generated dynamic thermal loads.
2. Heat Transfer in PCM-Enhanced Envelopes
Modern, dynamically operating roofs and attics typically include high levels of thermal insulation, advanced ventilation, radiant barriers, and latent heat storage components that boost thermal performance in a variety of environmental conditions. In addition to roof and attic geometries, optical characteristics of roof surface material and eventual location of radiant barrier, material thermal conductance, thickness, density, and heat-storage capacity of PCM-enhanced products are key design factors used by roof designers today.
The scale of thermal behavior improvements attributable to PCM-enhanced building envelopes depends on the amount of PCM used and the physical properties of the PCM, climate conditions, and the design of the building. Therefore, a comprehensive numerical analysis of thermal and energy effects in buildings using PCMs is essential for an evaluation of their potential energy benefits. Several numerical models, developed for system-scale thermal simulations of PCM-enhanced envelopes, are available today to capture details of the heat transfer process [
29,
30,
31]. However, more streamlined algorithms, are also frequently preferred, because they can rapidly generate estimates of PCM performance.
Simplified theoretical models of materials with temperature-dependent specific heat can be used for analysis of phase transition processes in most common materials [
32,
33,
34]. In homogeneous materials with temperature-dependent specific heat, the one-dimensional heat transport process can be described by the following equation, where h is the enthalpy density, which represents a heat term that includes energy associated with the phase-change process:
The terms
ρ and
k are material density and thermal conductivity and
T is temperature. The heat flux,
q, across a material thickness
x is given by Equation (2):
After consideration of a constant pressure, the enthalpy derivative over the temperature represents the effective heat capacity, with phase change energy being one of the components:
For most PCM-enhanced insulations and composite materials, variations of enthalpy with temperature depend (to some extent) on the direction of the considered heat flow process and are different for melting and solidification. Therefore, in the case of materials containing PCM, theoretical models utilizing the temperature-dependent specific heat, represented by a unique function of temperature, are only approximations of a real material thermal capacitance.
PCMs can be used in building components either as condensed applications, usually as arrays of plastic or metallic foil containers, or mixed with carrier materials such as thermal insulation, plastics, gypsum, or concrete. For blends of thermal insulation with PCM, the effective heat capacity,
ceff, can be expressed as follows, using a simplified formula:
where
α denotes the weight fraction of PCM,
cins the specific heat of the carrier insulation without PCM, and c
effPCM is the effective heat capacity of the PCM product.
In the melted liquid phase, the effective heat capacity of PCM does not show significant temperature dependence. Therefore, it can be a good approximation represented as the sum of the two following terms:
where
cl represents the temperature independent specific heat in the liquid state.
For a material to be used as a thermal insulation, the apparent thermal conductivity,
ka, is the most important property. For a given insulation material,
ka is a function of density,
ρ, and temperature,
T. In the case of cellular plastic insulation containing a gas other than air, the age of the insulation is also a factor. For practical applications, the ASTM C1784 standard [
35] introduces the “solid” and “liquid” phases as a function of temperature,
T, as well as the effective specific heat,
c, in the phase transition region.
The apparent thermal conductivity was used in an analysis of dynamic performance of building materials containing PCM. Cellulose fiber insulation mixed with microencapsulated PCM is used as an example of a distributed PCM application, where microencapsulated PCM is dispersed in fibrous thermal insulation. For the PCM-enhanced cellulose fiber insulation, linear temperature dependence of conductivity is observed [
36,
37] as:
where
and
.
It is important to mention that the addition of microencapsulated PCM for insulation or limited impregnation with liquid PCM usually does not significantly change the ka of the insulation (this is for small amounts of PCM that have not been modified to provide enhanced thermal conductivity).
3. Thermal Balance and Time Constant of a Solid Slab Containing Phase Change Materials (PCM)
Thermal design and optimization of building envelopes containing PCM require an in-depth performance analysis. This is usually the first step in the process of determining the location, amount, and active temperature region for the PCM. This analysis frequently includes decisions about the following: (i) sequence of materials, (ii) location of PCM, (iii) amount of PCM, (iv) expected time lag associated with heat storage, and their impact on energy use. The determination of the optimal phase transition temperature range is an important step in the optimization, since this leads to the selection of a specific PCM product and its placement.
To illustrate dynamic thermal performance of a building component containing PCM, the temperature-dependent specific heat model is utilized. An integral formula, for the total heat flow in finite time interval, across the surface of a slab of a PCM enhanced material, is derived. Theoretical analysis is performed to investigate heat transfer through a light-weight envelope assembly with PCM-enhanced insulation under cyclic external temperature excitations. In this analysis, a plane slab of thickness,
L, composed of materials containing PCM was assumed. Linear boundary conditions at the internal (
x = 0), and external (
x =
L) surface can be expressed in the following form:
where
Ti and
Te are ambient temperatures and
Rsi and
Rse are surface film resistances, assuming for simplification that
Rse is constant (not dependent from exterior wind conditions).
Let us denote,
Ri−x and
Rx−e as the resistances for heat transmission from the point
x in the slab to the internal and external environment, respectively, and
Ru as the total resistance for heat transmission through the envelope assembly. With conductivity along the assembly’s thickness represented by the function of
, the resistances can be denoted as follows:
Multiplying Equation (1) by the function
Rx−e and integrating with respect to
x over thickness of the slab, we obtain the following formula:
Temperatures
T(0) and
T(
L) can be eliminated using Equations (7) and (8), giving the following expression for the heat flux at the internal surface:
An analogous formula for q(L) is obtained upon multiplying Equation (1) by Ri−x and integrating by parts.
The effect of time variations of enthalpy, h, along thickness of the slab, on the heat flux across the surface x = 0, depends, thus, on the factor Rx−e/Ru, which takes on comparatively high values, close to 1, in the vicinity of that surface and low values, close to 0, in the vicinity of the opposite surface x = L. This means that only time variations of enthalpy near the surface considered, play an important role, whereas the effect of variations near the opposite surface may be small.
Now, assume that densities and conductivities are temperature independent, and thus constant in time. The last assumption should be understood as an approximation; especially in the case of insulation materials (see Equation (6)).
By integrating Equation (13) with respect to time, over the time interval [
t1,
t2], and interchanging the integration order, one obtains:
The time integral in the second term represents the enthalpy difference Δ
h; it can be expressed as follows:
Integration of
ceff (
x,
T) over temperature can be conducted when the final temperature distribution in the slab is known. For particular heat transfer processes, it is possible to determine the enthalpy difference Δ
h without performing detailed simulations. Taking into account Equation (15), the total heat flow in time interval [
t1,
t2] across the surface
x = 0 is given by:
ΔHs0 represents that part of the total enthalpy difference in a slab which is due to the heat flow across the surface x = 0. For cyclic processes, time integration is over an integral number of cycles, ΔHs0 = 0, and total heat flow depends on the mean ambient temperature difference.
Time constant expresses the delay of the transient component of the heat flux in a building envelope assembly (generated by a rapid thermal excitation) [
34,
38,
39]. In the case of PCM-enhanced building assemblies, the knowledge of time constants helps for optimizing their design from a whole building thermal response perspective and in the management of the energy demand, which are essential for building interaction with a power grid. Time constants can be utilized in the whole-building energy simulations as well.
To estimate the time constant of a slab containing PCM, we start from the theoretical determination of the heat flux,
q(
t), across a unit surface area of the slab at the cold side, after a step change in temperature on the opposite hot side (as a function of time t). As derived below, it can be approximately described as a simple relaxation process:
The total heat flow in time interval [0,
t] is given by:
For time
t sufficiently long, as compared with
τs, the steady state of heat flow is attained, and
Q(
t) can be approximated by:
A comparison of Equations (17) and (22) yields:
In earlier works of Kossecka and Kośny [
38], a similar analysis was used for estimating the time constants for conventional non-PCM assemblies, for analysis of hot box test measurements. However, in the case of a PCM specimen, the time constant is strongly dependent on its enthalpy in the temperature interval.
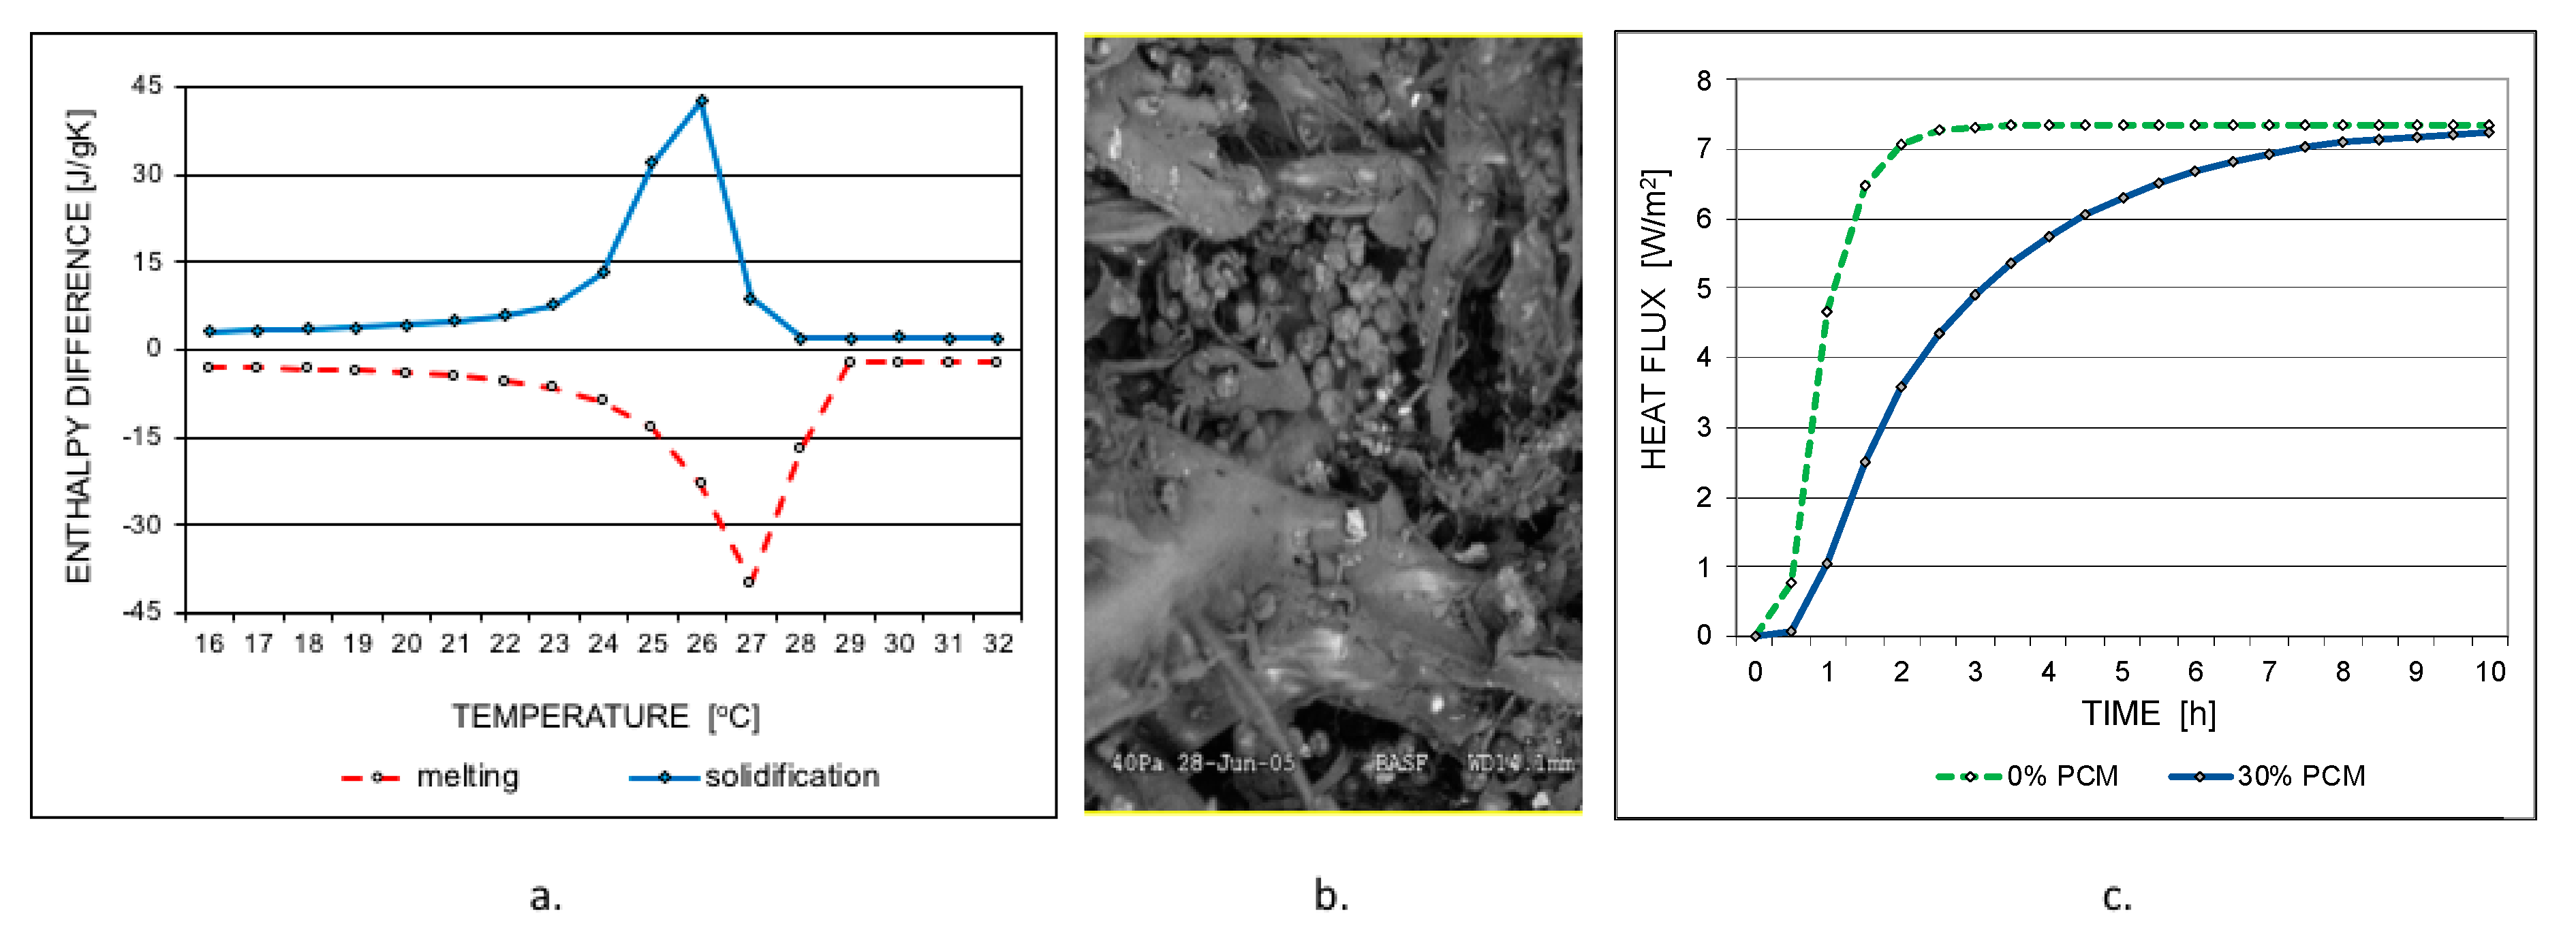
The thermophysical properties of the materials being discussed in this section are contained in
Table 1, for a simple opaque building envelope that contains as a core a 0.14 m thick thermal insulation layer. The considered envelope contained the following, in series: (i) 0.013 m thick gypsum board; (ii) 0.140 m thick layer of cellulose insulation, or PCM-enhanced cellulose insulation; (iii) 0.013 m thick plywood board; and (iv) 0.013 m thick layer of exterior finish material. A curve showing the enthalpy relation with temperature is depicted in
Figure 3a for used PCM.
Figure 3c contains a comparison of heat fluxes across a 140 mm layer of cellulose fiber and a second specimen of the cellulose insulation with 30 wt% of microencapsulated organic PCM. The heat fluxes are the result of a rapid increase in temperature from 14 to 44 °C, on one surface.
Time constants,
τs, for the thermal excitation obtained from Equations (16), (19), and (23) are 56 min for insulation alone and 153 min for the PCM-insulation blend. It is worthwhile to note that in the case of the analyzed building envelope containing an insulation layer with a thickness of 0.14 m, the addition of 30% by weight of PCM micropellets to the cellulose fibers tripled the time constant of the resulted material blend. This is illustrated in
Figure 3c, where heat flux rose significantly faster in the case of thermal insulation not containing PCM.
4. Dynamic Thermal Response of PCM-Enhanced Insulation under Different Magnitudes of Thermal Excitations: A Theoretical Analysis
A series of one-dimensional thermal simulations were performed to illustrate the impact of PCM and building envelope configuration on the dynamic thermal behaviour. The major goal was to investigate the transient performance of lightweight building elements with and without PCM-enhanced insulation. Insulation thickness, internal space temperature, and external thermal conditions were varied. The thermodynamic data shown in
Figure 3 were used to establish
Ceff,
Ceff(T) and
λa(T) from Equation (6), and in turn were used in the following analysis. Building envelope assembly similar to a typical 165 mm thick cathedral roofing structure was considered. The 140 mm space enclosed by the gypsum board and plywood was either filled with cellulose insulate or with PCM-cellulose blend. In the second case, the 140 mm thick layer of PCM-cellulose was used with density of 33.6 kg/m
3. It contained 30 wt% of microencapsulated PCM. This yields 1.4 kg/m
2 of PCM of the building element, that provides ~168 kJ/m
2 of energy storage. For comparison, a 300 mm thick layer would have about 360 kJ/m
2 energy storage capacity. Assuming one-dimensional heat transfer without consideration of thermal bridging due to structural components, the air-to-air thermal resistance of analysed building element is
Ru = 4.14 m
2·K/W (this includes surface film resistances
Rsi = 0.13 m
2·K/W and
Rse = 0.04 m
2·K/W). The assembly U-value is 0.24 W/m
2·K.
The main goal is to analyse the dynamic responses of the assumed roof assembly, due to external thermal excitations of different magnitudes. In this analysis, the external boundary conditions are represented by a single value for the external air temperature and incident solar radiation. When solar radiation absorbed on the exterior surface,
qs, is included, the boundary condition takes the form:
Tes is the so-called sol-air temperature [
24]. After consideration of
Rse = 0.04 m
2·K/W, solar radiation flux of 1000 W/m
2 makes (
Tes −
Te) by 40 °C.
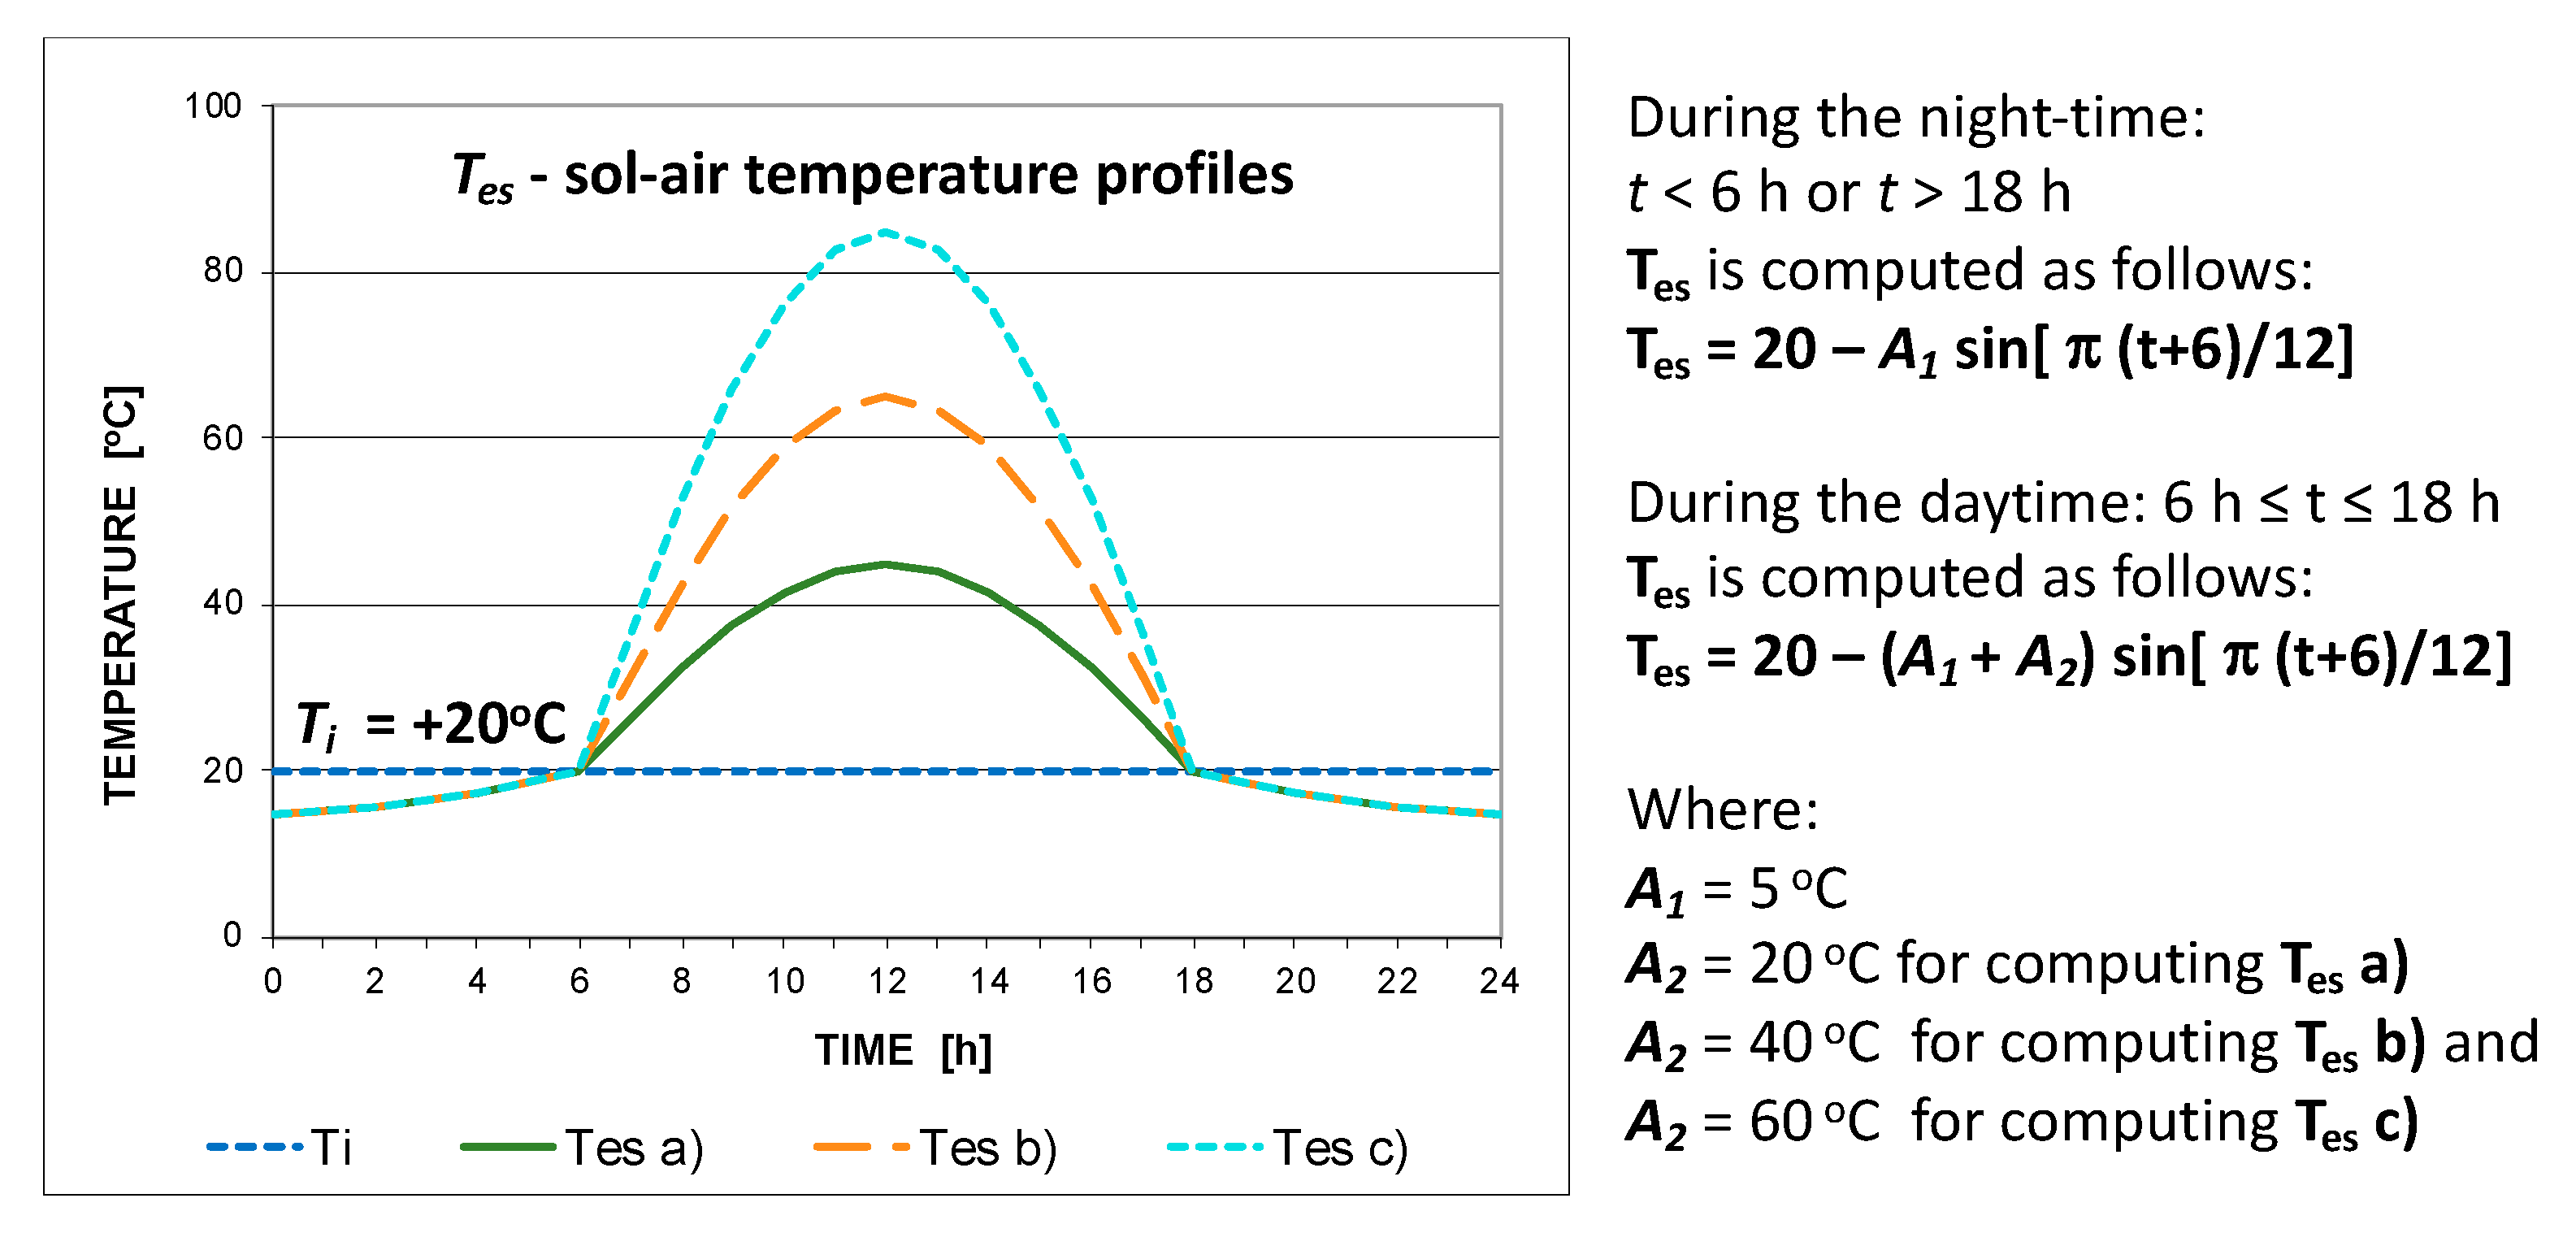
The external (sol-air) temperatures used in the analysis are shown in
Figure 4. They are computed as follows:
during the night-time,
t < 6 h or
t > 18 h and
during the daytime, 6 h ≤
t ≤ 18 h.
Two series of simulations were performed for Ti = 20 °C, Te0 = 20 °C and Ti = 25 °C, Te0 = 20 °C, with amplitudes values A1 = 5 °C and A2 = 20 °C, 40 °C, and 60 °C. Subsequently, simulation cycles were repeated to minimize the effect of initial conditions. The specific PCM used in the simulations had a melting temperature of 23 °C and complete solidification at 22 °C. This selection of PCM phase transition characteristics was intentional because both external and internal air temperatures during the night were below 22 °C, i.e., the PCM solidification temperature, to ensure that the stored latent heat is fully discharged during the night. This strategy created perfect conditions for PCM heat storage and maximum utilization of phase change enthalpy. Please note that an appropriate design of the PCM-enhanced building envelopes should always include both a detailed temperature analysis in the place where PCM is located, as well as climatic conditions. The goal is to minimize the number of days, when PCM is either not fully melted during the day or solidified during the night.
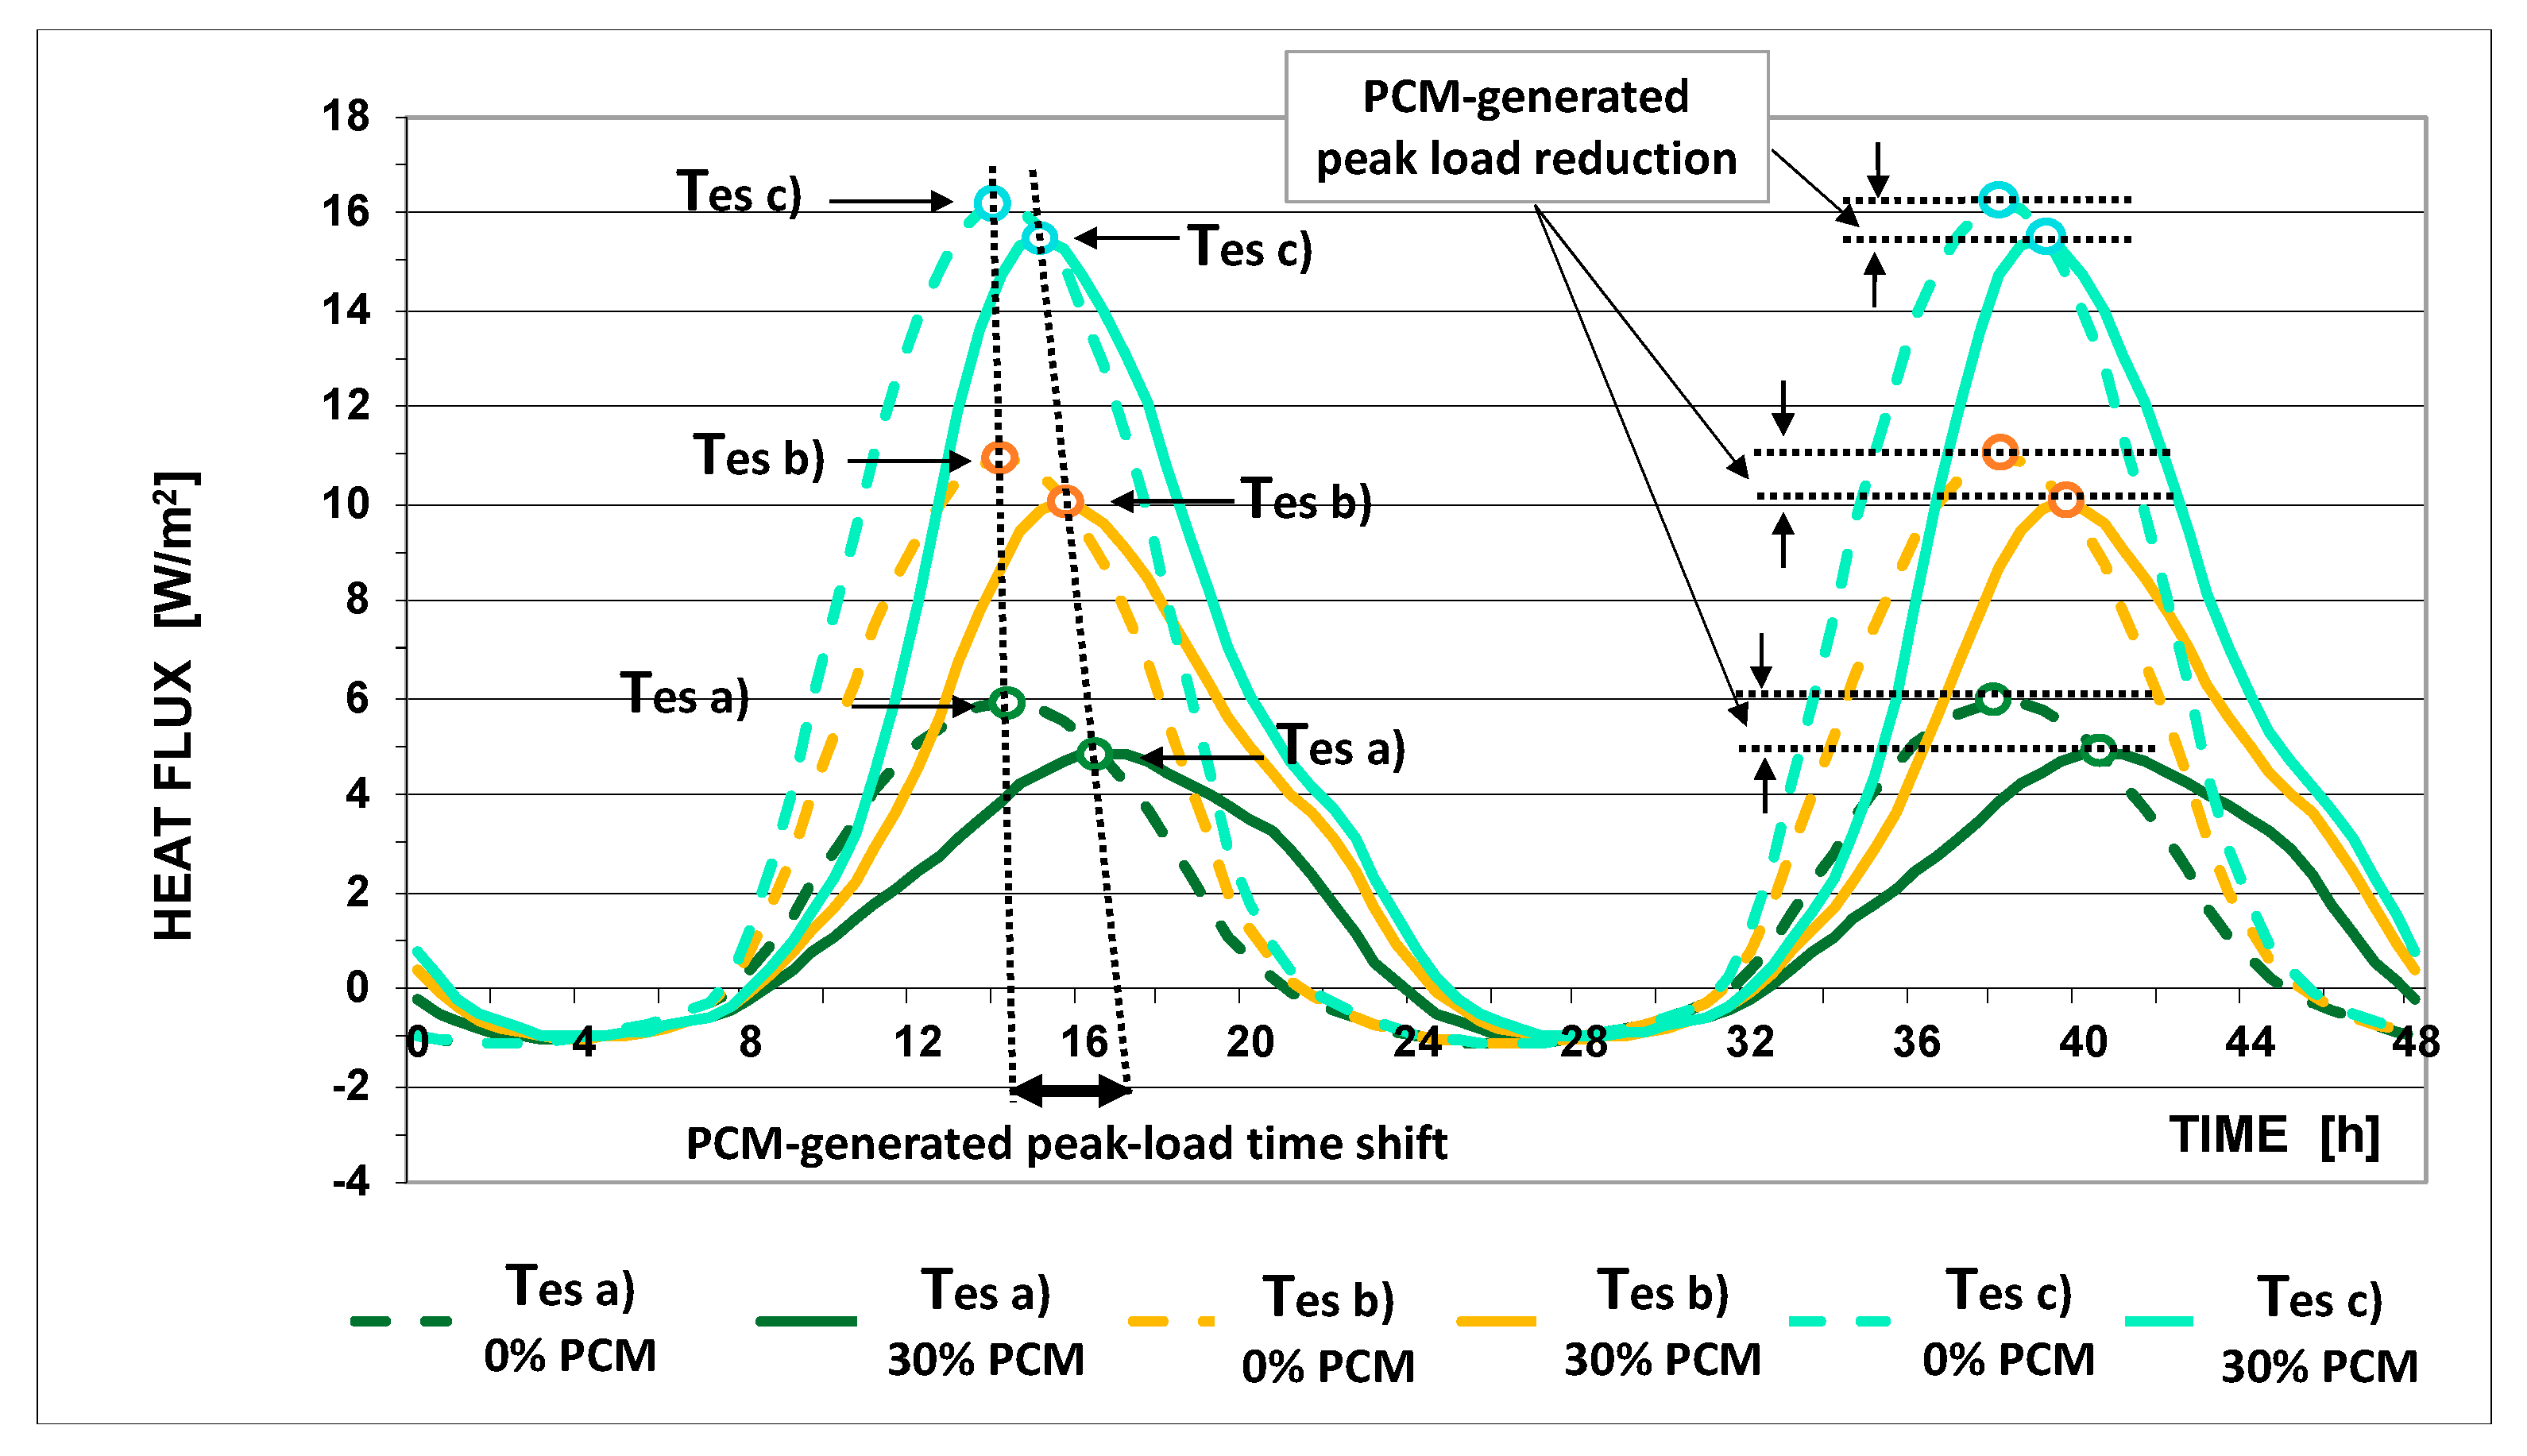
Figure 5 and
Figure 6 show the comparisons of diurnal heat flux profiles on internal surfaces for two thicknesses of envelope assemblies containing 14 cm and 30 cm of thermal insulation, and for two configurations of thermal insulation, i.e., one containing plain fibrous insulation layer, and another one containing 30% PCM enhanced insulation. The comparison of the plots and calculated daily heat flow values indicates that, for cyclic processes, the effect of PCM in an insulation layer results in the following: (i) notable time shifting of the heat flux maxima, (ii) lowering the peak heat flux value, and (iii) reduction of the overall heat flow. Heat losses corresponding to minimum external temperatures at midnight are shifted to morning time. This can significantly reduce the morning energy consumption peak during the cooling season. At the same time, the daily heat gain peaks (peak cooling loads) are moved from the midday hours to the afternoon.
For assemblies with a 14 cm insulation/PCM-insulation layer, comparisons of calculated diurnal heat flow values indicate cyclic external peak load shifts up to 2.5 h and peak heat flow value reductions up to 11% (see
Figure 5). However, PCM does not cause any considerable reductions in total daily heat flow rates. At the same time, heat losses corresponding to minimum external temperatures at midnight are shifted to morning hours.
As depicted in
Figure 5, more noticeable dynamic effects can be observed in the cases of lower sol-air temperatures during the day (
Tes (a) and
Tes (b) cases on
Figure 4). This indicates that thin roof assemblies (i.e., cathedral and sandwiched roofs) containing thin layers of conventional and PCM-enhanced thermal insulation are not effective in time shifting of the thermal peak loads in buildings during the cooling season.
For material configurations presented in
Figure 5, both the reductions of peak thermal load values and the total load values are insignificant. Assuming that the cost would not be too high, further addition of PCM could still improve this performance. However, PCM would need to be added in a different (concentrated) form with significantly higher thermal storage capacity. This is because the PCM blending with a rate higher than 30% would compromise insulation thermal resistance, also keeping in mind that due to the mentioned earlier simplifications in the numerical representation of external thermal loads, the results discussed above are only approximate projections derived for specific building envelope components, not for the whole building.
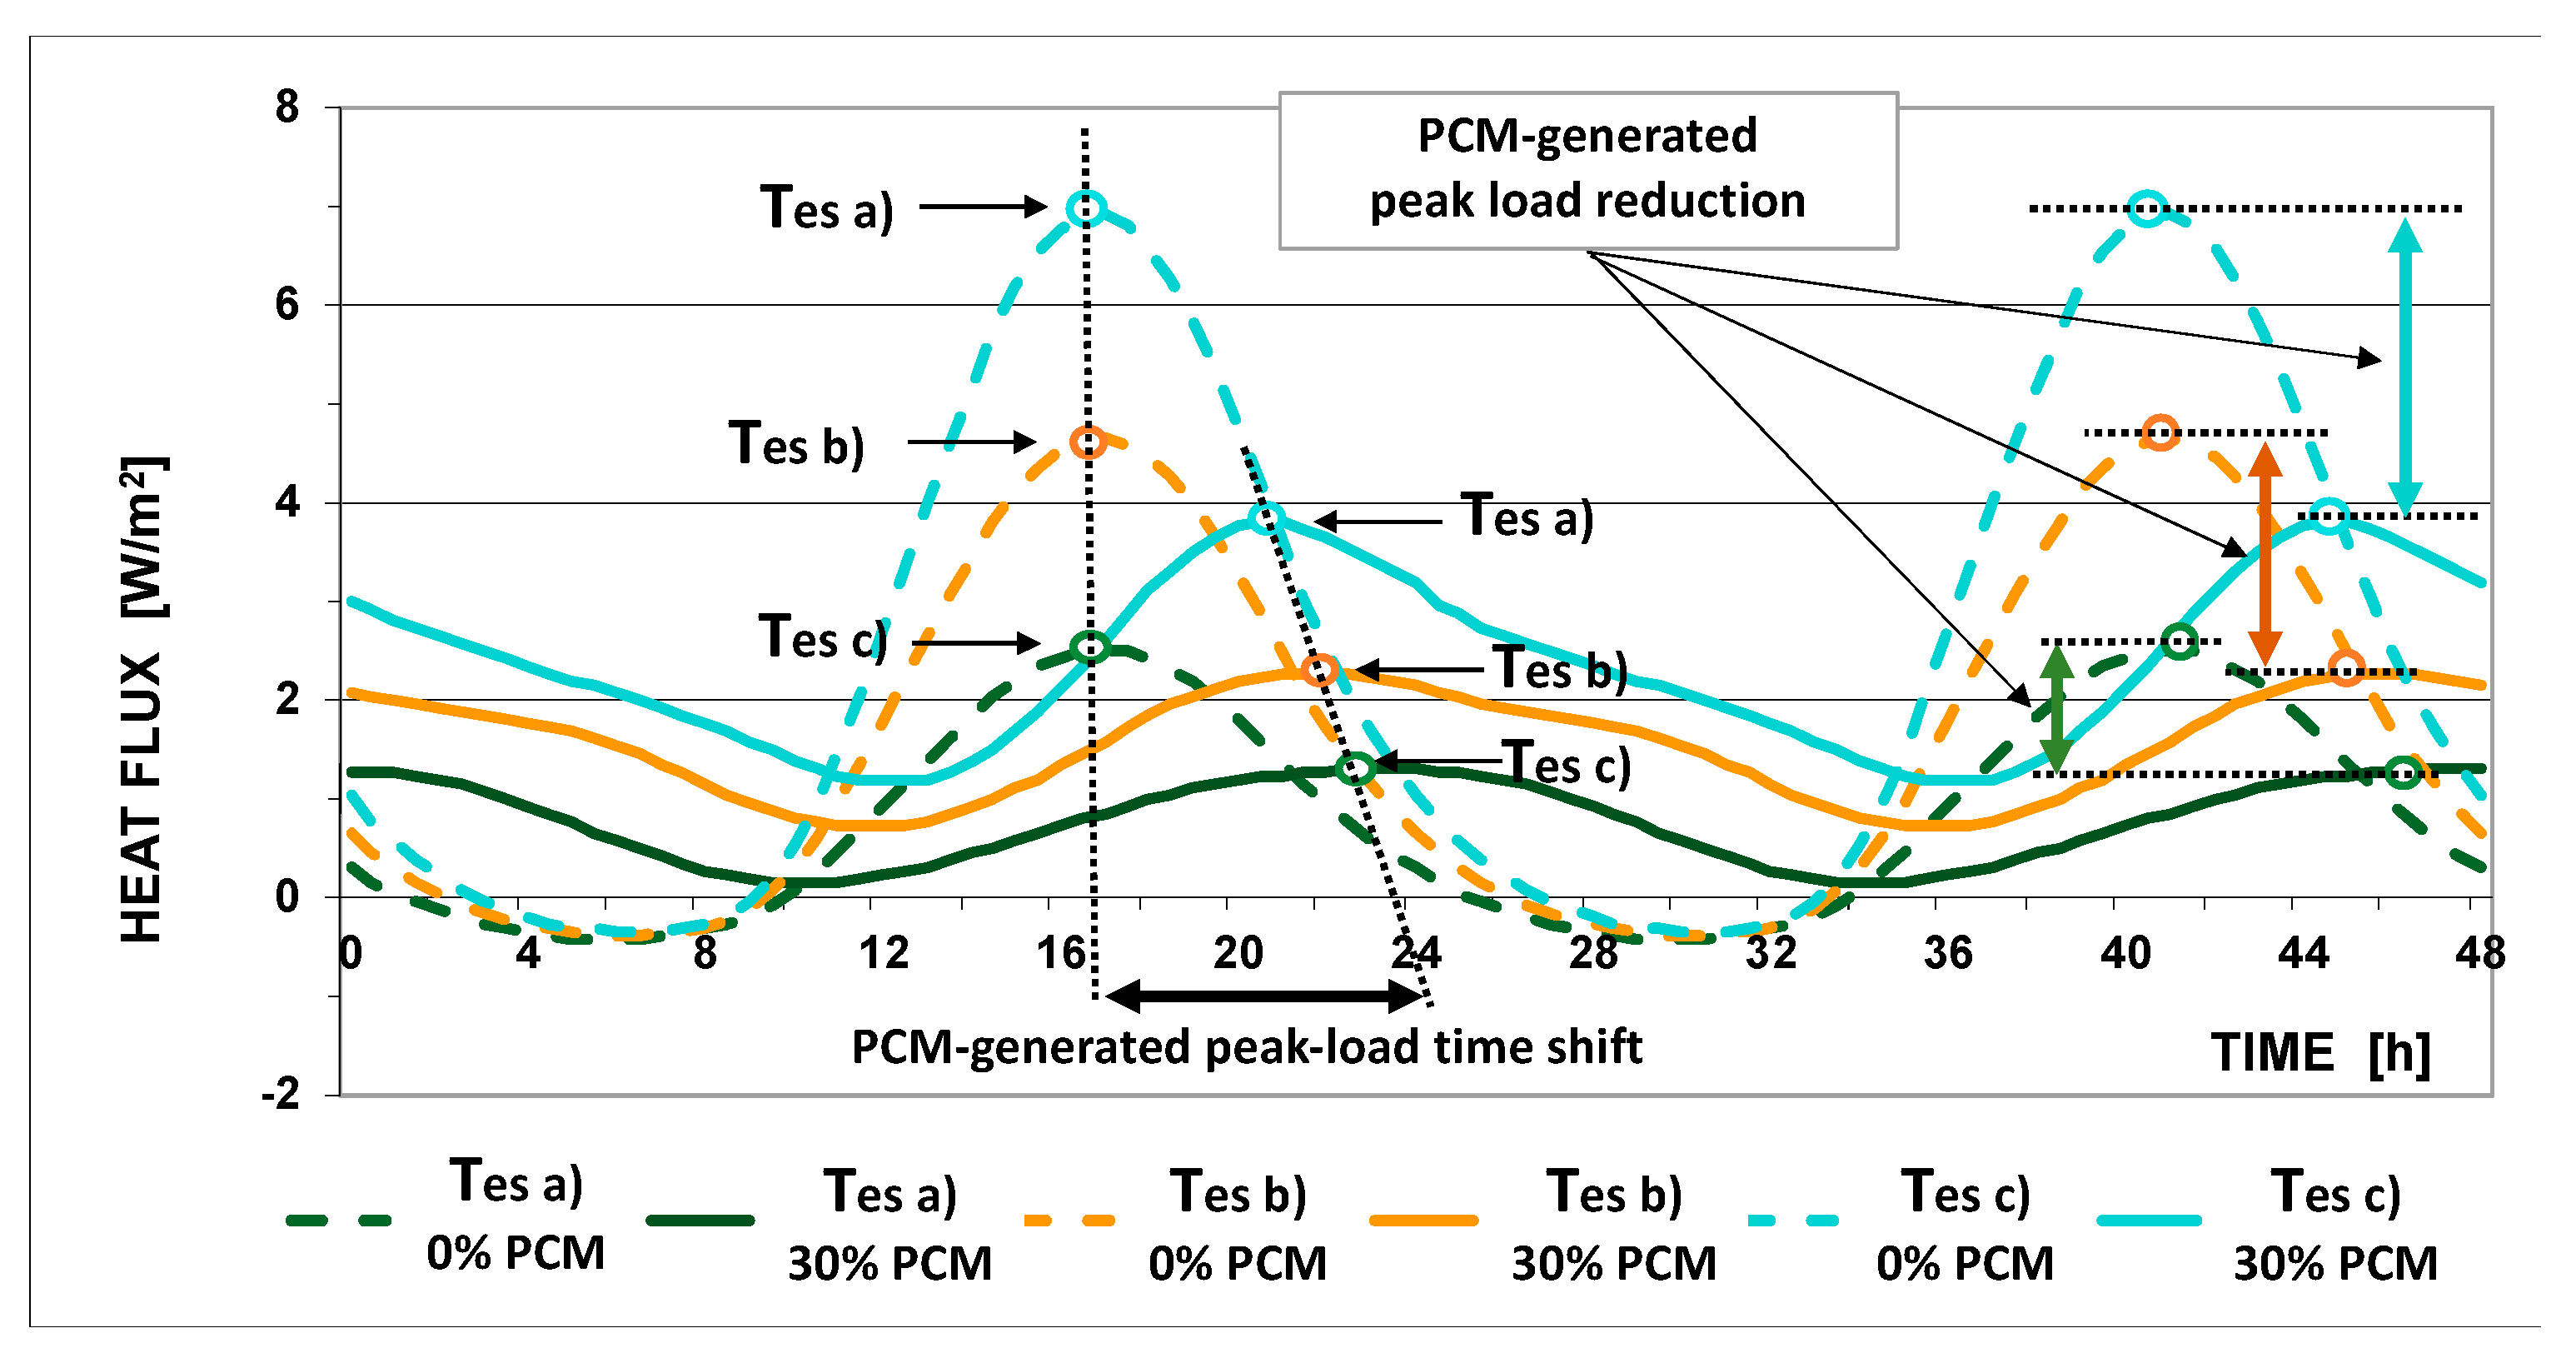
Similar thermal simulations are repeated for the assembly containing a 30 cm layer of thermal insulation with PCM content of 30% and density of 33.6 kg/m
3.
Figure 6 shows a comparison of diurnal heat flux profiles at the internal surface of the 30 cm assembly for different internal and external sol-air temperatures. The comparisons of calculated heat flux values indicate that for cyclic external thermal excitations, the effect of PCM blended with thermal insulation results in time shifts of the heat flux maxima between 3.0 and 6.5 h.
In addition, an approximate 50% decrease in peak heat flow values was observed. In the case of a 14 cm assembly, the PCM-enhanced thermal insulation did not generate large reductions in total daily heat flow rates, except for the case of the lowest sol-air temperatures during the day, as shown in
Figure 4. These results show that an increased thickness of thermal insulation reduces the peak time value of cooling loads but does not generate a significant time shift of the peak cooling load. In the case of PCMs, the factors that impact time delay of the envelope-generated thermal response are PCM enthalpy and the amplitude of external temperature excitations.
Table 2 summarizes the results of transient thermal simulations for two thicknesses of envelope assemblies, i.e., 14 and 30 cm, for two configurations of thermal insulation; one containing plain fibrous insulation layer, and another one containing insulation with 30 wt% PCM. Two internal space temperatures of
Ti = 20 °C and
Ti = 25 °C have been included.
A comparison of the heat flux plots and calculated daily heat flow values indicates that for the case of a thicker envelope configuration, the effect of PCM in thermal insulation results in significant time shifting of the heat flux maxima (up to 6.5 h), but not in considerable reductions of the total diurnal heat flow (thermal load). As depicted in
Figure 6, roof assemblies without PCM start to rapidly warm up around 10 a.m. and reach daily peak load at about 5 p.m. At the same time, between 10 a.m. and 1 p.m., systems containing PCM still generate the lowest daily thermal loads. It is worthwhile to note that PCM-enhanced roofs containing 30 cm thick assemblies with thermal insulation enhanced with 30 wt% of PCM, reach thermal peaks at significantly later evening hours, i.e., between 9 p.m. and almost midnight.
Furthermore, in the case of a thicker envelope assembly containing PCM, simulated reductions of the heat gains maxima are 48%, 51%, 45% for Ti = 20 °C, and 82%, 65%, 40% for Ti = 25 °C. Taking this into consideration, thick envelope assemblies containing PCM (i.e., roofs with thick layers of attic insulation) can be utilized as very effective means of whole building peak load management.
For the analyzed assembly with a thinner layer of thermal insulation (140 mm), the percent reduction of the heat gains maxima is significant only when the external sol-air temperature amplitude is not too high (up to 25 °C) as compared with the plain fiber insulation case. Correspondingly, the percent reduction of heat gain maxima and time shifting are less significant. This means that, as compared with roof assemblies containing thicker insulation layers (300 mm), thin cathedral or sandwiched roofs (containing 140 mm layers of thermal insulation) are less effective for controlling peak thermal loads in buildings during the cooling season, even with added PCM. It is also worthwhile noting that increased internal space temperature during the summer (lower temperature gradient across the envelope) increases the magnitude of overall cooling load reductions and, in most cases, peak load reductions. Finally, a comparison of thermal insulation cases with and without PCM (two different thicknesses), indicates that the PCM load is a major factor impacting the time delay in building envelopes.
5. Experimental Analysis of Peak Load Time Shift in Attics Containing PCM-Enhanced Thermal Insulation Installed on the Attic Floor
During the last two decades, several novel roof structures using PCM-enhanced thermal insulation or other PCM applications have been analysed in laboratory and field exposures. In contrast to earlier PCM studies, where the major interest has been mainly on energy savings, the current work focused on dynamic thermal response characteristics of PCM-enhanced envelopes, and energy savings was one of many results. This included peak load time shifting and reductions of the load maximum values.
The following two forms of PCM application were considered: dispersed PCM application blended with different types of thermal insulation and concentrated PCM application in conjunction with the batt fibrous insulation or blown-in attic insulation technologies. Interestingly, the recent work demonstrated that concentrated PCM applications did not have to be directly exposed to the building interior to effectively impact the thermal response of envelopes. Instead, they could be placed inside the roof or wall cavity, as long as phase change temperature was properly selected.
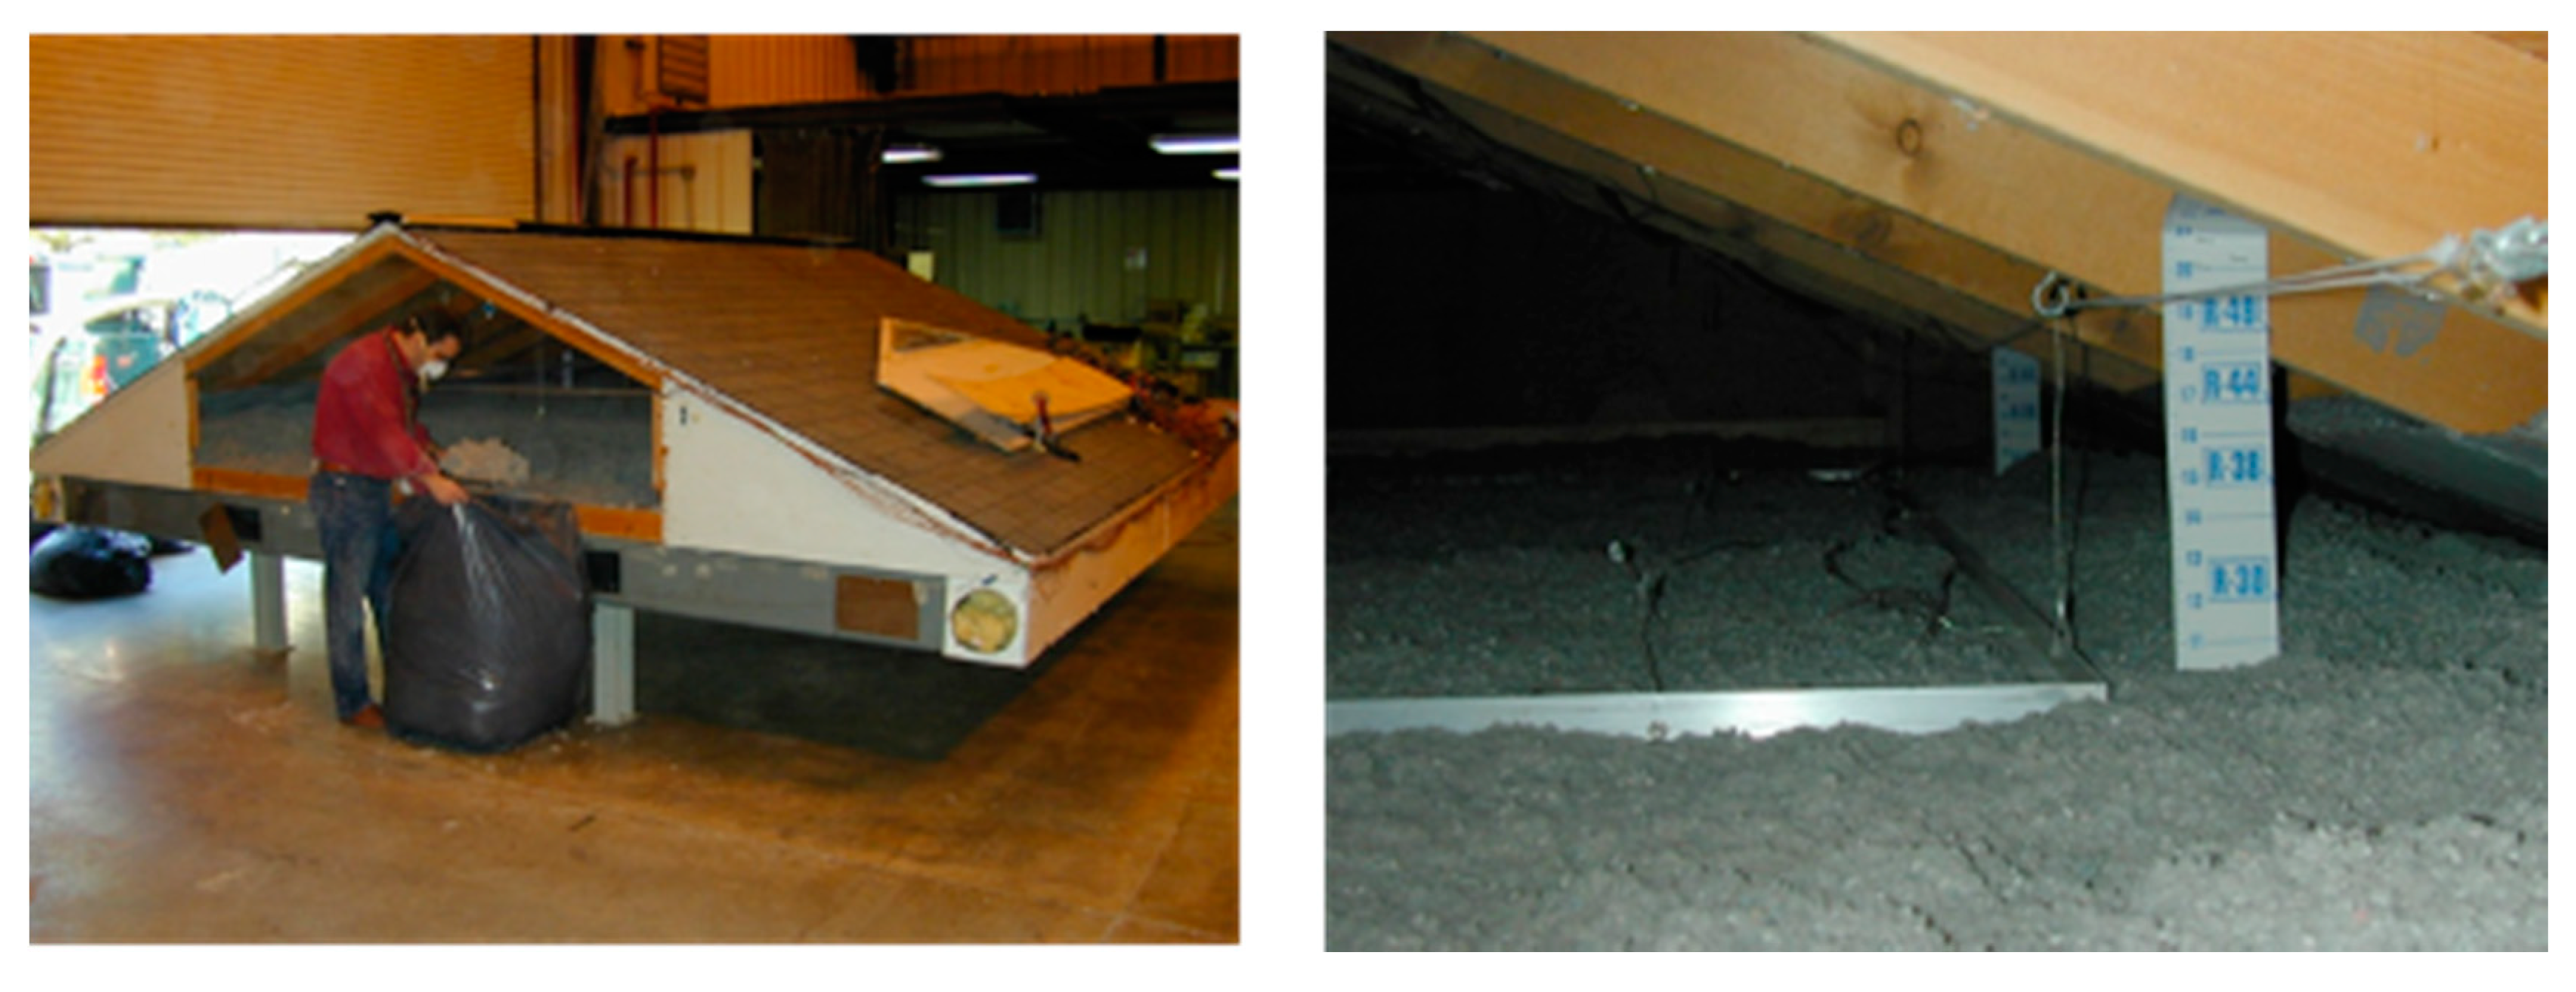
A series of dynamic hot box experiments were performed on an attic assembly insulated with loose-fill cellulose, pictured in
Figure 7. The attic module was tested under periodic temperature fluctuations in a large-scale climate simulator (LSCS), a large horizontal hot box, at the Oak Ridge National Laboratory [
40]. In addition to the attic insulated conventional cellulose insulation, two loadings of microencapsulated PCM with a melting point at approximately 27 °C and phase change enthalpy of approximately 120 kJ/kg were tested in blends with cellulose (5% and 20% by weight, and approximately 0.8 to 1.0 kg and 3.0 kg of PCM per m
2 of roof assembly).
The insulation thickness was 33 cm. The main focus of the attic tests was the PCM discharging time (solidification). PCM charging (PCM melting) is quite intensive and fast in attics, because of the rapid morning increase in temperature caused by the sun. However, the attic cooling process is significantly slower. In a well-designed PCM application, during the night, 100% of the PCM should fully discharge before morning. During the dynamic LSCS tests, the attic was subjected to changes of temperature to 21 °C for about 16 h, rapid temperature ramps to 49 °C or 57 °C, and exposure to 49 °C or 57° C for about 4 h, followed by natural cooling back to 21 °C. The array of thermocouples installed at 2.5 cm intervals was used to monitor the temperature distribution across the layer of insulation with a 33 cm thickness.
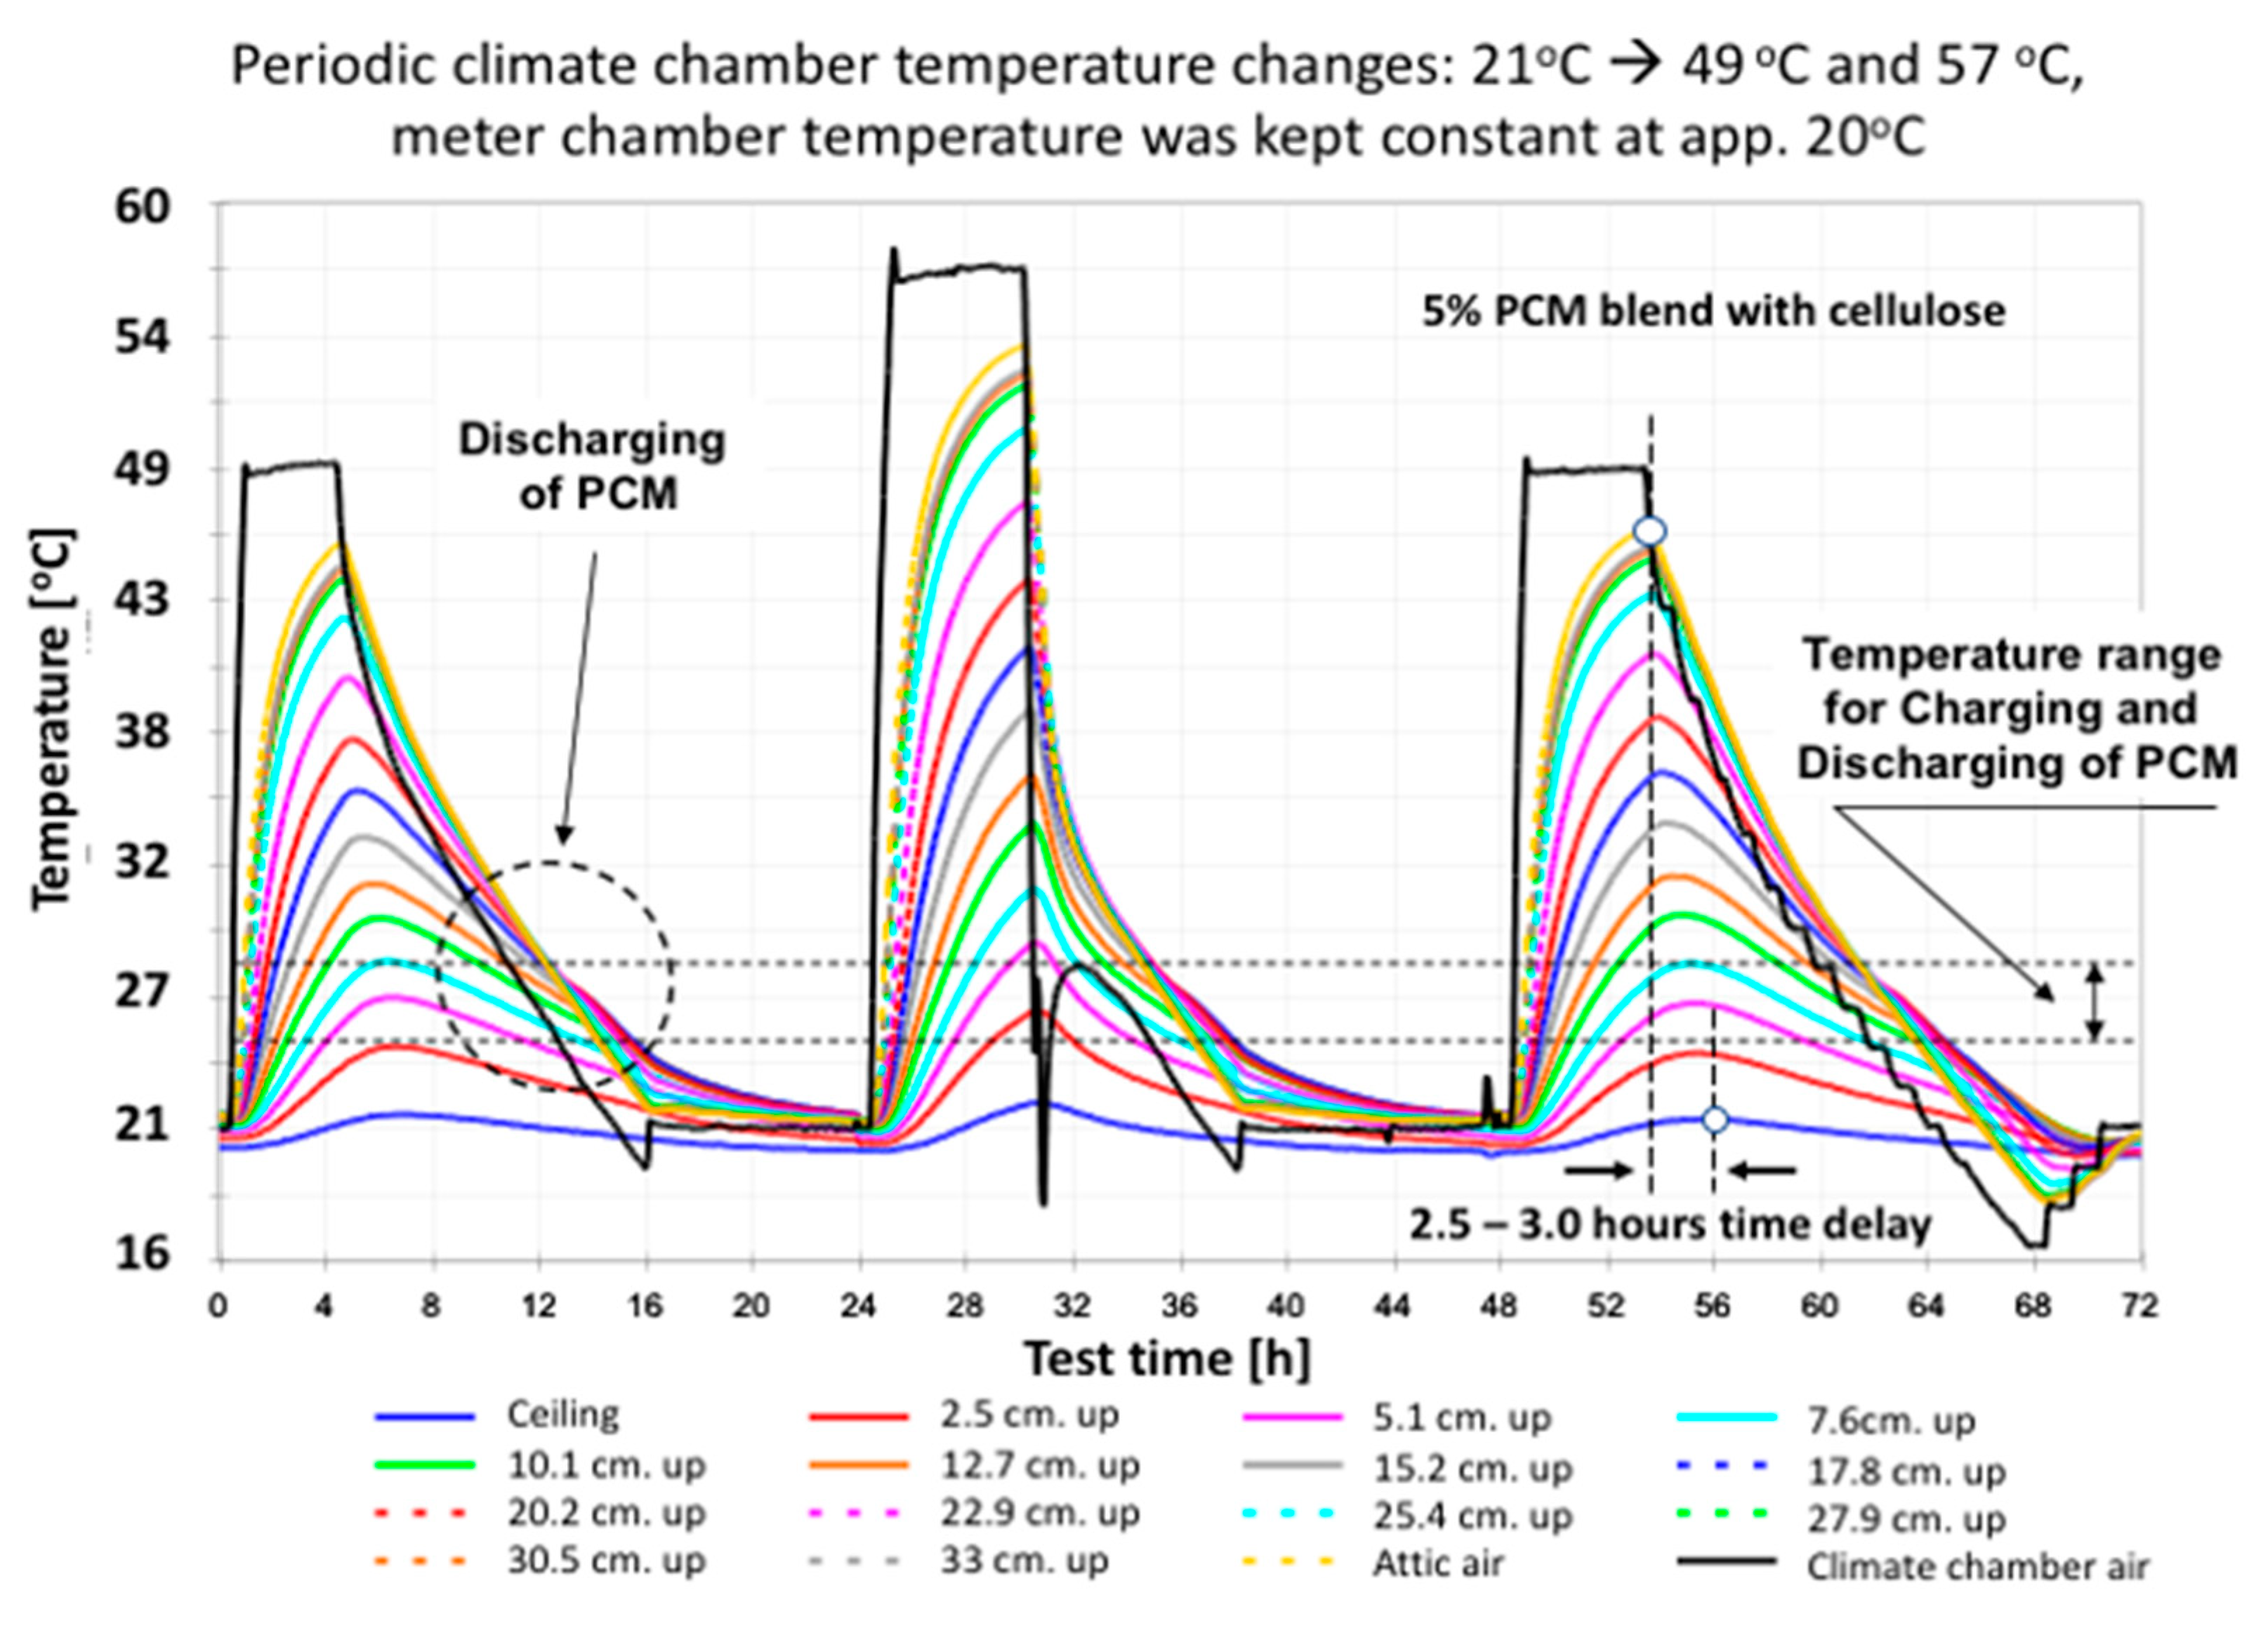
Figure 8 shows temperature profiles recorded during the dynamic hot box experiment performed on the attic containing 5% PCM-insulation blend. For two thermal excitations of 28 °C and 36 °C, the time delay between the peak temperature on the top surface of the attic insulation and thermal response on the attic ceiling surface (bottom of the structure) was between 2.5 and 3.0 h. Another interesting finding from this analysis was that, due to specific selection of the PCM phase transition temperature, only insulation layers located higher than 10 cm from the attic floor were involved in the phase changing processes. It took about 6 to 10 h to fully discharge the energy stored in these layers. This experiment provided evidence of PCM charging and discharging even in the attic configuration containing only 5% PCM blend (with the approximate load of microencapsulated PCM around 1.0 kg/m
2 of the attic floor area).
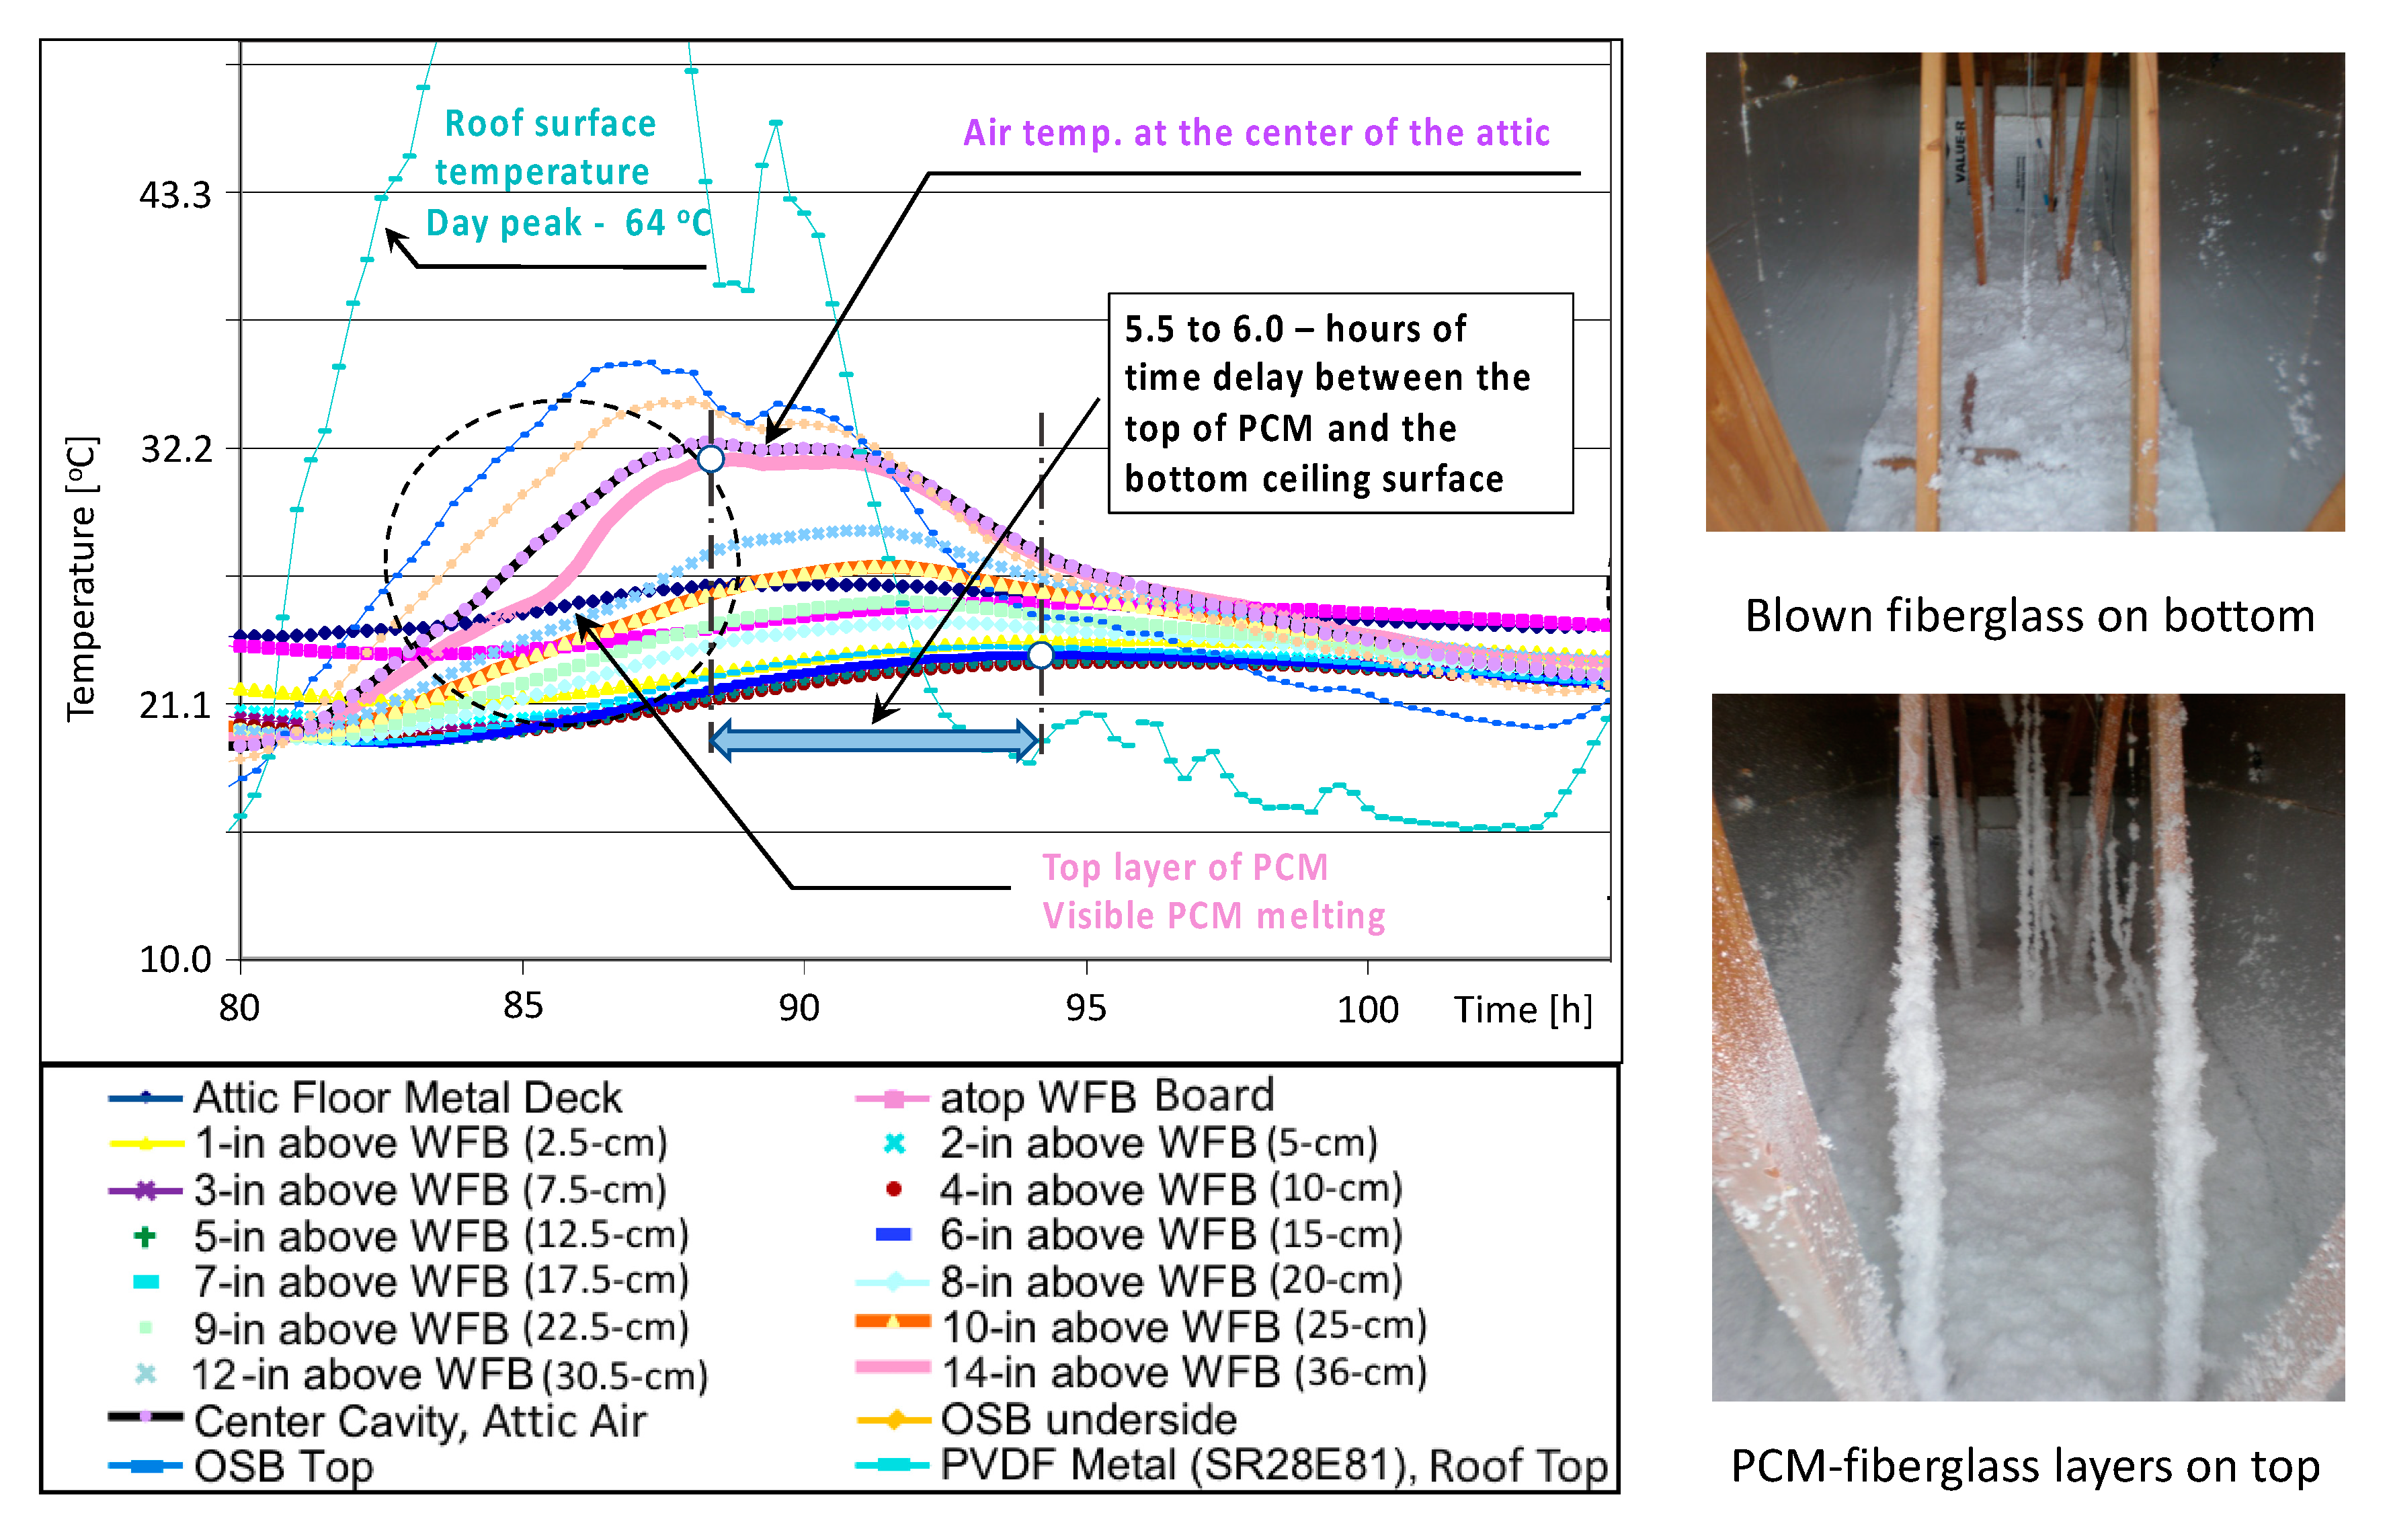
A similarly constructed attic was tested in field conditions at Oak Ridge National Laboratory [
40,
41]. The attic footprint was about 4.9 m long by 1.5 m wide. Its shed roof faced directly south. The roof slope was 1 in 3 cm (18.4°). The test attic contained loose-fill fiberglass insulation on the attic floor, and layers of PCM-fiberglass mixtures were placed on top. As shown in
Figure 9, the full-scale test attic contained about 25 cm of blown fiberglass insulation with a density of 29 kg/m
3. Next, on top of this insulation, four layers of the PCM-adhesive blend, each with a thickness of 1.3 cm, were installed with a layer of blown fiberglass, with a thickness of 1.3 cm, installed in between each layer of PCM-adhesive blend. The thickness of the added PCM-fiberglass multilayer sandwich was approximately 11 cm, giving the total attic insulation a thickness of 36 cm. The PCM melting temperature was at 29 °C and the phase transition enthalpy was approximately 170 J/g (110–120 J/g after encapsulation). The approximate load of the microencapsulated PCM for this application was between 4 and 5 kg/m
2 of the attic floor area, which yielded a heat storage density of approximately 120 to 170 Wh/m
2.
In this field experiment, an advanced attic configuration was used. In addition to PCM, it contained above-deck ventilation and a metal roof surface with high solar reflectance (a cool roof, SR28 and TE81). Monitored data included the following: (i) the temperatures of the roof deck on both sides of the 1.6 cm oriented strand board and the heat flux transmitted through the roof deck, (ii) attic air temperature, (iii) temperature profile across attic insulation and PCM layers, and (iv) bottom of the attic temperature. A comparison of recorded times for the temperature peaks (maxima) on the top of the attic PCM-insulation surface and on the bottom of the attic floor, as shown in
Figure 9, indicates that the time delay in transmission of a peak thermal excitation across the entire 36 cm thick attic thermal insulation system (including PCM) is about 5.5 to 6 h. During the day of these measurements, the peak top roof surface temperature was around 64 °C. This agrees quite well with the theoretical data in
Table 1 for dispersed PCM applications.
Taking into account that in both of these experiments (hot box test with cellulose insulation and field test with blown fiberglass) similar thicknesses of fiber insulation and the same type of microencapsulated PCM were used and this yielded similar thermal resistances. A comparison of measured time lag (in occurrence of peak temperatures) between the top of the insulation and the bottom of the attic indicates that the length of this time shift strongly depends on the PCM load. In most cases, a thickness of the lightweight thermal insulation, because of its low density, has a secondary effect (see Equations (17)–(23)). This corresponds well with results of theoretical analysis presented in a previous section, where PCM is also a major factor impacting the peak load time delay.
6. Experimental Determination of the Load Time Shift in Thermally Massive Sloped-Roof Assemblies Containing Concentrated PCM Applications
In the case of sloped roofs, PCM systems can be installed either on the upper or lower sides of the roof deck. PCM products attached to the roof deck generally need to have significantly higher heat storage potential than PCM-enhanced insulations installed inside the attics or in wall cavities. PCM used on roof decks is a discrete application rather than a distributed system. Furthermore, the phase change temperature has to be properly matched with the temperature changes expected for the roof deck.
PCM pouches with low emittance surfaces provide a radiant barrier function, when installed on the interior side of the roof deck. As a result, the thermal response characteristics of these PCM systems are different from the characteristics with attic insulations containing dispersed PCMs. Experimental studies performed on different roof assemblies, located in a variety of southern U.S. climates, demonstrated that roof deck application of PCM for thermal insulation combined with a radiant barrier and above-deck ventilation significantly reduced roof-generated thermal loads [
40,
42,
43]. In addition, the roof configuration described above could be enhanced with roof-installed photovoltaic systems [
44].
Since early 2000, various research works on roof assemblies containing PCM and conventional thermal mass components, a variety of ventilating strategies, and radiant barriers have been reported in the literature [
40,
41]. An assortment of roof and attic assemblies have been tested in the south-facing, shed-type roof-test facility, at the Oak Ridge National Laboratory.
Figure 10a shows a photograph of this roof tester which provides for side-by-side performance comparisons of different types of roofing materials, roof constructions, and attic assemblies. The roof’s slope pitch is 18.4°. The footprint for each test element is 4.9 m long by 1.5 m wide. All test modules had soffit-to-ridge attic ventilation with vent area-to-attic floor area ratio of 1:300. [
40]. Test attics were equipped with arrays of 50 or more thermocouples and heat flux transducers embedded in the roof deck and in the attic floor for measuring temperature profiles and heat flow rates across the roof and attic.
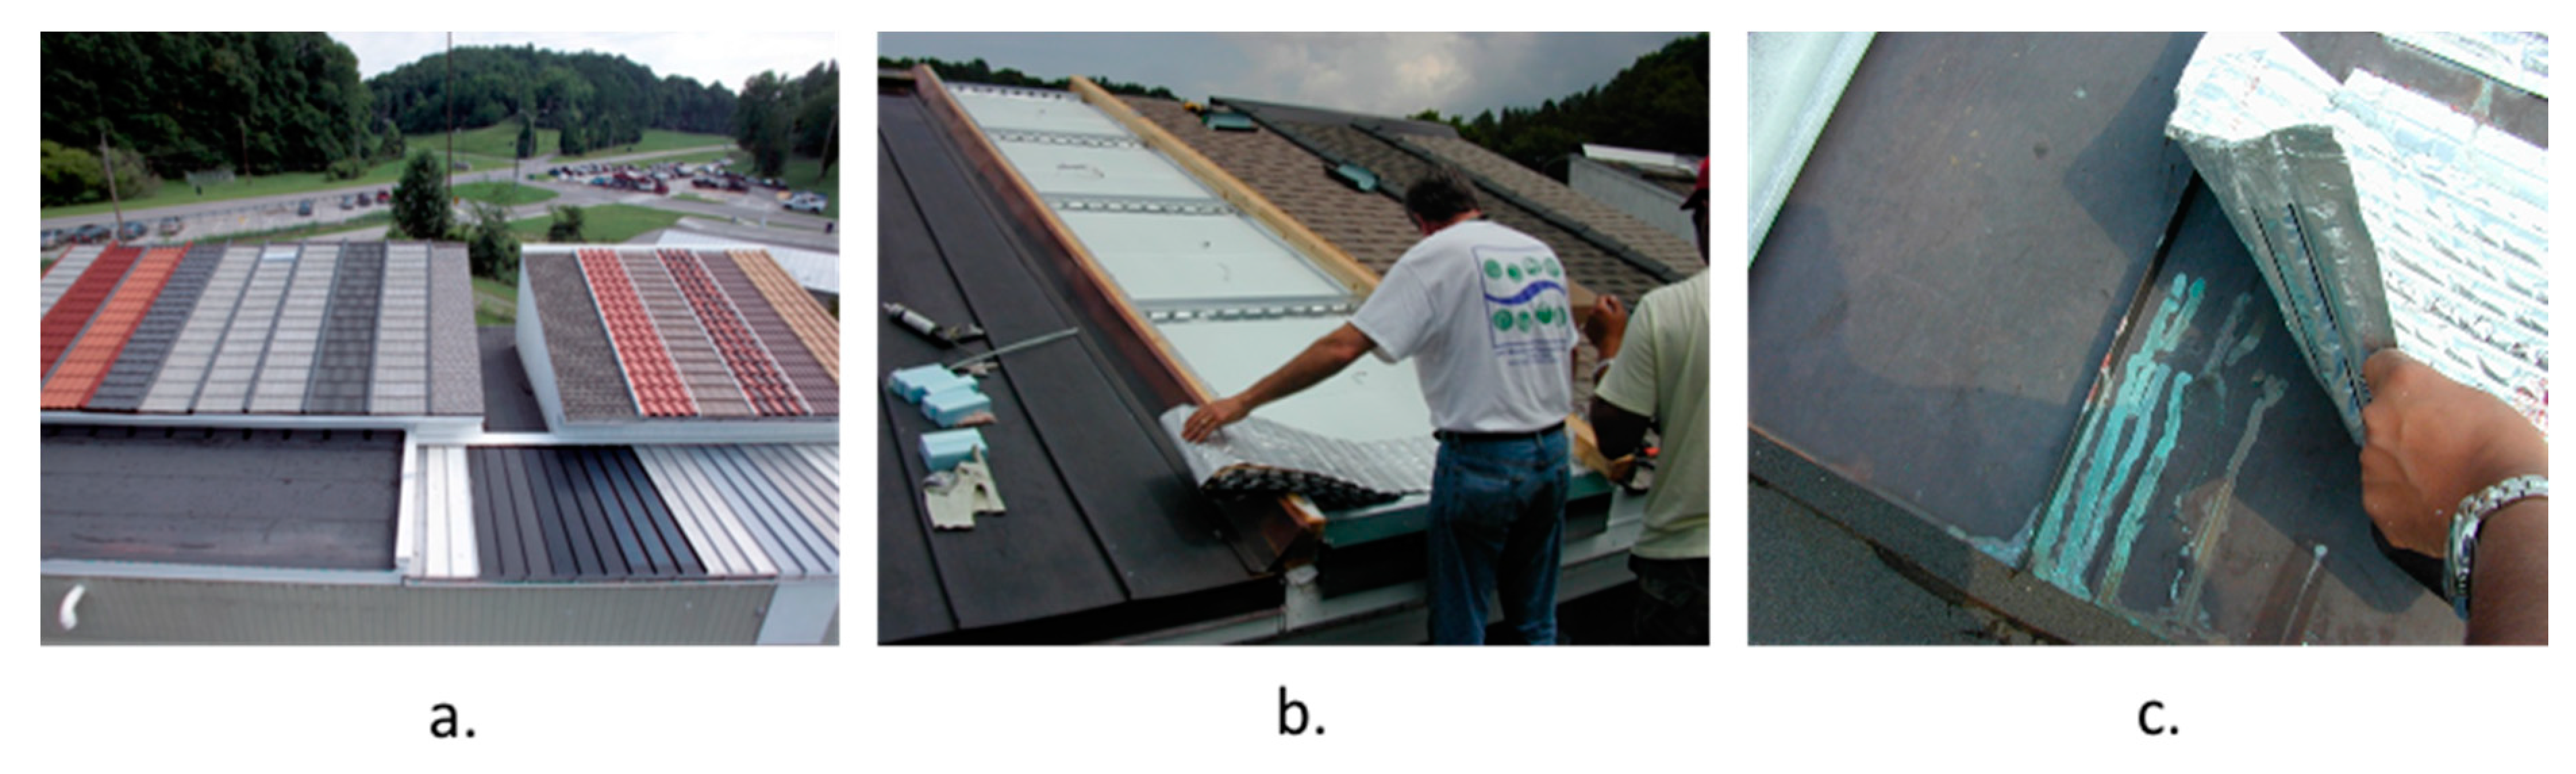
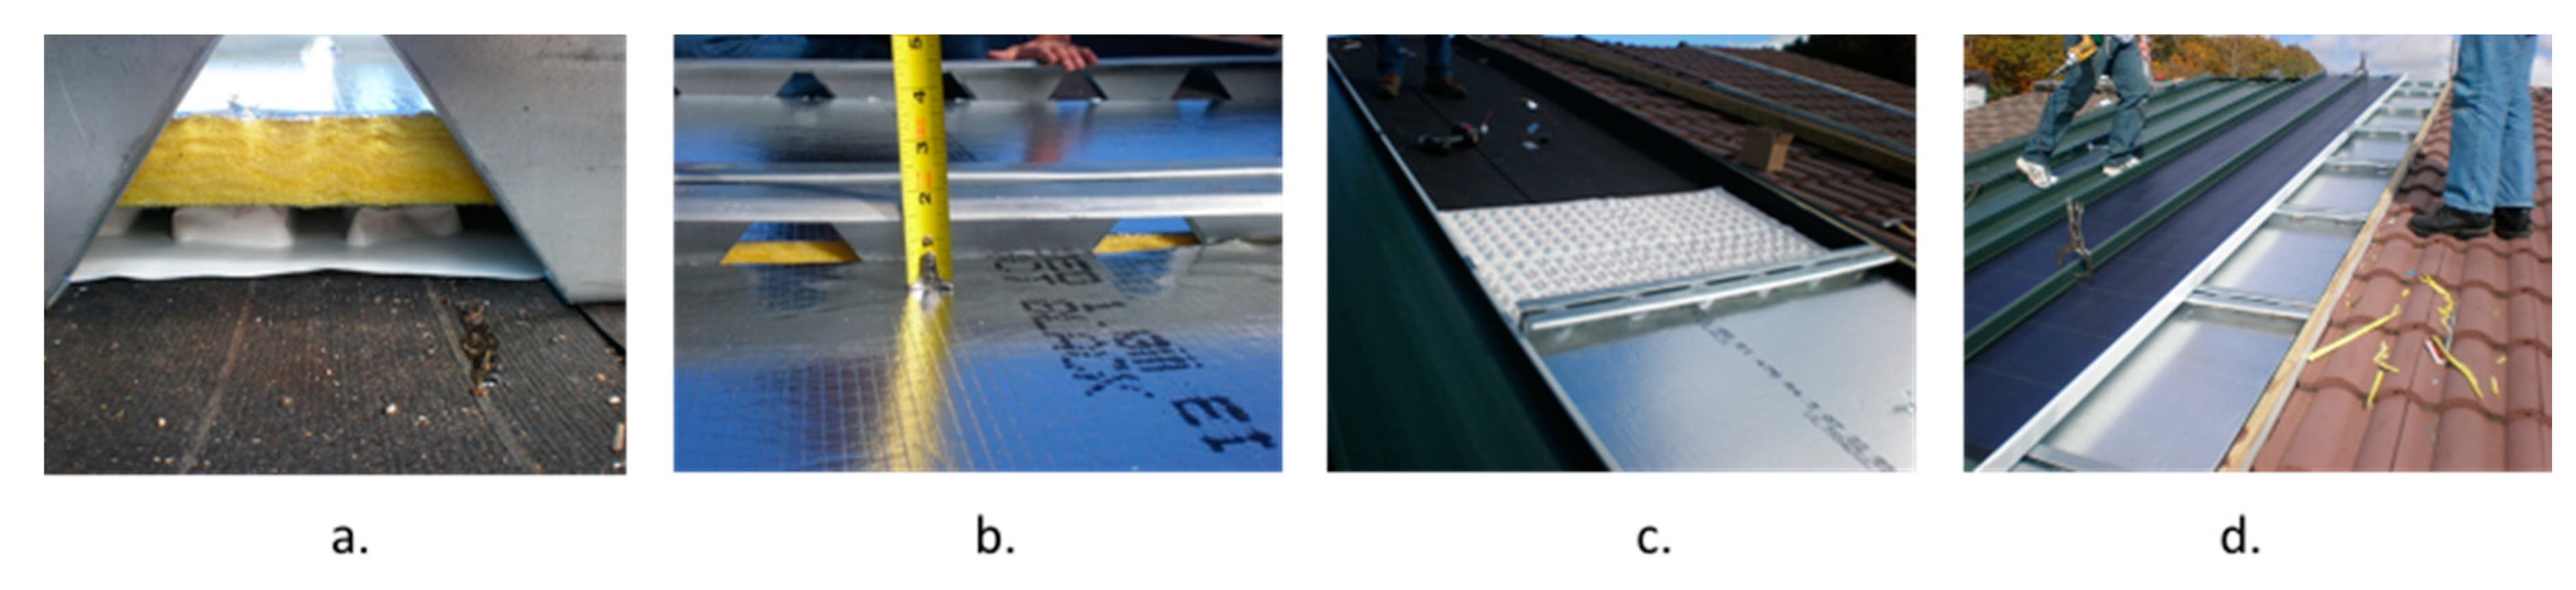
The first roof with localized PCM was built in 2004. At that time, the main interest was in roof surface materials, overall roof thermal resistance, optical characteristics of the roof surface and roof deck components, and the resulting reductions of thermal loads. Thermal response characteristics, such as peak load shifting, were not of primary interest. This earliest PCM roof configuration had aluminum foil faced pouches of inorganic PCM that were installed directly on top of the roof deck, as shown in
Figure 10b. The first week of testing demonstrated greater than 90% reduction of the daily peak thermal load as compared with a conventional shingle roof [
40]. Unfortunately, as shown in
Figure 10c, the pouch design was not planned for roof-top applications and PCM leaks occurred.
A second example of a PCM roof contained organic PCM. It was based on a “cool roof” design, similar to the roof shown in
Figure 10. Some of the test data that focused on the reduction of the thermal load generated by the roof has already been published [
40,
45].
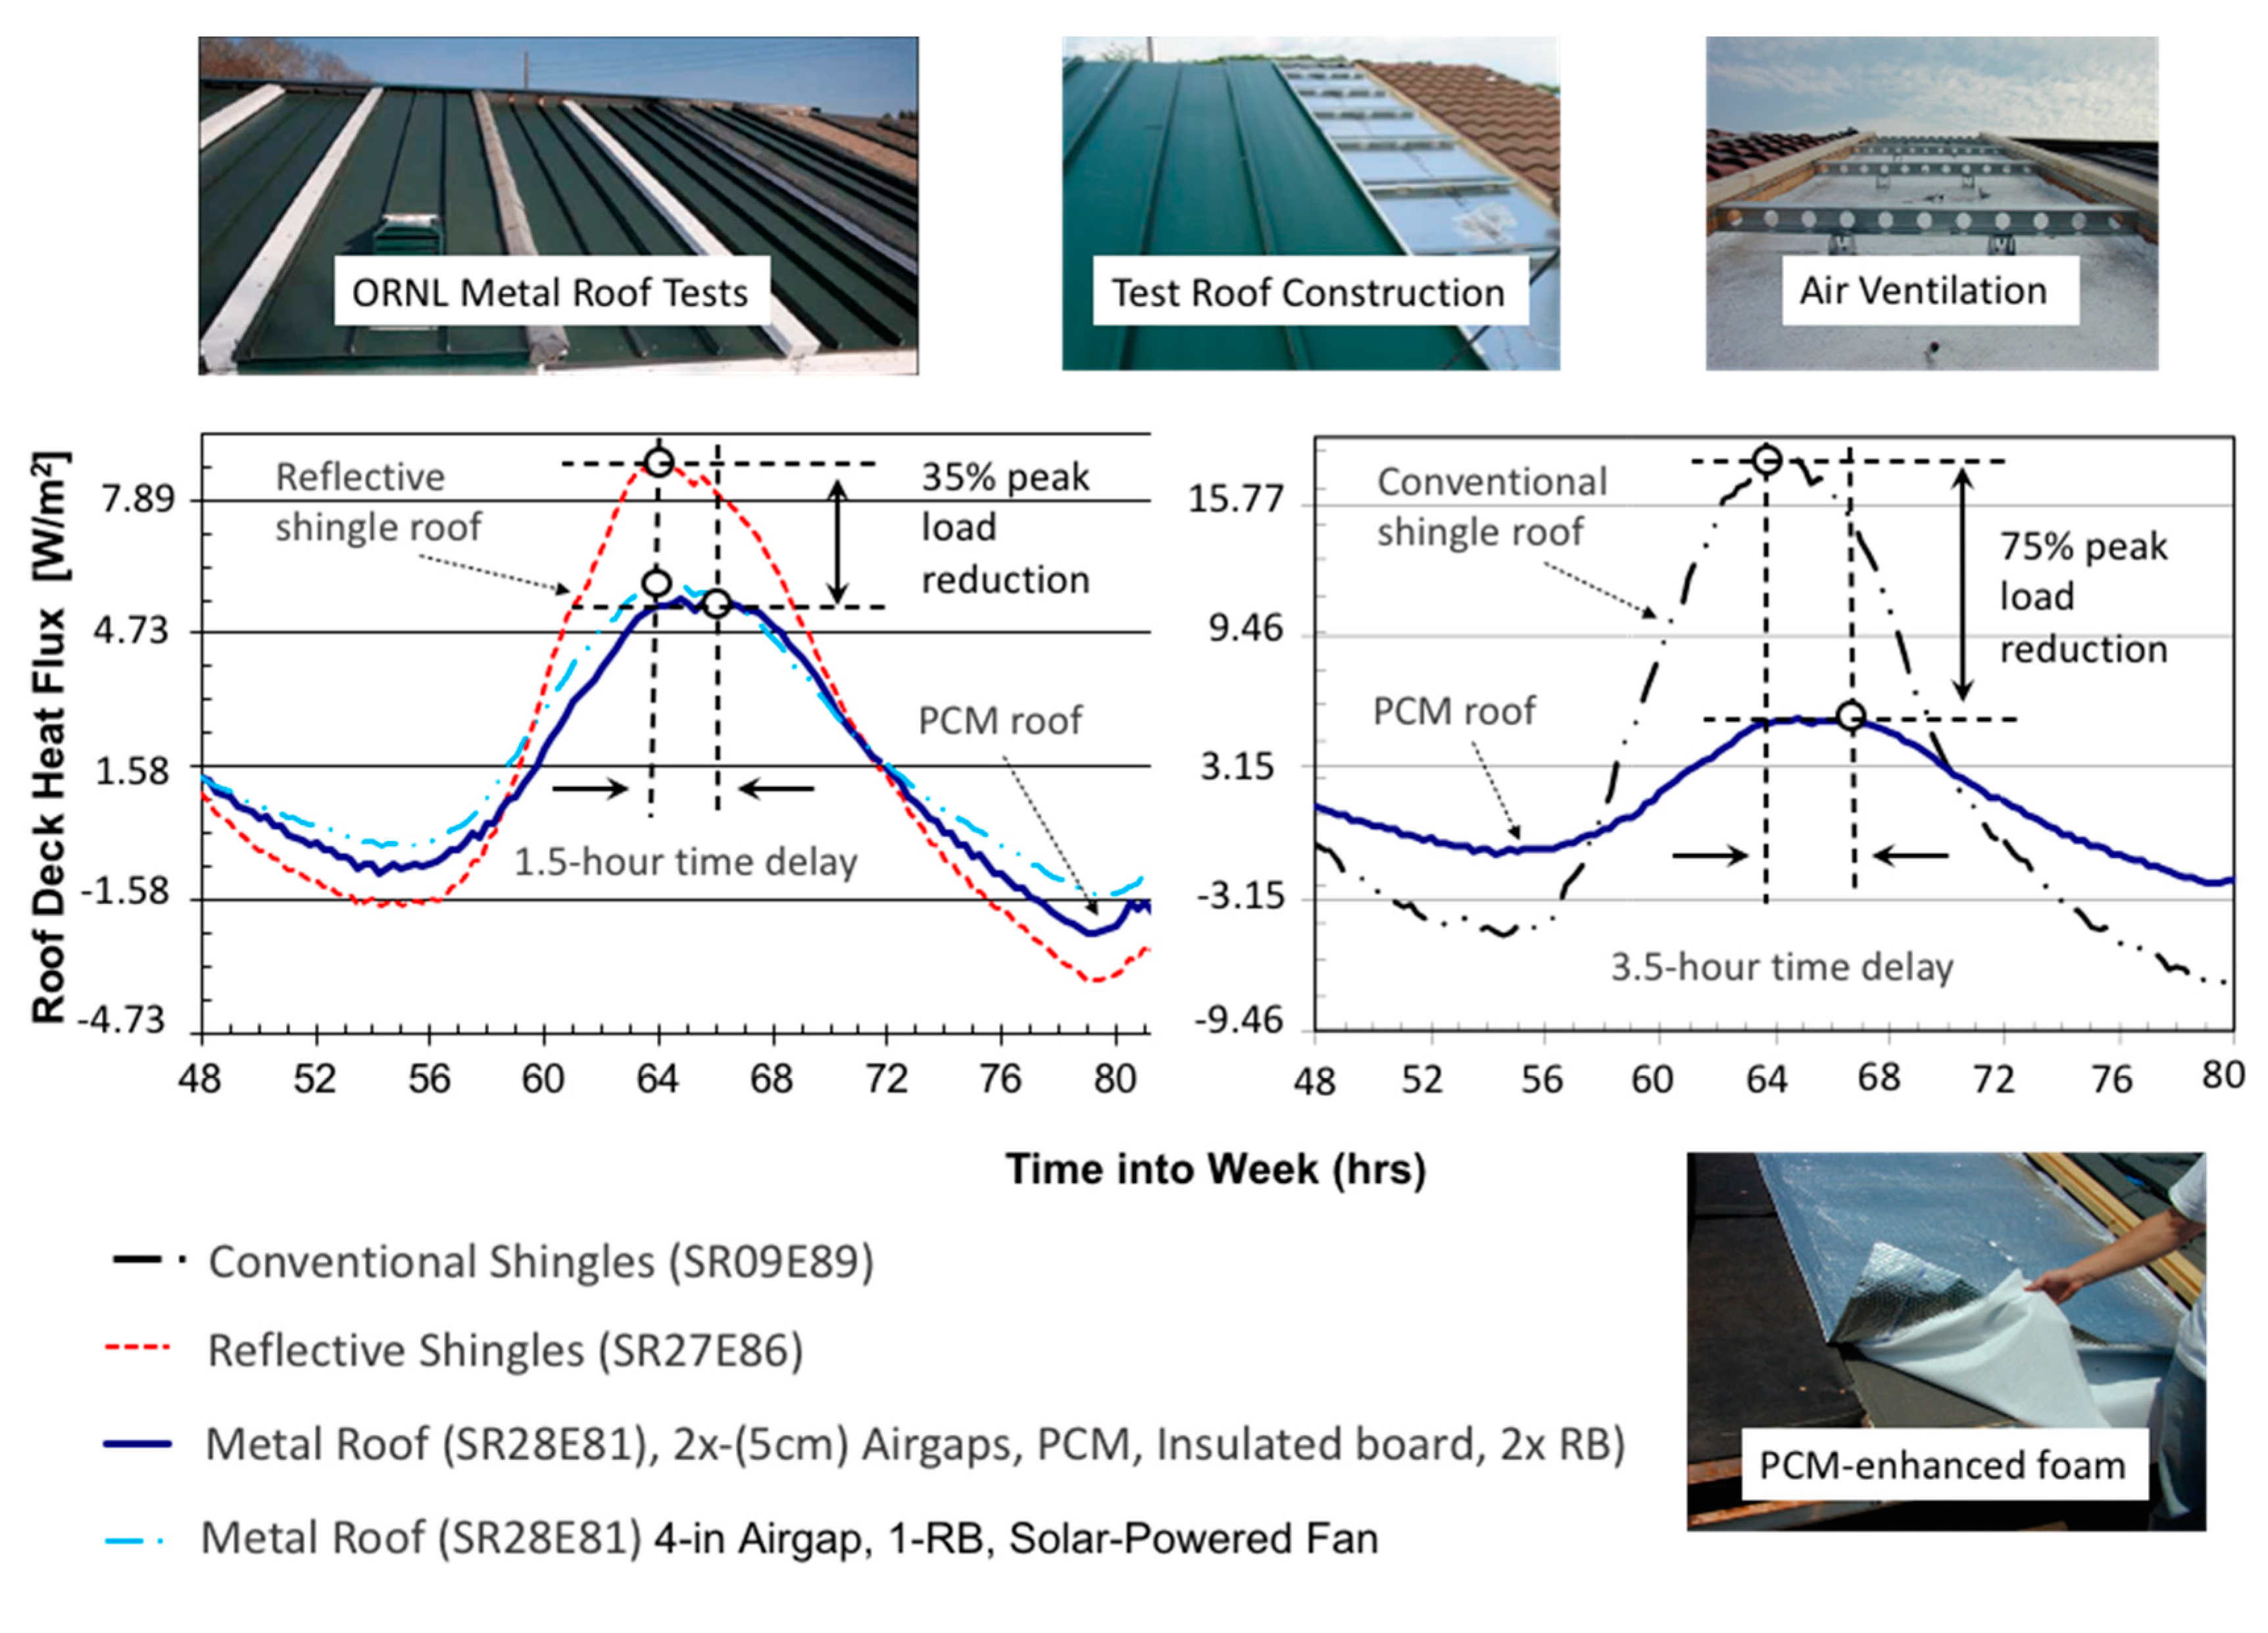
Figure 11 shows the analysis of the peak load time shift for a cool metal roof containing PCM. Performance comparisons are also made for a similar cool metal roof with no PCM and with two conventional slope roof configurations using conventional control shingles and cool shingles.
The second PCM roof contained three layers if 2 mm thick localized PCM. Specifically, PCM-enhanced polyurethane (PU) foam and two layers of PCM-impregnated fabric were installed above the roof deck. Following the detailed thermal simulations of roof temperatures, the melting point of the PCM dispersed in the PU foam was 26 °C, whereas that for the fabric was 32 °C. The total heat storage potential of the PCM assembly (for a total of five layers) was around 15 Wh/m2.
Both of the roofs with PCM had top surfaces with solar reflectance of 0.26 and thermal emittance of 0.81, air ventilation cavities, and radiant barriers. One of the conventional shingle roofs was covered with cool asphalt shingles with solar reflectance of 0.27 and thermal emittance of 0.86. The cool shingle roof was used as a control for comparison with the thermal performance of the prototype roof systems. All three roofs had very close to the same radiative properties. A fourth shingle roof had conventional shingles and provided another opportunity for comparison. The conventional shingles had solar reflectance of 0.09 and thermal emittance of 0.89.
Data in
Figure 11 show that both advanced metal roofs with above deck ventilation, and attic radiant barriers, significantly reduced the peak hour thermal loads as compared with the cool shingle attic. This reduction was about 31% in the case of no PCM metal roof without PCM and 35% for the metal roof with PCM. Performance comparisons were also made for the conventional dark shingle roof (SR09E89). In this case, the reduction of roof deck maximum daily heat flux for the PCM roof, was about 75% [
40,
45]. This specific roof assembly initiated a series of subsequent roofing experiments using different configurations of roof-top materials, conventional thermal mass, or PCMs, as well as a variety of roof deck ventilation and thermal insulation options [
40].
As shown in
Figure 11, the PCM roof provided a notable shift in the time of the peak thermal load. This time shift was about 1.5 h as compared with a shingle roof with similar surface radiative properties. However, the peak load time shift was over 3.5 h as compared with the roof using conventional non-reflective shingles. Bear in mind that this time shift was based on the roof deck surface temperature. Therefore, in the case of the complete roof assembly, or roof plus attic design, the time shift generated by the entire roof structure could be appreciably higher depending on dynamic impacts of the attic floor insulation and other construction components.
Following the roof designs described in
Figure 10 and
Figure 11, several similar roof configurations were developed with significantly higher energy storage potentials [
45]. The experimental roofs utilized both organic and inorganic latent heat storage products. All of them, in addition to substantial reductions of peak thermal loads (around 90%), demonstrated noticeable peak load time shifting.
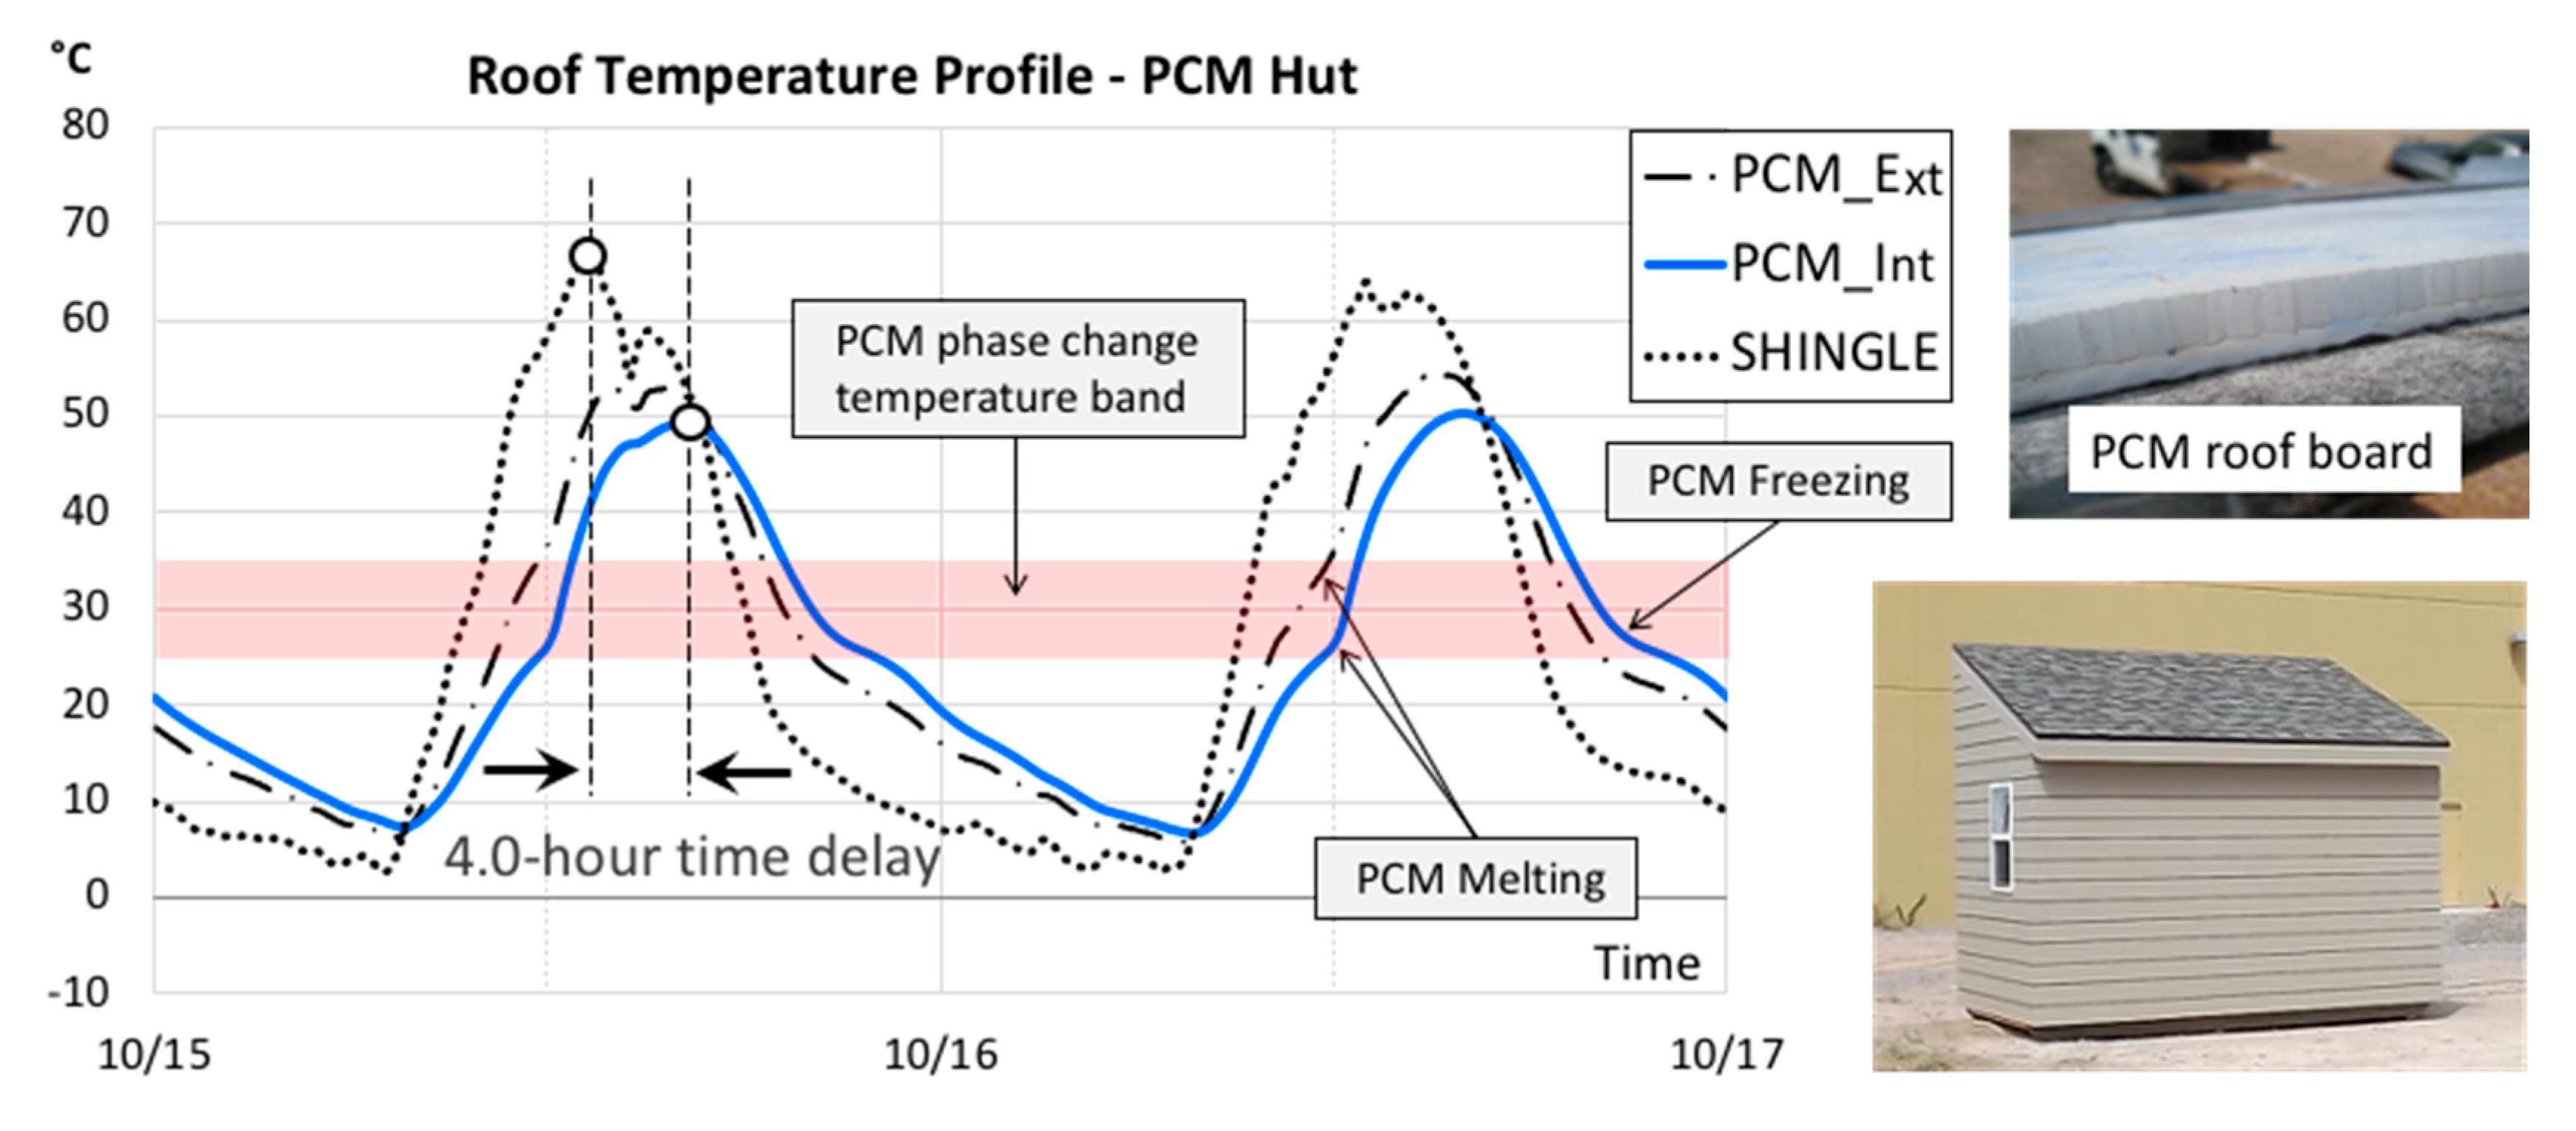
Another roof configuration of roofing containing localized PCM and micro-ventilated air channels was recently demonstrated in Albuquerque, New Mexico where two insulated near-identical wood-framed test huts were monitored in field conditions. One of these huts contained a sandwich of the PCM board and microchannel boards (for roof ventilation purposes) on the roof deck. The PCM layer was one cm thick and contained about 2.5 kg/m2 of PCM with melting point 28 °C (determined with use of a series of transient finite difference thermal simulations). The energy storage capacity of the PCM board was ~90 Wh/m2. All other structural components of the attics and walls were installed and insulated the same as follows:
- (i)
non-PCM hut-dark roof shingles (solar reflectance of 0.05 and a thermal emittance of 0.90 (SR05E90);
- (ii)
PCM hut-cool shingles (solar reflectance of 0.25 and a thermal emittance of 0.86 (SR25E86);
- (iii)
on the ceiling, on top, a R-3.7 (m2∙K/W) layer of attic fiberglass insulation and, under, a R-2.3 (m2∙K/W) layer of fiberglass;
- (iv)
inside the wall cavities, a R-2.3 (m2∙K/W) layer of cavity fiberglass three cm from the internal surface of cavities.
The amount of thermal insulation was the same in both test huts. Furthermore, the test huts had approximately the same air-leakage rates as confirmed by blower door testing.
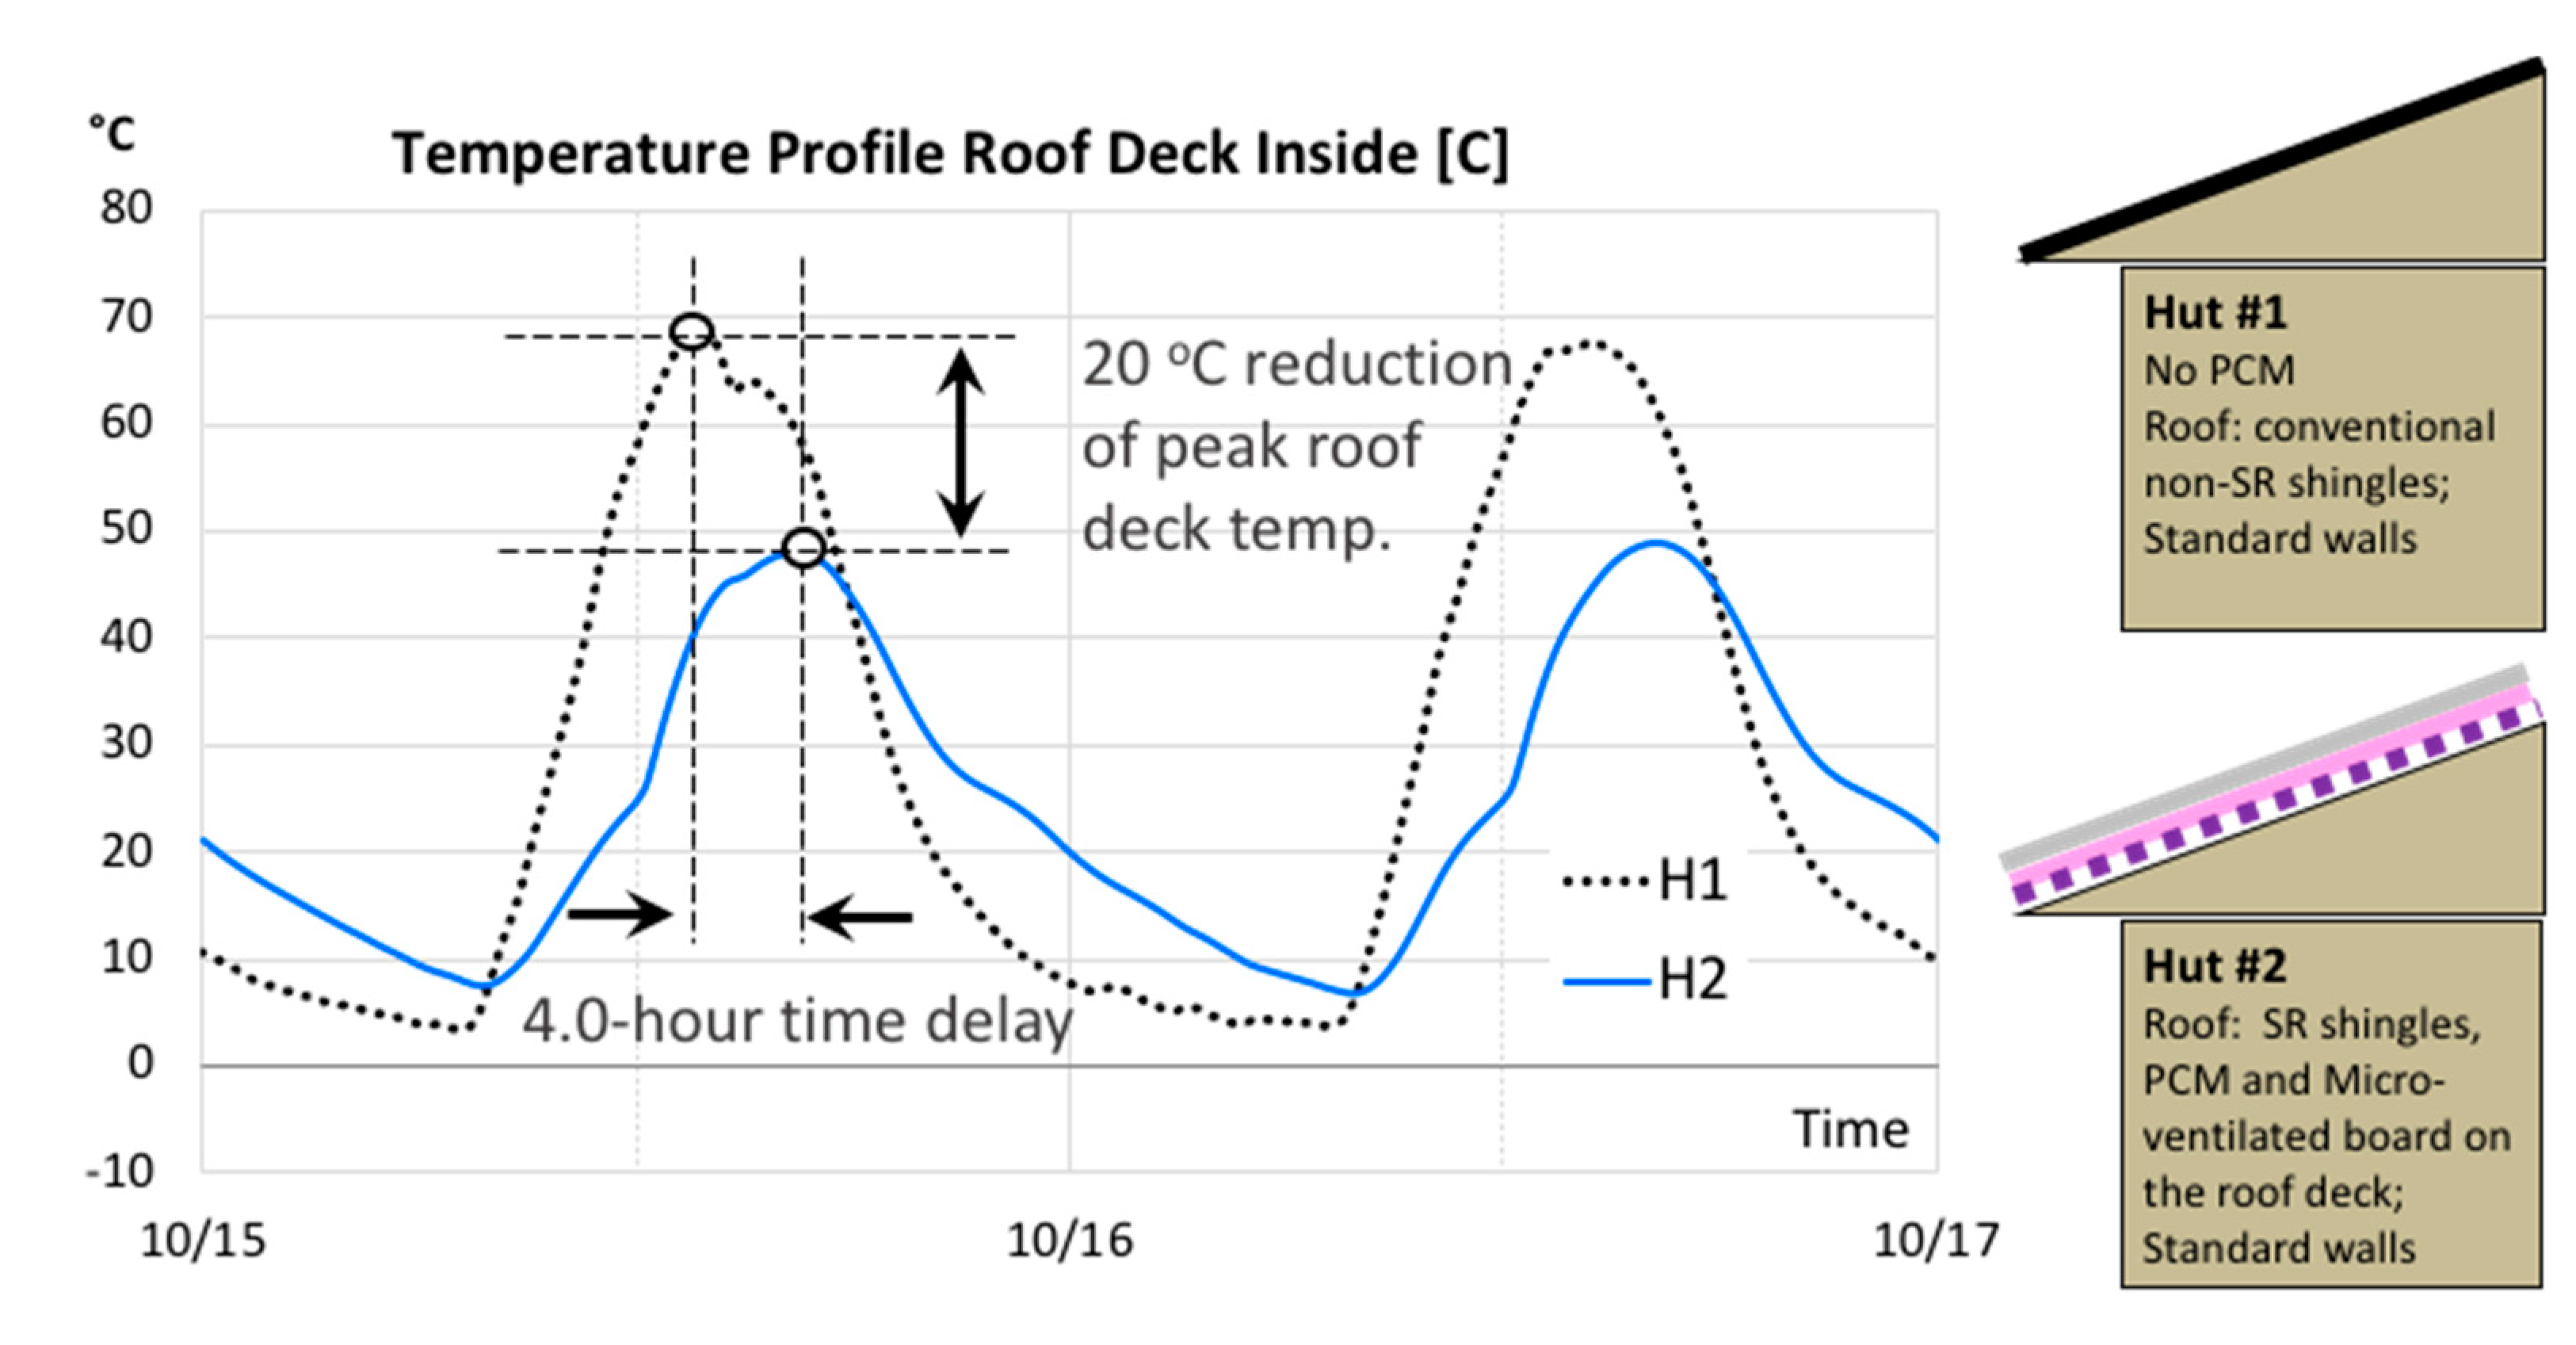
As shown in
Figure 12, the PCM roof exhibited about a 20 °C lower maximum roof deck temperature as compared with the roof with conventional low-reflective shingles. This indicated that less heat was transmitted to the interior of the building. An analysis of time shifts due to PCM changes in the temperature profiles showed that most peak load time shifts in roofs containing PCM were generated by the PCM. A four-hour long peak-load time shift could be created by a layer of PCM and a 1 cm thick thermal insulation (approximately R
SI = 0.15 m
2·K/W) installed on top of the roof deck, as shown in
Figure 12 and
Figure 13. A proper selection of the PCM’s phase transition temperature is crucial. It must be consistent with the expected roof deck temperatures [
44].
7. Impact of Dynamic Thermal Disconnect Systems and Roof R-Value on the Reduction of Peak Thermal Loads
Reduction of peak thermal loads generated by building envelopes is one of the primary challenges associated with building design, second only to the shifting of the peak load time. As depicted in
Figure 5 and
Figure 6 and listed in
Table 2, PCM can shift the time when the peak thermal loads occur. However, the reduction of the peak load value is also directly dependent on the amount of thermal insulation used, expressed by the envelope assembly’s R-value. There is also another way to improve thermal performance of building envelopes. The thermal disconnect concept was introduced by Kośny et al. [
28]. It is defined as a material or system that can control, or control and redirect, the flow of heat between two working surfaces of a building.
As an example, the varying temperature excitations of an exterior wall can be disconnected from its interior surface by simply adding insulation to improve the wall’s overall thermal resistance. Dynamically working thermal disconnect systems, such as heat sinks or air ventilation strategies, can either exhaust or absorb part of the dynamic loads, reaching the exterior building surface.
Since the current design practice is predominantly based on steady-state thermal resistance (R-value), typically, continuous layers of thermal insulations are used to reduce the impact of thermal bridging. A common problem associated with the application of conventional insulation is the lack of space and thermal bridging due to structural members penetrating the thermal insulation. One of the major advantages of thermal disconnect technologies is that they require significantly less space than conventional thermal insulation.
Some of the thermal disconnect technologies that have been already been used by architects and builders worldwide for the thermal performance improvement of roof structures are as follow:
Exterior radiation barriers, i.e., high solar reflectance;
Interior infrared radiation control materials or coatings, radiant barriers, and foil-faced insulations;
Thermal mass, conventional thermally massive materials (i.e., roof tiles), passive solar applications, and phase-change materials;
Air spaces and naturally ventilated cavities;
Active ventilation of attics, above-deck inclined air cavities;
Over-the-deck or under roof-deck insulation.
Research on the field-performance of roofs completed by Miller and Kośny [
40] on a variety of roof and attic configurations demonstrated that thermal disconnect strategies installed on the roof surface and roof deck areas could notably modify roof dynamic thermal response characteristics. This included decreases in total heat flow rates through the roof, peak-time load maxima of thermal loads generated by roofs, as well as flattening the diurnal temperature oscillations in all material layers between the top of the roof surface and the bottom surface of the roof deck.
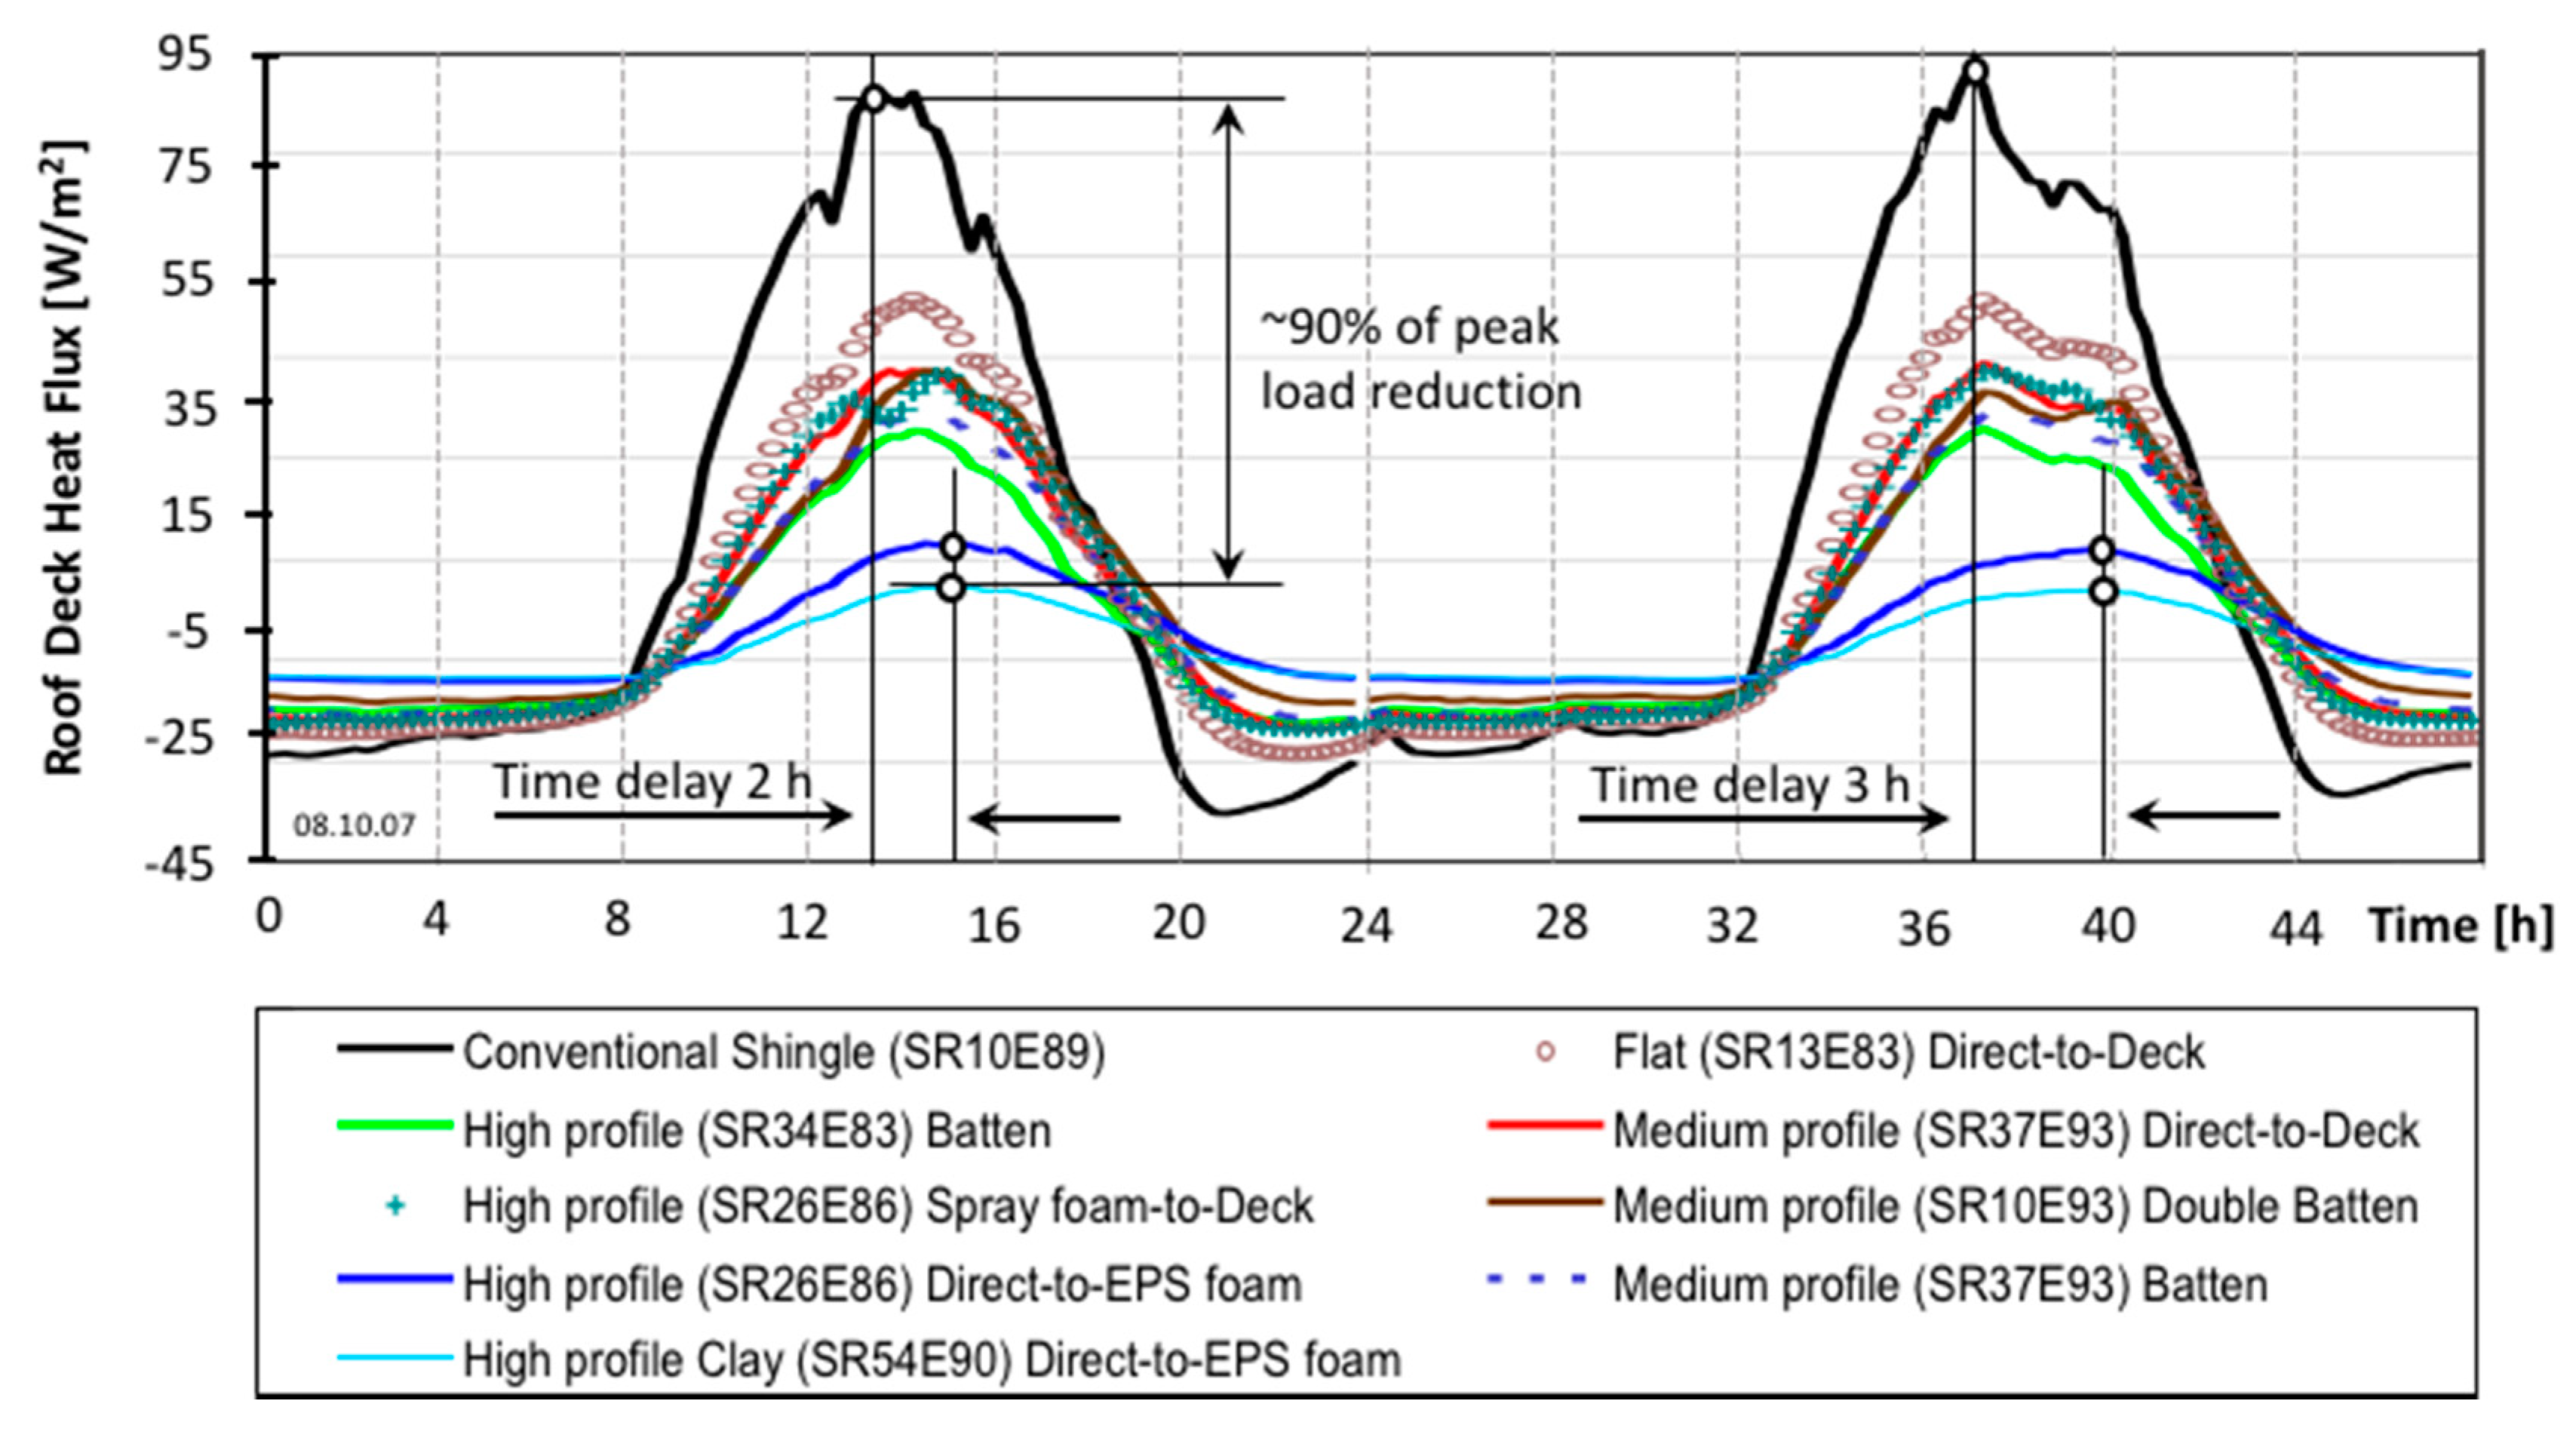
To illustrate the potential for the enhancement of roof’s dynamic thermal response characteristics by conventional massive roofs combined with thermal disconnect technologies, the roof-level heat flux data for a combination of tile roofs and roof deck insulation strategies is discussed below [
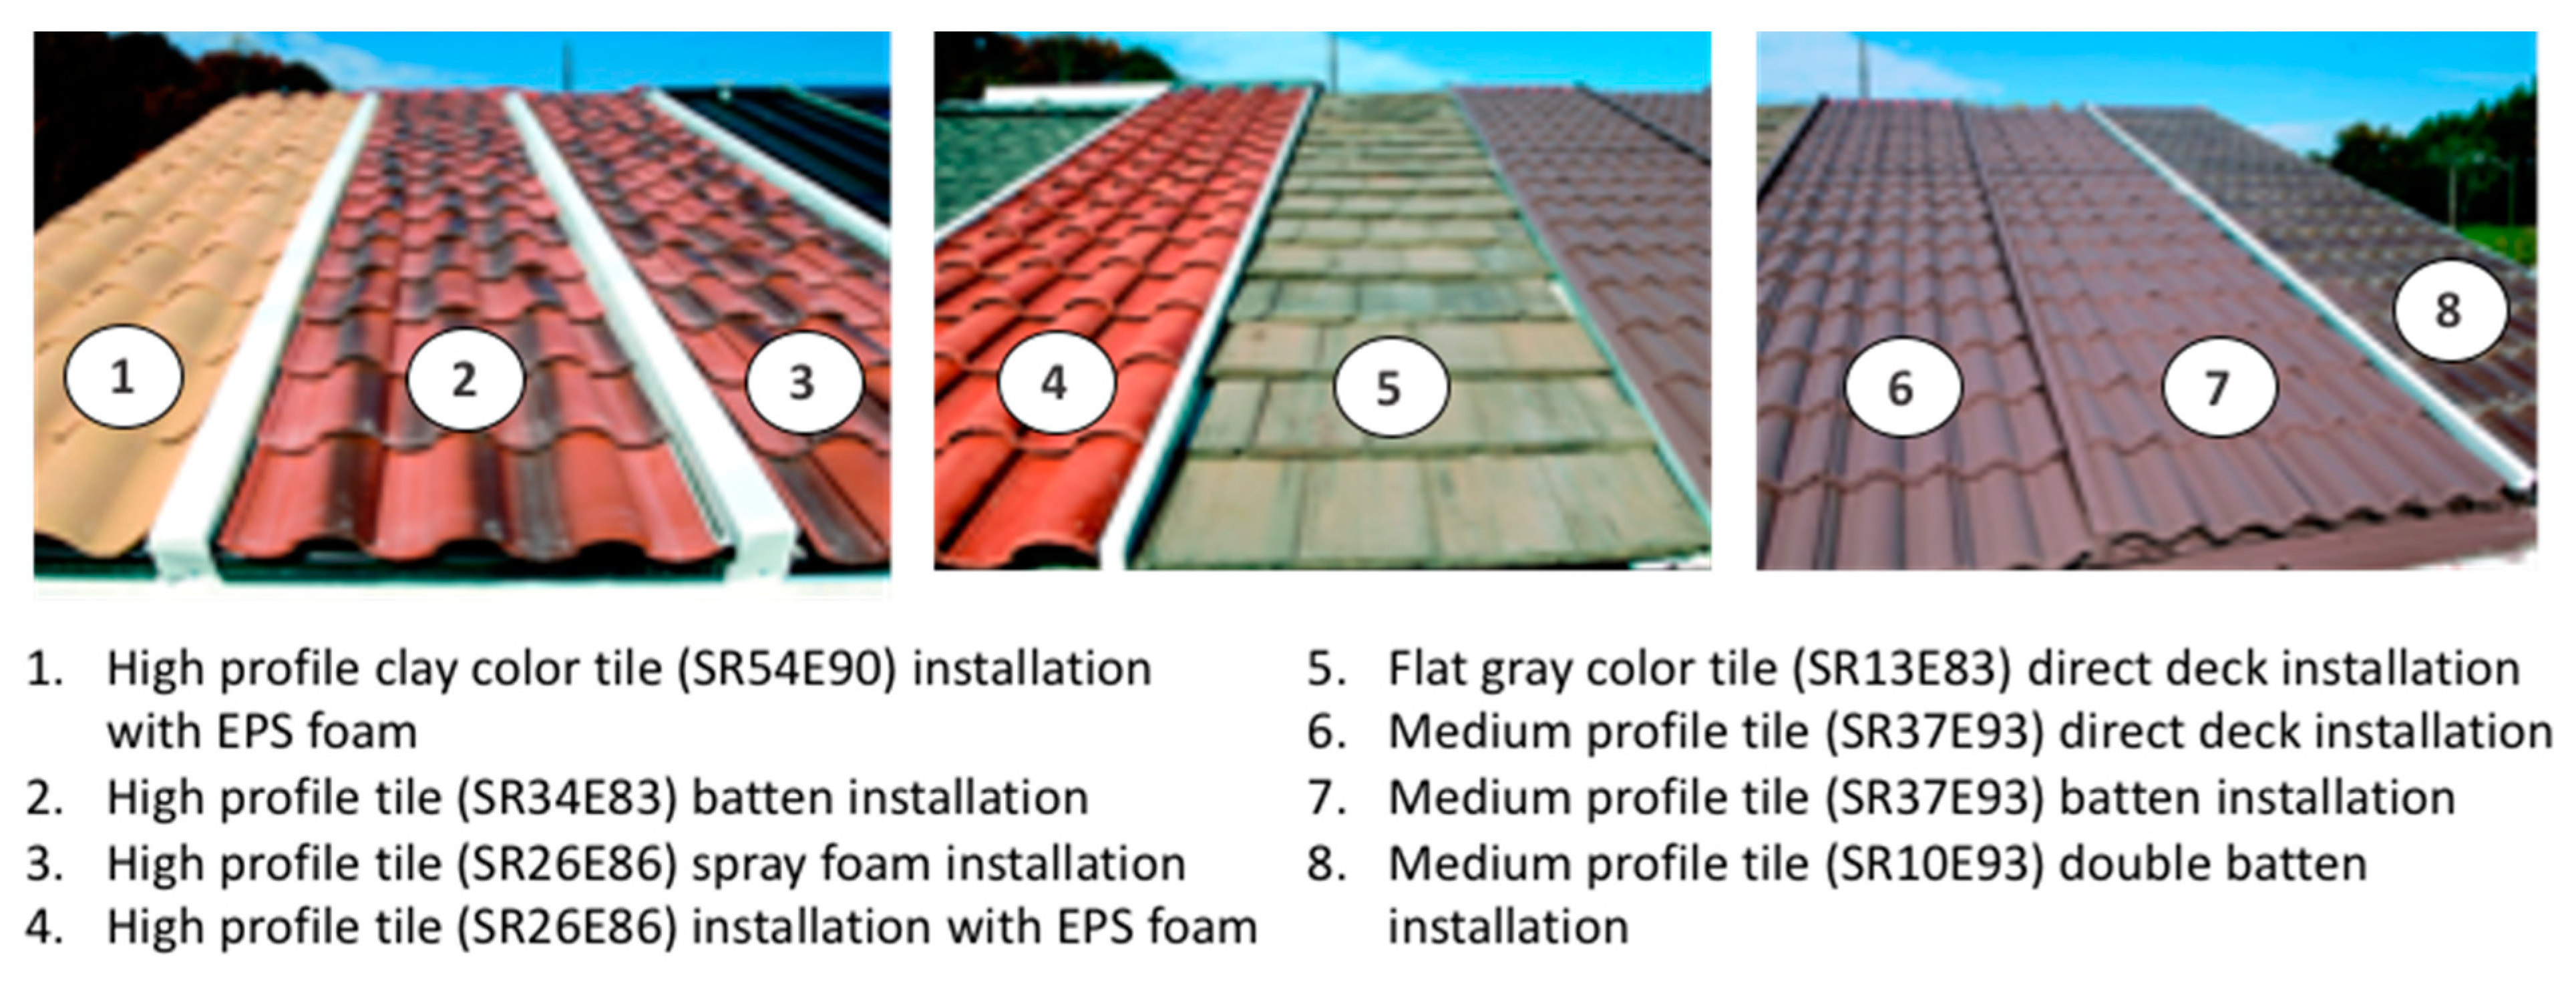
28]. Concrete and clay tile roofs, as well as attic assemblies were field tested to assess the effects of high solar reflectance roofs, thermal insulation, thermal mass, and placement of batten and double batten systems under the tile, as shown in
Figure 14. In addition to thermal mass, the following three thermal disconnect strategies were examined: (i) modification of solar reflectance of the roof surface through the application of cool-colored pigments; (ii) addition of an over-the-deck air gap, creating a ventilation channel between the tiles and the roof deck; and (iii) installation of additional over-the-deck thermal insulation. Four high-profile concrete and clay tile roofs, three medium-profile concrete tile roofs, and one flat concrete tile roof were constructed and tested [
40,
45]. Additional roof assemblies built with commercially available asphalt shingles, with a solar reflectance (SR) of 0.093 and thermal emittance (E) of 0.89 (SR09E89), were used for comparing the thermal performances of the candidate roof systems.
As shown in
Figure 14, a high-profile tile roof with conventional terra-cotta color pigments (SR34E83) was tested on nominal 2.5 × 2.5 cm wood battens (wood spacers). Two more roofs, one with high-profile concrete tile having a splotchy terra-cotta finish (SR26E86) and the other one with a high-profile clay tile with cool-colored pigments (SR54E90), were each placed on 3.2 cm thick layer of expanded polystyrene foam (EPS) adhered to the deck using a spray polyurethane adhesive.
Three medium-profile concrete tile roofs were configured as follows: (i) direct to the roof deck and the tile painted with a cool-colored pigmented coating (SR37E93), (ii) on battens (3 × 4 cm nominal lumber) with cool-colored pigments (SR37E93), and (iii) on double battens with tile having conventional color pigments (SR10E93). All three medium-profile tiles exhibited less heat transfer across the roof deck as compared with the flat tile (SR13E83) mounted directly to the deck. The medium-profile tile with conventional color pigments and on double battens (0.038 m) showed deck heat transfer very similar to that of the cool-colored tile attached directly to the deck. The terra-cotta tile slightly outperformed all medium-profile tile configurations (
Figure 15).
Thermal performance comparisons of eight test roof assemblies show that in addition to the thermal mass of concrete and clay tiles, the key thermal disconnect measures impacting the magnitude of roof’s diurnal peak loads are the following: (i) amount of over-the-deck insulation, (ii) radiative properties of the roof surface, and (iii) the depth of the above-deck ventilation cavity. Two roof designs constructed with high-profile tiles installed on top of a 3.2 cm thick layer of EPS foam demonstrated significantly better thermal performance than the other test roofs. This indicates that, in the case of thermally massive roof tops, the overall thermal resistance of materials and systems installed on top of the roof deck is a key material characteristic affecting the peak load time shift and decreasing the peak heat transfer. As depicted in
Figure 15, the additional thermal resistance of EPS foam (R
SI-0.85 m
2·K/W) under the high-profile terra-cotta tile helped shift the time of the peak thermal load by 2 to 3 h, as well as reduced peak heat transfer by over 80% of that measured for the control shingle roof. Even further reductions in deck heat transfer (close to 90%) were observed with the clay tile roof, because its solar reflectance was twice that of the terra-cotta tile. In roof-attic assemblies having additional attic floor insulation, the shape of the peak load curve (for roof-generated thermal loads) can be even further flattened and delayed in time, as shown in
Figure 8 and
Figure 9.
In the case of lightweight roof cover materials, for example, asphalt shingles or metal panes, the thermal mass effect can be provided by a layer of PCM installed on top of the roof deck. Following the roof deck design shown in
Figure 10 and
Figure 11, an unconventional configuration of a metal roof, containing photovoltaic (PV) laminates and a high-performance thermal disconnect system utilizing PCM heat storage, was constructed at ORNL, during the fall of 2009. As shown in
Figure 16, a layer of macro-packaged PCM, with a thickness of 1.9 cm, was used. This PCM was placed directly on the roof deck. In this assembly, the organic PCM was packed in arrays of plastic pouches 4.4 × 4.4 × 1.3 cm with 1.3 cm spacing (air pockets in plastic cells represented about 20% of the total volume). It was followed by a 3.4 cm thick layer of the dense fiberglass insulation with a reflective surface facing the metal panels above, and finally, metal panels with preinstalled PV laminates on top [
46]. Bio-based PCM with a melting temperature of approximately 32 °C was utilized in this experiment. The phase transition enthalpy of the PCM was about 190 J/g. The nominal latent heat storage density of the PCM packed in the plastic film pouches was around 156 Wh/m
2 of the roof area. As shown in
Figure 16, PCM was macro packaged between two layers of heavy-duty plastic foil forming arrays of PCM cells. The fiberglass insulation had a nominal thermal resistance of 1.1 m
2∙K/W. Air cavities between the PCM cells and the air gap above the fiberglass insulation provided above-sheathing ventilation to help reduce the attic-generated cooling loads during the summer.
In general, in roof assemblies where over-the-deck ventilation, radiant barrier, or thermal insulation are used, the attic space below is exposed to significantly lower thermal stresses as compared with typical North American roofs, where shingles are installed on top of a thin layer of underlayment which is directly placed on the roof deck surface. This experiment proved that a dynamic thermal disconnect system utilized in the construction of the PV-PCM roof worked exceptionally well. However, note that the PV-PCM roof was topped with highly absorbing PV laminate. From a thermal performance perspective, the PV laminate was obviously a disadvantage. This resulted in similar peak roof surface temperatures as in the case of conventional shingle roofs [
44]. Therefore, any potential benefits of the previously discussed cool roofs using solar reflective coatings were eliminated. The overall thermal performance of the PV-PCM roof data depended on the physical characteristics and effectiveness of the thermal disconnect system installed below the roof surface. This experiment further showed that lightweight sloped roof structures utilizing an over-the-deck thermal disconnect could generate a significant time shift in the peak thermal load generated by the roof.
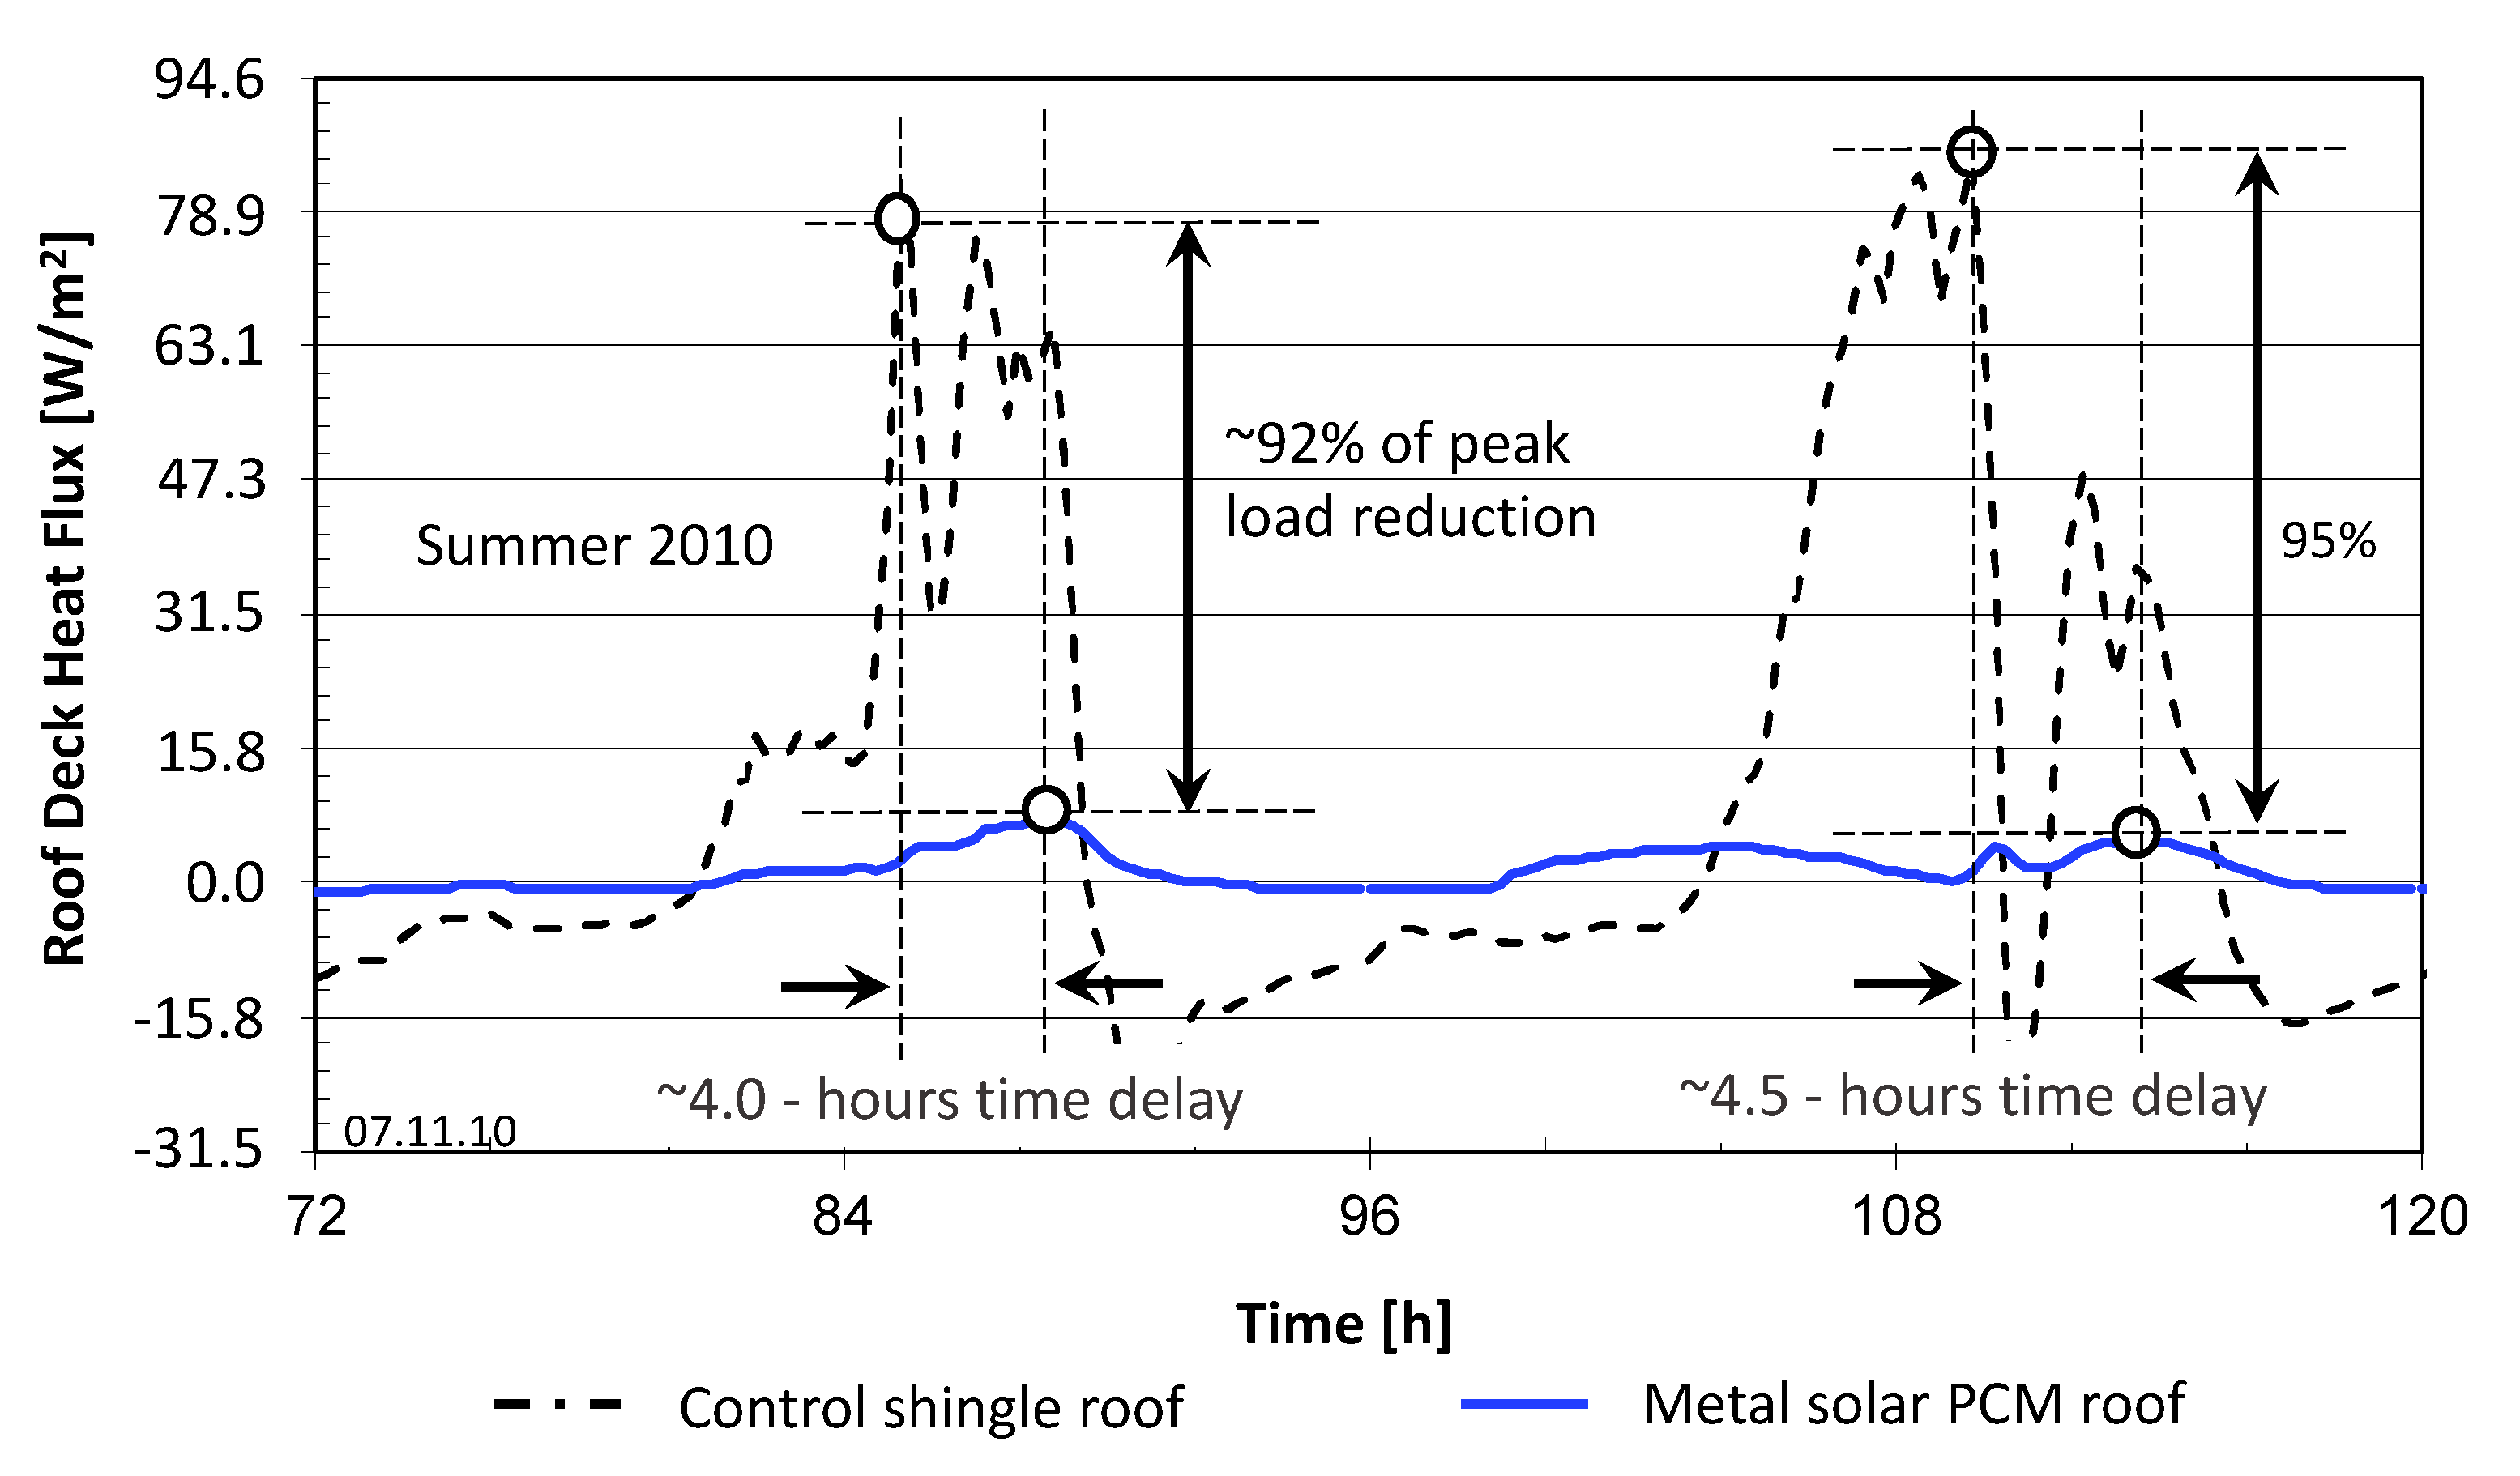
Figure 17 and
Figure 18 present comparisons of heat fluxes measured on the bottom surfaces of the roof decks for a PV-PCM roof and a conventional shingle roof, during both the summer and winter. As shown in
Figure 17, the test roof with PV laminate and thermal disconnect over the deck, reduced the peak time thermal load by over 90% during the summer. Furthermore, a time shift of four hours was recorded. Both of these features are very useful from the perspective of the whole building thermal response control and management of the cooling energy demand.
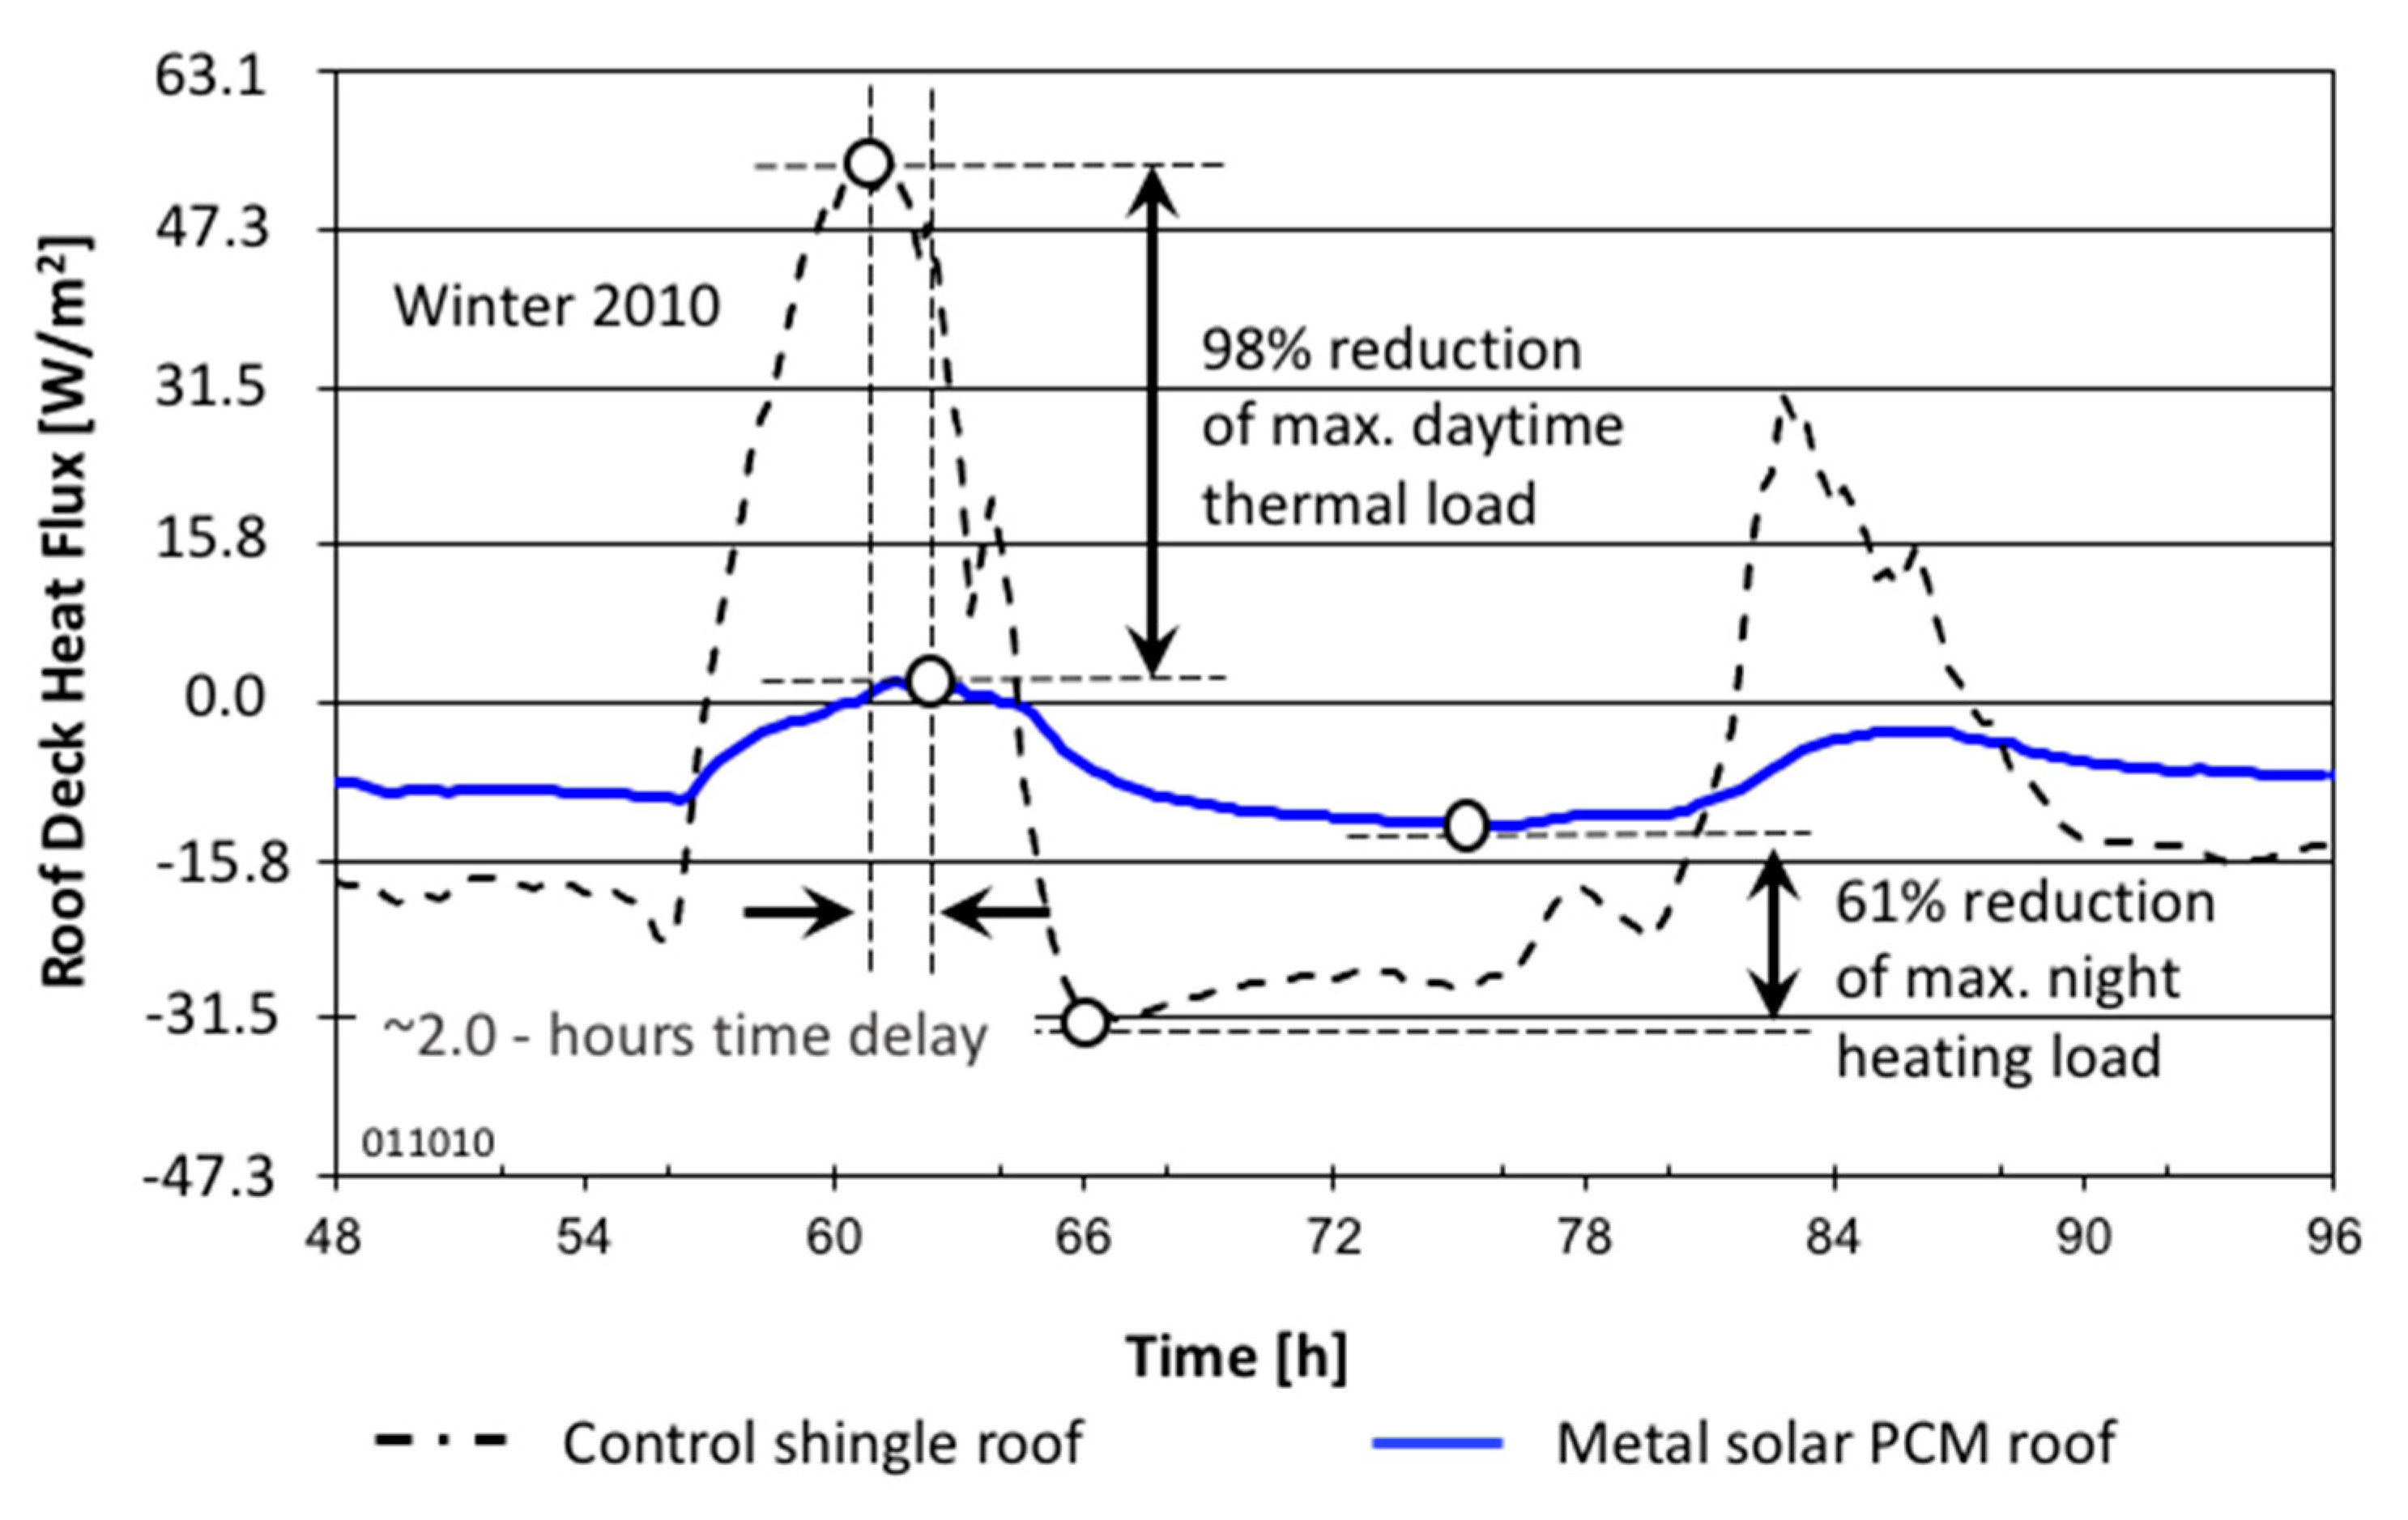
As shown in
Figure 18, heat absorbed by PCM during the winter resulted in a 66% reduction of the overnight heating load (heat losses) and about 60% reduction of the maximum night heating load. In addition, the maximum peak heat was shifted by about two hours.
8. Two-Phase Control of Roof-Generated Thermal Loads: The Impact of Peak Temperature Reduction on the Roof Deck
Sloped roofs with insulated attic spaces have the potential to be one of the most energy efficient building components. This is accomplished by integrating attic floor insulation, attic air space, attic ventilation, and thermal disconnects installed at the roof deck level and use of cool roof materials.
The large amounts of solar energy collected by the roof surfaces result in rates of heat transfer to the interior, that must be removed by the space conditioning systems to maintain occupant comfort. Unfortunately, these loads are the greatest during afternoon hours, which is the time when the peak of the building energy consumption occurs. Therefore, from a peak energy management perspective, it is critical to minimize the roof generated loads and, if possible, shift the maximum heat gains to later hours in the night. Usually, large amounts of conventional thermal insulation are used for this purpose. Quite often, the effectiveness of this approach is compromised by the existing thermal bridging or a lack of space for thermal insulation. Furthermore, as discussed in earlier sections, lightweight thermal insulation does not create significant peak load shift.
An earlier research on different designs of attics and roofs by Miller, Kośny et al. [
30,
40,
45] demonstrated that a combination of thermal disconnect systems installed on the roof deck level and attic floor insulation can effectively reduce and shift peak thermal loads. Thermal disconnect systems installed over the roof deck can effectively control the roof surface and roof deck temperatures [
28].
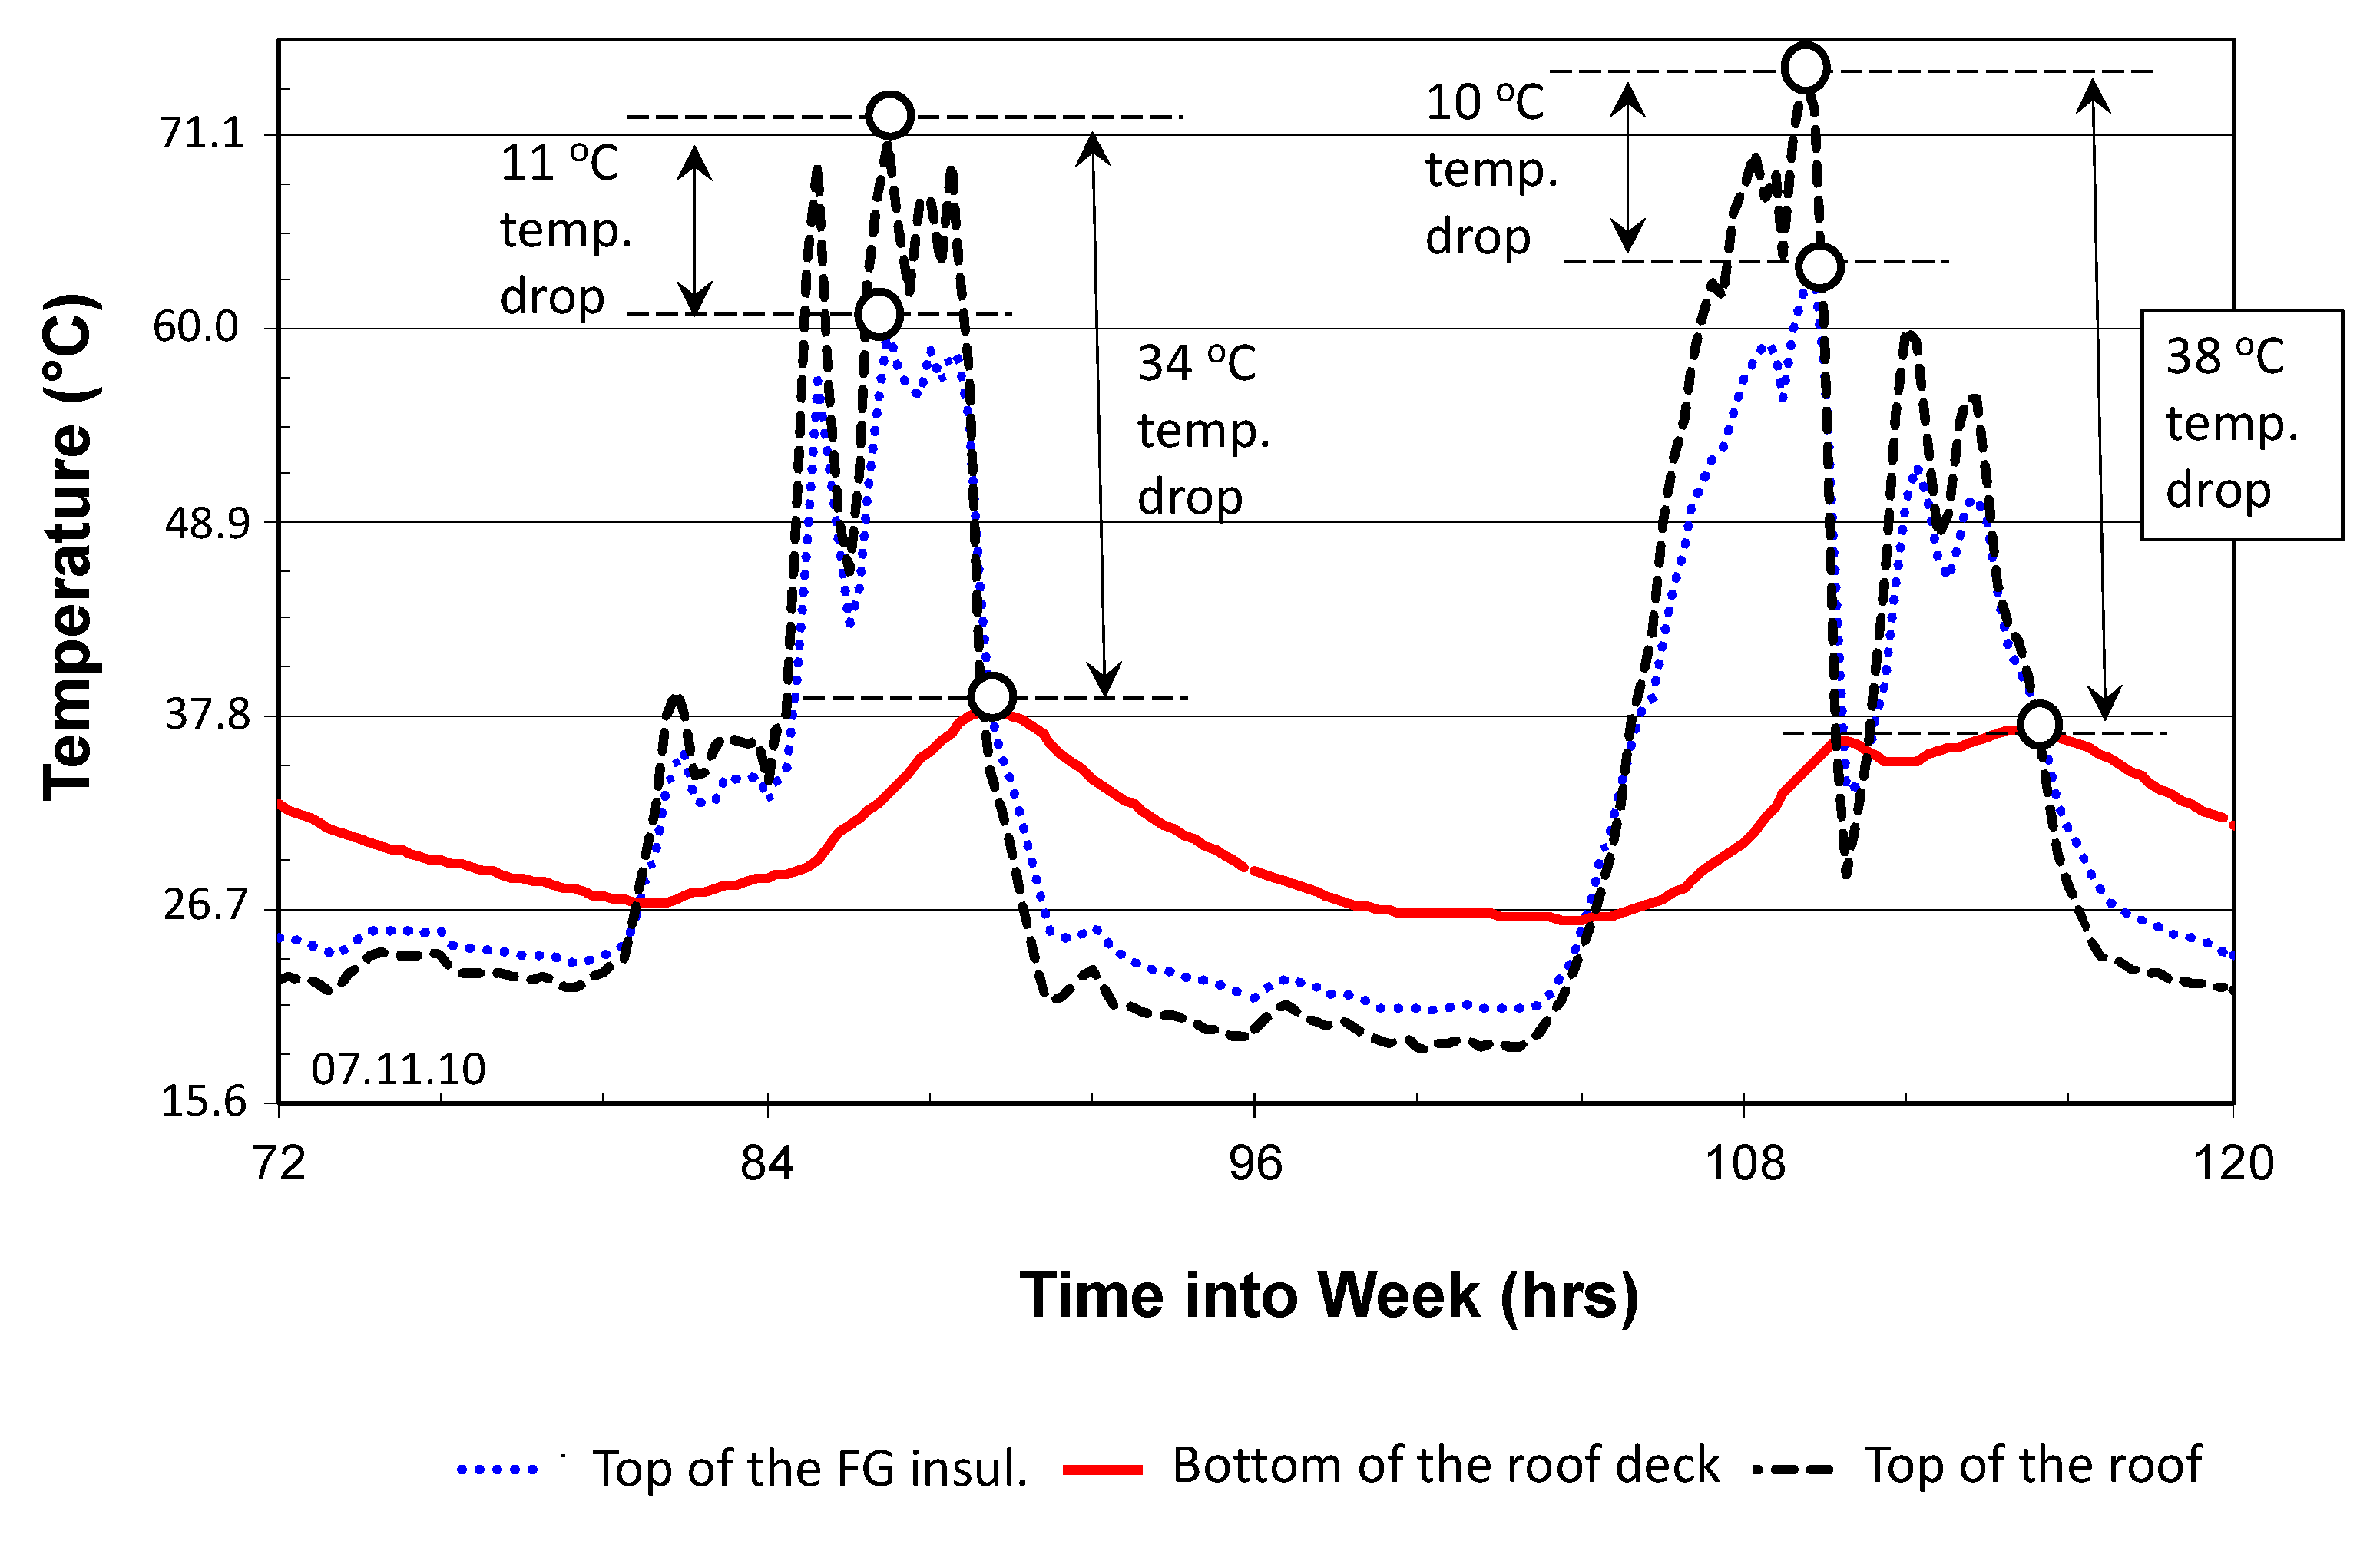
The thermal performance of the previously described metal PV-PCM roof, presented in
Figure 16, was monitored through several seasons and compared with a traditional shingle roof and differently constructed metal roofs using reflective cool coatings [
44,
46]. As shown in
Figure 19, the summer maximum roof surface temperature can be as high as 80 °C. At the same time, the maximum temperature of the underside surface of the roof deck can be 40 °C lower than the surface temperature. In this roof, the first component of the thermal disconnect system, which works as a thermal break and provides above-deck ventilation, is the 5.7 cm thick air containing a radiant barrier. For comparison, the peak time temperature on top of the layer of thermal insulations (dense fiberglass installed just behind the air cavity and over the PCM) is about 10 °C lower than that measured on the exterior roof surface.
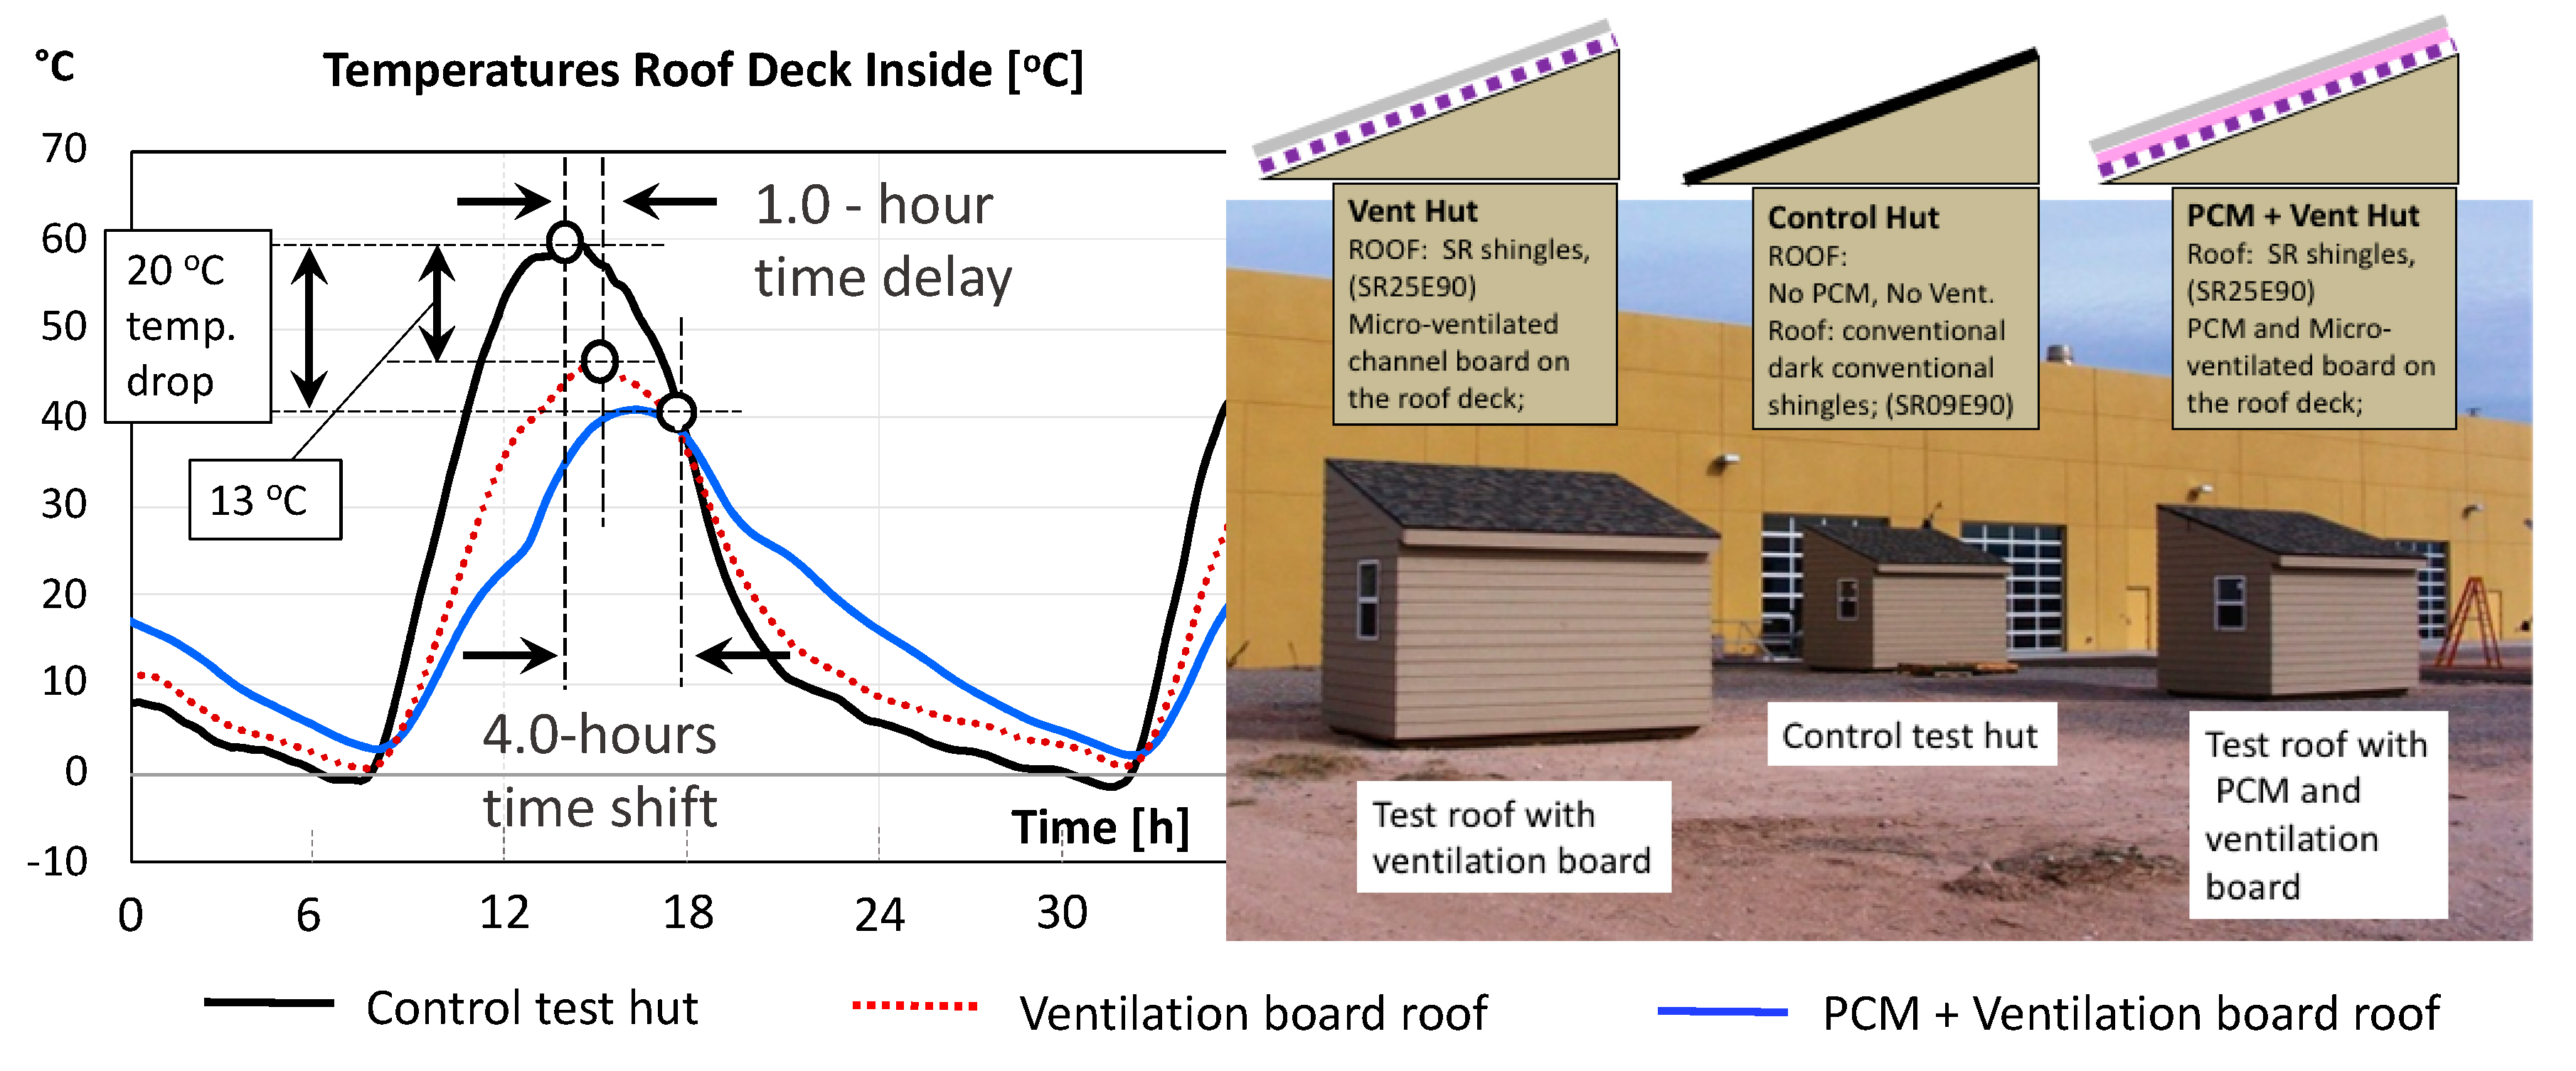
In the second example, the effectiveness of a thin roof-deck-installed thermal disconnect technologies (only about 1 cm and 2.5 cm, with included PCM heat storage) was evaluated with three roofs studied, during 2011, in Albuquerque, New Mexico. The system studied was comprised of the following: (i) the cool roof surface, (ii) the PCM heat storage, and (iii) the board with micro air channel installed directly on the roof deck. As depicted in
Figure 20, three test roofs were used for these performance comparisons. Each of these three roofs covered built-alike test hut. Test roofs were similarly constructed with the following differences in layers installed on top of the roof decks:
- (a)
Hut 1 was a control hut built with a typical slope roof covered with conventional dark shingles (SR09E90) installed directly on the roof deck (over a typical roofing underlayment). Roof deck assembly R-value was 0.14 m2K/W.
- (b)
Hut 2 had a typical slope roof covered with solar reflective shingles (SR25E86) and built with a 1 cm thick layer of PCM board that contained about 2.5 to 3 kg/m2 PCM, melting point was 28 °C, and energy storage density of the PCM board was around 90 Wh/m2. The PCM board was installed over a 1 cm thick composite board with air channels (for thermal break and roof deck ventilation), which was attached to the roof deck. Roof deck assembly R-value was 0.39 m2K/W.
- (c)
Hut 3 had a typical slope roof covered with solar reflective shingles (SR25E86) and built with 1 cm thick composite board with air channels (for thermal break and roof deck ventilation), which was attached to the roof deck. Roof deck assembly R-value was 0.32 m2K/W.
Figure 20 presents a comparison of temperatures measured on the bottom surfaces of the roof decks in all three tested roofs. This experiment demonstrated that even in quite compact (space saving) lightweight sloped-roof structures, an application of thermal disconnect design, could yield a notable reduction of peak time roof temperature and generated a significant time shift in peak thermal loads generated by the roof. The tested technology was comprised of the board with micro-ventilation channels and PCM.
In the case of applications without PCM (including a 1 cm thick board with micro-ventilation channels), the difference in peak daytime temperatures between the control roof and the roof containing the thermal disconnect was about 13 °C, and there was a one hour time shift. At the same time, the peak temperature difference between the control roof and the roof containing a 1cm thick layer of PCM, installed on top of the board with ventilated channels, was about 20 °C with a four hour time shift.
The analysis, presented in
Table 2 and
Figure 5 and
Figure 6, shows that the rate of the peak load reduction and the scale of the time shifting directly depend on the magnitude of thermal excitation impacting the analyzed building envelope. Furthermore, the test data collected on a variety of roof-deck-installed dynamic thermal disconnect systems indicates that they can notably reduce the maximum temperature affecting the attics below, i.e., the lower the peak thermal excitation reaching the attic, the higher the load reduction rate and the longer the time shift generated by the PCM-enhanced attic floor thermal insulation. Considering that peak load shift generated by roof-deck-installed thermal disconnect technologies can be between 1 to 4 h, and taking into account, as presented in
Table 2, the length of time shifts which can be generated by the PCM-enhanced attic floor insulation, it is clear that it is possible to design roofs which can shift the roof generated cooling loads by more than 10 h. The data discussed in this paper presents unique design considerations for using building envelopes as key components of dynamic peak energy load management in buildings.
9. Conclusions
Reflecting recent continually rising interests in building thermal response characteristics, energy consumption dynamics, peak energy load management, advanced configurations of metal, tile, and shingle roofs and adjacent attics were analyzed and tested. Our results indicate that in roofs containing either conventional thermal mass or latent heat storage, combined with cool roof coatings, above-deck ventilation, radiant barriers, and thermal insulation placed over or below the roof deck, the rate of the peak load reduction and a magnitude of the peak load time shifting can be very significant. Furthermore, a similar analysis performed on the attic floor insulation containing phase change materials revealed further potential for alteration of dynamic thermal response characteristics.
Different configurations of roof-deck-installed thermal disconnect systems were studied. The results of field testing demonstrate that major benefits of this technology include the following:
Effective reduction of the overall roof-generated thermal loads;
Significant reduction of the roof-generated peak thermal loads;
Significant shifting of the roof-generated peak-hour thermal loads;
Substantial reduction of daily heat gains and nocturnal heat losses;
Effective, space saving heat conduction breaks between the top surface of the roof and the roof deck.
Several novel configurations of roofs and attics, presented in this paper, exhibited over a 90% reduction in roof-generated peak-hour cooling loads, significant peak load time shifting, and sometimes close to a 60% reduction in overall roof-generated cooling loads as compared with traditionally constructed roofs. Furthermore, different configurations of reflective roofing technologies and thermal disconnect systems that were installed over the roof deck, considerably reduced peak roof temperature which was transmitted by the roof structure to the adjacent attic space (by 10 to 40 °C depending on the material configuration). Only technologies containing PCM, for designs of roof-deck-installed thermal disconnect systems and in the case of attic floor insulation, generated significant thermal shift of peak loads (with the exception of thermally massive tile roofs).
Following recent interests in the building energy consumption dynamics, and in peak energy load management, this publication shares with the readers a unique design strategy for constructing roofs and attics with significant thermal load shavings and up to ten-hour-long time shifts of the peak load period. The proposed design considerations could, in the future, help with effective management of dynamic energy demand in buildings.


