1. Introduction
The present power system is found to have a revolutionary change in terms of using the resources for energy generation. The main difference between the present and the traditional power system is using distributed energy sources (DES), such as renewables and energy storage options compared to conventional energy resources. The DES penetration to the power system is relatively high in recent years, which has enabled the power system to transition towards achieving sustainability and, at the same time, ensuring resilience operation [
1]. In addition to sustainability and resilience, the changes made in the power system are found to have more benefits in several situations. These include the ease in energy transaction and sharing facility, reducing power losses over long transmission lines, and reducing the amount of investment necessary to construct new power transmission lines [
2,
3]. Moreover, DES would help to decrease the effects of climate change and the gradual depletion of energy sources (coal, gas, and oil), dealing with the steadily increasing consumption of energy, satisfying the need for local economic and social development. The DES bears low power generation efficiency, high capital cost, deficiency to be dispatched from the centralized control center, and intermittency in the output power [
1,
4]. The DES, consisting of the non-conventional sources like photovoltaic (PV), wind turbine (WT), and battery energy storage system (BESS), are incorporated to form the microgrid (MG) [
5], which are interfaced to the power system and may actively operate on both grid-interactive and islanded condition [
6,
7]. PV and WT systems support each other during a day cycle. Solar energy, having more potential during sunny days and strong winds, mostly occurs during the nocturnal period. Usually, strong winds are noticed in the course of the nighttime and cloudy days in contrast to weak winds that occur during bright days. Irrespective of their erratic behavior and demerits, WT, and PV systems provide energy to load with greater reliability and uninterrupted supply with reduced emissions [
1,
4,
7].
The MG is interfaced with the power system through a hybrid shunt active power filter (HSAPF) [
8]. HSAPF supplies the compensating current [
9,
10] at the point of intersection (POI) and controls the power injection to the grid. The battery at the direct current (DC) bus confirms the power balance during a change in solar power and wind power generation concerning load demand. During less load demands and high renewable power generation, the BESS charges to collect surplus renewable energy. On the other side, with less renewable power generation and high load demands, BESS discharges for compensating the shortage of load demands. However, to maintain the stability of the system during long periods of excess power generation and less load demands, which results in top-up the BESS, a dump load is switched on at DC bus. Generally, MG runs in association with the power system. During this condition, the exchange of power takes place between the MG and the power system. However, in case any abnormality arises in the power system, the MG can effectively work in an islanded condition [
11]. The power generation in this condition must balance the load demands.
During power balancing, the islanded condition may face issues related to operation and control. Therefore, an advanced controlling technique must address the power quality (PQ) problems arising during the integration of MG with the power system through HSAPF and can effectively work at both grid-interactive and islanded conditions. During grid-interactive conditions [
12], MG frequency and voltage at POI are performed through the grid. MG manages the active and reactive power produced by the DES units, and it is its primary role [
13,
14]. While during the islanded condition [
15], the MG voltage and frequency are controlled through DES. The electric grid no more supplies the voltage and frequency variables. The islanded condition needs accurate load sharing, which can balance fast active power mismatches. Therefore, significantly more challenges [
16] are faced in islanded condition compared to grid-interactive condition. Further, it is also required to design a compensation strategy that can manage reactive, imbalance, and harmonic power-sharing by incorporating non-linear loads during the islanded condition. In this condition, the control design includes voltage and frequency control, active and reactive power control, and PQ improvement.
In this work, a solar PV, WT, and BESS connected MG is developed, linked to the grid network at POI using the voltage source inverter (VSI) of the HSAPF. The HSAPF is used to compensate for both the harmonics and reactive power. The performance of the MG can be improved if it works effectively during the islanded condition. Moreover, maintaining voltage and frequency limits with the intermittency of DES is a primary concern. The controlling techniques for the proposed power system model are divided into two categories:
- (i)
Controlling the VSI of HSAPF, and
- (ii)
Controlling the DES units of MG using advanced maximum power point tracking (MPPT) techniques for PV and WT system.
Several controlling techniques are developed for reference signal generation and harmonics estimation. The most frequently used method is the fast Fourier transform (FFT) [
17,
18]. FFT is not able to gather data about time tracing of different frequencies within the signal; therefore, FFT is unable to analyze non-stationary disturbances. To overcome these issues, the wavelet-based transforms are explored. These transforms offer time-frequency data of a signal. These transforms are more accurate in determining PQ indices in the power system under non-stationary conditions. In [
19], an empirical WT (EWT) technique is proposed to estimate harmonics and unbalance voltage under non-stationary conditions. In [
20], continuous wavelet (CWT) and discrete wavelet (DWT) are reported. The wavelet packet transforms (WPT), discrete wavelet packet transforms (DWPT), and the dual-tree complex wavelet transform (DTCWT) are discussed in [
21] and [
22], respectively.
Moreover, for tracking the maximum power in PV, MPPT techniques, such as perturb and observe (P&O) technique [
23], adaptive variable step-size P&O [
24], Fuzzy logic control (FLC), and Adaptive P&O–FLC technique [
25], incremental conductance (INC) techniques [
26], modified INC [
27], adaptive step size INC [
28], variable step size INC [
29] are commonly used.
In this paper, an advanced DWT, called advanced maximal overlap DWPT (AMDWPT) [
30], is used for harmonics estimation, and the synchronous reference theory (SRF) is used for reference signal generation. The DWT delivers inconsistent frequency bandwidth; further, DWT is a time-variant transformation and not suitable for detecting non-stationary PQ issues. The DWPT performs better compared to DWT as it decomposes both the scaling and wavelet coefficients at a specified composition level, but still, DWPT is a time-variant transformation. Therefore, to overcome these issues, the AMDWPT is involved in this research. AMDWPT offers both uniform frequency bandwidths of the DWPT and the time-invariant property. Further, for tracking the maximum power, the learner based incremental conductance (LINC) is used.
The objective of the work is to:
Mitigate the PQ problems by decreasing the total harmonic distortions (THD) below 5% (as per the Institute of Electrical and Electronics Engineers (IEEE)-519 standard) and improving the PQ with a balanced load and improving the power factor.
Maintain the power transfer system effectively before the availability of wind velocity and solar insolation level.
Effectively operate the MG in the islanded condition during the case of a fault in the supply grid and controls load power management.
Implement AMDWPT based SRF theory of managing the VSI of HSAPF and LINC for tracking the maximum power from the PV system and WT.
The manuscript is articulated in six different sections;
Section 2 provides the design of the proposed system. In
Section 3, control strategies are presented.
Section 4 provided an analysis of the simulation and real-time results of the proposed method. Finally, based on the carried out investigations, the conclusions were drawn and presented in
Section 5.
2. Proposed System Design
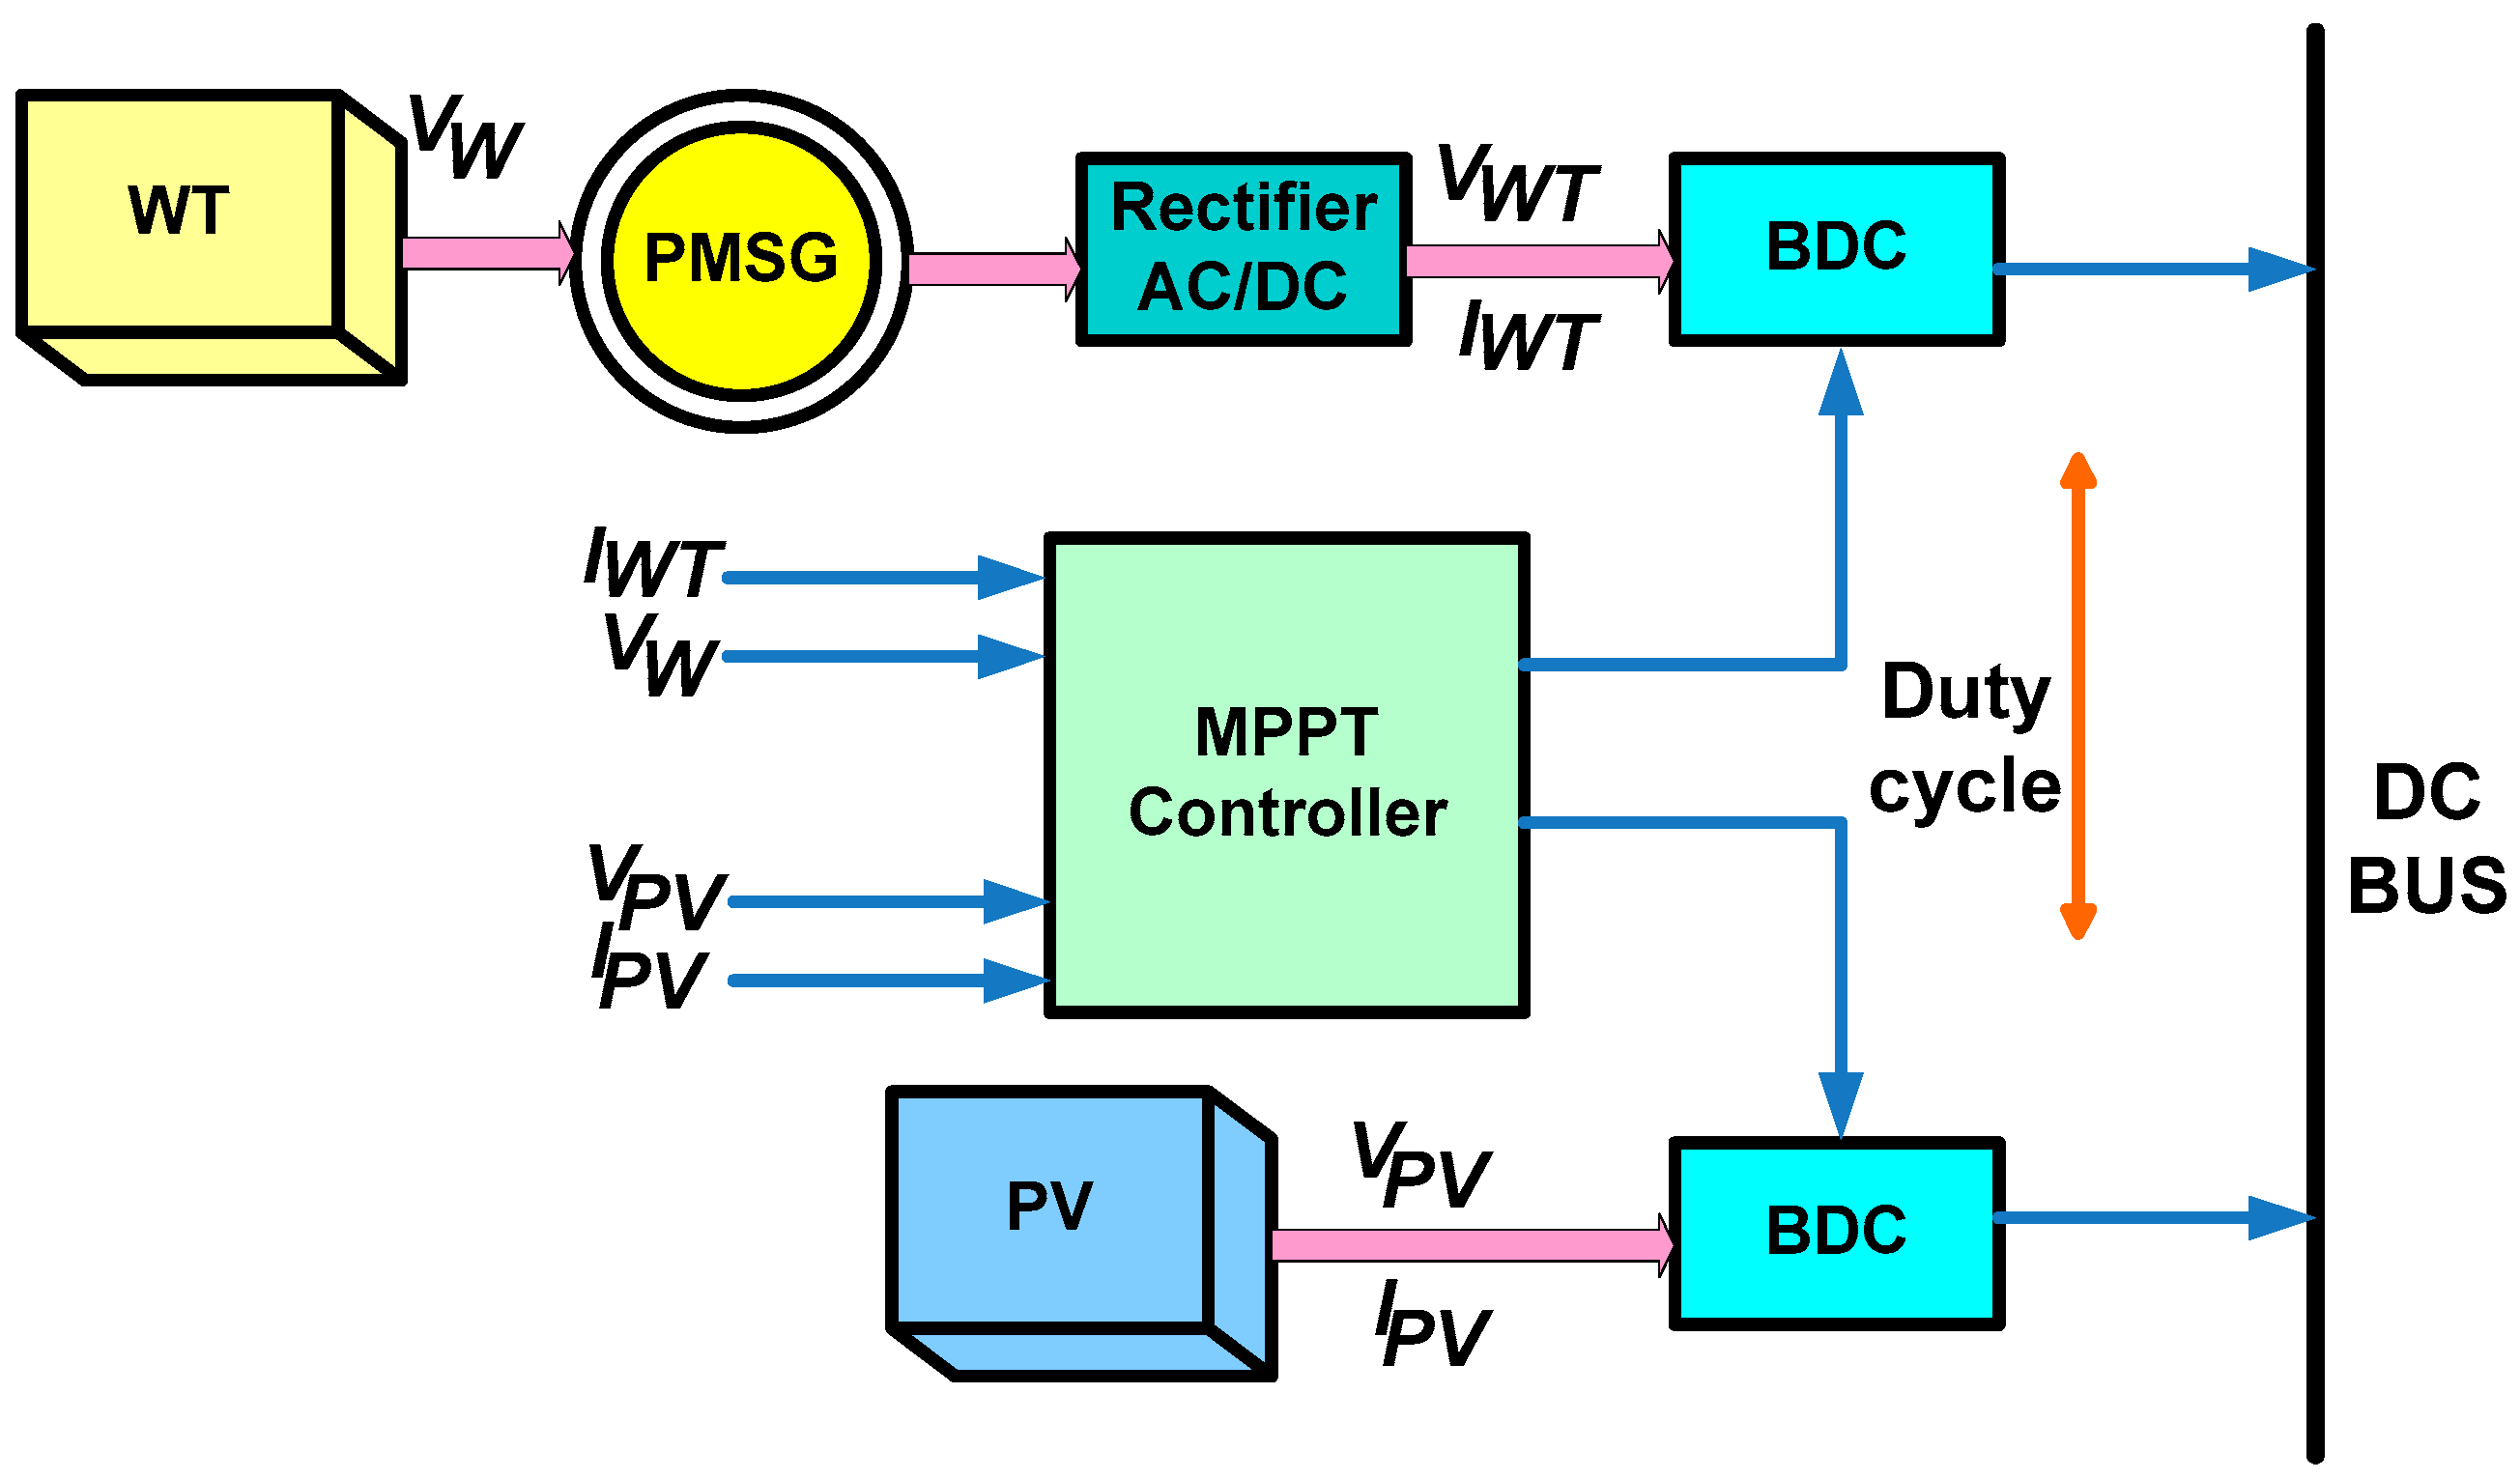
The proposed system consists of an MG, HSAPF, DC-DC boost converter (DBC). The MG is the combination of PV and WT. The MG system is connected to the BES and the non-linear loads via a bi-directional converter (BDC). The schematic structure is shown in
Figure 1. The proposed system is designed with the MG interfaced power system through interfacing inverter, HSAPF at POI. The MG (consists of a PV, WT, and BESS) is connected to the DC link of VSI of HSAPF. The modeling of the PV and WT is presented in
Appendix A.1 and
Appendix A.2. BESS is employed for drawing the power intermittency of wind speed and solar-irradiance variations and load perturbations. In BESS, the process of charging/discharging is controlled by using the BDC and the modeling is presented in
Appendix A.3. In BESS, the existence of the BDC is to sustain the desired bus voltage even at the maximum load conditions by supplying the surplus source from BESS. The PV is connected to the dc bus through a DBC. The solar modules are connected in series to form strings and are attached in shunt an array. To achieve the MPPT, the PV output voltage is appropriately attuned and can be done using the DBC and its modeling is provided in
Appendix A.4 and
Appendix A.5. Further, in WT, a permanent magnet synchronous generator (PMSG) is used for the production of power. With WT output, a DBC is connected, which regulates the DC bus voltage to follow-up the point of maximum power output. The WT can be operated in on MPPT, which is measured based on the power balance between the system and the state of battery charge (SOC) of the battery. The DC bus, inherently controlled by the DBC, provides the input to the three-phase grid side HSAPF. The VSI of HSAPF is used to control the alternating current (AC) bus voltage and frequency at load terminals and improving the PQ at POI.
The proposed system is based on a two-step power conversion process. Initially, with the help of DBC, the maximum power extraction is determined. DBC also regulates the DC link voltage for MPPT. The LINC technique [
22] is used for the peak power extraction of a PV and WT. The duty cycle is determined by using PV reference voltage and battery voltage. In the next stage, the VSI is employed for converting DC to AC power.
The VSI is controlled by AMDWPT based SRF technique. The DC link of VSI is connected to a battery through a BDC. The charging and discharging of the battery depends on the variation of load and improves the system reliability. The MG is capable of operating either in grid-connected or islanded conditions just by changing the transfer switch at the POI.
3. Control Strategies
The performance of the MG integrated HSAPF depends on the control strategy designed. In the proposed study, for improving the reliability of the proposed system, two different control strategies are taken, one for controlling the maximum power in MG and the other for controlling the VSI of HSAPF. The LINC technique is employed as an MPPT technique in PV and WT system, while the HSAPF is controlled using the AMDWPT based SRF technique. A flow chart showing the working of an MG integrated HSAPF interfaced with utility network is presented in
Figure 2.
3.1. Learning-Based Incremental Conductance (LINC) Technique
The performance of the PV and WT is developed at the maximum power point by employing a suitable MPPT technique. The block diagram of the controlling strategy of MPPT in PV and WT system is represented in
Figure 3. The MPPT controller allows us to optimize and maximize the power produced by both PV and WT systems. The modeling of PV, WT, and BESS with the selection of controlling parameters are presented in
Appendix A.1,
Appendix A.2, and
Appendix A.3.
The duty cycle
for the DBC is calculated as:
where,
is the reference voltage,
is the reference DC link voltage.
The comparator compares the sawtooth signal and
. The output of the comparator is capable of generating gating pulses for the DBC. The selection of DC-Link capacitor based on DBC calculation is presented in
Appendix A.4 and
Appendix A.5.
The reference DC link voltage is computed as:
where,
is the supply voltage amplitude and
is loss component.
The ‘
’ is expressed as:
The voltages are expressed as the product of in-phase unit-templates and .
The DC link error voltage
is given as:
, are, respectively, the dc link and reference dc-link voltage.
The
is provided to the PI, which supplies the DC loss component value
as:
Here, and are, respectively, the proportional and integral gains of the PI controller.
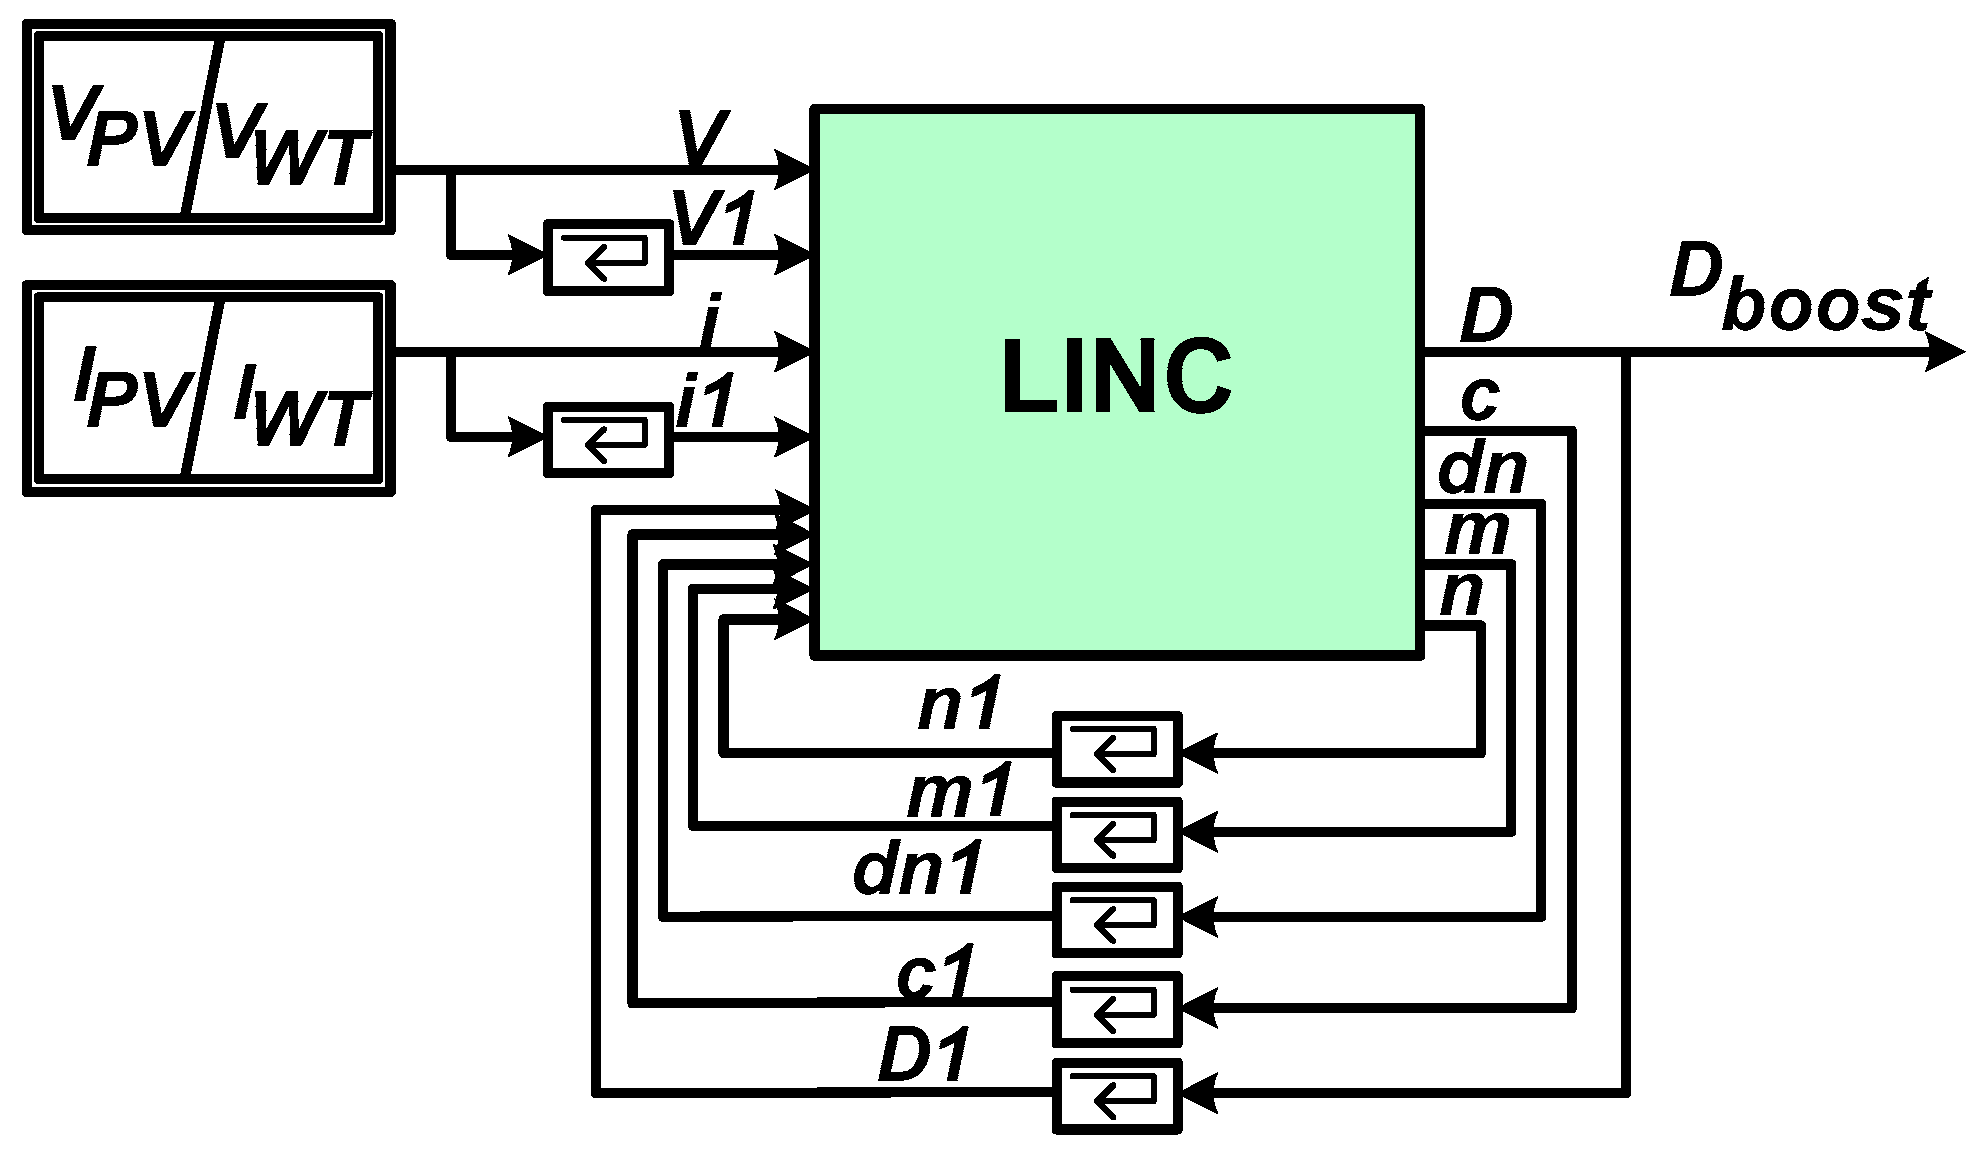
The controlling structure of the LINC technique with the duty cycle and PIC is shown in
Figure 4. The working strategy of the LINC technique is provided in
Figure 5.
The working procedure of the LINC technique is distributed in two parts. In one part, it deals with steady-state conditions, and in another stage, it deals with dynamic conditions. For detecting or assuming the circumstances, an envelope is formed with band limits in every iteration. The band limits are given as:
where,
Bu and
Bl, respectively, are upper and lower bands of the envelope and
is the base step size.
During dynamic state, change in step size is given as:
In the steady-state condition, variable ‘vl’ is considered as store addition of the first three conjugative duty cycles, and variable ‘ul’ is considered as the latter conjugative duty cycles.
Therefore,
dn is given as:
Finally, analyze the logics of optimal
D computation and is provided as:
where,
D1 is the previous duty cycle.
3.2. Synchronous Reference Frame
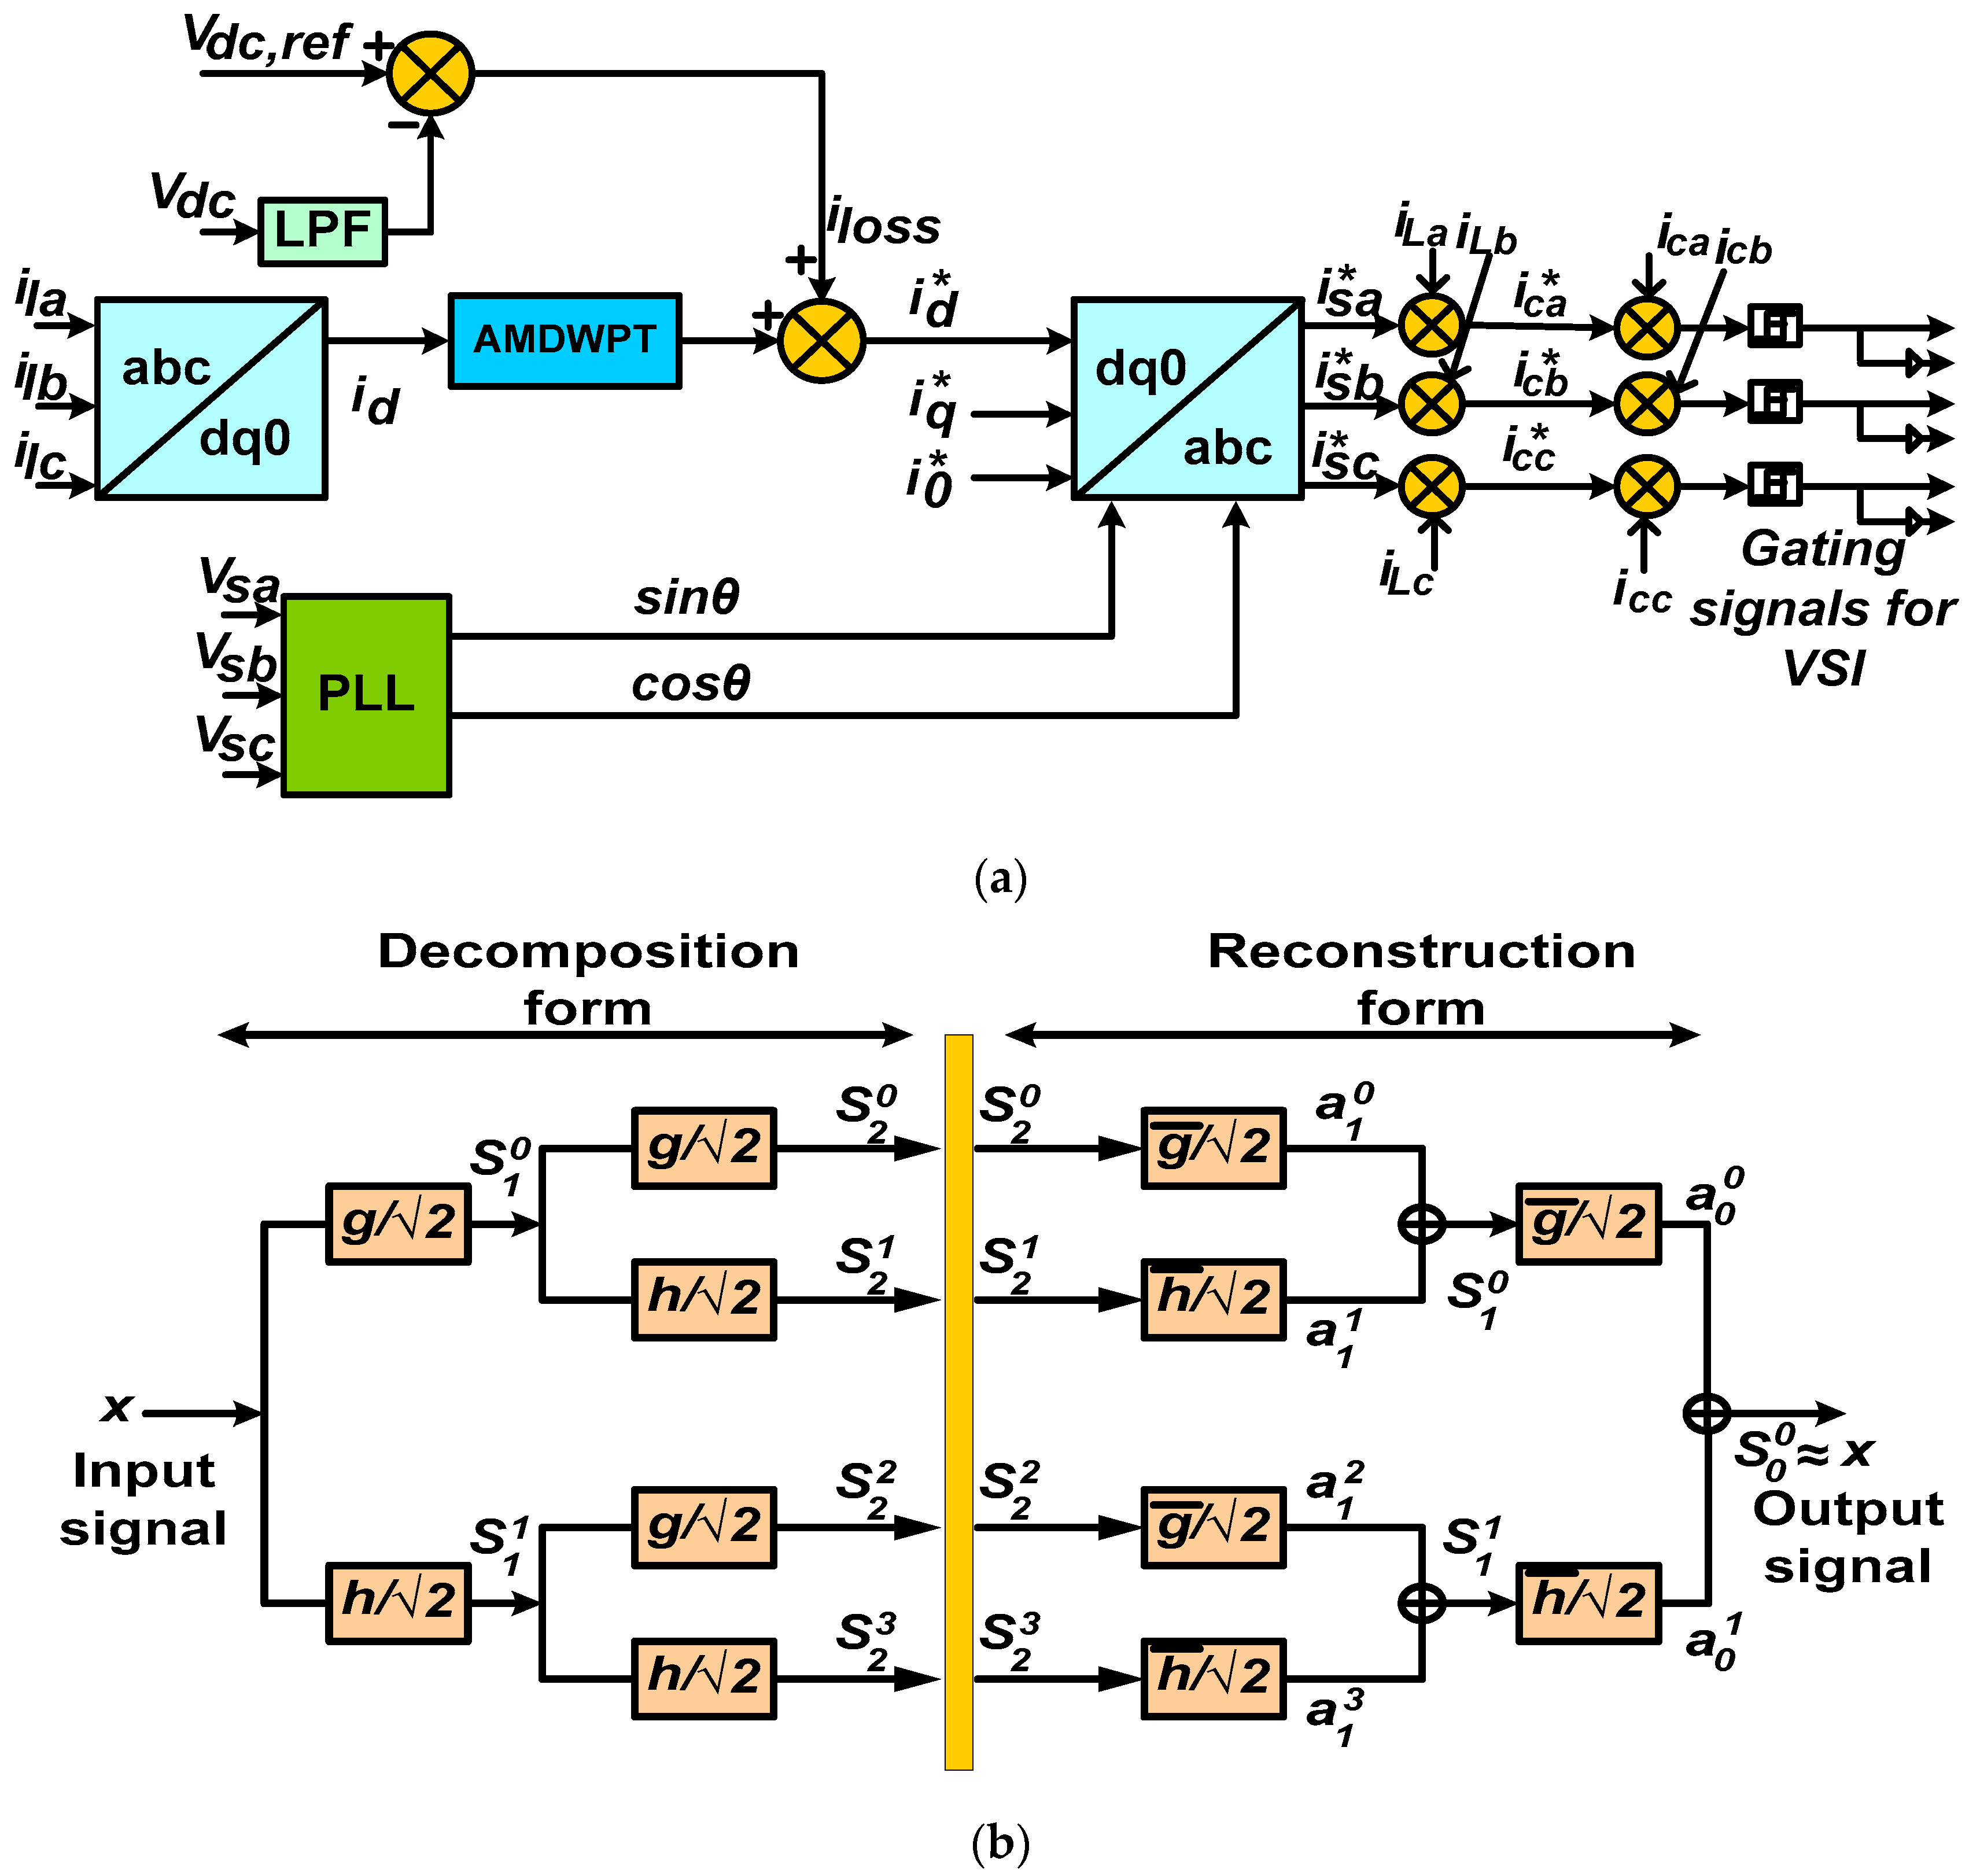
The AMDWPT based SRF block diagram is illustrated in
Figure 6a. The SRF technique is analyzed on the transformation of three-phase currents in a synchronously rotating
dq frame.
The transformation of three-phase load currents
iLa,
iLb, and
iLc in the rotating
dq frame are presented in Equation (12).
where,
θ denotes the angular position of the rotating frame. The rotating frame revolves synchronously with three-phase AC voltages using a three-phase PLL. The currents in
dq frame are found using Park’s transformation, presented in Equation (13), and are processed through AMDWPT to obtain the DC parts of
id and
iq.
The fundamental and harmonic components of
d and
q frame currents are given as:
where,
id and
iq are the direct and quadrature axis current. Again,
Finally, the transformation from
dq to
abc is done for generating three-phase reference currents (
,
and
).
The reference currents obtained in Equation (17) are then processed further and are fed to the hysteresis controller for switching signal generation.
3.3. Discrete Wavelet Packet Transform
The DWPT is more efficient compare to the DWT in contrast to the decomposition approach. The decomposition approach in DWPT is determined on the scaling and wavelet coefficients at a specific decomposition level, maintaining uniformity in frequency bands [
7,
31].
DWPT constants for any level
are achieved from the convolution of the sampled original signal with low pass and high pass filters
and
respectively as follows:
Here, is the actual signal; is the node number.
Basically, the accurate measured values of harmonics are calculated on the selection of mother wavelet. Because of low spectral leakage, a large quantity of filter coefficients delivers more accurate harmonic measurement. However, at the same time, it needs a substantial amount of resources and more computation, which in turn decreases the efficiency of the computational method.
3.4. Advanced Maximal Overlap DWPT (AMDWPT)
The wavelet coefficients in Equations (18) and (19) are calculated in alternating the samplings. Maintaining uniformity in frequency bands, the proposed technique decomposes the input signal into different levels using low and high pass filters. However, in contrast to the DWPT, there is no downsampling by a factor of two in maximum overlap discrete wavelet packet transform (MODWPT) (time-invariant transform). In the reconstruction, the decomposition coefficients are convolved to the reverse low and high filters in order to reconstruct the original signal.
Figure 6b illustrates the decomposition procedure of the input signal
using a two-level decomposition tree of the proposed technique.
At any level
, the decomposition and synthesis coefficients [
31,
32] are derived as:
But the convolution at a level
requires a partial modification in Equations (20) and (21) and is provided in Equations (24) and (25) as:
Here, and represents the filter length and current sampling. For an experimental observation, is assumed to be current sampling, which implies zero samples related to an index above , moreover, the complexity in calculation has to be smaller than seconds, is the sampling rate.
The reconstruction of the original signal is obtained from Equations (26) and (27) as follows:
The coefficients in the above equations are suitable for synthesizing the original signal
as:
The root mean square (RMS) voltages and currents are the root square of the mean square the fundamental and harmonic components, respectively. Therefore, for the proposed technique, the discrete voltage and current profiles are expressed as:
where, the node zero elements must involve the fundamental frequency of the original signal (f = 50 Hz).
The RMS current
is expressed as:
Similarly, the RMS voltage
is expressed as:
where,
and
denotes the RMS current and voltage of the lowest frequency band at node zero and level
j, whereas the term
and
represents the RMS current and voltage at the node
.
Based on the IEEE standard, the overall variation of a harmonic wave from its fundamental is measured using the THD value of voltage and current, which can be expressed as:
4. Results and Discussions
The performance of the hybrid filter in MG based power system is analyzed in MATLAB/SIMULINK tool using the AMDWPT technique. The BESS is connected with WT and PV to a supply system at POI and is charged/discharged through a BDC. The line voltages
are considered to be 440 V; the non-linear RL loads are considered to be 50 Ω and 0.05 mH. The interfacing inductor
is considered to be 4Mh, it is calculated as per the Equation (A11) shown in
Appendix A.6. The rating of solar PV
is taken for 5 kW. The solar irradiations current is considered to be 5.98 A. The voltage across the DC link bus
is considered to be 1000 V and the DC link capacitor
is taken at 200 µF. The resistance, inductance, and capacitance value of BESS are given as1Mh, 10kΩ, and 4560 F respectively. The voltage
and current
of battery are given as 240V, 56 Ah. The wind speed
is considered around 11 m/s, mechanical power
developed in the WT is taken around 15 kW, and the turbine radius
is taken at 5.5 m. The performance of the system is investigated in different cases. Simulation outputs are acquired in various instances, such as wind variation, solar irradiation, and load perturbations with an altered state of battery charge (SOC). The MG system employs solar PV, WT, and BESS. Therefore, the operation of the hybrid filter depends upon the individual characteristic components of the MG. In this work, three different cases have been analyzed to test the efficiency of the proposed hybrid filter with AMDWPT, which is presented in the subsequent subsections.
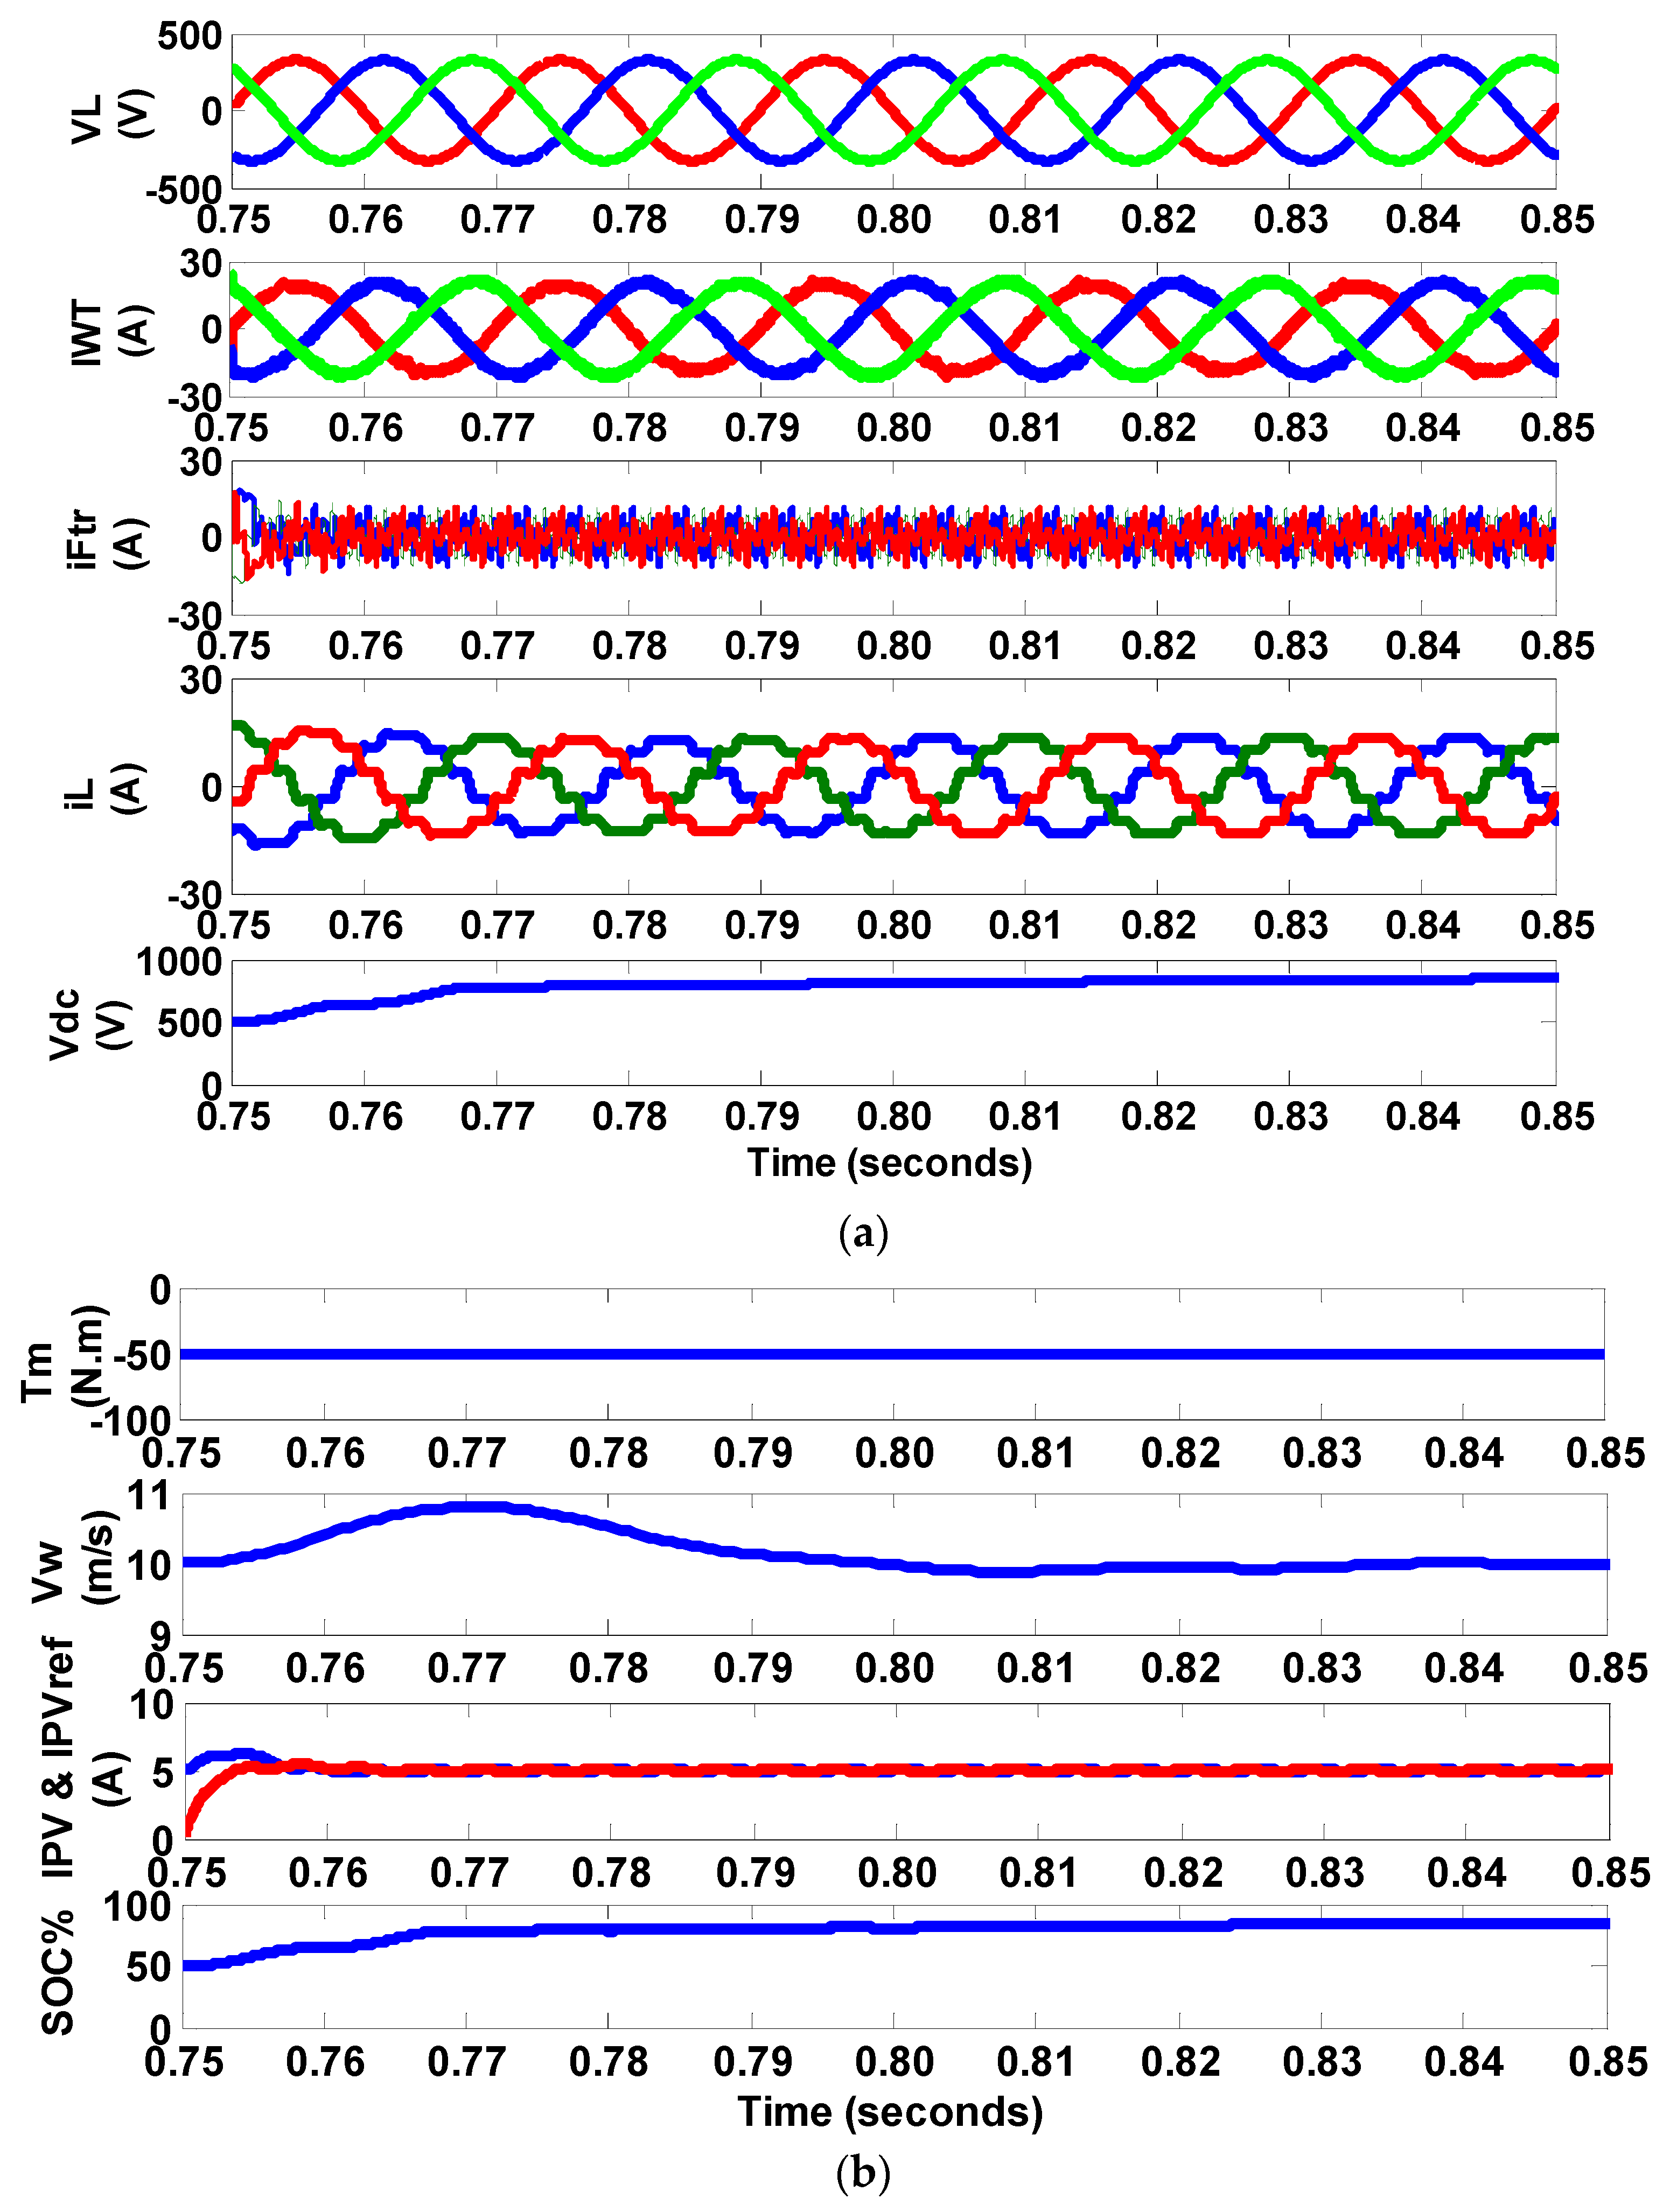
4.1. Performance of Hybrid Filter under Various Conditions
The performance of hybrid filter during variation of solar irradiations and wind speed variation is illustrated in
Figure 7a,b, which shows the characteristics waveforms of load voltage
, current in the PMSG connected to a wind turbine
, load current
, filter current
supplied by the HSAPF, PV actual
and reference currents
, mechanical torque developed by the WT
, wind speed
, DC link voltage
, and SOC percentage, which is less than 100%. From the simulation results, it is noticed that, with the variation of solar irradiations and wind speed, the values of the PV current, torque (mechanical) developed by the generator, and the SOC percentage of the battery are also varying. The system is operated for a time period of 0 to 3 s. The variation of the behavior performance of different system parameters is noticed at 0.8 s during the active participation of HSAPF. Therefore, in this paper, the performance of the proposed system is observed during the period from 0.75 s to 0.85 s. In the beginning, at 0.75 s to 0.77 s, there is a variation of characteristics of system parameters, i.e., the variation of DC link voltage, filter current, PV current, load current, PMSG current, percentage of SOC, and mechanical torque developed. During the period where there is a variation of solar irradiations, and wind energy, the DC bus voltage, and its frequency are maintained constant because of load-leveling supplied by BESS through VSI.
It is observed that the SOC percentage of BESS is rising from 0.75 s and maintain consistency up to 0.8 s, which is due to excess power produced from the renewable energy source (RES). After t = 0.8 s, the SOC percentage of BESS starts slightly decreasing due to the supply shortage of the load demands. The simulation waveforms, shown in
Figure 7, from 0.75 s to t = 0.8 s, prove the dynamic characteristics of the proposed technique. Further, it is also noticed that the PV current monitors closed tracking of its reference and authorized the smooth performance of the proposed LINC technique.
4.2. Performance of Hybrid Filter under Perturbations in Balanced and Unbalanced Non-Linear Loads
In the proposed power system model, the performance of the hybrid filter is investigated under balanced and unbalanced non-linear loads.
Figure 8 and
Figure 9 show the steady-state performance of hybrid filters. In
Figure 8, the steady-state performance is analyzed under balanced non-linear loads. The simulation results in
Figure 8a shows the waveforms of load voltage, PMSG current, filter current, load current, and DC link voltage, and in
Figure 8b shows the waveforms of mechanical torque, wind speed, actual and reference current of PV and SOC percentage. The SOC limits and the charging/ discharging rates should be considered as the energy constraints of the battery, 10%≤ SOC ≤ 90%. In
Figure 8a,b, a balanced non-linear load is connected at the load bus. The voltage and frequency are regulated under such large load perturbations. Simultaneously, the hybrid filter is operated under an unbalanced non-linear load and is tied at a load bus. The voltage and frequency are regulated at their rated values. The simulation results are shown in
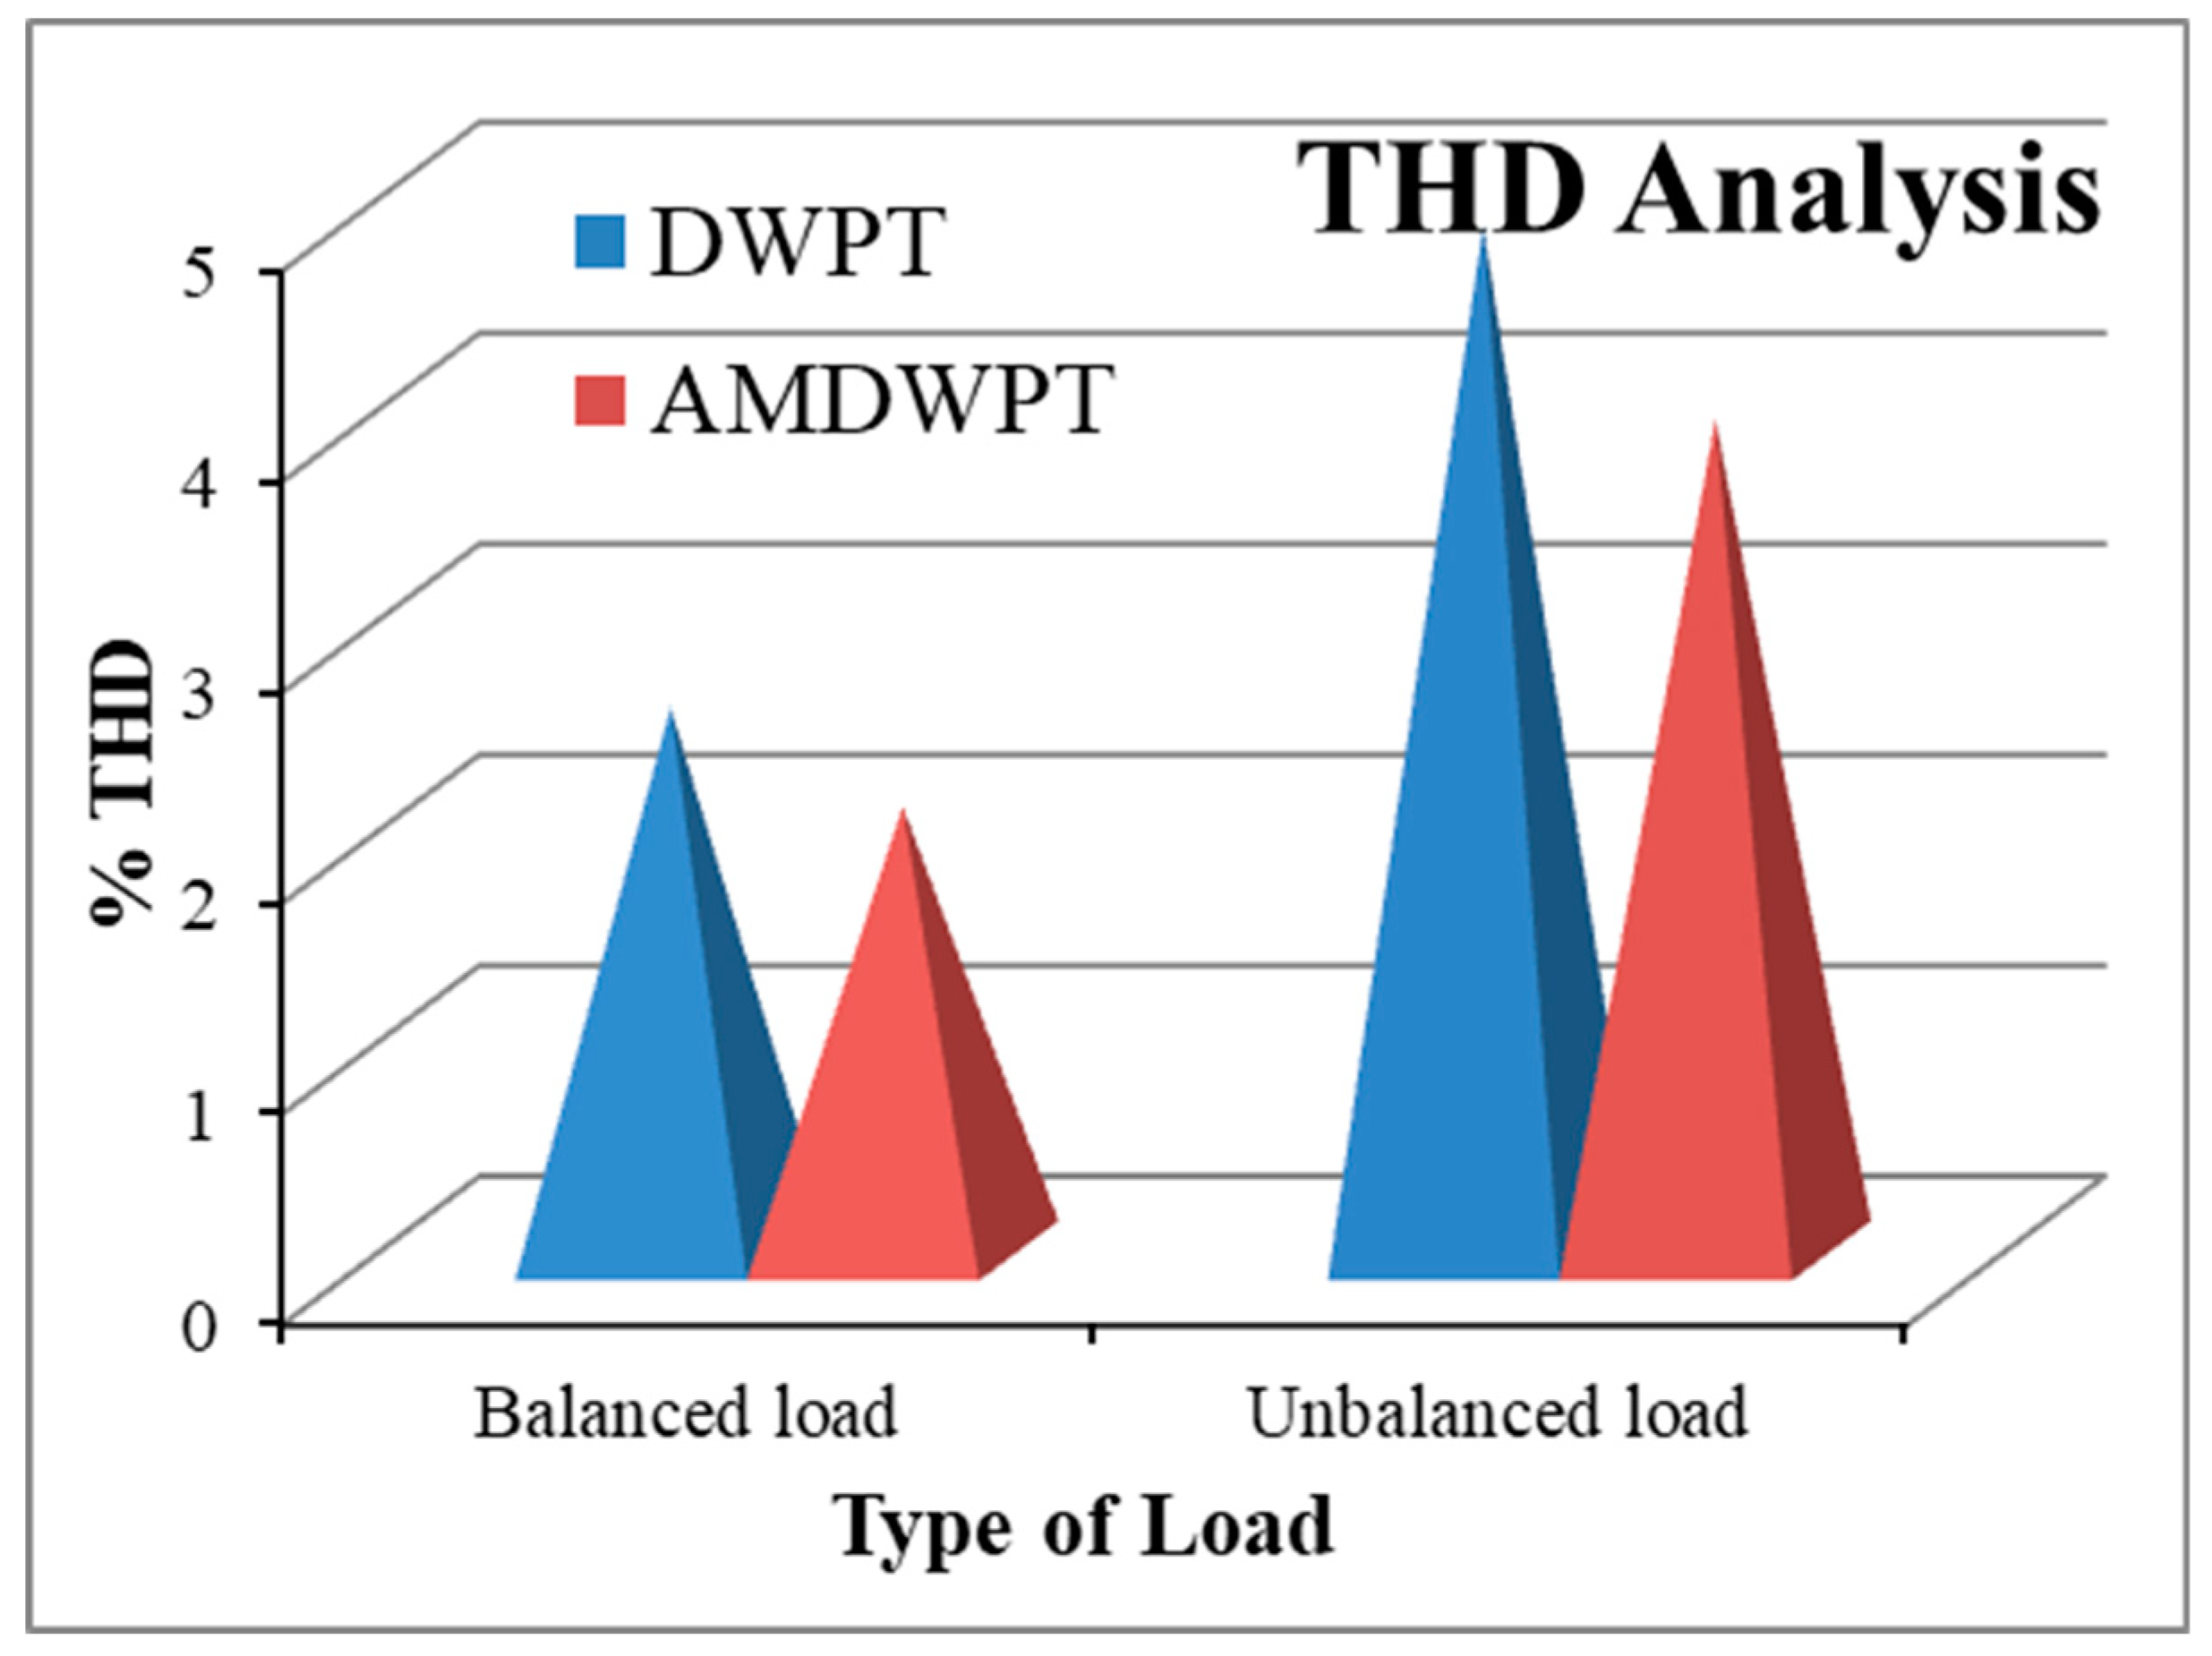
Figure 9a,b. The percentage of THD analysis is provided in
Table 1, and a comparative graphic showing the harmonic distortion analysis of the proposed system with DWPT is shown in
Figure 10. From the comparison chart and table, it is observed that the hybrid filter using the proposed technique provides better performance compared to the conventional one for improvement in PQ.
4.3. Performance with SOC Percentage Equal to 100%.
In this sub-section, the performance is analyzed during SOC percentage equals 100%. The characteristic waveforms of the load voltage, supply current, DC link voltage, SOC percentage of BESS, PV power
, load power
, wind power
, battery power
and power in dump load
is presented in
Figure 11.
It is observed that from t = 0.75 s to t = 0.77 s, the total sum of PV and wind turbine power is greater than load power, but the SOC percentage of BESS is lower than 100%. The BESS is charged with excess produced power, and it is charged fully at 0.77 s. The BESS cannot be overcharged, and, therefore, the dump load consumes surplus generated power until generated power equals load demand. In order to maintain the stability of the system during long periods of surplus power generation and less load demands, which results in top-up the BESS, a dump load is switched on at DC bus. The operation of the dump load is controlled using a solid-state self-commutated switch. The dump load absorbs power until 1 s. These results prove the robustness of the proposed technique.


 ,
, 


