Article

Analysis of Photodiode Monitoring in Laser Cutting

1
IDEKO, Member of Basque Research and Technology Alliance, Pg. Arriaga 2, 20870 Elgoibar, Spain
2
Department of Mechanical Engineering, University of the Basque Country ETSI, ETSII-UPV, c/Alameda de Urquijo s/n, 48013 Bilbao, Spain
*
Author to whom correspondence should be addressed.
Appl. Sci. 2020, 10(18), 6556; https://doi.org/10.3390/app10186556
Submission received: 25 August 2020 / Revised: 16 September 2020 / Accepted: 16 September 2020 / Published: 19 September 2020
(This article belongs to the Section Optics and Lasers)

Abstract

:

Featured Application

Authors are encouraged to provide a concise description of the specific application or a potential application of the work. This section is not mandatory.

Abstract

The paper presents the results of an analysis based on the photodiode monitoring signals obtained during the laser cutting of aluminum and stainless steel plates. The mean level of the monitoring signal was measured and related to the process parameters and the quality achieved. The investigation was conducted in the visible and infrared spectra simultaneously for each experiment and a similar behavior at both spectra was observed, concluding the existence of a relationship between the monitoring signal, the quality of the performed cut, and the characteristics of the cutting scenario. Both visible and infrared monitoring signals were found not to vary as long as the parameter used values ensuring that the cut quality was good. Nevertheless, their mean values tended to increase as the cutting quality became worse. The measured intensity of the visible spectrum signal was associated with the vapor plume formation during the cutting process, whereas the infrared signal was related to the temperatures reached.

1. Introduction

Laser cutting is a well-stablished technology in the market, but as Decker et al. concluded [1] when monitoring the process, some general considerations on the requirements of process diagnostics should be taken into account. Developments of various monitoring systems have been reported, including the direct measurement of the light emitted from the cutting front with an optical fiber [2], the analysis of the acoustic and optical signals for evaluating the cut quality [3], and the development of optical systems that use photodiodes and NIR (Near InfraRed) cameras as sensors for real-time monitoring [4]. In recent years, an increase in the use of photodiodes to monitor the laser cutting process has been observed. This increase in their use is mainly based on the enormous potential of these sensors, together with their easy mounting, and the existing demand to incorporate monitoring systems in industrial applications. Adelmann et al. [5] and Schleier et al. [6] demonstrated the capability of InGaAs photodiodes for detecting penetration losses and the appearance of cutting defects, respectively, whereas Garmendia et al. [7] employed Si photodiodes for monitoring the laser cutting process and evaluating quality. In all cases, these sensors provided a high detection rate and minimal errors. Therefore, photodiodes could be used as indicators of the cut quality in real industrial applications.
The understanding of the cutting process dynamics and the determination of cut quality has been an issue for many years. For instance, Poprawe and König [8] described in their work the main physical phenomena involved in the laser cutting process and the monitoring basis. In the same vein, Bison et al. [9] used an IR camera to monitor the laser cutting process of a steel plate and they proposed an analytical model that considered the phase change, transformation energy, and heat transfer by conduction and radiation. The study of the kerf was also addressed by Genna et al. [10], who employed an Analysis of Variance (ANOVA) to study the combined effect of the process parameters. Russo employed the same procedure for the laser cutting of hot stamping boron steel blanks [11]. Pocorni et al. [12] used high-speed imaging techniques to visualize the flow conditions within the cut region and correlated the developed flow conditions with the corresponding process parameters and the resulting quality.
Through monitoring of the cutting process, it is possible to extract relevant information on the quality of the cut in-situ during the process and different alternatives have been proposed. On the one hand, Jorgensen and Olsen [13] analyzed the cut quality based on the light emitted from the cut kerf coaxially with the laser beam. On the other hand, Sforza and Santacesaria [14] performed a similar analysis based on the infrared radiation coming from the cut region. Chen et al. [15] studied the surface striation formation in the laser cutting process through an optical stereoscopic microscope and determined that there was an optimal range of the laser energy per length unit that ensured an acceptable cut quality. In addition, Yilvas [16] experimented to evaluate the laser cutting quality and studied the generated kerf, postulating the first and second law efficiencies for laser cutting. In addition, acoustic signals have also been employed for laser cutting monitoring. For instance, De Keuster et al. [17] employed both acoustic and optical signals, for ensuring the full penetration of the laser beam. Kek and Grum [18] also employed acoustic signals for monitoring laser cutting, after the application of the appropriate band filter to avoid the contribution of the assist gas flow.
Advances in laser cutting monitoring have allowed the development of adaptive feed-back control systems, improving the laser process robustness and productivity, as well as enhancing the resulting part quality [19]. The main objective of the adaptive control systems is to maximize productivity by means of increasing the cutting velocity, but without losing the quality. Duflou et al. [20] proposed as control variables the monitored NIR images, the laser power, cutting velocity, assist gas pressure, and the duty cycle of the laser beam. Wen et al. [21] included sparking behavior as a variable to monitor. They proved that the optimal cutting speed is ensured when a maximum number of pixels of various radiation brightness ranges were obtained. In addition, Huijuan et al. [22] studied the influence of surface roughness during laser cutting. For this purpose, the authors performed pulse-induced acoustic monitoring experiments and the relation obtained between the surface roughness and the cutting velocity was used as an adaptive control strategy.
Finally, to increase knowledge in the field of laser cutting, investigations have been carried out to correlate the monitoring signals with variations in the cutting parameters, such as laser power, process gas pressure, cutting velocity, or gas flow rate. Long et al. [23] studied the transient regime of the temperatures in the laser cutting process of steel plates and Karanfil and Yalçin [24] presented a real-time monitoring system for cutting different materials. Those studies only display results when bad quality in the cutting process is observed, concluding that the signals are strongly connected to the cut quality. Nevertheless, the authors present no results in which the good quality is maintained.
This study quantitatively investigated the correlation between the cutting process parameters and monitoring signals, evaluating the results in four different cutting scenarios which implied variations in the assist gas, material, and thickness. The present work focuses on contour cutting because the piercing operation was previously studied [25]. The results aim to contribute to future development of monitoring systems that will allow the correct detection of cutting losses in different working scenarios, even in cases of having too low or too high-intensity monitoring signals as a consequence of variations in material thickness, emissivity, or any other implied process variable.

2. Experimental Section

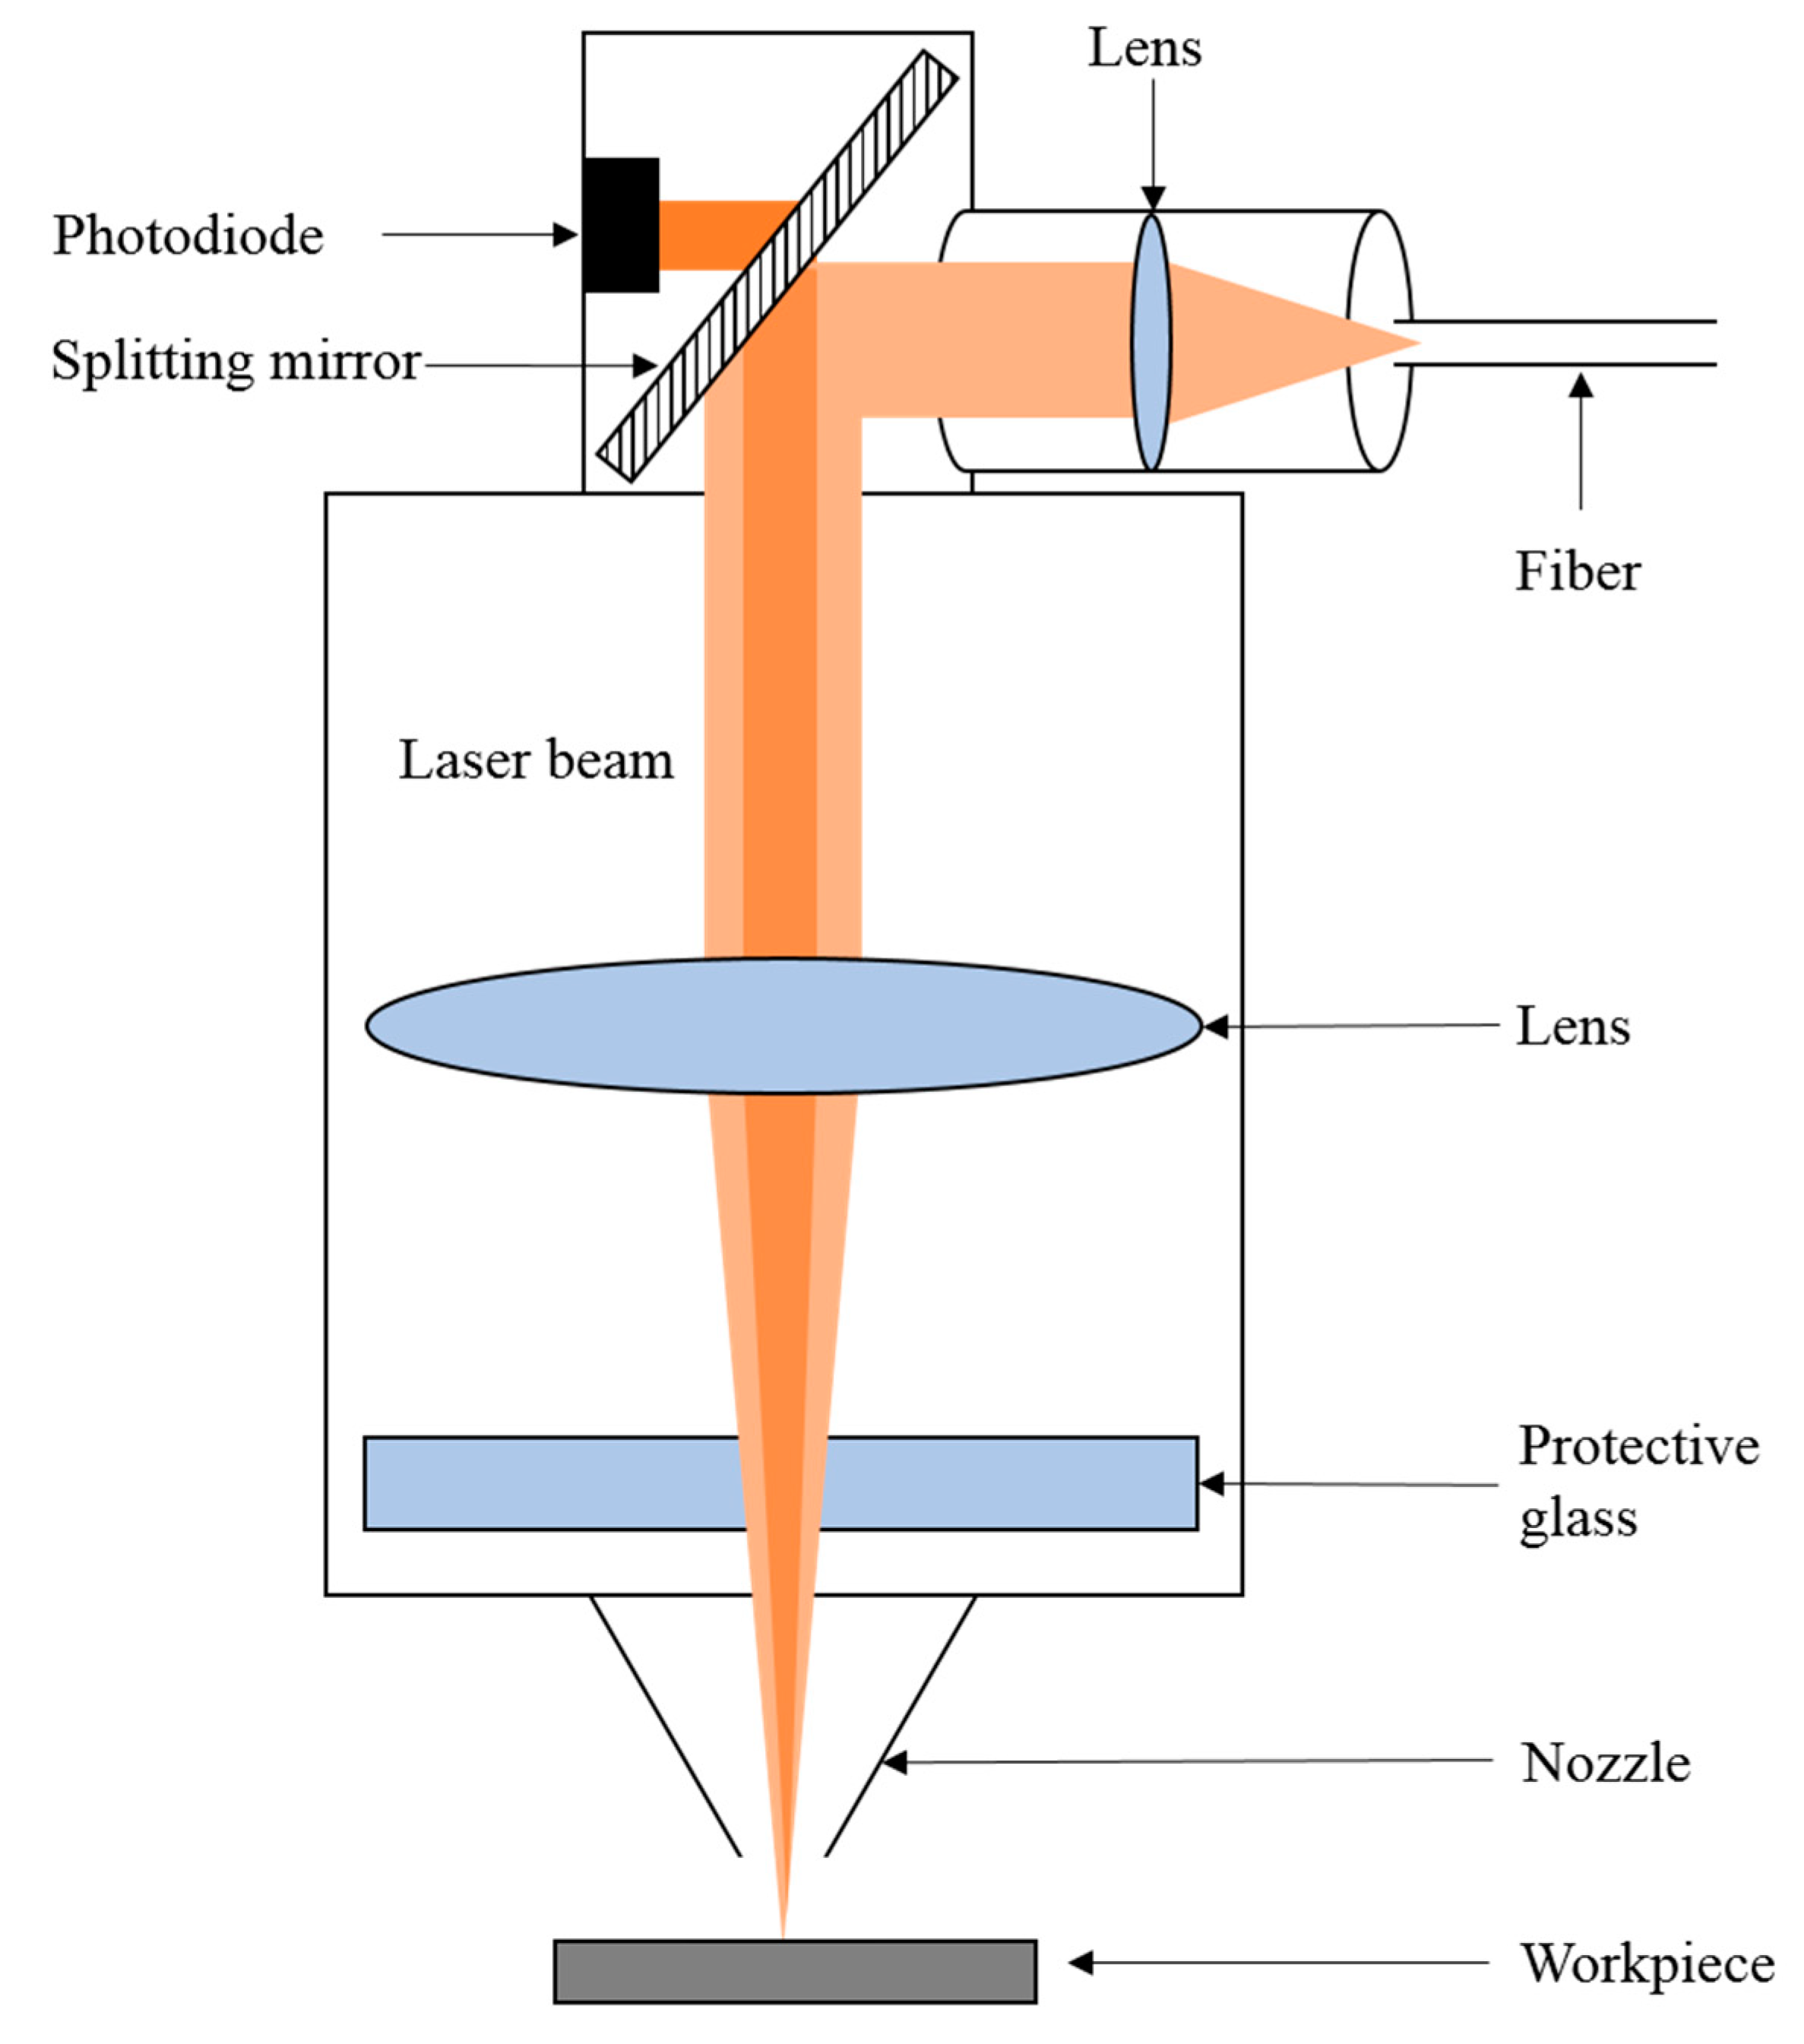
2.1. Laser Cutting System

In the present work, a 5 kW fiber laser from IPG Photonics was used for the experimental tests. The laser beam was carried through a 100 μm transport fiber and the 125 mm focal lens installed in the cutting head, a Precitec ProCutter, concentrated the laser beam in a 125 μm spot at the focal plane. The assist gas flowed coaxially to the laser beam and, as it was considered as a process variable, two different gases were used, nitrogen and oxygen, in both cases with purities over 99.999%. A schema of the cutting head is shown in Figure 1.
A double photodiode sensor system was installed coaxially to the nozzle in the cutting head. The Si-diode registered the signal in the visible spectrum (VIS), 400–1100 nm wavelength, whereas the InGaAs-diode measured in the infrared spectrum (IR), 1000–1800 nm wavelength. Both photodiodes were arranged over a dichroitic mirror detecting the intensity of the radiation produced in the cutting process, enabling a simultaneous measurement in the VIS and IR spectrum. Appropriate wavelength filters were installed in the cutting head to avoid misreading due to the reflected laser radiation. The generated analogical signal was analyzed in a NI cDAQ9191 from National Instruments and data were acquired through an ad hoc acquisition program developed in Labview that permitted the definition of the acquisition frequency and the recording time.

2.2. Design of Experiments

The experimental tests were performed on 5 and 10 mm-thick aluminum (Al) and stainless steel (SS) plates. In a first step, the appropriate parameters for the cutting process were established, which are detailed in Table 1. These parameters were determined to maximize the cut velocity but ensure the resulting cut quality.
The gas pressure, cutting velocity, laser power, and focal position were considered to be process variables and their values were varied in order to analyze their influence on the monitoring signals. For this purpose, a test-cutting pattern consisting of a rectangular piece of 25 × 30 mm2 with rounded corners, radius 4 mm, was chosen. Table 2 shows the ranges of the parameters taken for the cutting tests.
Both IR and VIS signals were monitored simultaneously in each experiment with an acquisition frequency of 200,000 Hz. Four gain levels were available for adapting the output value of the monitored signals. For the VIS spectrum, gains from 1 to 3 were tested until an adequate mean level of the monitoring signals was ensured to observe the process. In the case of the 5 mm-thick aluminum plate, a gain of 4 was also applied in the cases where the monitoring values were too low. For the IR spectrum, gains of 1 and 2 were appropriate to monitor the tests. For the figures of this study the whole range of the monitoring signal (0–10 V) was used as y-scale to make the comparison easier between spectra and the parameter values.

3. Results and Discussion

The study focused on four initial cases, selected to allow the direct comparison between the different scenarios and the process response gathered by the photodiode system. Tests with the ideal process parameters (Table 1) were carried out, independently varying the VIS and IR gain until having enough signal to observe the cutting process in each spectrum. VIS gain 3 worked to correctly monitor all the cases, except 5 mm-thick aluminum, where gain 4 also displayed values that were too low. For the IR spectrum, gain 2 was used during the monitoring, except for stainless steel, where gain 1 was enough. Table 3 displays the monitoring signal mean levels obtained for each case at different gains. Figure 2 allows, as an example, the visual contrasting of the four scenarios for the VIS spectrum with gain 3 and IR spectrum with gain 2. During the gain adjustment tests, the experiment with stainless steel and an IR gain of 2 reached a value of 10 V, the maximum of the system maintaining a good cut quality. In previous studies, this behavior was attributed to a loss of cut. However, in this research it was demonstrated that it was possible to obtain saturated monitoring signals with good quality if the used optical gain was not properly adjusted, provoking false positives in a control system.
To demonstrate the influence of the material in the photodiode-based monitoring signal, aluminum (Al) and stainless steel (SS) were chosen, maintaining the other case characteristics constant, specifically, plates of 10 mm-thick cut with N2 as assist gas and 5 kW of laser power. The photodiode detected the emissions produced in the cutting process, where the registered signal was correlated to the emissivity coefficient (ε) of each material. For the same gain value, stainless steel displayed a higher monitoring signal value than aluminum in both the VIS and IR spectrum, 0.6 V vs. 1.5 V and 0.4 V vs. 10 V, respectively. The results obtained in the experiments are in accordance with the literature [26], which indicated that the ε is higher for stainless steel, and thus, the corresponding monitoring signal.
To analyze the influence of the thickness in the registered signal, two aluminum plates of 5 and 10 mm thickness were cut with N2 at 5 kW, with the velocity, gas pressure, and focal position specified in Table 1. Comparing VIS monitoring signals, the 10 mm thick plate displayed a higher value than the thinner one (0.6 V vs. 0.15 V), explained as a consequence of more vapor plume formation [25] during the cutting process of the thicker plate, and thus, an increase in VIS signal. IR monitoring signals showed a contrary effect (0.7 V vs. 0.4 V, for 5 and 10 mm). In this case, the measured infrared signal was related to temperature [25], which decreased in the thicker plate as a consequence of heat conduction phenomena, according to the literature [27].
Comparing the cases where different assist gases were used, the presence of oxygen caused an exothermic reaction with the metal producing more heat, and thus, a higher IR signal (0.4 V vs. 1.3 V). Furthermore, the resulting oxidation during the cutting process damaged the cut edge, which the literature associates with an increase in the emissivity coefficient. In the VIS signal, on the contrary, the nitrogen cutting process served as a shielding gas, stopping the burning process and allowing the laser to vaporize the material, increasing the plume formation (0.6 V vs. 0.4 V).
During the experiments, to determine the direct relationship between the parameter values and the monitoring signal response, relevant cutting process parameters such as focal position, laser power, gas pressure, and velocity were modified, testing different values that maintained a good cut quality or that displayed different grades of damage over the lateral cut wall piece. Specifically, three types of defects were detected: (i) regular quality defects in the lateral faces of the cutting pieces associated to regular peaks in the monitored signal, (ii) increase in the monitored mean level due to continuous bad lateral quality, and (iii) signal saturation as a consequence of a cutting loss. Furthermore, different parameters of the machine were registered (speed, real positions, accelerations, temperatures, etc.) to relate them to the cutting process parameters and the quality of the results. Thus, it was possible to determine the exact position of the defects detected by the photodiode in the physical pieces. The investigation was conducted testing the VIS and IR spectrum, with the aim of checking the capability of the photodiode system to detect failures in different scenarios. Figure 3, Figure 4, Figure 5 and Figure 6 show the results obtained in the tests carried out for each case, using the optimum gain for process observation. As indicated in Figure 3 for stainless steel, no variations in monitoring signals were found, while the good quality was conserved, confirming the independence between the process parameters and the registered signal values for the studied cases. As the same behavior was observed in both spectra, Figure 3, Figure 4, Figure 5 and Figure 6 only show results in the IR spectrum, but generally, the VIS signal presented a lower mean value when compared to the IR spectrum, as is displayed in Table 3. Some loss of cuts was also detected during the tests, saturating the VIS and IR monitoring signal, which confirmed the possibility of using both signals in control systems for complete cutting loss detection.
Figure 4 displays the tests corresponding to the 10 mm-thick aluminum plate and nitrogen as the assist gas. The focal position of −2.8 mm generated bad lateral quality in the beginning of the test resulting in an increase in the monitoring signal, decreasing later as good quality was achieved. The test of −3.2 mm of focal position and the test with 4700 W show a general increase in the mean level of the monitored signal as a consequence of bad lateral quality during all the cut. For a velocity of 2600 mm/min, the results exhibited an initial increase in the signal due to bad quality, saturating the signal as a cut loss was obtained. Figure 5 shows the tests corresponding to the 10 mm-thick aluminum plate and oxygen as the assist gas. The peaks correspond to regular defects in the tests with a focal position of −2 mm (Figure 5a) or 12 bars (Figure 5c), and an increase in the mean level for bad lateral quality for −4 mm, lower laser powers and gas pressures, or increasing cutting velocity.
However, differences were encountered between the monitoring of both spectra, because not all the defects were correctly detected in the VIS spectrum by the monitoring system. For the 5 mm-thick aluminum plate, generated defects when varying focal, velocity and gas pressure tests were not detected by the photodiode in VIS spectrum even at the maximum gain (gain 4, 0.15 V), whereas those same defects provoked an increase in the signal in the IR spectrum (Figure 6). Isolated defects were displayed as regular peaks in the IR monitoring signal. In contrast, a general deterioration of the lateral cut quality was observed with a general increase in the IR mean level. The failure in defect detection for VIS spectrum was attributed to the low signal obtained, which was due to the combination of the intrinsic characteristics of the specific case (emissivity of the material, thickness, assist gas). In the other studied cases, all the defects were detected in both spectra. Thus, in the present study, it was found that it was more convenient to use the IR spectrum for monitoring and ensuring the laser cut quality. In addition, a system with a higher amplification of the VIS monitoring signal would allow better detection of defects in cases of thinner plates and/or materials with low emissivity.

4. Conclusions and Future Work

In the present work, the influence of the process parameters in the laser cutting process was analyzed. For this purpose, four scenarios with variations in the emissivity of the material, thickness and assist gas were considered and each experiment was monitored simultaneously in the VIS and IR spectrum. The main conclusions reached after the analysis of the obtained results were:
  • The measured intensity of the VIS signal was associated with the vapor plume formation during the cutting process, whereas the IR signal was related to the temperatures reached.
  • For the VIS and the IR monitoring signals, it was found that they were independent of the process parameters as long as the cutting quality was good. In contrast, the mean level increased as the cutting quality became worse. Therefore, their values can be useful for monitoring defective cuts online.
  • This investigation revealed failures in defect detection for the thinner aluminum plate in the VIS spectrum, attributed to the low signal value generated by the characteristics of the case. In contrast, stainless steel displayed signal saturation with good cut quality, usually typical of cut losses.
  • Gain system adjustment was revealed as the key factor for success in the detection of cutting defects. Too low a gain prevent detection of defects, whereas gains that were too high saturated the monitoring signal, generating false results.
To sum up, this paper shows the potential of photodiode monitoring for industrial applications as an easy solution to work with adaptive control systems. However, it evidences the lack of the actual commercial systems. The presented results are considered to be the key to possible development of an innovative monitoring system that will address the problems of the current systems. At present our research group is working on a new monitoring system that includes monitoring with photodiodes, an infrared camera, and a visible camera. The three systems will be installed coaxially to the laser cutting head and the information will be complementary, allowing the monitoring of all the laser cutting process scenarios that a service metal cutting center deals with. This development will constitute a scientific milestone for cutting monitoring systems, being the first coaxial system to integrate the three techniques in an industrial environment.

Author Contributions

Conceptualization, S.M.G. and J.F.; methodology, S.M.G.; investigation, J.R. and S.M.G.; validation, J.R. and S.M.G.; formal analysis, S.M.G., J.I.A., and J.F.; resources, J.F.; writing—original draft preparation, S.M.G.; writing—review and editing, S.M.G., J.I.A., and J.F. All authors have read and agreed to the published version of the manuscript.

Funding

This research was supported by the Basque Government in the Elkartek project “Digicut: Estudio fundamental de procesos de corte y definición de las bases para su digitalización” (KK-2019/00071).

Conflicts of Interest

The authors declare no conflict of interest.

References

  1. Decker, I.; Heyn, H.; Martinen, D.; Wohlfahrt, H. Process monitoring in laser beam cutting on its way to industrial application. Proc. SPIE 1997, 3097, 29–37. [Google Scholar] [CrossRef]
  2. Chen, S.L. In-process monitoring of the cutting front of CO2 laser cutting with off-axis optical fibre. Int. J. Adv. Manuf. Technol. 1997, 13, 685–691. [Google Scholar] [CrossRef]
  3. Sukhov, Y.T.; Matiushin, I.V. Development of information-measuring channels of the monitoring system of quality cut for technological process laser cutting of materials. Proc. SPIE 2001, 4157, 88–92. [Google Scholar] [CrossRef]
  4. Shirvani, B.; Clarke, R.; Duflou, J.; Merklein, M.; Micari, F.; Griffiths, J. Monitoring of CO2 laser cutting of thick Steel plates by means of a NIR camera based system. Key Eng. Mater. 2009, 410–411, 207–216. [Google Scholar] [CrossRef]
  5. Adelmann, B.; Schleier, M.; Neumeier, B.; Hellmann, R. Photodiode-based cutting interruption sensor for near-infrared lasers. Appl. Opt. 2016, 55, 1772–1778. [Google Scholar] [CrossRef]
  6. Schleier, M.; Adelmann, B.; Neumeier, B.; Hellmann, R. Burr formation detector for fiber laser cutting based on a photodiode sensor system. Opt. Laser Technol. 2017, 96, 13–17. [Google Scholar] [CrossRef]
  7. Garmendia, I.; Ocaña, R.; Soriano, C.; Lambarri, J. Optical monitoring of fiber laser based cutting processes for in-situ quality assurance. Proc. Lim 2017, 1–8. [Google Scholar]
  8. Popware, R.; König, W. Modeling, monitoring and control in high quality laser cutting. CIRP Ann. 2001, 50, 137–140. [Google Scholar] [CrossRef]
  9. Bison, P.; Ferrarini, G.; Zanon, G. Thermographic monitoring of laser cutting machine. Proceedings 2019, 27, 28–31. [Google Scholar] [CrossRef] [Green Version]
  10. Genna, S.; Menna, E.; Rubino, G.; Tagliaferri, V. Experimental Investigation of Industrial Laser Cutting: The Effect of the Material Selection and the Process Parameters on the Kerf Quality. Appl. Sci. 2020, 10, 4956. [Google Scholar] [CrossRef]
  11. Russo Spena, P. CO2 Laser Cutting of Hot Stamping Boron Steel Sheets. Metals 2017, 7, 456. [Google Scholar] [CrossRef] [Green Version]
  12. Pocorni, J.; Powell, J.; Deichsel, E.; Frostevarg, J.; Kaplan, A.F. Fibre laser cutting stainless steel: Fluid dynamics and cut front morphology. Opt. Laser Technol. 2017, 87, 87–93. [Google Scholar] [CrossRef]
  13. Jorgensen, H.; Olsen, F.O. Process monitoring during CO2 laser cutting. Proc. SPIE 1991, 1412, 198–208. [Google Scholar] [CrossRef]
  14. Sforza, P.; Santacesaria, V. CO2 laser cutting: Analytical dependence of the roughness of the cut edge on the experimental parameters and process monitoring. Proc. SPIE 1994, 2207, 836–847. [Google Scholar] [CrossRef]
  15. Chen, C.; Gao, M.; Jiang, M.; Zeng, X. Surface morphological features of fiber laser cutting of AA2219 aluminum alloy. Int. J. Adv. Manuf. Technol. 2016, 86, 1219–1226. [Google Scholar] [CrossRef]
  16. Yilbas, B.S. Laser cutting quality assessment and thermal efficiency analysis. J. Mat. 2004, 155–156, 2106–2115. [Google Scholar] [CrossRef]
  17. De Keuster, J.; Duflou, J.R.; Kruth, J.-P. Acoustic and optical monitoring of high-power CO2 laser cutting. Key Eng. Mat. 2007, 344, 161–168. [Google Scholar] [CrossRef]
  18. Kek, T.; Grum, J. Monitoring laser cut quality using acoustic emission. Int. J. Mach. 2009, 49, 8–12. [Google Scholar] [CrossRef]
  19. Kruth, J.-P.; Duflou, J.; Mercelis, P.; van Vaerenbergh, J.; Craeghs, T.; de Keuster, J. On-line monitoring and process control in selective laser melting and laser cutting. Proc. LANE 2007, 1, 23–37. [Google Scholar]
  20. Duflou, J.; Fallahi Sichani, E.; de Keuster, J.; Kruth, J.-P. Development of a real time monitoring and adaptive control system for laser flame cutting. Proc. ICALEO 2009, 527–533. [Google Scholar] [CrossRef] [Green Version]
  21. Wen, P.; Zhang, Y.; Chen, W. Quality detection and control during laser cutting progress with coaxial visual monitoring. J. Laser Appl. 2012, 24, 032006. [Google Scholar] [CrossRef]
  22. Huijuan, H.; Guanghe, C.; Jiyong, X. The study of quality monitoring and control for laser cutting based on pulse-induced acoustic sound. Appl. Mech. Mater. 2012, 182–183, 422–426. [Google Scholar] [CrossRef]
  23. Long, N.P.; Matsunaga, Y.; Hanari, T.; Yamada, T. Experimental investigation of transient temperatura characteristic in high power fiber laser cutting of a thick steel plate. Opt. Laser Technol. 2016, 84, 134–143. [Google Scholar] [CrossRef]
  24. Karanfil, U.; Yalçin, U. Real-time monitoring of high-power fibre-laser cutting for different types of materials. Ukr. J. Phys. Opt. 2019, 20, 60–72. [Google Scholar] [CrossRef] [Green Version]
  25. Garcia, S.M.; Ramos, J.; Lamikiz, A.; Figueras, J. Influence of process parameters in laser piercing. Appl. Sci. 2019, 9, 3231. [Google Scholar] [CrossRef] [Green Version]
  26. Kreith, F.; Chhabra, R.P. CRC Handbook of Thermal Engineering, 2nd ed.; CRC Press: Boca Raton, FL, USA, 2017. [Google Scholar]
  27. Tritt, T.M. Thermal conductivity. In Theory, Properties and Applications (Physics of Solid and Liquids); Plenum Publishers: New York, NY, USA, 2004. [Google Scholar]
Figure 1. Schema of the experiment for the employed cutting head.
Applsci 10 06556 g001
Figure 2. Monitoring signal mean levels for ideal laser cutting process parameters: (a) Visible spectrum and gain 3; (b) Infrared spectrum and gain 2.
Applsci 10 06556 g002
Figure 3. IR monitoring mean levels (gain 1) obtained during the laser cutting of stainless steel of 10 mm with nitrogen, comparing the ideal cutting conditions (black line) with variations in: (a) focal position; (b) laser power; (c) gas pressure; and (d) velocity. (e) Optical image of a cut sample with the ideal cutting parameters.
Applsci 10 06556 g003
Figure 4. IR monitoring mean levels (gain 2) obtained during the laser cutting of aluminum of 10 mm with nitrogen, comparing the ideal cutting conditions (black line) with variations in: (a) focal position; (b) laser power; (c) gas pressure; and (d) velocity. (e) Optical images of cut samples with the ideal cutting parameters (top), with a focal position of −2.8 mm (center) and with a focal position of −3.2 mm (bottom).
Applsci 10 06556 g004
Figure 5. IR monitoring mean levels (gain 2) obtained during the laser cutting of aluminum of 10 mm with oxygen, comparing the ideal cutting conditions (black line) with variations in: (a) focal position; (b) laser power; (c) gas pressure; and (d) velocity. (e) Optical images of cut samples with the ideal cutting parameters (top), with a focal position of −2 mm (center) and with a focal position of −4 mm (bottom).
Applsci 10 06556 g005
Figure 6. VIS (gain 4) and IR (gain 2) monitoring mean levels obtained during the laser cutting of aluminum of 5 mm with nitrogen, with: (a) focal position of −0.6 mm; (b) velocity of 7500 mm/min.
Applsci 10 06556 g006
Table 1. Cutting parameters for 10 mm-thick stainless steel (SS) plate, and 5 and 10 mm-thick aluminum (Al) plates.
Cutting ParametersAlSS
Thickness [mm]5101010
Gas typeN2N2O2N2
Power [kW]5555
Velocity [mm/min]700024006801200
Gas pressure [bar]151510.512
Focal [mm]−1.1−2.4−3−7.2
Standoff [mm]0.60.60.6₋0.6
Frequency [Hz]5000500050005000
Duty minimum [%]100100100100
Duty maximum [%]100100100100
Nozzle diameter [mm]2.532.53
Table 2. Ranges of laser cutting parameters tested during the experiments.
Cutting parametersAlSS
Thickness [mm]5101010
Gas typeN2N2O2N2
Power [kW]4–54.3–54.2–54–5
Velocity [mm/min]4500–75002000–2600500–900600–1400
Gas pressure [bar]9–1713–196–128–16
Focal [mm]−0.6–−1.6−2–−3.2−2–−4−0.6–−7.8
Table 3. Signal monitoring values for different visible spectrum (VIS) and IR gains at ideal process parameters (Table 1). For 5 mm-thick aluminum, gain 4 was also tested with the same results as gain 3.
Monitoring Signal Mean Levels (V)
CaseVIS GainIR Gain
12312
Al, N2, 5 mm, 5 kW0.10.10.150.10.7
Al, N2, 10 mm, 5 kW0.10.10.60.10.4
Al, O2, 10 mm, 5 kW0.10.10.40.251.3
SS, N2, 10 mm, 5 kW0.10.251.5310

