Article

Health and Structural Integrity of Monitoring Systems: The Case Study of Pressurized Pipelines

Faculty of Mechanical Engineering, Institute of Applied Mechanics and Mechatronics, Slovak University of Technology, Námestie Slobody 17, 81231 Bratislava, Slovakia
*
Author to whom correspondence should be addressed.
Appl. Sci. 2020, 10(17), 6023; https://doi.org/10.3390/app10176023
Submission received: 28 July 2020 / Revised: 22 August 2020 / Accepted: 28 August 2020 / Published: 31 August 2020
(This article belongs to the Special Issue Novel Approaches for Structural Health Monitoring)

Abstract

:
In the operation of some structures, particularly in energy or chemical industry where pressurized pipeline systems are employed, certain unexpected critical situations may occur, which must be definitely avoided. Otherwise, such situations would result in undesirable damage to the environment or even the endangerment of human life. For example, the occurrence of such nonstandard states can significantly affect the safety of high-pressure pipeline systems. The following paper discusses basic physical prerequisites for assembling the systems that can sense loading states and monitor the operational safety conditions of pressure piping systems in the long-run. The appropriate monitoring system hardware with cost-effective data management was designed in order to enable the real-time monitoring of operational safety parameters. Furthermore, the paper presents the results obtained from the measurements of existing real-time safety monitoring systems for selected pipeline systems.

1. Introduction

Obviously, the operational loading for which a real structure is designed can differ from the real loading in many cases. Based on statistical records, the majority of damages and collapses of structures in operation are caused merely by a change in operating conditions, except for those caused by a human factor [1,2]. In the case of pressurized pipelines (e.g., gas transit systems, oil pipelines, or other liquid pipeline systems under pressure), the piping systems may be subjected to a quasi-static loading or of a predominantly variable loading due to a varying pressure of the operating medium. An expected design loading may change only in some locations, which are really difficult to predict in the design stage. In the case of compressor stations, for instance, or the geometrical-fluid ratios in the closed side branches, the setting of the compressor’s operating point can cause dynamic phenomena, i.e., pipeline vibrations, as pointed out in [3,4,5,6,7,8,9].
Other changes occurring in the operation of piping systems may occur in the subsoil of the pipeline. For example, the subsoil slide on a slope or subsoil slip after a prolonged rainfall can change the design of the pipeline stress. Most accidents of the pipeline systems may arise as a result of the following simultaneous interactions (“system synergy”) of unexpected changes during the operations, e.g.,
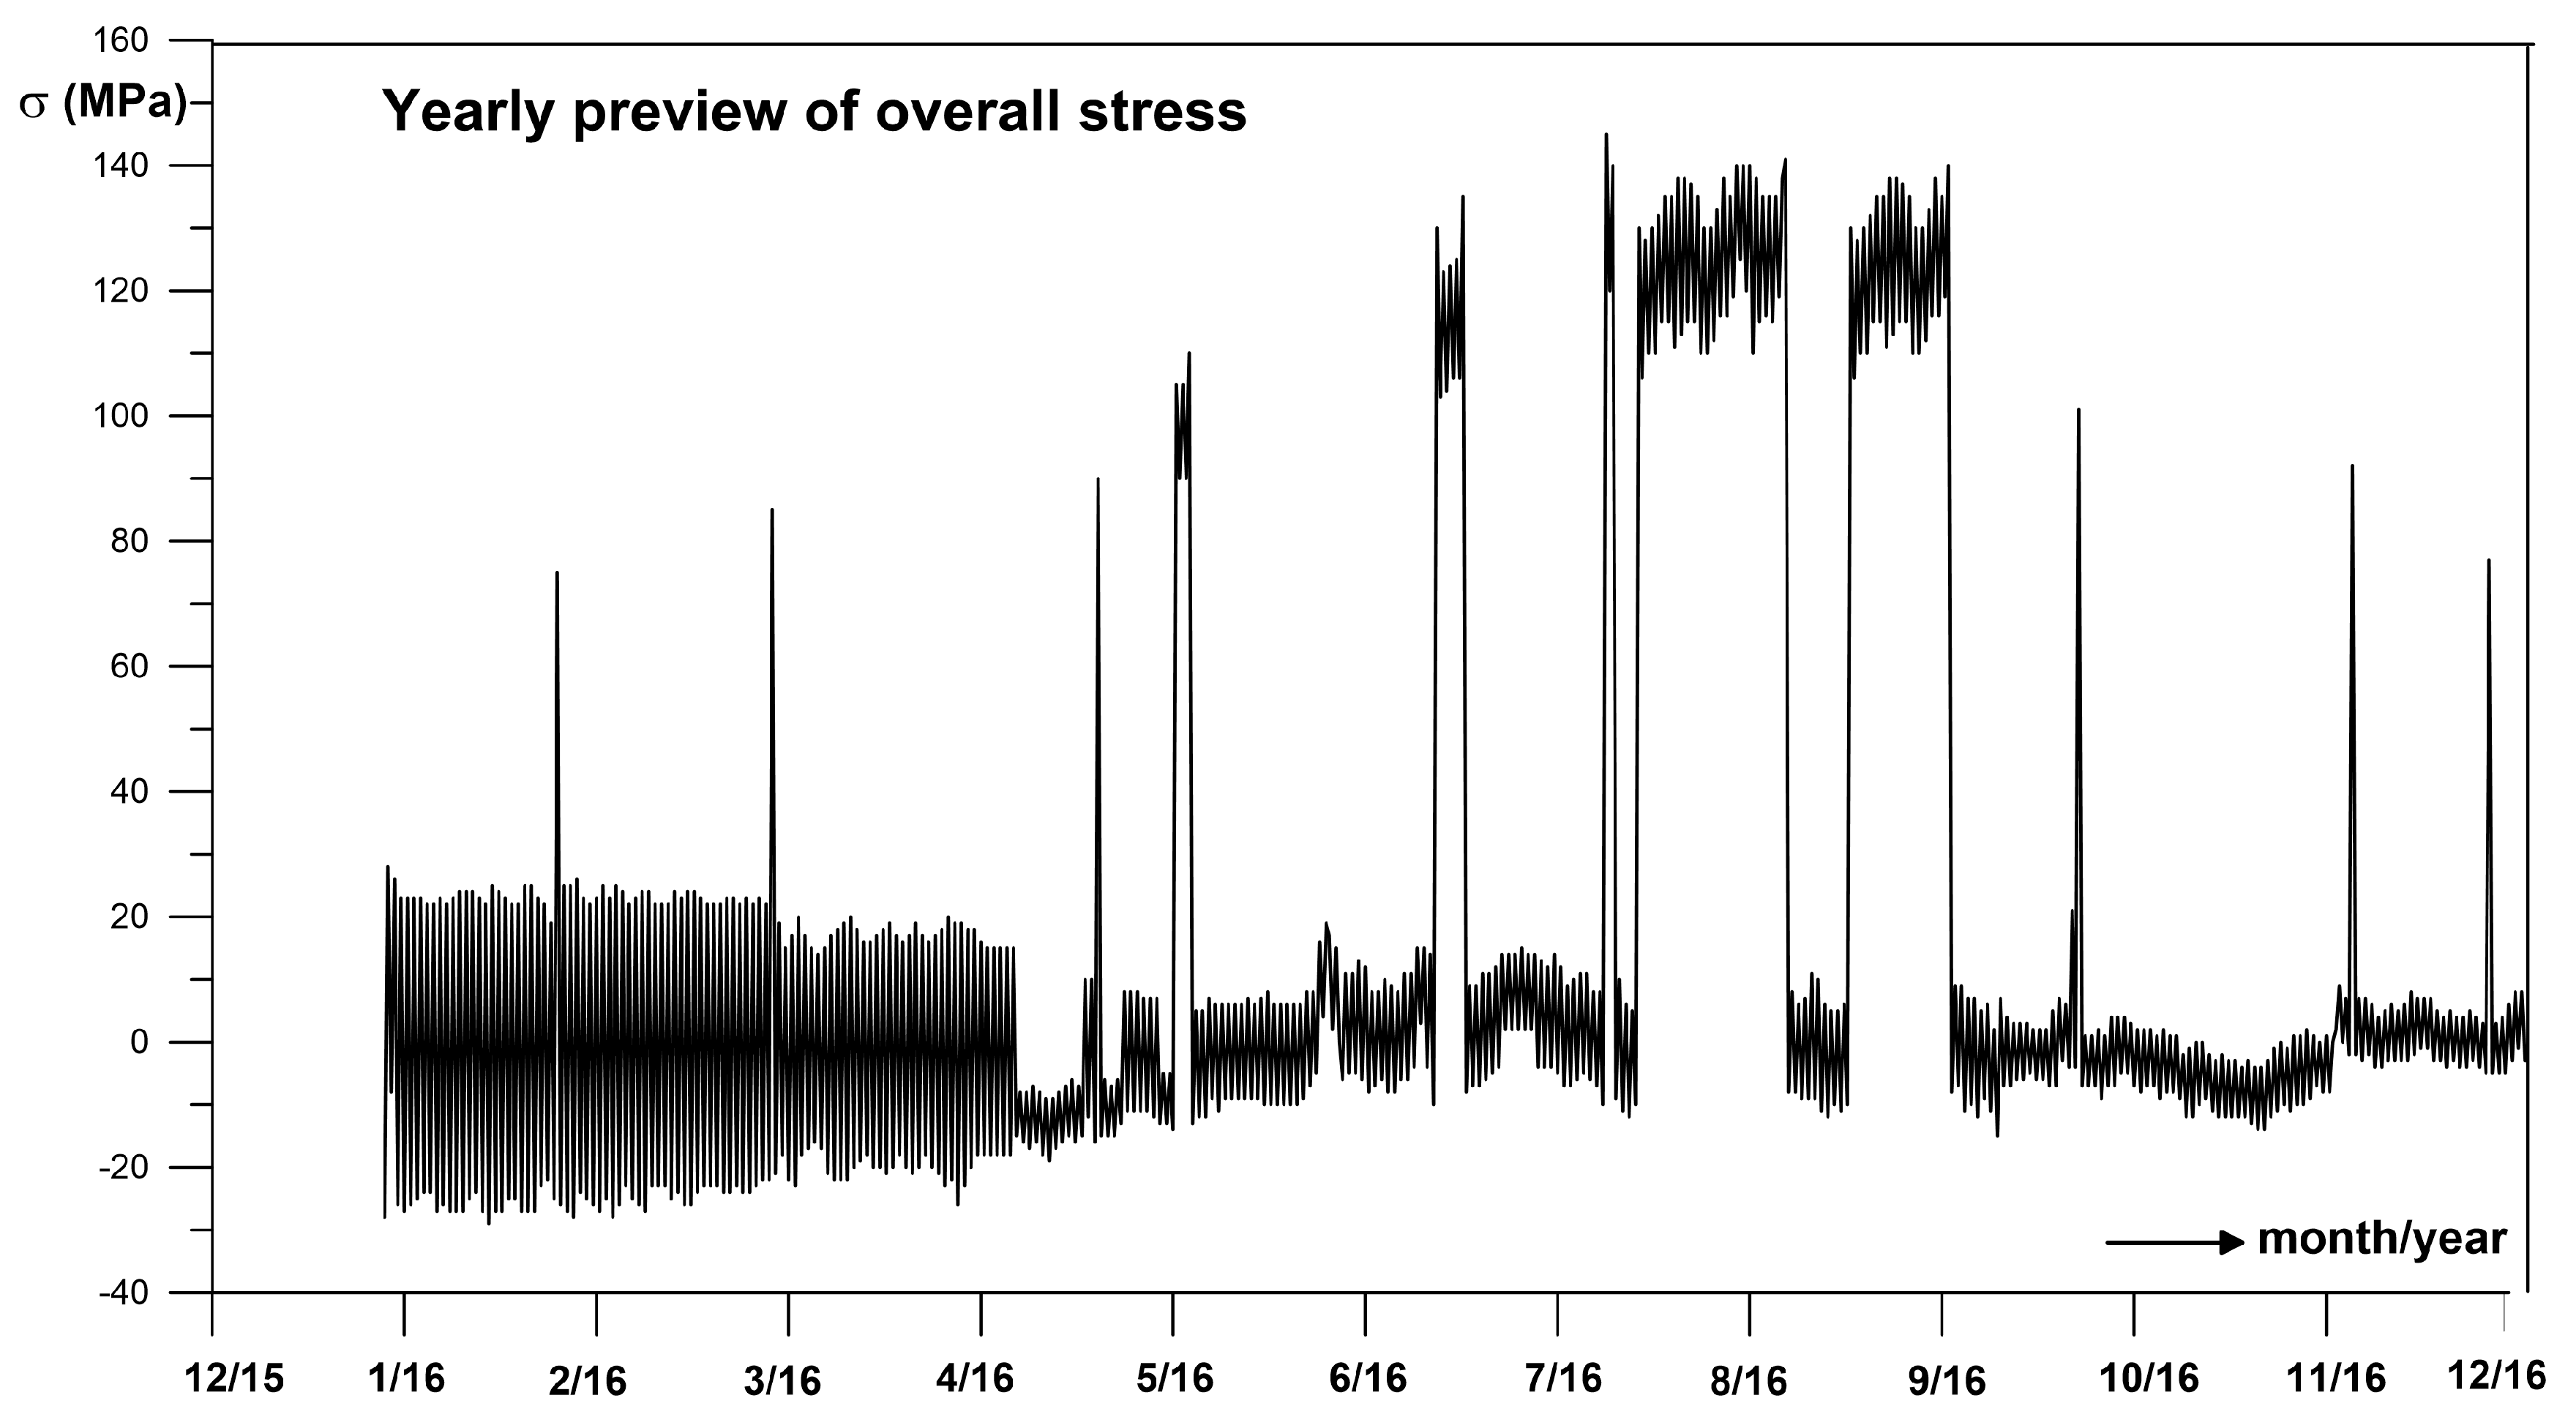
  • internal pressure with induced vibrations,
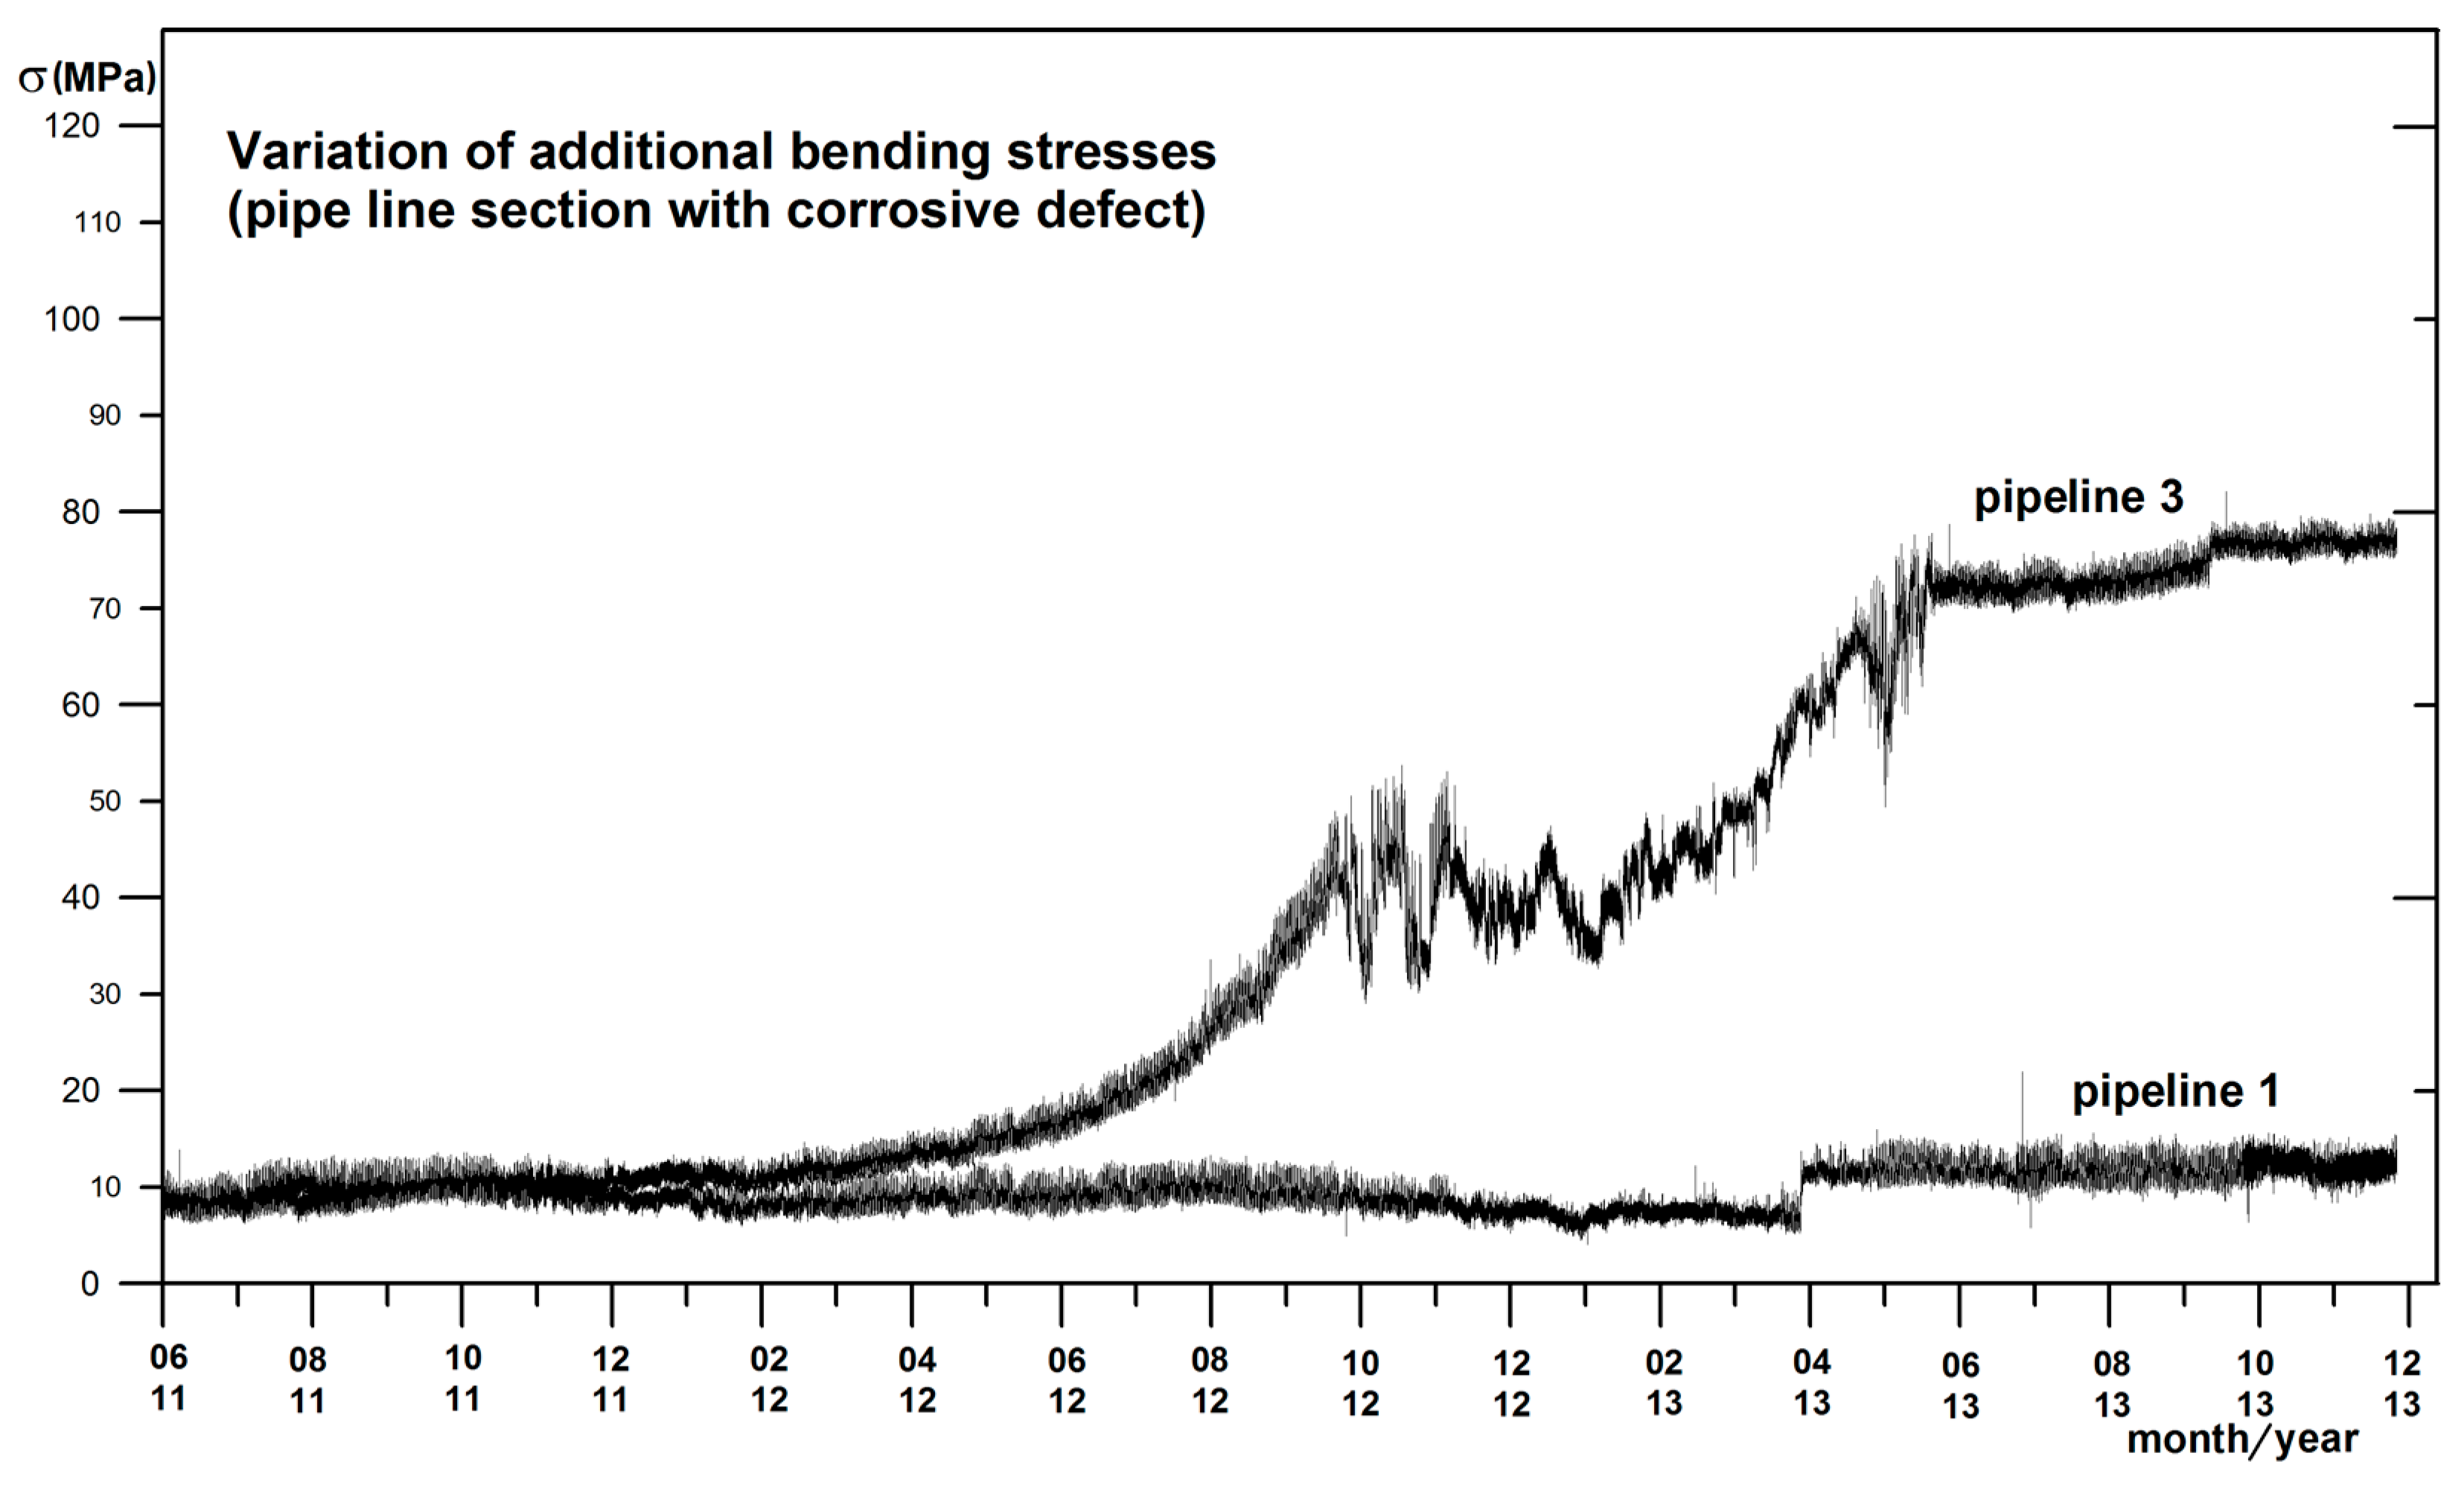
  • additional bending stress from the subsoil drop loaded with an internal pressure, and
  • the pipeline wall thickness decreases caused by corrosion at the point of additional bending stress with an internal pressure, etc.
The occurrence of such nonstandard and unplanned situations in a real operation is generally difficult to predict. The only possible solution for how to record these states is to develop and implement monitoring systems that can monitor not only the operating parameters, such as the pressure and temperature of transported media, but, also, the construction parameters, enabling to determine the reliability and operational safety [10]. Based on ten years of our experience with the development of several safety monitoring systems of pipeline operations in the field of gas transportation, two systems have turned out to be beneficial: the monitoring of dangerous vibrations and the monitoring of pipes with corrosion defects and additional bending.
Hence, the objective of this paper is to further analyze three important problems that arise out of the previously stated; that is, to determine:
  • which quantities should be measured continuously by sensors,
  • what are their permissible limit values for a safe operation of the pipeline systems, and
  • how to predict the corrosion process and its synergy with additional bending loading.

2. Methodology and Results

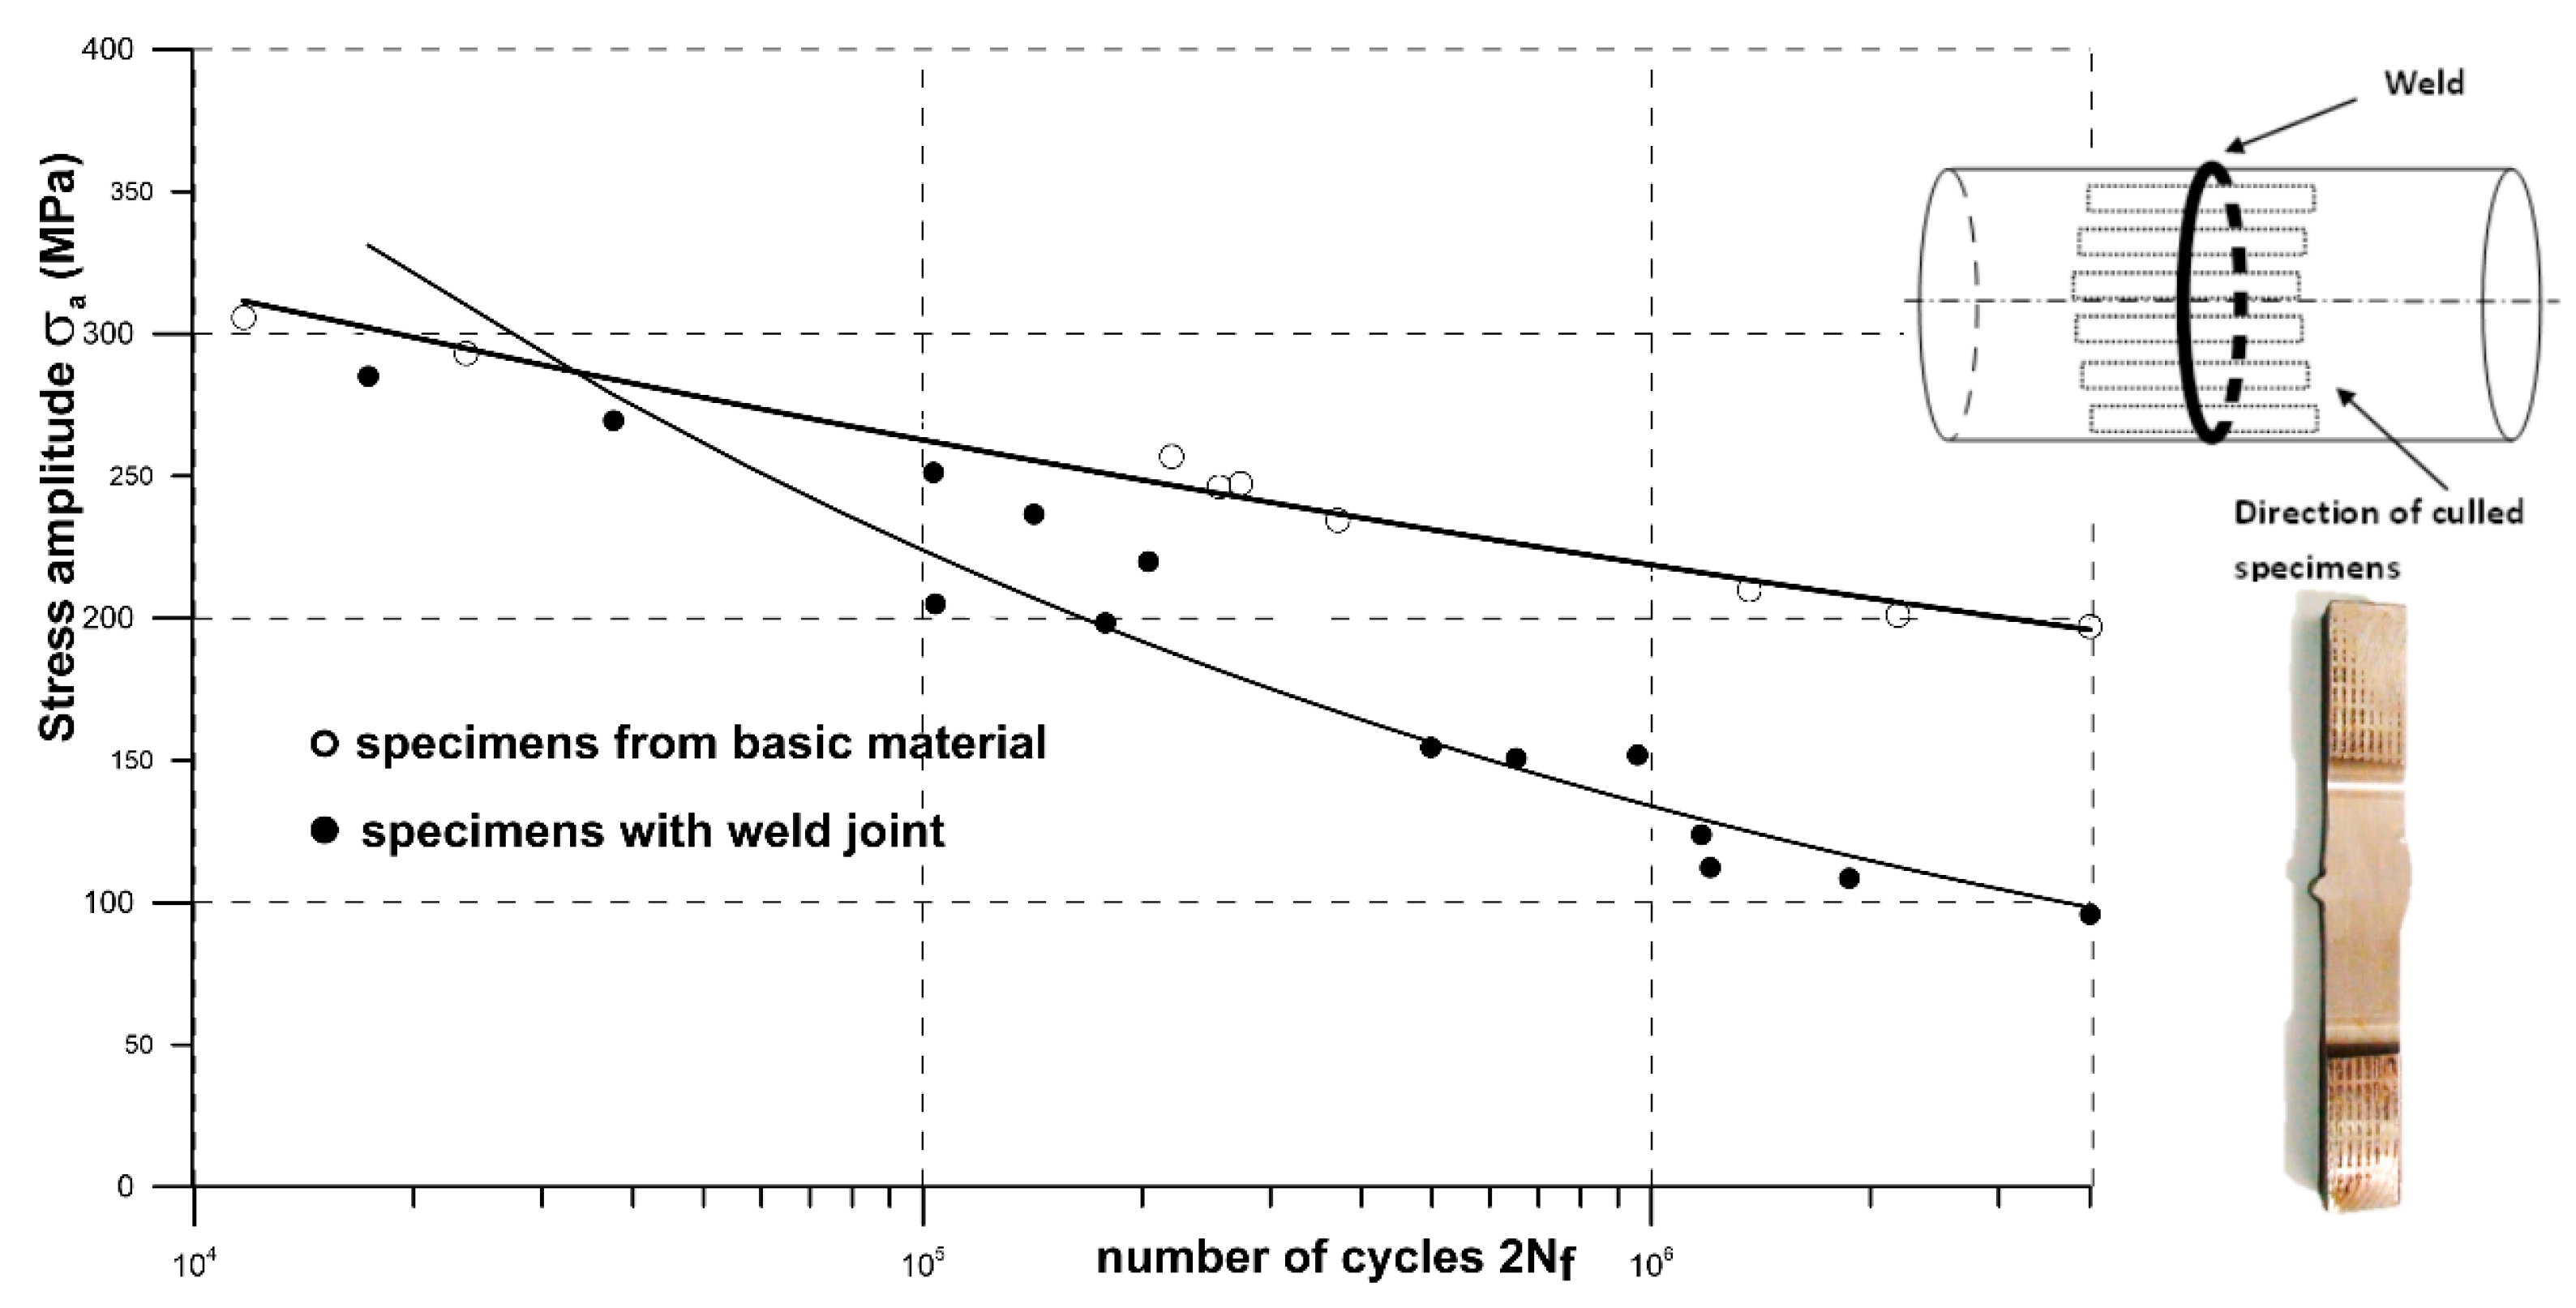
2.1. Vibrations Induced in the Side Branches

The dangerous self-excited gas pressure oscillations may occur at the T-branch of the gas pipe system due to the following cases:
  • the gas flow rate is sufficiently high,
  • there are necessary fluid and geometric conditions for the generation of excited pressure oscillations, and
  • there was a resonant match between the excitation frequency and the natural frequency of the closed tap volume (existence of Helmholtz standing waves in the branch—the so-called “whistle effect”).
Pressure oscillations induced by the standing wave can vibrate the piping system around the T-branch. This effect is even more pronounced with several closed side branches in a row [3]. Oscillation of this type also occurs in bypasses, where the sharp radius of the arc creates conditions close to the blind side branches (see Figure 1). These operating states can be partially predicted in the design phase of the piping system.
The critical gas velocity v n for self-excitation can be calculated according to the relationship
v n = f n e d S t
where St is the Strouhal number for the geometric and fluid ratios in the T-branch, and fne is the oscillation frequency given as
f n e   = ( 0.88 ÷ 1 ) n c 4 L
where n = 1, 3, 5,..., c is the sound velocity in an environment [7].
Due to the unclear geometry of the rounding edge of the T-branch or the change in fluid conditions compared to the design state, it is not always possible to eliminate such oscillations.
A suitable device for ensuring operational safety should be installed in a monitoring system that can be based on sensing vibration parameters (accelerometers) or strain sensors. Accelerometers enable detecting quantities such as the velocity of oscillation or acceleration and frequency values at which the pipe oscillates. Allowable values for the velocity of the oscillation are stated by guidelines and industry regulations. As far as the effects of oscillation on the safe operations are concerned, it is essential to know the amplitude of the strain (distortions), which could cause the fatigue of a material. However, this type of information cannot be provided by accelerometers. The need to know the maximum displacement of the oscillating part relative to the base (branch oscillation displacement relative to the main pipe or fixed ground) would require the measuring of accelerations and calculating of displacements in multiple directions and in multiple parts of the pipeline node, as documented in Figure 2.
In general, the pipelines oscillate in a wide spectrum of frequencies. The integrity of pipelines is put at risk only at frequencies that cause significant magnitude of the strain amplitudes. Having compared the frequency composition of the oscillation shown in Figure 3, measured by accelerometers and bending stress detected by strain gauges on the identical section of the pipeline, it is obvious that significant deformation amplitudes occur only at frequencies up to 3 Hz. The frequency spectrum measured by accelerometer sensors (Figure 3 on the left side) does not reveal the significant magnitudes of strain that can decrease the operational lifetime of a pipe.
More reliable results can be obtained by the direct measuring of strains at the critical cross-section. The suitable arrangement of the sensors allows to calculate directly the maximum value of the stress in the most loaded cross-section of the vibrating pipeline part.
Figure 4 shows the deployment of a minimum number of strain sensors along the perimeter of the pipeline´s cross-section, allowing the calculations of bending, torsion, and normal forces. The methodology of measurements and calculations is elaborated in more detail in the papers [11,12].
Due to the high mean stresses due to internal pressure, it is not possible to easily compare the measured amplitudes of the strain from vibrations with their safe limit against fatigue crack. It is necessary to separate the individual oscillation cycles and take into account the mean value of the cycle [13,14]. The real-time monitoring of dangerous vibrations can be accomplished by processing the measured time process of strains in time batches, e.g., in 30 or 60 s.
For reliable information about the operational capability of the oscillating pipeline, it is, however, necessary to solve two more problems:
  • to determine cyclic properties of the critical volume of the material (often the weld joint) and
  • the condition for assessing the criticality of the vibrations.
The critical volume of the weld joint material in terms of oscillation is the heat affected area or the area with defects in the weld metal. In view of the validity of the cyclic properties of the material, it is appropriate to perform cyclic tests of the welded samples, as shown in Figure 5. The cyclic tests of specimens taken along the pipeline circumference in a place of the weld joint include all the effects of the microstructure of all individual weld joint zones and its geometry, as well as possible defects.
The condition of the vibration permissibility of the T-branch of the welded pipeline is then given by the relation
ε a e q 0.8 σ c 5.10 6 E     ,
where σ c 5.10 6 is a fatigue limit for 5 million cycles to failure (for the selected probability of survival, i.e., 95%), and εaeq is an amplitude of equivalent strain in the critical cross-section, taking into account the mean value of the cycle (Goodman [16] or Morrow’s [17] method). Such a cycle is mainly induced due to stresses from the internal pressure and possible combination of normal (axial plus bending loading) and shear stresses (torsional loading). E is the Young modulus of the material.
The amplitudes of strain (stress) lower than value of the cyclic anelasticity limit induced by oscillation may be considered as safe, as was presented in [18]. These amplitudes of strains below this cyclic anelasticity limit are thus neglected. Thus, the monitoring system takes into account only the amplitudes of strains above this limit. The example of putting such a pipeline monitoring system in practice for the gas pipeline courtyard compressor station is presented by its main online information screen in Figure 6. This screen shows the information about critical cross-section points of the pipeline system at the compressor courtyard. KM1-KM9 are those critical monitoring places where there are installed 5 strain gauges, according to the methodology displayed in Figure 4. These strain sensors continuously sense the deformation state of each monitoring cross-section KM1-KM9. The evaluated and visualized magnitudes are:
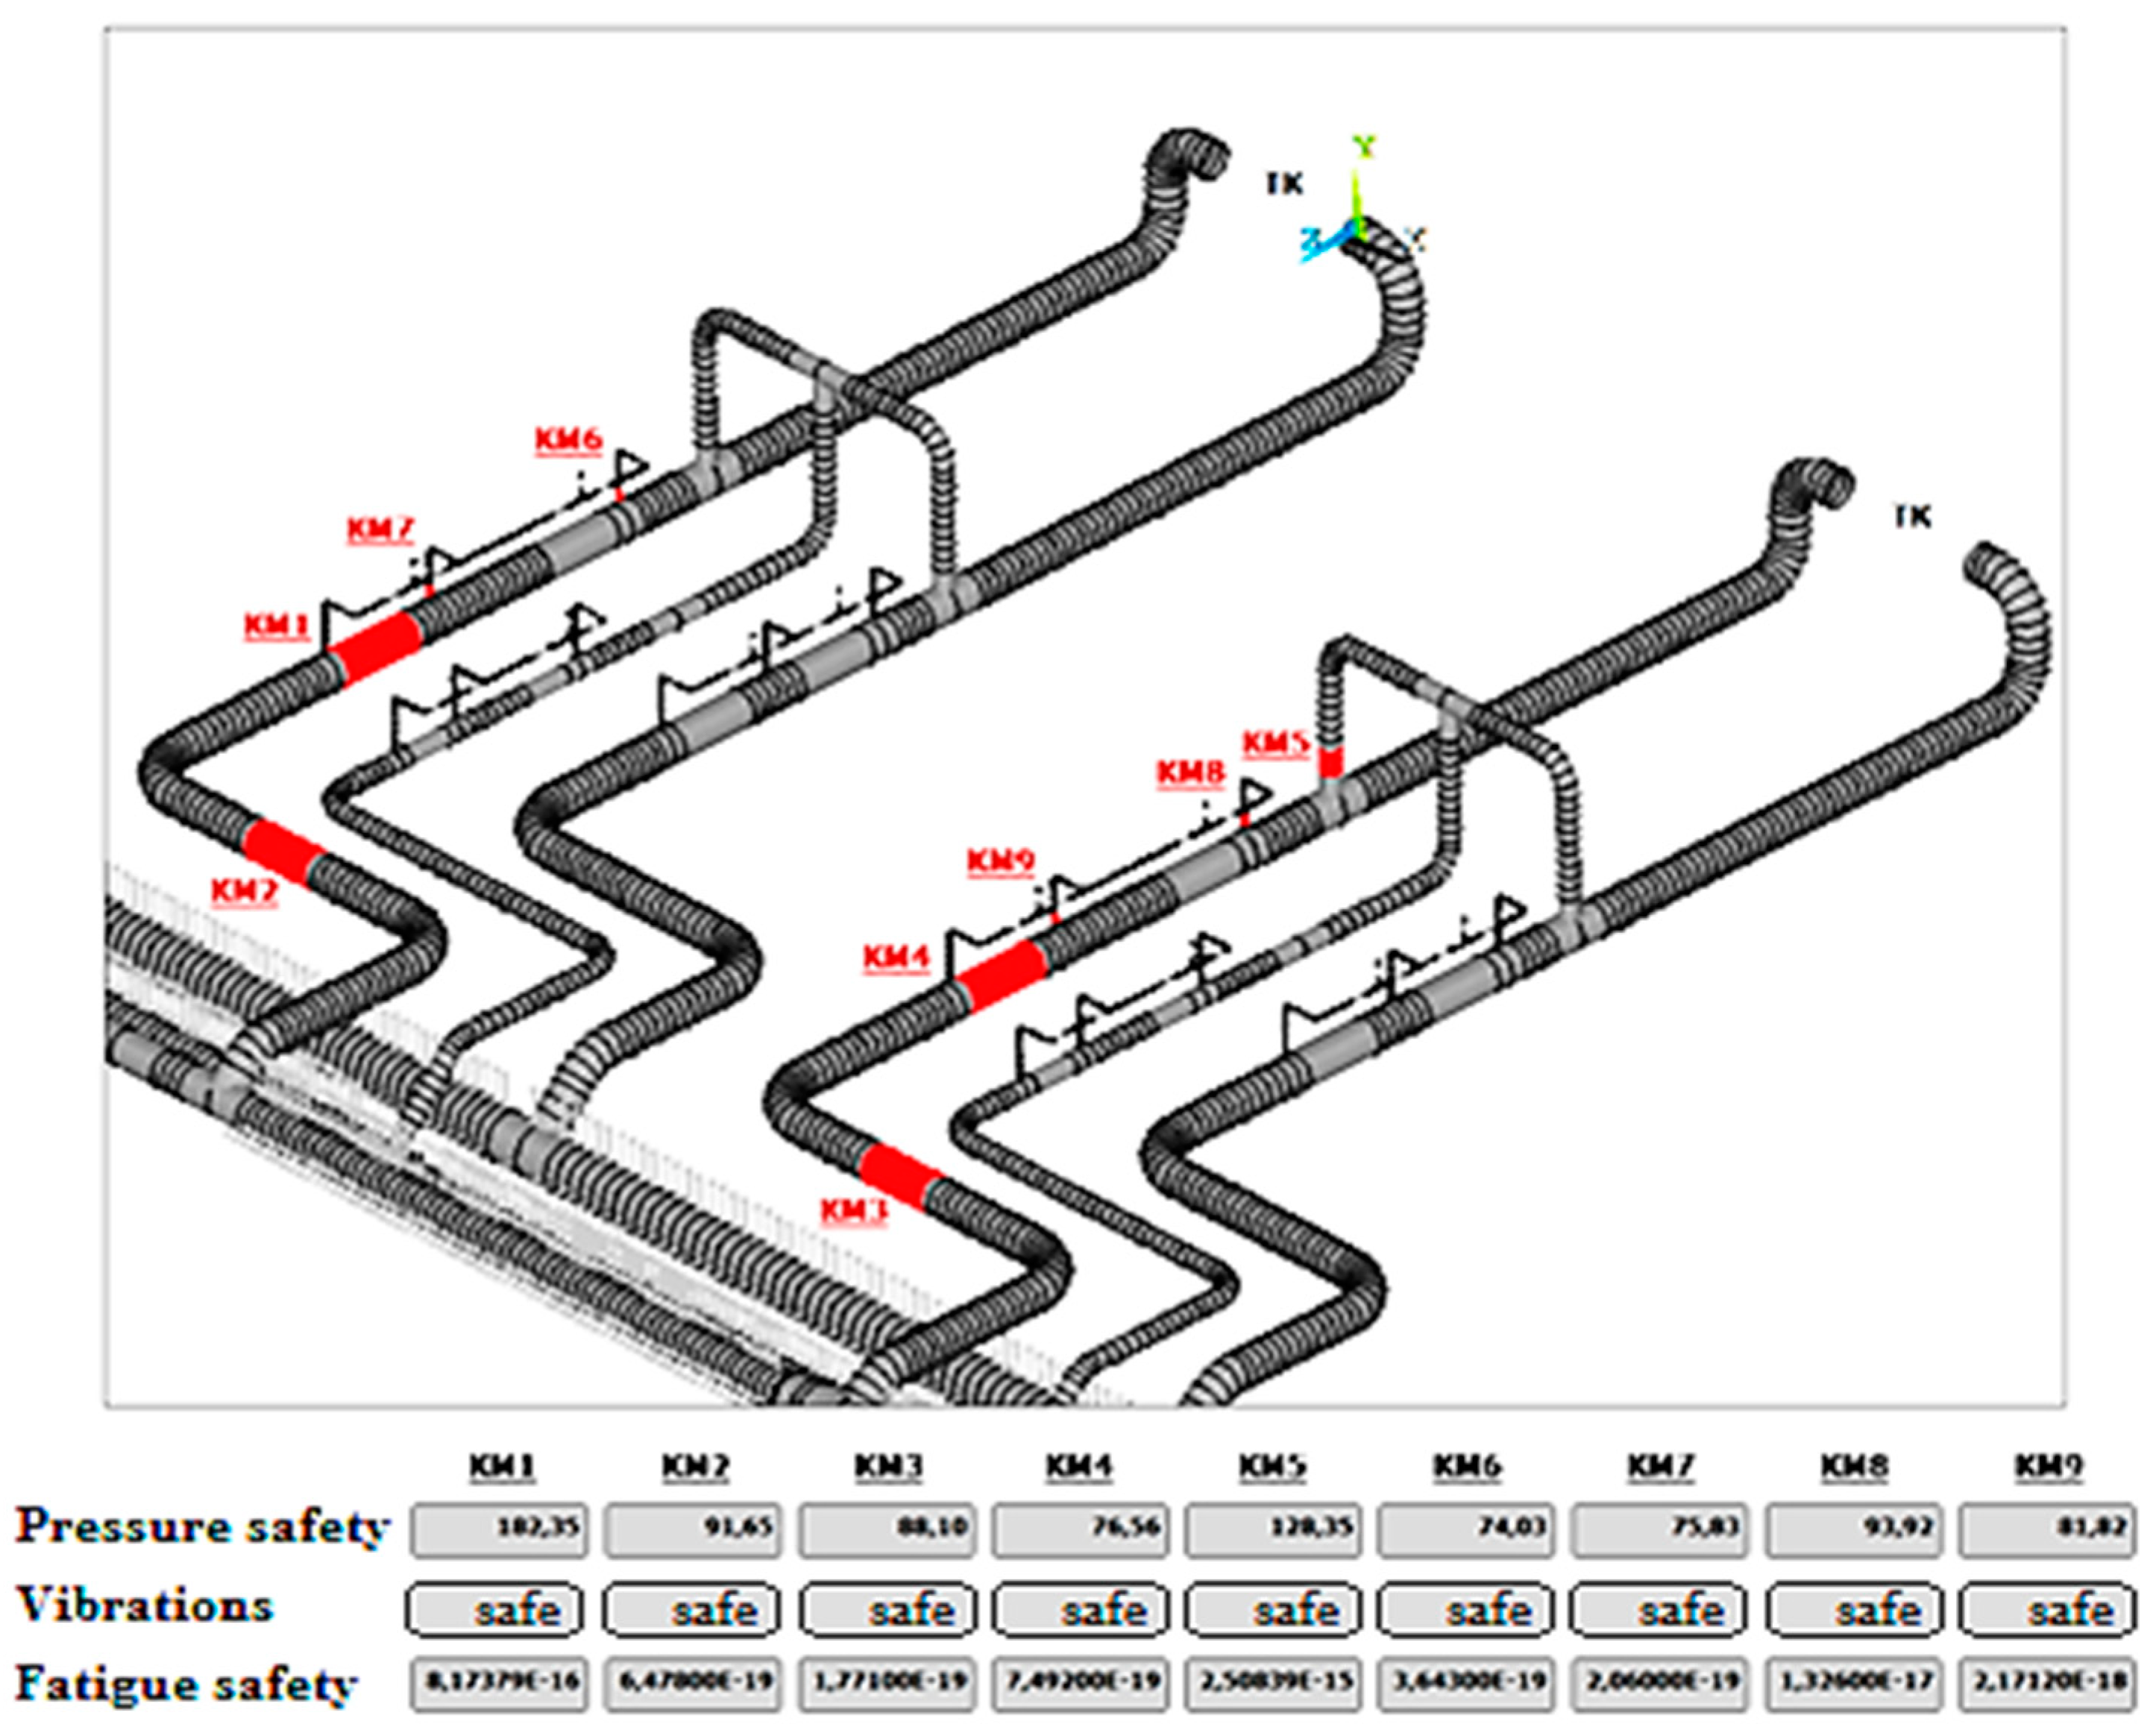
  • safety in terms of the pressure integrity of the pipe,
  • fatigue damage accumulation state [19], and
  • vibration permissibility.
The long-term operation of the monitoring system places high demands on the stability of the sensors and the associated electronics, which can lead to the undesired valuating offset effect of the measured signals. Although it is possible to employ FBG (fiberglass) sensors [20], VSG (vibrating string gauges) [21], or resistive strain gauges to continuously sense strain, they are not convenient for measuring pipeline deformations caused by vibrations due to high frequencies. Resistive strain gauges frequently have an undesirable floating offset effect, which is formed by the sum of the heat drift of strain gauges, wires, and electronic circuits. Thus, it is not satisfactory to rely on the conventional thermal compensation of strain gauges as recommended by their manufacturers [22].
For long-time monitoring of strains, the extended thermal compensation concept for strain gauges also includes electronic offset compensation, as it is explained in more detail in [12,23]. The example of the long-term overall stress record in a pipeline surface based on strain sensors measured without any influence of the unwanted offset is shown in Figure 7.

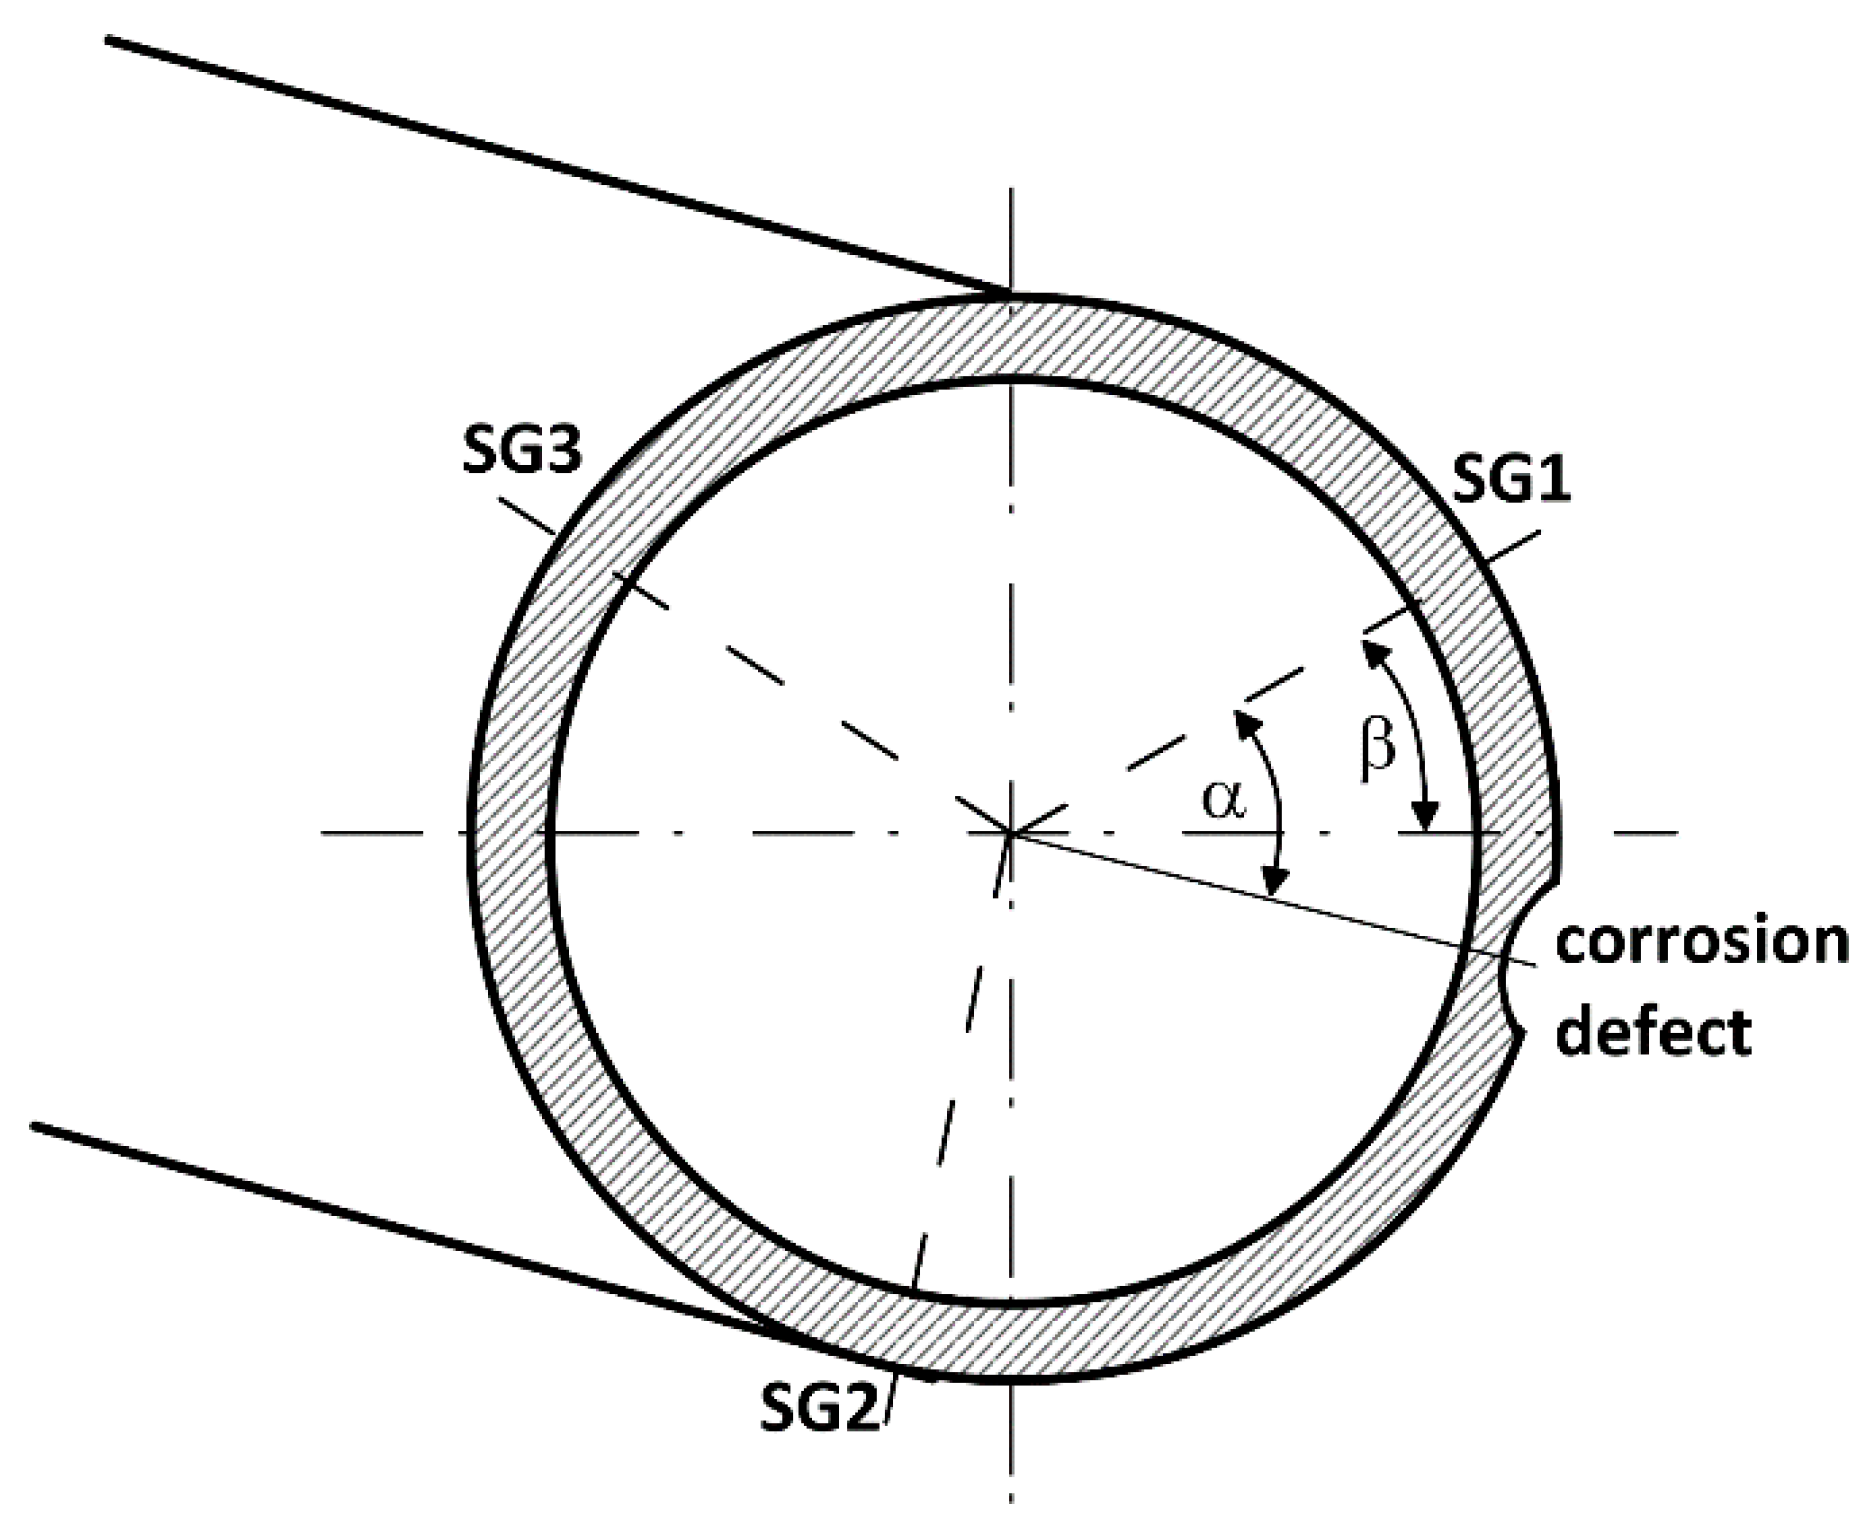
2.2. The Additional Bending in Operations of Pressurized Pipelines

In the operation of line piping systems and their parts, the changing of the soil support may cause additional bending stresses in the pipeline casing loaded with an internal pressure. In practice, such a situation may occur on pipes laid on slopes. In pipelines placed perpendicular to the slope, additional downward bending stresses may occur as a result of the downward slope densification, resulting in less torsion. Similarly, a pipeline placed downstream of a downward slope can be subjected to the additional bending stress at the point of the transition curve to the horizontal section.
When placing the pipeline, it is necessary to compact the subsoil, so that the pipe is supported over its entire length. However, it is sometimes difficult to achieve the ground compaction while excavating the pipeline because of the maintenance during its operation. After heavy rains, the subsoil may drop in such sections, or the subsoil may be undermined, and the pipeline will become a beam due to its own gravity. The additional bending stress, together with the internal pressure, can endanger its integrity (Figure 8).
The critical pipeline sections where the problems with the slope stability or subsoil stability may be expected can also be equipped with monitoring systems. The arrangement of the sensors along the circumference (see Figure 3) allows to monitor the value of the additional bending stress and possible torsional stress. Those stresses can be evaluated by the following relationships:
σ M B m a x = 2 3 E ε i 2 + ε i i 2 + ε i i i 2 ε i ε i i ε i ε i i i ε i i ε i i i
τ M t = G ( ε i i i b ε i i i a ) ,
where E is the Young modulus of the material in tensile/compression, and G is Young´s modulus of material in torsion.
An example of the occurrence of the additional bending stress of the pipeline section after a prolonged rainfall recorded by the monitoring system is shown in Figure 9.

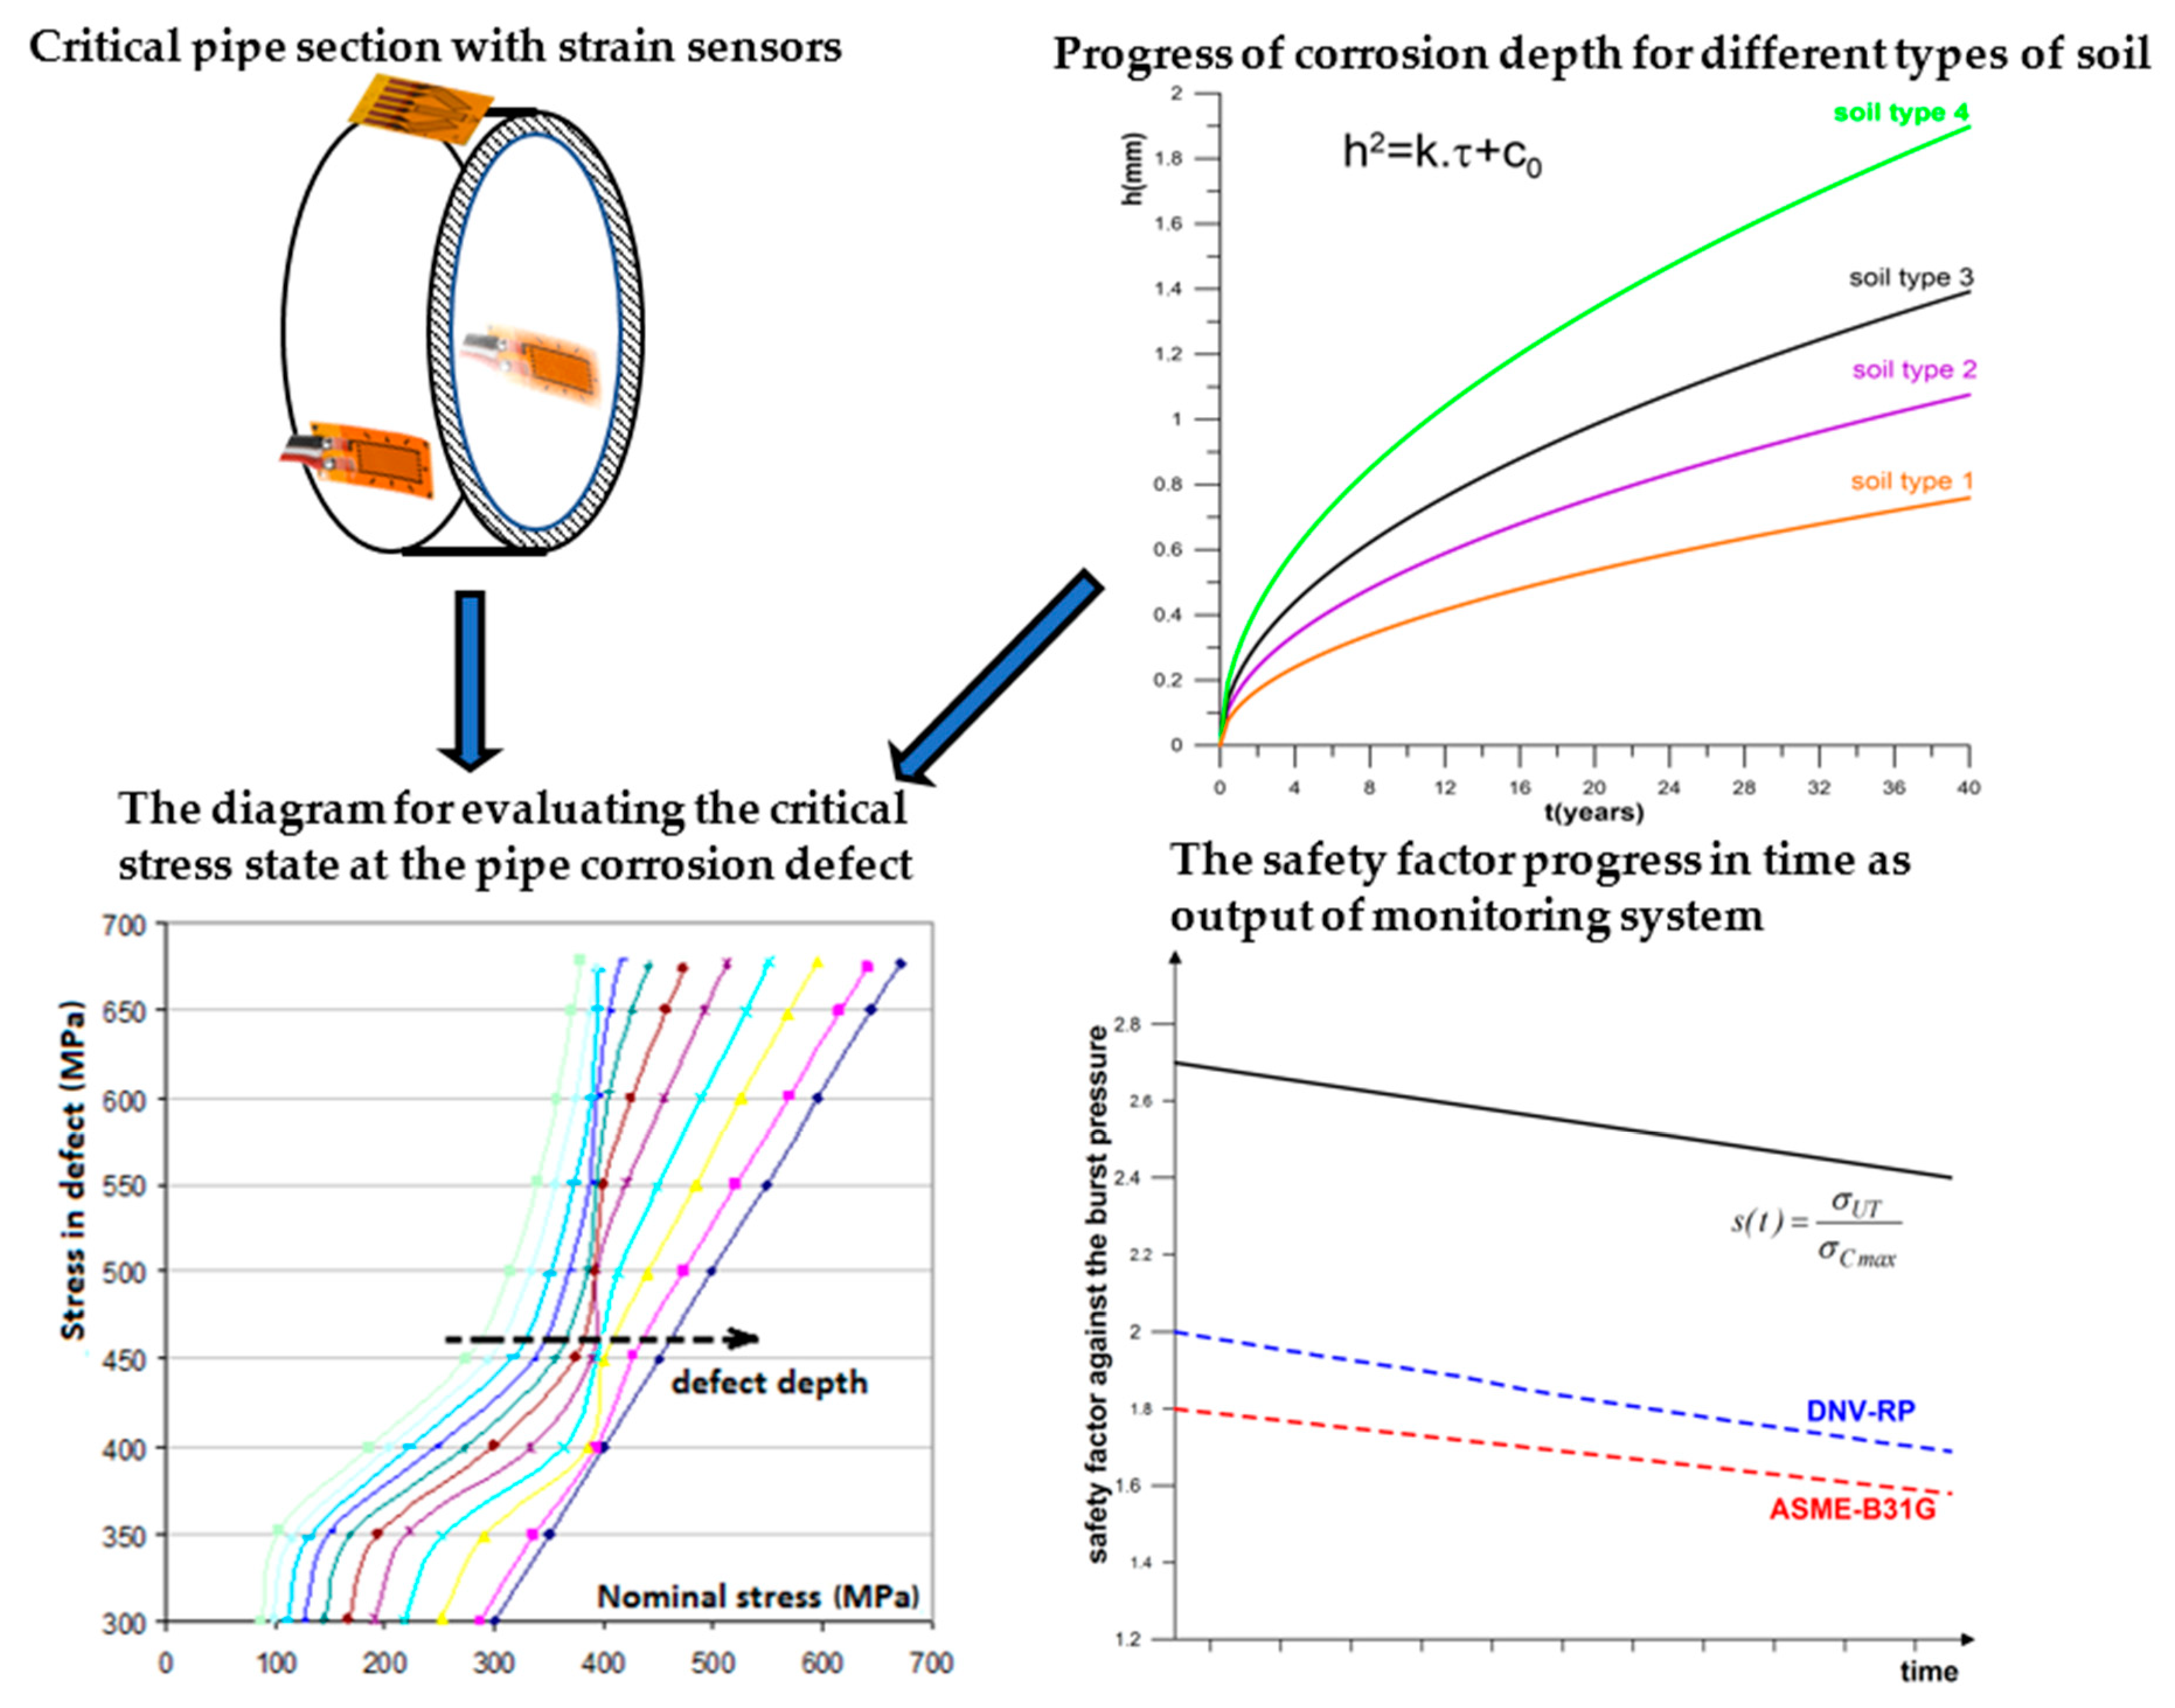
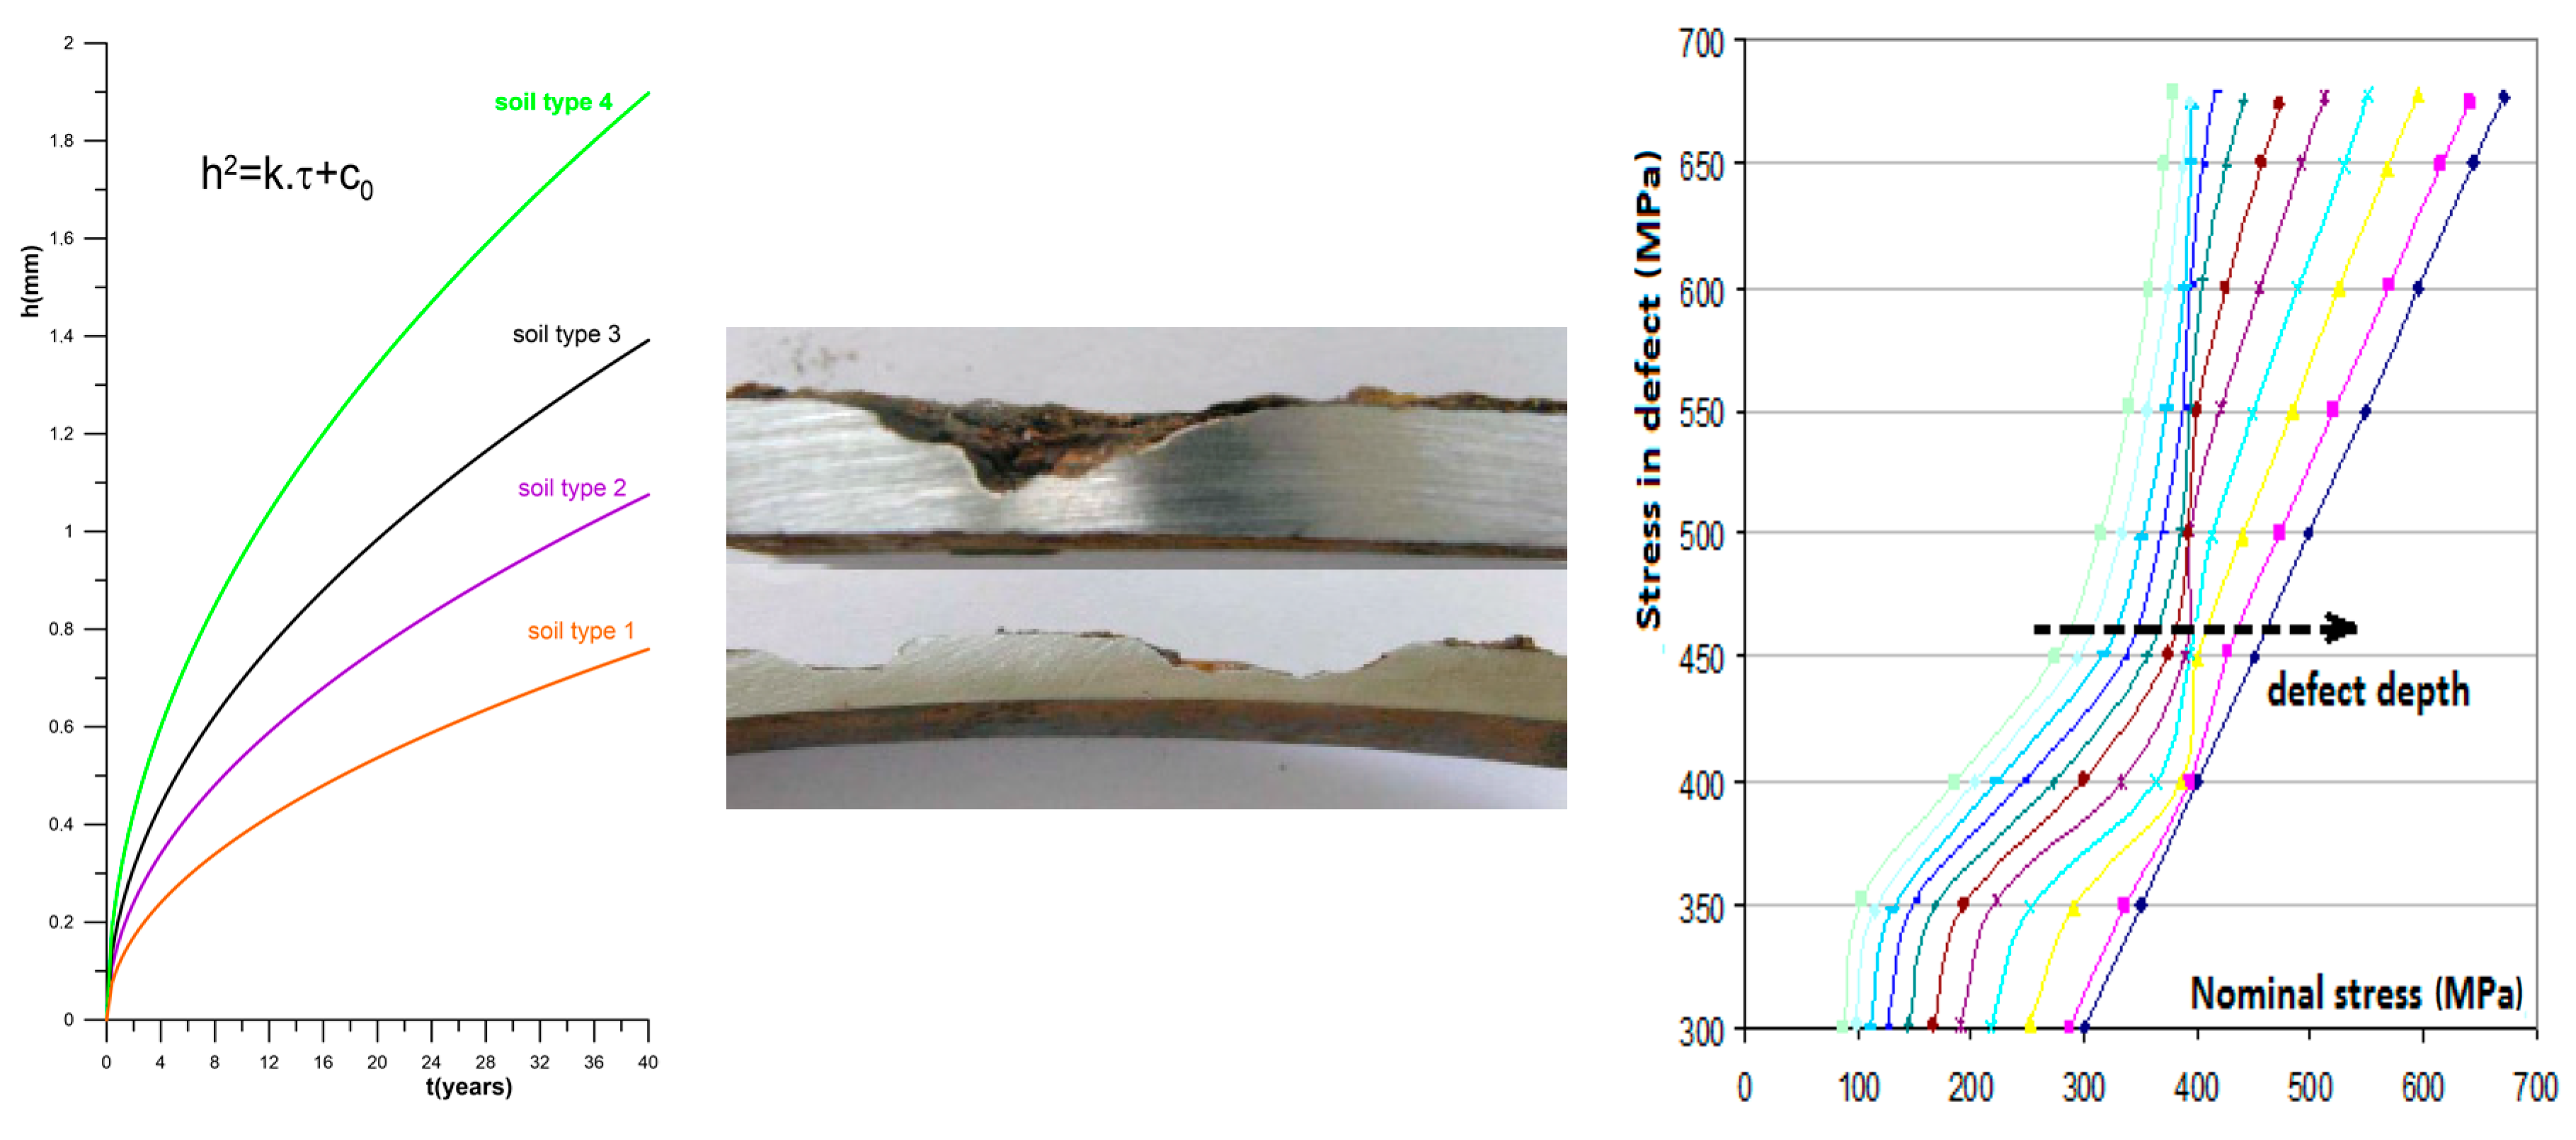
2.3. Weakening of Pipe Walls Due to Corrosion

Insufficient corrosion protection, the breakage of such protection, or its absence subsequently lead to the initiation of a corrosion process under appropriate environmental conditions. By gradually weakening the wall thickness, the safety of the operation of the pressured pipeline is reduced. Wall weakening is particularly dangerous when it is combined with additional bending stresses.
The concept of the online monitoring of the pipeline conditions with corrosion loss of the wall thickness placed in the ground at a location endangered by landslides (risk of additional bending stress on pipeline loading) loaded with an internal gas pressure is shown in Figure 10.
The input data for such a system are the following:
  • depth of existing corrosion defect found by pipeline inspection,
  • kinetics of corrosion defect development,
  • stress-strain state of the pipeline, and
  • material properties of the pipeline.
The kinetics of corrosion layer growth is most often described by parabolic law in the form [24,25]
Δ h 2 = k . τ + c 0                               τ 0 = 0 ;   c 0 0 ,
where Δh is the corrosion length change (mm of corrosion depth increase per year), k is the constant depending on temperature, τ is a time, and c0 is an integration constant calculated from at least one corrosion depth.
The actual depth of the corrosion defect is therefore given by the type of corrosive environment and the time of its growth. Using the computer simulations, it is made possible to create diagrams of the stress-corrosion defect dependencies for the nominal stresses in the pipeline and the corrosion defect depth as a parameter [26]. The monitoring system thus calculates the depth of corrosion loss at the current time, according to Equation (6), calculates the current stress value in the pipeline cross-section from the strain sensors placed on the pipeline at the corrosion defect location, and, also, calculates the value of the maximum stress in the corrosion defect, as is shown in Figure 11.
As Equation (4) expresses the maximum value of tension caused by the bending stress in the cross-sectional fibers, which is subjected to the highest loading, and not the value at the point of a corrosion defect, it is necessary to optimize the location of strain sensors with regards to the location of the corrosion defect (Figure 12).
The bending stress in the corrosion defect σMBcor is given by the equation:
σ M B c o r = σ M B m a x sin ( β )
where the angle β defines the vector location of the additional bending moment with respect to strain sensor SG1 and may be expressed by the following equation:
t a n β = 3 ( ε 2 ε 3 ) 2 ε 1 ε 2 ε 3
where the angle α defines the location of a corrosion defect in relation to the same strain sensor.
Thus the relationships derived in [12] may be elaborated to include the following form:
σ x = E ( ε 1 + ε 2 + ε 3 3 + 2 3 s i n ( α β ) ε 1 2 + ε 2 2 + ε 3 2 ε 1 ε 2 ε 1 ε 3 ε 2 ε 3 )
σ y = E . ε y = E ( ε a + ε b ε x )
γ 2 = ε a ε b 2
The principal stresses may be calculated by employing the methodology in [12] by the following equations:
σ 1 = E . ε 1 = E [ ε x + ε y 2 + ( ε x ε y 2 ) 2 + ( γ 2 ) 2 ]
σ 2 = E . ε 2 = E [ ε x + ε y 2 ( ε x ε y 2 ) 2 + ( γ 2 ) 2 ]
σ 3 = E . ε 3 = p   ,
where p is an internal pressure.
The current safety level of a pipeline with corrosive wall loss can be calculated in-time according to the following relationship:
s ( t ) = σ U T σ C max ( t )   ,
where σUT is a true strength limit for given material of pipeline, and σCmax(t) is the current value of the maximum stress calculated in the place of the corrosion defect using the diagram in Figure 11 for a measured value of the nominal stress in the pipe and an actual depth of the corrosion defect.
The safety level of a pipeline with corrosive wall loss can also be calculated using ASME-B31G [26] or DNV-101RP [27] normative relationships, which are significantly more conservative than the reality is. The resulting time progress of the safety level for each of the approaches shown in Figure 9 (normative relationships or diagrams from computer simulations) provides the operator of the pipeline system with the basic information on operational safety.

3. Conclusions

The highest number of pipeline system accidents in hydrocarbon transportation occurs due to the concurrence of several adverse effects [28,29], such as:
  • induced vibrations due to fluid-geometry or the work of compressors,
  • additional bending loading, and
  • corrosion losses of the wall thickness.
These unplanned operational situations can be evaluated using appropriately designed monitoring systems. The physical principles of the creation and functioning of such systems were presented in the article. It should be noted that an important part of such systems is their appropriate hardware assembly, which must be implemented in industrial conditions and as simple and robust as possible. The monitoring system itself is controlled by a software application that provides the collection and evaluation of data from sensors, calculation of the resulting quantities, and their visualization in-time. All the monitoring systems described in this article have been developed and employed in a real operation of pipeline systems throughout the period of several years. They helped to detect the processes of self-excited vibrations using strain sensors and additional bending stresses in the operation of pipeline gas transport systems. The credibility of the values provided by the tested systems thus results from the direct measurements of strain as a key quantitie for assessing the health and operational safety of such structures. The diagrams in Figure 3, Figure 7, and Figure 9 shown in the article were diagrams recorded by real, presented monitoring systems.

Author Contributions

Conceptualization, methodology (V.C.); measurement (M.Š.); software M.G. (Martin Garan); electronic M.G. (Marek Gašparík). All authors have read and agreed to the published version of the manuscript.

Funding

This work was supported by the Slovak Research and Development Agency under the contract No. APVV-17-0666 and by the Research & Development Operational Program funded by the ERDF ITMS: 26240220084 Science, Bratislava.

Conflicts of Interest

The authors declare no conflict of interest.

References

  1. Ricker, E.R. Analysis of Pipeline Steel Corrosion Data from NBS (NIST) Studies. J. Res. Natl. Inst. Stand. Technol. 2010, 115, 373–392. [Google Scholar] [CrossRef] [PubMed] [Green Version]
  2. Restrepo, C.E.; Simonoff, J.S.; Zimmerman, R. Causes, cost consequences, and risk implications of accidents in US hazardous liquid pipeline infrastructure. Int. J. Crit. Infrastruct. Prot. 2009, 2, 38–50. [Google Scholar] [CrossRef]
  3. Wachal, J.C.; Smith, D.R. Vibration Troubleshooting of Existing Piping Systems; EDI Paper No.59; Engineering Dynamics Inc.: San Antonio, TX, USA, 1991. [Google Scholar]
  4. Radavich, P.M.; Selamet, A.; Novak, J.M. A Computational Approach for Flow-acoustic Coupling in Closed Side Branches. J. Acoust. Soc. Am. 2001, 109, 1343–1353. [Google Scholar] [CrossRef] [PubMed] [Green Version]
  5. Jungowski, W.M.; Botros, K.K.; Studzinski, W. Cylindrical Side-branch as Tone Generator. J. Sound Vib. 1989, 131, 265–285. [Google Scholar] [CrossRef]
  6. Rogers, L.E. Design Stage Acoustic Analysis of Natural Gas Piping Systems in Centrifugal Compressor Stations. J. Eng. Gas Turbines Power 1992, 114, 727–736. [Google Scholar] [CrossRef]
  7. Arnulfi, G.L.; Giannattasio, P.; Giusto, C.; Massardo, A.F.; Micheli, D.; Pinamonti, P. Multistage Centrifugal Compressor Surge Analysis: Part I—Experimental Investigation. J. Turbomach. 1999, 121, 305–311. [Google Scholar] [CrossRef]
  8. Arnulfi, G.L.; Giannattasio, P.; Giusto, C.; Massardo, A.F.; Micheli, D.; Pinamonti, P. Multistage Centrifugal Compressor Surge Analysis: Part II—Numerical Simulation and Dynamic Control Parameters Evaluation. J. Turbomach. 1999, 121, 312–320. [Google Scholar] [CrossRef]
  9. Gravdahl, J.T.; Willems, F.; De Jager, B.; Egeland, O. Modeling for Surge Control of Centrifugal Compressors: Comparison with experiment. IEEE 2000, 2, 1341–1346. [Google Scholar]
  10. Farrar, R.C.; Worden, K. Structural Health Monitoring: A Machine Learning Perspective; John Wiley & Sons: Hoboken, NJ, USA, 2012. [Google Scholar]
  11. Chmelko, V.; Garan, M. Long-term monitoring of strains in a real operation of structures. In Proceedings of the 14th IMEKO TC10 Workshop on Technical Diagnostics, Milano, Italy, 27–28 June 2016; pp. 333–336. [Google Scholar]
  12. Chmelko, V.; Garan, M.; Šulko, M. Strain measurement on pipelines for long-term monitoring of structural integrity. Measurement 2020, 163, 107863. [Google Scholar] [CrossRef]
  13. Amzallag, C.; Gerey, P.; Robert, J.L.; Bahuaudt, J. Standardization of the rainflow counting method for fatigue analysis. Int. J. Fatigue 1994, 16, 287. [Google Scholar] [CrossRef]
  14. Papuga, J.; Vízková, I.; Lutovinov, M.; Nesládek, M. Mean stress effect in stress-life fatigue prediction re-evaluated. MATEC Web Conf. 2018, 165, 10018. [Google Scholar] [CrossRef] [Green Version]
  15. Basquin, O.H. The exponential law of endurance tests. Am. Soc. Test. Mater. Proc. 1910, 10, 625–630. [Google Scholar]
  16. Morrow, J.D. Fatigue properties of metals, section 3.2. In Fatigue Design Handbook; Pub. No. AE-4; SAE: Warrendale, PA, USA, 1968; p. 21. [Google Scholar]
  17. Goodman, J. Mechanics Applied to Engineering; Longmans, Green and Co.: London, UK, 1919; pp. 631–636. [Google Scholar]
  18. Chmelko, V. Cyclic anelasticity of metals. Met. Mater. 2014, 52, 353–359. [Google Scholar] [CrossRef] [Green Version]
  19. Chmelko, V.; Kliman, V.; Garan, M. In-time monitoring of fatigue damage. Procedia Eng. 2015, 101, 93–100. [Google Scholar] [CrossRef] [Green Version]
  20. Tennyson, R.C.; Don, W.; Cherpillod, T. Monitoring Pipeline Integrity Using Fiber Optic Sensors. In Proceedings of the CORROSION 2005, NACE International, Houston, TX, USA, 3–7 April 2005. [Google Scholar]
  21. Glisic, B. Comparative study of distributed sensors for strain monitoring of pipelines. Geotech. Eng. 2019, 50, 28–35. [Google Scholar]
  22. Hoffmann, K. Eine Einfuh-rung in die Technik des Messens mit Dehnungsmessstreifen; HBM: Darmstadt, Germany, 2012. [Google Scholar]
  23. Šulko, M.; Garan, M.; Chmelko, V. PUV 5017-2015, G01L 1/22; Industrial Property Office: Banská Bystrica, Slovakia, 2015. [Google Scholar]
  24. National Research Council Canada. Metallic corrosion. In Proceedings of the 9th International Congress on Metallic Corrosion, Toronto, ON, Canada, 3–7 June 1984. [Google Scholar]
  25. Chmelko, V.; Berta, I. Analytical Solution of the Pipe Burst Pressure Using Bilinear Stress-Strain Model and Influence of Corrosion Defects on it. Procedia Struct. Integr. 2019, 18, 600–607. [Google Scholar] [CrossRef]
  26. ASME B31.G. Manual for Determining the Remaining Strength of Corroded Pipelines; ASME: New York, NY, USA, 2009. [Google Scholar]
  27. DNV RP F101-Parts A & B: Corroded Pipelines; Det Norske Veritas AS: Oslo, Norway, 2015.
  28. Cosham, A.; Hopkins, P. The Pipeline Defect Assessment Manual (PDAM); Penspen Ltd.: London, UK, 2003. [Google Scholar]
  29. Nanney, S. Pipeline Safety Update; NAPCA Workshop: Houston, TX, USA, 2012. [Google Scholar]
Figure 1. Principle of self-excited oscillations in closed side branches. D is the diameter of the main pipe, and L (d) is a length (diameter) of a side branch.
Applsci 10 06023 g001
Figure 2. Vibration of the pipe and branch: (a) in-phase in the same direction (without the relative deflection) (b) out p-hase in the same direction (inducing deflection of branch), and (c) in a different direction (inducing deflection of the branch).
Applsci 10 06023 g002
Figure 3. Frequency composition of signals measured by accelerometers and strain gauges on the vibrating pipe branch.
Applsci 10 06023 g003
Figure 4. (a) The arrangement of strain sensors along the perimeter of the pipeline, and (b) the application of the strain sensors (gauges) on the real pipe.
Applsci 10 06023 g004
Figure 5. Dependency σa-2Nf [15] for the base material and pipeline specimens made from the real pipeline with the weld joint.
Applsci 10 06023 g005
Figure 6. Main screen of the monitoring system for the super-structure of the pipeline yard above the ground installed at the compressor station.
Applsci 10 06023 g006
Figure 7. The progress of daily stress peaks in the cross-section of the pipe near the compressor obtained by a monitoring system with an extended thermal and device compensation concept.
Applsci 10 06023 g007
Figure 8. Gas pipeline accident due to the additional bending of a pipeline system laid on a slope with insufficient amounts of compacted subsoil.
Applsci 10 06023 g008
Figure 9. Gradual rise of stresses from additional bending stresses on the pipeline.
Applsci 10 06023 g009
Figure 10. The schematic concept of the online monitoring of a pressurized pipeline system with corrosion defects.
Applsci 10 06023 g010
Figure 11. The progress of the corrosion depth over time for different soil types and stress diagram for different depths of corrosion defects for nominal stress values obtained by direct measurements.
Applsci 10 06023 g011
Figure 12. The location of the corrosion defect in relation to a strain gauge 1 (SG1).
Applsci 10 06023 g012

