Article

Peak Fitting Applied to Fourier Transform Infrared and Raman Spectroscopic Analysis of Proteins

Department of Food Science, University of Guelph, Guelph, ON N1G 2W1, Canada
*
Author to whom correspondence should be addressed.
Appl. Sci. 2020, 10(17), 5918; https://doi.org/10.3390/app10175918
Submission received: 7 August 2020 / Revised: 19 August 2020 / Accepted: 19 August 2020 / Published: 26 August 2020
(This article belongs to the Special Issue Application of Spectroscopy in Food Analysis: Volume II)

Abstract

:
FTIR and Raman spectroscopy are often used to investigate the secondary structure of proteins. Focus is then often laid on the different features that can be distinguished in the Amide I band (1600–1700 cm−1) and, to a lesser extent, the Amide II band (1510–1580 cm−1), signature regions for C=O stretching/N-H bending, and N-H bending/C-N stretching vibrations, respectively. Proper investigation of all hidden and overlapping features/peaks is a necessary step to achieve reliable analysis of FTIR and FT-Raman spectra of proteins. This paper discusses a method to identify, separate, and quantify the hidden peaks in the amide I band region of infrared and Raman spectra of four globular proteins in aqueous solution as well as hydrated zein and gluten proteins. The globular proteins studied, which differ widely in terms of their secondary structures, include immunoglobulin G, concanavalin A, lysozyme, and trypsin. Peak finding was done by analysis of the second derivative of the original spectra. Peak separation and quantification was achieved by curve fitting using the Voigt function. Structural data derived from the FT-Raman and FTIR analyses were compared to literature reports on protein structure. This manuscript proposes an accurate method to analyze protein secondary structure based on the amide I band in vibrational spectra.

1. Introduction

Infrared spectroscopy is one of the oldest techniques to study the secondary structure of macropeptides and proteins [1,2,3,4,5]. Alternative techniques such as circular dichroism (CD) and X-ray crystallography have also been utilized to gain information about protein structure; X-ray crystallography relies on the protein’s ability to crystallize [6]. CD spectroscopy is a technique based on the absorption of light and measures the difference in absorbance of left and right circularly polarised light [7,8,9]. CD will require protein extraction prior to analysis and will, hence, not allow the in situ study of proteins (i.e., gluten) in a range of complex food systems, such as dough and baked products. However, FTIR and FT-Raman techniques have the ability to study the proteins in the complex food matrix without the need for extensive sample preparation or extraction [10]. Nuclear magnetic resonance spectroscopy can also be used to study protein structure in solution but the processing of data obtained for large proteins is a very complicated process [6]. Infrared and Raman spectroscopy, on the other hand, are non-invasive vibrational spectroscopy techniques and can be used to study the protein structure in the native state and in a wide range of different environments [6]. For instance, FTIR has been used to study the changes in gluten secondary structure during dough mixing [11,12,13,14], enzymatic modification [15], hydration [16,17], and upon bran addition to a viscoelastic gluten dough [18].
Protein-containing samples display nine characteristic vibrational absorption bands in an IR spectrum (~200–3300 cm−1) which arise from different vibrational modes of the amide groups of proteins (found in the peptide bonds), namely amide A, B, and I-VII [19]. Among these, the amide I band which mainly probes stretching vibrations of the C=O bonds in the peptide backbone has been proven to be the most sensitive and popular band to study protein secondary structure [5,19]. Each type of secondary structure correlates to a slightly different C=O stretching frequency in the amide I band region of the spectrum due to its unique molecular geometry and hydrogen bond pattern [6,19]. Amide II also provides information on the vibrational bands of the protein backbone. However, it derives mostly from in-plane N-H bending (40–60% of the potential energy), and C-N stretching (18–40%), resulting in less sensitivity and specificity for protein conformational changes compared to the amide I band [19].
When studying aqueous solutions of proteins, strong interference of intense infrared absorption of water often distorts the IR spectra, complicating the practical use of FTIR in high moisture systems [10]. The H-O-H scissoring/bending vibration shows a strong absorbance in the amide I band region, which makes the analysis of this band difficult. A common approach is subtracting the reference spectrum of the pure solvent, i.e., water. There has been a number of studies for proteins solubilized in H2O in which a reference H2O spectrum was subtracted from the sample spectrum [5,20,21,22]. Other strategies have also been explored and utilized thus far to solve this issue, such as using D2O as a solvent instead of H2O [1,2,23,24]. However, the use of D2O results in very different solvent properties relative to H2O and it is known to affect hydrogen bond dynamics [6,25,26]. The different solvent properties of D2O compared with H2O can alter the structure of proteins by changing the balance between intra- and intermolecular hydrogen bonds and hydration interactions [26]. Overall, an ideal subtraction needs the complete overlay of both the reference water spectrum and the sample water spectrum [27]. As the interaction of molecules (i.e., proteins) with water can cause small shifts in the H2O bending signal, there is a risk of creating subtraction artefacts. Unfortunately, there is no good strategy developed thus far to deal with this issue for FTIR analysis of protein secondary structure [27].
In Raman spectroscopy, interference with a strong H2O signal is less of an issue as the intensity of the scattering depends on changes in polarizability of a molecule [10]. Raman is inherently more sensitive towards non-polar groups like C=C, C-C, and S-S [28]. Water as a strongly polar molecule with weak polarizability only gives very weak Raman signals [29]. As such, Raman is considered to be a more suitable technique to study the protein structure in complex high moisture matrices and aqueous solutions [10]. Raman, however, suffers from other limitations such as low signal to noise ratios and fluorescence interference. Fluorescence interference is especially worrisome for proteins as the aromatic amino acids (i.e., tryptophan, tyrosine, and phenylalanine) display strong fluorescent properties [10,28]. The fluorescence issue can be overcome by using more red-shifted laser light for the Raman analysis as these typically do not contain enough energy to cause excitation of the intrinsic fluorophores in proteins and, hence, reduce fluorescence emission [28].
The amide I band in FTIR and FT-Raman spectra of protein samples is literally composed as a superimposition of C=O stretching signals of the different secondary structures in a protein. This results in a complex signal that is challenging to study [30]. Overlapping of peaks will be caused by two factors: (i) the finite instrumental resolution and (ii) the intrinsic physical nature of the sample (i.e., solid or liquid) [31]. Increasing the instrument’s resolution can partly solve the first factor and give better-resolved peaks. However, this leads to a lower signal to noise ratio and typically noisier scans [27]. In addition, choosing resolutions higher than 4 cm−1 for solid and liquid samples does not necessarily add more information and generally only results in noisier spectra [27]. The decreased spectral resolution due to the intrinsic physical nature of the sample can be partially overcome by mathematical band narrowing/resolution enhancement methods [30]. Fourier self-deconvolution, second derivative analysis, and band curve-fitting are three mathematical resolution enhancement methods that enable studying individual secondary structures within the highly complex amide I band [2,5,24]. These techniques allow the quantitative estimation of protein secondary structures [2,24,32].
Fourier self-deconvolution is a mathematical resolution enhancement method by which the spectrum is divided by the instrumental function to reverse signal distortion in the Fourier domain [4,31,33]. Hence, it pulls apart and sharpens the overlapping hidden peaks. However, deconvolution can only be applied if the peaks are broader than the instrumental resolution [27]. In general, the deconvolution is an unstable numerical process that can produce hundreds or thousands of new peaks that are not real, a phenomenon known as overdeconvolution [27,31]. Therefore, precautions need to be taken while doing deconvolution as it might distort and destroy the original spectral data. Second derivative analysis can be used as a guide in the deconvolution process to distinguish the real peaks.
Derivative spectroscopy involves the generation of the nth derivative of the original spectrum. While the first order derivative visualizes the rate of intensity change with respect to the wavenumber of an FTIR spectrum, the second derivative contains information on the change of this rate (slope) of the spectrum [6]. The presence of overlapping peaks and shoulders affects the change in the slope of the spectrum; which explains why studying the second derivative is a perfect tool to unveil overlapping features [27]. A minimum in the second derivative of a spectrum corresponds to a local maximum in the original spectrum [27]. Furthermore, the area under the second derivative peaks is proportional to the area of the corresponding peak in the original spectrum [27]. Thus, derivative spectroscopy can theoretically also be used for quantitative analysis. However, one has to keep in mind that the derivatives are especially sensitive to noise in the original spectrum. It is, hence, of utmost importance to have a good signal-to-noise ratio in the original spectra [27]. Alternatively, one can use smoothing techniques to reduce the noise level. One of such smoothing techniques is the Savitsky–Golay algorithm [27,31]. Several papers have used the second derivative analysis to estimate the contribution of each secondary structure in protein solutions [2,5,23]. However, the accurate measurements of the contribution of each secondary structure to the amide I band using this method have been elusive.
Band curve-fitting was used in this paper to calculate quantitatively the area of each secondary structure [2,5,20,21,22], which is basically a three step process: (i) having a good initial idea about the physical state (i.e., hydration level) of your system to identify potential hidden overlapping peaks, (ii) using derivative spectroscopy in order to locate the overlapping hidden peaks [31,34], and finally (iii) curve fitting of the experimental spectrum by a function which is the sum of the individual peaks [31].
The goal of this paper is to describe a solid method for measuring and analyzing the spectral data to study protein secondary structures in high moisture matrices using vibrational spectroscopy techniques. For this purpose, a range of standard proteins with well-known secondary structures were analyzed in order to develop and test the method. Hydrated zein and gluten samples were then measured with the described method of data analysis. FT-Raman is used as a complementary technique to FTIR to study the protein secondary structures. The interference of water with the amide I band signal of proteins is minimized in FT-Raman analysis and, in contrast to what is done on FTIR data, no water subtraction is needed prior to peak fitting of the resulting Raman spectra.

2. Materials and Methods

2.1. Materials

Immunoglobulin G (bovine, I-5506), concanavalin A (jack bean, C-2010), lysozyme (chicken egg white, L-6876), and trypsin (bovine pancreas, T-8253) were purchased from Sigma Aldrich (St. Louis, MO, USA). Zein from maize was obtained from Flo Chemical Corp (Ashburnham, MA, USA), while the commercial gluten flour was purchased from a local market (Bulk Barn, Guelph, ON, Canada).

2.2. Sample Preparation

All reference protein samples were measured as 5.0% (w/v) aqueous solutions at pH 6.5 for FTIR analysis and 20% (w/v) for FT-Raman analysis. The hydrated zein and gluten samples were prepared by mixing each protein (20 g) with 75 g water for 5 min using a 100 g pin mixer. The hydrated zein was mixed at 40 °C in order to reach its glass transition temperature (Tg).

2.3. Attenuated Total Reflectance (ATR) FTIR Spectroscopy

A Vertex 70 series spectrophotometer (Bruker Optics, Billerica, MA, USA) was used to study secondary structure of the proteins. This spectrometer was equipped with a Bio-ATR Cell II measurement accessory (to study reference protein solutions) and a horizontal multi-reflectance ZnSe crystal accessory (to study hydrated zein and gluten). The instrument housed a deuterated triglycine sulfate (DTgS) detector and a KBr beam splitter. The spectra of proteins were collected in the 800–3000 cm−1 region at room temperature using 4 cm−1 resolution. An aperture diameter of 8 and 6 mm, and number of scans of 128 and 32 were used for reference proteins, and hydrated zein and gluten, respectively. A common problem associated with the accurate measurement of protein infrared spectra is the occurrence of liquid water and water vapor bands in the amide I region due to the presence of water vapor in the radiation path [5]. In order to minimize the presence of water vapor in the system, the internal humidity of the instrument was brought to zero by replacing the desiccants the night before measurement and purging the system with N2 gas during the measurement. The humidity in the instrument was zero during the measurements. The FTIR spectra of the protein solutions and hydrated proteins (sample measurement) and continuous phase (reference measurement) were collected at least in triplicate. All the measured spectra were subjected to a two-step normalization process, vector and offset. The vector normalization is used to correct for the differences in the depth of penetration and calculates the average of the y-value of the spectrum, which then is subtracted from the spectrum. The spectrum is then divided by the square root of the sum of the squares of all y-values. As a result, the spectra are scaled such, that the sum squared deviation over the indicated wavelengths equals one [35]. The offset normalization is performed to correct for the baseline and it shifts the spectrum intensities in such way that the minimum absorbance will equal 0. All the original FTIR spectra shown in the paper are background corrected and normalized. The average of normalized reference spectra (Milli-Q water) was then subtracted from each normalized sample measurement. OPUS software (Bruker Optics, Billerica, MA, USA) was used for spectra acquisition, normalization, and subtraction of the reference spectrum [5]. The data are reported as mean values and standard deviations.

2.4. FT-Raman Measurement

The FT-Raman spectra of proteins were recorded using a Bruker FRA 106/s module (Bruker, Billerica, MA, USA) on a Bruker IFS66vs FT-Raman spectrometer (Billerica, MA, USA) with excitation at 1064 nm and 2 cm−1 resolution in 180° backscattering geometry. A total of 4000 scans for zein and gluten and 1000 scans for reference proteins were recorded between 1800 and 1100 cm−1 using a laser power of 525 mW. Hydrated zein and gluten samples were packed in a standard 2 mm cavity cell. The reference proteins solutions were measured in quartz cuvettes (10 mm path length). The baseline correction was conducted with a 5 point Savitsky–Golay function. All the measurements were conducted in duplicate. The data are reported as mean values and standard deviations.

2.5. Peak Fitting

The spectra were analyzed using OriginPro 2019 (OriginLab Corporation, Northampton, MA, USA). Peak analyzer (using the Levenberg-Marquardt algorithm) was used to perform non-linear fitting of the peaks in the spectral data. Baseline corrections were performed using a second derivative (zeroes) method for finding anchor points and detecting the baseline. Hidden peaks were also detected using a second derivative method followed by smoothing with the 7–9 point Savitsky–Golay function with polynomial order of 2.
The peak fitting was then performed using the Voigt function which is the convolution of a Gaussian function and a Lorentzian function [36] (Equation (1)); where y0 = offset, xc = center, A = area, WG = Gaussian full width at half maxima (FWHM), WL = Lorentzian FWHM, t = wavenumber, n = number of peaks.
y   =   y 0   +   1 n A 2 l n 2 π 3 / 2   W L W G 2 e t 2 l n 2 W L W G 2   +   4 l n 2 x x c W G 2 d t
The baseline, peak center, peak width parameters were fixed and released during fitting to help with initializing the parameters. The iteration procedure was stopped when the best fit was achieved (reduced chi-square < 1 × 10⁻⁶). The residual data plots have been obtained for all the curve fittings and are shown in supplementary data files. All the secondary structural content was estimated by dividing the areas under the bands assigned to specific secondary structures by the total secondary structure area under the amide I band and reported as a percentage.

3. Results

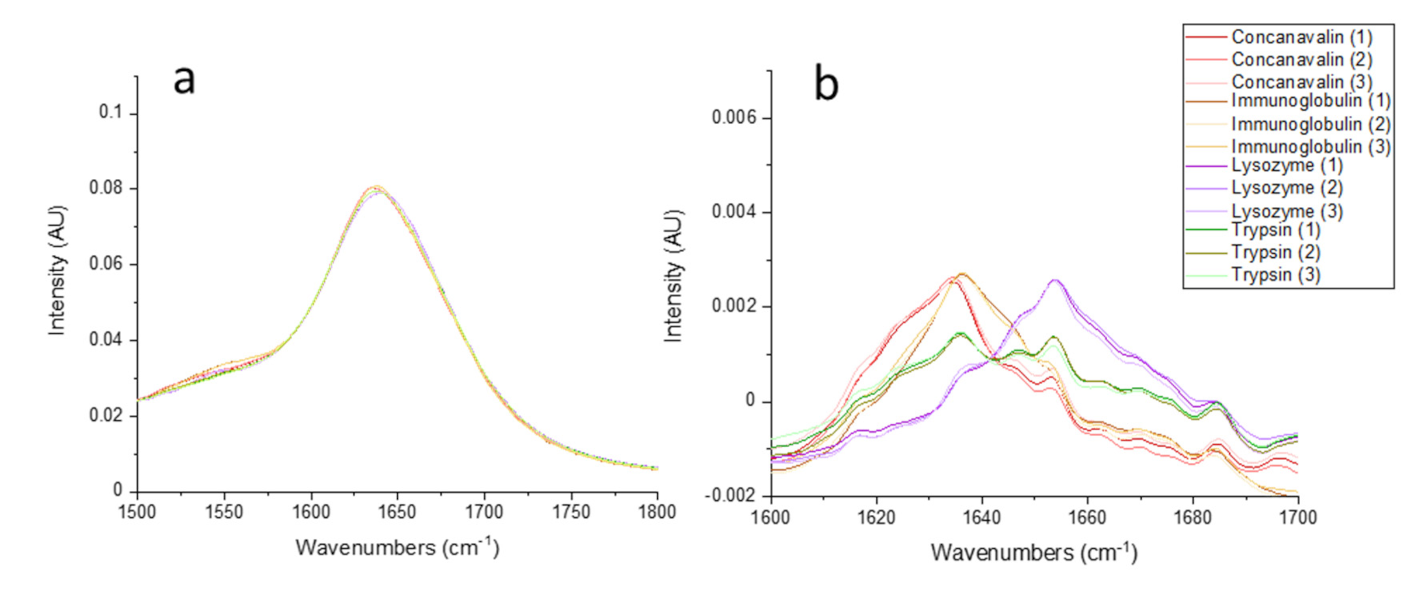
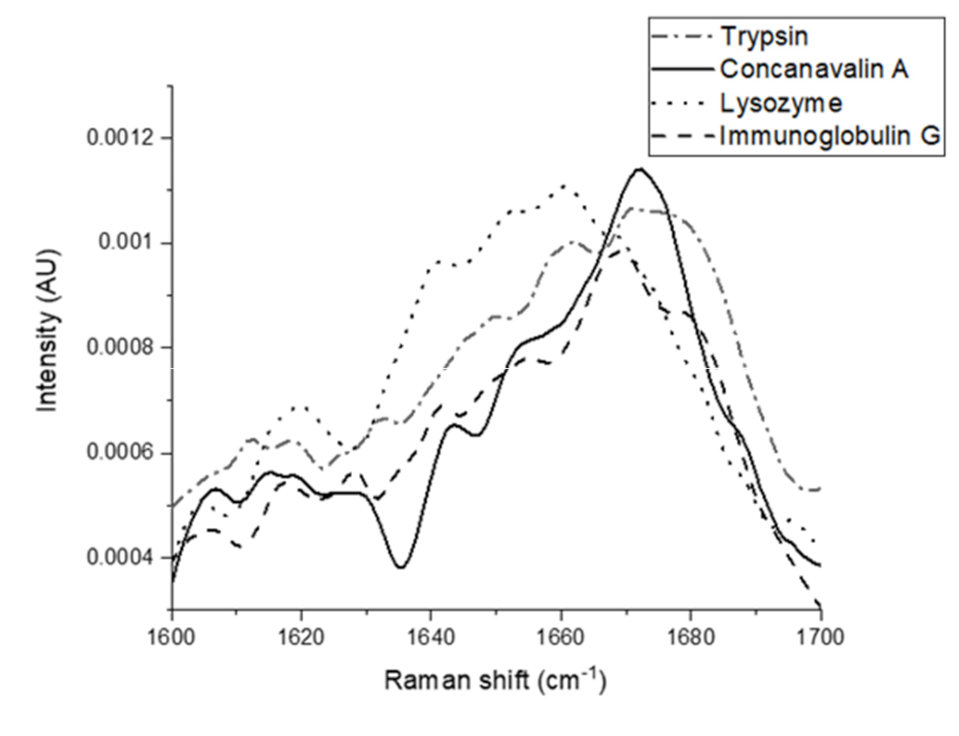
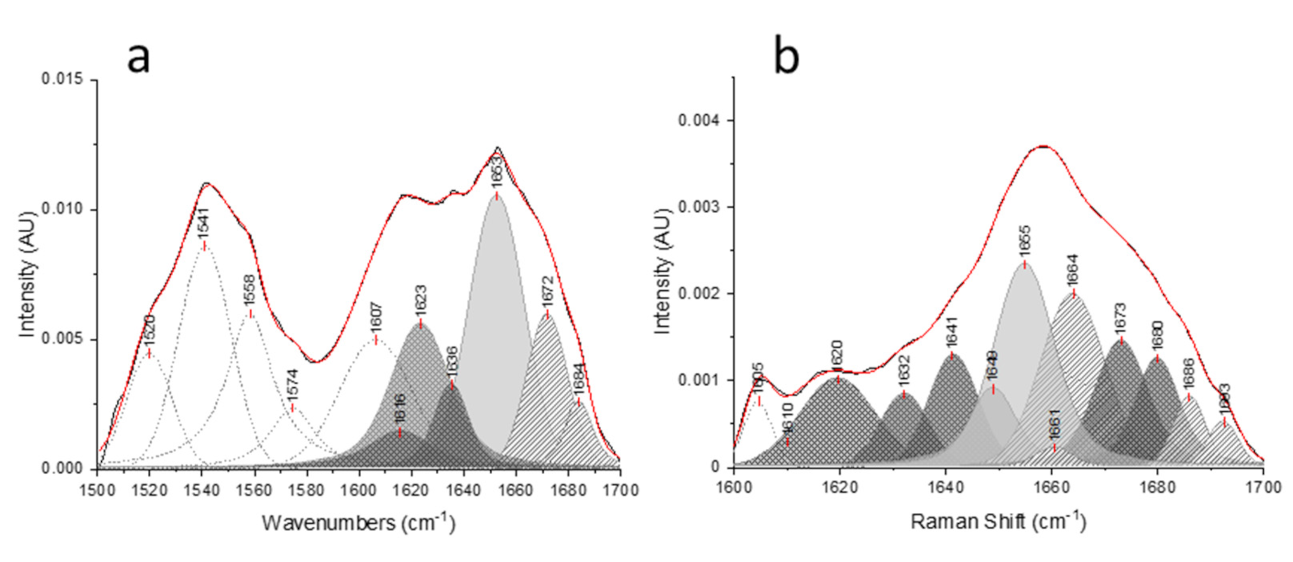
3.1. Secondary Structure Estimation for Standard Proteins

The infrared spectra of four native proteins (concanavalin A, immunoglobulin G, lysozyme, and trypsin) were investigated. Samples were allowed to stir for an hour at room temperature before recording the spectra in order to dissolve and hydrate completely.
The FTIR spectrum of pure water was subtracted from the spectra of the protein solutions. Figure 1a shows the FTIR spectrum of the standard protein solutions. All proteins show a similar peak around 1636 cm−1, which does not seem to give specific information about their secondary structure. However, after subtracting the reference water spectrum from the protein spectra (Figure 1b), a more distinct spectrum with individual peaks appeared for each protein.
The individual underlying secondary structure components cannot be readily observed in the amide I band (Figure 1). This is because the width of the different component bands is larger than the separation between the individual component bands peaks [37]. Thus, the second derivative of the spectrum was used as a band narrowing/peak sharpening method to identify hidden peaks. By performing peak fitting on water-subtracted spectra according to the analysis described in the Materials and Methods section, the overlapping hidden peaks were identified and reconstructed. The overall curve fitted and the second derivative of the concanavalin A spectrum are shown in Figure 2. The spectrum exhibits several discrete peaks in the amide I region. The minimum of the peaks in the second derivative spectrum corresponds to the maximum of the hidden absorbance peaks on the water-subtracted spectrum. The curve fitted and second derivative spectra of the other standard proteins are included in the Figures S1-1–S1-16). The curve fitted plots of three replications of each standard protein illustrated the high reproducibility between the replicates (Figures S1-1–S1-16).
The characteristic mean absorption bands of the secondary structures in proteins are indicated in Table 1. The secondary structures were estimated from (the sum of) the relative area of the peaks centered at these absorption frequencies [5,6].
The relative amount of each secondary structure of the proteins (Table 2) is calculated from the area under the (hidden) peaks in the original spectra assigned to specific secondary structures. The component centered between 1650–1659 cm−1 has been assigned to the α-helix secondary structure. Bands in the region of 1610–1642 cm−1 are usually assigned to β-sheet structure [5,19]. The random coil conformation shows IR bands around 1643 and 1649 cm−1 [19]. Upon peak fitting, four hidden bands between 1610–1640 cm−1 appeared in the infrared spectrum of concanavalin A and immunoglobulin A which were all assigned to β-sheet secondary structures [5]. The water-subtracted spectra of concanavalin A and immunoglobulin G (Figure 1b) exhibited a very strong amide I band maxima near 1636 cm−1 reflecting their high β-sheet content confirmed by X-ray studies [40,41]. The peak at about 1636 cm−1 was the major hidden band observed in immunoglobulin G and concanavalin A spectra, corresponding to 54% and 29% of the total amide I band area, respectively. Trypsin also showed a dominant band at 1636 cm−1 comprising 70% of the total β-sheet content of the secondary structure. It also had 29 ± 2% β-turn structure based on the bands in 1660–1699 cm−1 region. The water-subtracted infrared spectra of lysozyme showed a relatively narrow amide I band with a maximum near 1654 cm−1, which is the characteristic of proteins with a large content of α-helical secondary structure [19,23] (Figure 3). After curve fitting, lysozyme had a distinct α-helical component of 46% at the 1654 cm−1 band position.
FT-Raman spectra of the same reference proteins were collected to complement the FTIR data. For this purpose, the 20% w/v protein aqueous solutions were prepared and were allowed to stir for an hour at room temperature before measurement. The protein solutions were prepared at higher concentration for FT-Raman since FT-Raman spectra are characterized by a lower signal to noise ratio compared with FTIR. The FT-Raman spectra of standard proteins were then subjected to 15-point Savitsky–Golay smoothing to increase the signal to noise ratio. The original FT-Raman spectra of standard proteins in aqueous solutions show that water does not heavily distort the Raman spectra (Figure 4). Water only shows a very weak Raman signal in the amide I region, making subtraction of the water spectrum redundant. Thus, the FT-Raman spectra of the proteins were not subjected to water subtraction.
The curve fitted plots from the FT-Raman profiles show the presence of different components in the amide I region (Figure 5). The regions between 1649 and 1660 cm−1, and 1660 and 1665 cm−1 are attributed to α-helix and random coil structures, respectively. The region between 1620 and 1647 cm−1, and 1665 and 1680 cm−1 are signature regions for β-sheet structures [43,44], while bands centered between 1680 and 1699 cm−1 are assigned to β-turn structures. The quantitative analysis of the area under each FTIR band revealed very similar and consistent results to the quantitative analysis of the FT-Raman bands (Table 2). Lysozyme exhibited a dominant α-helical component around 1654 cm−1 (Figure 5) corresponding to 42% of its total secondary structural content. Both concanavalin A and immunoglobulin G showed a major band at about 1669 cm−1 (30% of the total amide I band), which was assigned to β-sheet secondary structures. Peak fitting of the amide I band of trypsin also produced distinct components at 12 wavenumber values (Figure 5). β-sheet was the dominant secondary structure of trypsin as was also observed in its FTIR spectrum.
Goodness-of-fit tests were used to assess all peak fittings. By performing the nonlinear curve fitting, the reduced chi-square is minimized in the iteration process to obtain the optimal parameter values. The reduced chi-square is obtained by dividing the residual sum of square (RSS) by the degrees of freedom (DOF). It measures the deviation between the model (fitted curve) and observed data (original spectrum). Thus, the smaller the reduced chi-square is, the better the fit is. However, this assessment is not a good enough measure to determine the goodness-of-fit as adding more parameters in the model will inherently reduce the chi-square, while, the added parameters might not be justified for the given dataset. R2 value (also known as coefficient of determination) is another measure of the goodness-of-fit. The closer the fitted value is to the actual data point, the closer R2 will be to the value of 1. This will be achieved by introducing more parameters and does, hence, also not imply a better fit. The adjusted R2 can be a better measure of goodness-of fit as it also penalizes for the number of model parameters. The reduced chi-square, R2, and adjusted R2 are reported for each peak fitting in the Tables S1-1–S1-16) and Tables S2-1–S2-10.

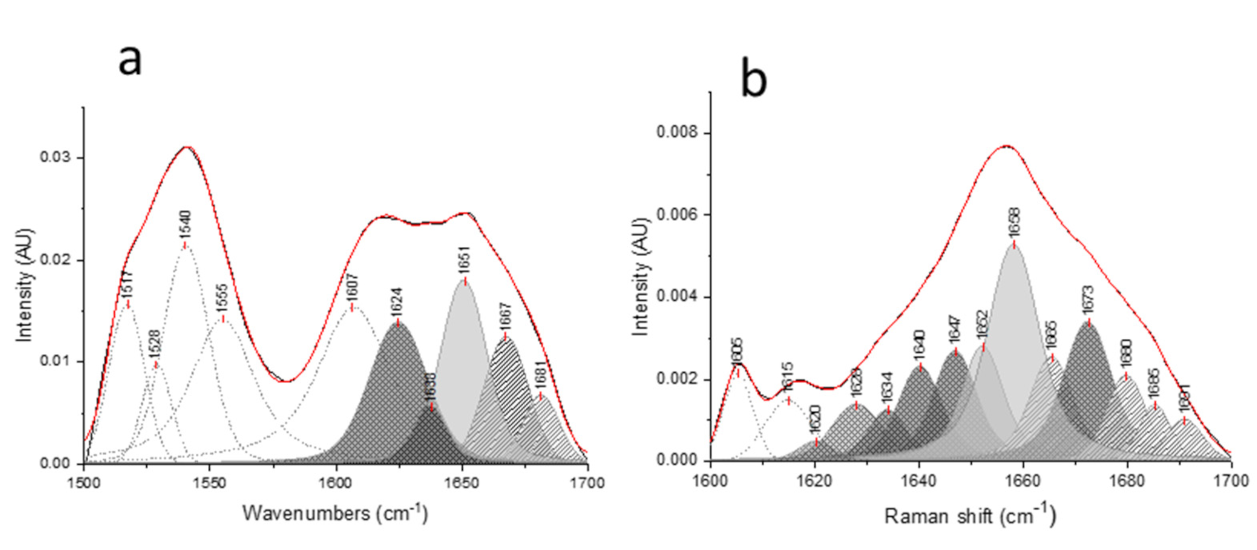
3.2. Secondary Structure Estimation for Gluten and Zein

In the present study, the secondary structure of gluten was studied after hydration and mixing for 5 min. The measurement and data analysis were conducted based on the method described and tested on the reference proteins. For FTIR spectra of gluten and zein, a wider range (1500–1700 cm−1) has been selected to perform peak fitting in order to do a proper baseline correction. However, the amide II band has not been subjected to the quantitative analysis because of its less protein conformational sensitivity compared with amide I [6]. Nevertheless, the peaks at 1540, 1545, and 1551 cm−1 are usually assigned to α-helical structure, while the peaks at 1520 to 1525 cm−1 are assigned to β-sheet secondary structures [45].
The curve fitted spectra obtained from three replicates of hydrated gluten samples show good reproducibility (Figures S2-1–S2-10). The relative secondary structure contents of hydrated gluten were estimated from peak fitting of both FTIR and FT-Raman results. The percentage of α-helix, β-sheet, β-turn, and random coil structures are 36 ± 1, 42 ± 1, 22 ± 0, and 0 ± 0%, respectively, as obtained from FTIR analysis. This data was consistent with the FT-Raman results that indicate the presence of 36 ± 5, 48 ± 6, 22 ± 7, and 0 ± 0% α-helix, β-sheet, β-turn, and random coil structure, respectively. The FT-Raman spectra of gluten (Figure 6) shows 10 major bands related to secondary structure. The bands at 1632, 1641, 1673, and 1680 cm−1 are assigned to β-sheet secondary structures, while those centered at 1664, 1686, and 1693 cm−1 are originating from β-turn secondary structures. The α-helix bands were centered at 1649 and 1655 cm−1. The three low frequency bands near 1604 and 1609 cm−1 do not contribute to the secondary structure and are related to aromatic side chain of amino acids [46].
The secondary structure of zein was also investigated after hydration and mixing with water for 5 min at 40 °C (Figure 7). The amount of α-helix, β-sheet, β-turn, and random coil were 34 ± 2, 42 ± 4, 24 ± 4, and 0 ± 0%, respectively, based on FTIR measurements. These data matched well with FT-Raman results showing 36 ± 2, 45 ± 2, 18 ± 4, and 0 ± 0% of α-helix, β-sheet, β-turn, and random coil, respectively. The reduced chi-square, R2, and adjusted R2 of gluten and zein peak fittings were calculated to assess the goodness of fit. The R2 and adjusted-R2 values were > 0.99 for all peak fittings indicating that the fitted values are close to the actual data points (Tables S2-1–S2-10). The chi-square value was reduced to less than 1E-6 and the fit was completely converged in all curve-fittings.

4. Discussion

As mentioned earlier, the amide I band in FTIR spectra is mainly composed of C=O stretching (around 80%) [37] and, to a lesser extent, NH bending vibrations. The exact location of these vibrations depends on the hydrogen bonds these C=O form with proximate NH groups [19]. The secondary structure of a protein determines with which NH group hydrogen bonds will be formed, turning the vibrational spectra into fingerprints of the secondary structure [6]. The secondary structure of a protein backbone is considered as the linear sum of some fundamental secondary structural elements (α-helix, β-sheet, β-turn, and random coil) [6]. The percentage of each secondary structure is only related to their spectral intensity since the molar absorptivity of C=O stretching vibration for all secondary structural elements is essentially the same [6].
As stated above, the secondary structure of four standard proteins was investigated by both FTIR and FT-Raman. These proteins were chosen because of their known three-dimensional structures that have been extensively studied by circular dichroism [8,9], FTIR [5], Raman spectroscopy [47], and X-ray crystallography [42,48]. Inspection of the FTIR spectra showed that while the amide I band shows the same peak position in original spectra, the band shapes were quite different after water subtraction (Figure 1). This shows the necessity of the water subtraction for FTIR spectra since the broad and intense peak of water overlapping with the amide I region makes the protein fingerprint peaks difficult to distinguish [27]. Conversely, FT-Raman spectra were not subjected to water subtraction due to the weak signal of OH stretching vibration (of water) in the Raman amide I region [29].
Curve fitting was done (Figure 3) to analyse the FTIR spectra in a quantitative way. The relative amounts of each secondary structure of the four proteins calculated as outlined above were consistent with the relative amounts reported in previous FTIR [5], circular dichroism [9], and X-ray crystallography [42] studies. Concanavalin A is often used as a reference protein for FTIR analysis since it is known for its high content of β-sheet structure. The curve-fitted spectrum of concanavalin A showed a peak maximum around 1636 cm−1 corresponding to the antiparallel intramolecular β-sheet conformation which is the main secondary structural component in concanavalin A [37,49]. An intense band was also observed at 1626 cm−1, which is associated to the intermolecular β-sheets with stronger hydrogen bonds. It has been proposed that this band comes from the so-called “distorted β-type structures” that are formed by peptide residues located at the end of the main strands of the β-sheets [37]. The band around 1618 cm−1 is also attributed to intermolecular β-sheets with strong H-bonds [49]. It is worthy to note in this context that a stronger hydrogen bond will lead to a lower C=O stretching frequency [50].
The band assignment of protein secondary structures is further complicated by absorption of amino acid side chains in the protein structures [38]. This absorption is superimposed on the amide I and II bands absorption (Table 3) and contributes 10 to 20% of the overall absorption of globular proteins in the amide I and II regions [6,20,21]. Aromatic side chains of amino acids also contribute to the FT-Raman amide I and II regions. In particular, tyrosine, phenylalanine, and tryptophan show overlapping peaks at about 1618, 1585, and 1609 cm−1, respectively [49,50]. The 1615–1618 cm−1 peaks observed in FTIR spectra of the proteins, which are assigned to intermolecular β-sheet, is due to the tyrosine aromatic side chains in the FT-Raman spectra. The bands at about 1605 and 1616 cm−1 were present in all reference protein FT-Raman spectra (Figure 5) and correspond to the ring vibrations from aromatic residues. These bands were not included in the quantitative analysis of the FT-Raman results; only the area under the peaks present between 1620 and 1699 cm−1 region were studied for the FT-Raman analysis of the protein secondary structure.
In addition to the structural analysis of the reference proteins, the secondary structure of gluten and zein proteins was also investigated by both FTIR and FT-Raman spectroscopy using the same analysis method optimized for the reference proteins. Similar to the procedure for reference proteins, the pure liquid water spectrum was subtracted from the FTIR spectra of zein and gluten. Other approaches to correct for water for the hydrated states of gluten proteins have already been explored such as using spectra of H2O-D2O mixtures as the correcting spectra [18]. However, the bending frequency of HDO (Deuterium hydrogen oxide) coincides with the amide II band, which makes its analysis virtually impossible [1]. In addition, the change in the shape of the amide II band as a result of HDO signal can affect the peak fitting of the amide I since it can change the baseline of the spectrum. Therefore, the pure water spectrum was subtracted from the zein and gluten FTIR spectra in this study.
Gluten proteins are typically classified into two major sub-groups: glutenins and gliadins [52]. The ‘monomeric’ gliadins, which are imparting viscosity in a viscoelastic gluten network, are often described to be built as a three domain structure: a short N-terminal domain, a repetitive central domain rich in glutamine and proline, and a non-repetitive C-terminal domain rich in sulfur containing amino acids. According to previous reports, the N-and C-terminal domains are rich in α-helix structures, while the central domain mainly adopts β-turn secondary structures in hydrated gluten [52,53]. The glutenin macropolymers have a similar three domain structure. In hydrated gluten, the glutenin central domain comprises mainly β-turn secondary structures forming β-spiral super secondary structures [53]. The β-spirals are assumed to contribute to the intrinsic elasticity of a viscoelastic gluten network [54]. Based on the loop and train model proposed by Belton [55], β-turn structures are present in the loop regions (water-protein interactions) while the intermolecular β-sheets are dominating the train regions (protein-protein interactions). It seems that the interchain β-sheet structures are formed at the expense of β-turns [18]. The intermolecular β-sheet structure showed two signature peaks at 1616 and 1623 cm−1 [49], corresponding to 36% of the total amide I band. As mentioned earlier, this strong short wavenumber peak (1616 cm−1) is specifically due to the β-sheets with stronger hydrogen bonds [37,49], and its presence shows the formation of high amount of intermolecular β-sheets upon hydration and mixing of gluten. The formation of intermolecular β-sheets has been also attributed to the association of high molecular weight (HMW) glutenin subunits [56]. Zein proteins lack the HMW glutenin subunit-type structures [57] which can explain the absence of 1616 cm−1 hidden band in the zein FTIR spectra (Figure 7a) compared with gluten FTIR spectra (Figure 6a). Similarly, the band at 1620 cm−1 in FT-Raman spectra is also assigned to intermolecular hydrogen-bonded β-sheets [58] which is more pronounced in hydrated gluten FT-Raman spectra (Figure 6b) compared with what is observed for hydrated zein (Figure 7b). In addition, the absorption band at 1636 cm−1 is characteristic of amide groups involved in the extended β-sheets in the gluten network [59]. The appearance of this band has been attributed to kneading and stretching processes [59].
The gluten in its unhydrated state (9% moisture content) has been reported to contain 39% β-sheet, 30% random coil, 17% α-helix, and 14% β-turn structure [18]. Therefore, β-sheet and random coil are the main secondary structural elements of gluten at low moisture contents. Upon hydration (up to 50% w/w), Bock and Damodaran [18] reported an increase in β-turn (from 14 to 65%) at the expense of decrease in β-sheet and random coil structure. They suggested that the β-turn is the preferred secondary structure of gluten in its hydrated state. These results are not in line with our results as β-sheets are found to be the dominating secondary structures in the here studied hydrated gluten samples. However, the systems studied by Bock and Damodaran [18] were completely different compared with the here studied gluten-only samples. The buildup of this high β-sheet content in the hydrated gluten is a result of mechanical input energy during the mixing process [11], which also possibly resulted in the formation of intermolecular β-sheets observed at 1616 and 1623 cm−1 (Figure 6).
Zein proteins are highly hydrophobic. Commercial zein is protein-body-free and mainly contains α-zein [60]. Four domains can be distinguished in the α-zein structure: an N-terminal signal sequence, an N-terminal β-turn domain, a domain consisting of nine repeating sequences (flanked by glutamine residues), and a C-terminal domain [61]. The latest model to describe α-zein structure has been proposed by Momany et al. [62]. The proposed complete structure is built of nine α-helix structures, present in a central domain, in addition to an N-terminal segment. According to Shewry and Tatham [63], the secondary structure of α-zein dissolved in aqueous ethanol includes 40–60% α-helix conformations and a small amount of β-sheet structures. When the protein’s temperature is raised above its glass transition temperature (Tg > 35 °C), a reversible change from an α-helix-dominated conformation to more β-sheet structures has been observed imparting viscoelastic properties to zein [57]. α-helix and β-sheet are generally considered “ordered” secondary structures, while β-turn and random coil are considered “unordered” protein secondary structures [64]. The transition from the glassy state to the rubbery state (upon reaching Tg) is accompanied by an increase in ordered protein structures [64]. This can explain the fact that β-sheet and α-helix structures are the dominant structures in the here studied hydrated zein samples mixed at above 40 °C. On the other hand, the unordered β-turn and random coil secondary structures are often linked to protein surface hydrophobicity as these structures facilitate the exposure of hydrophobic residues [65]. It has been suggested that the random coil structure formation is promoted by weakening of hydrogen bonds. Conversely, development of α-helix structures is promoted by protein hydration and the subsequent hydrogen bond formation [64,65]. This might explain the undetectable low levels of random coil structures in the hydrated zein sample. Chen et al. [65] reported a decrease in the percentage of random coil structures to zero by dissolving zein in both ethanol and isopropanol.
The estimation of the contribution of the amino acid side chain groups to the IR absorption spectra, especially when the content of these residues is high, helps a more refined estimation of secondary structure content [6]. The amino acids side chains, which absorb in the amide I region are those of asparagine, glutamine, arginine, lysine, and tyrosine (Table 3). These amino acids account for about 16, 147, 13, 8, and 12 residues/mole of gluten [51] and 10, 41, 2, 0, and 8 residues/mole of α-zein [52], respectively. Previously, researchers [18,21], estimated that these residues contribute about 10 to 20% of the total absorption intensity of the amide I band. Due to the unusually high content of glutamine residues in both zein and gluten, the contribution of glutamine to the amide I band absorption would likely be at the higher end of this estimated range. The presence of several heterogeneous polypeptides in both gluten and zein, however, makes the estimation of side chain contribution to the amide I signal near impossible.

5. Conclusions

Decomposing the amide I band into its separate components is key to a successful FTIR analysis of the protein secondary structure. This has been achieved by different mathematical methods developed during the recent years. In this study, a data analysis technique to explore protein secondary structure through infrared and Raman spectroscopy has been optimized. Both FT-Raman and FTIR data revealed well-defined spectral features with similar secondary structural estimation for the proteins studied. The relative amounts of different secondary structures were determined from band curve fitting and agreement was found between the results derived from FTIR and FT-Raman spectroscopy and literature reports. The present results show the strength of FTIR and FT-Raman as non-invasive techniques to study the conformation of the proteins and provide support for using the amide I infrared and Raman spectra to study protein secondary structures in complex systems. The data obtained by these non-invasive techniques will in the near future provide new insights into the structure of various proteins in complex food systems.

Supplementary Materials

The following are available online at https://www.mdpi.com/2076-3417/10/17/5918/s1, Figures S1-1–S1-16 Curve fitted, second derivative, residual plot, and peak analysis result of FTIR and FT-Raman spectra of all replicate measurements of standard proteins; Tables S1-1–S1-16 Statistical analysis of curve fitting performed on FTIR and FT-Raman spectra of all replicate measurements of standard proteins; Figures S2-1–S2-10 Curve fitted, second derivative, residual plot, and peak analysis result of FTIR and FT-Raman spectra of all replicate measurements of gluten and zein proteins; Tables S2-1–S2-10 Statistical analysis of curve fitting performed on FTIR and FT-Raman spectra of all replicate measurements of gluten and zein proteins.

Author Contributions

Conceptualization, A.S. and I.J.J.; methodology, A.S. and I.J.J.; formal analysis, A.S.; investigation, A.S.; resources, I.J.J.; data curation, A.S. and I.J.J.; writing—original draft preparation, A.S.; writing—review and editing, I.J.J.; visualization, A.S.; supervision, I.J.J.; project administration, I.J.J.; funding acquisition, I.J.J. All authors have read and agreed to the published version of the manuscript.

Funding

Azin Sadat wishes to acknowledge the Ontario Trillium Scholarship for funding her project. This research was funded by the NSERC Discovery Grant program (Canada, RGPIN-2017-05213).

Acknowledgments

The authors would like to thank Leonid Brown for providing the FT-Raman facility and technical assistance in the FT-Raman measurements and Paul Rowntree for providing technical and scientific assistance in the FTIR measurement and data analyzation.

Conflicts of Interest

The authors declare no conflict of interest.

References

  1. Susi, H. [22] Infrared spectroscopy—Conformation. In Methods in Enzymology; Elsevier: Amsterdam, The Netherlands, 1972; Volume 26, pp. 455–472. [Google Scholar]
  2. Susi, H.; Byler, D.M. [13] Resolution-enhanced fourier transform infrared spectroscopy of enzymes. In Bioluminescence and Chemiluminescence; Elsevier: Amsterdam, The Netherlands, 1986; Volume 130, pp. 290–311. [Google Scholar]
  3. Elliott, A.; Ambrose, E.J. Evidence of chain folding in polypeptides and proteins. Discuss. Faraday Soc. 1950, 9, 246–251. [Google Scholar] [CrossRef]
  4. Surewicz, W.K.; Mantsch, H.H. New insight into protein secondary structure from resolution-enhanced infrared spectra. Biochim. Biophys. Acta (BBA) Protein Struct. Mol. Enzym. 1988, 952, 115–130. [Google Scholar] [CrossRef]
  5. Dong, A.; Huang, P.; Caughey, W.S. Protein secondary structures in water from second-derivative amide I infrared spectra. Biochemistry 1990, 29, 3303–3308. [Google Scholar] [CrossRef]
  6. Kong, J.; Yu, S. Fourier transform infrared spectroscopic analysis of protein secondary structures. Acta Biochim. Biophys. Sin. 2007, 39, 549–559. [Google Scholar] [CrossRef] [PubMed] [Green Version]
  7. Chang, C.T.; Wu, C.-S.C.; Yang, J.T. Circular dichroic analysis of protein conformation: Inclusion of the β-turns. Anal. Biochem. 1978, 91, 13–31. [Google Scholar] [CrossRef]
  8. Provencher, S.W.; Gloeckner, J. Estimation of globular protein secondary structure from circular dichroism. Biochemistry 1981, 20, 33–37. [Google Scholar] [CrossRef]
  9. Hennessey, J.P.; Johnson, W.C. Information content in the circular dichroism of proteins. Biochemistry 1981, 20, 1085–1094. [Google Scholar] [CrossRef]
  10. Sadat, A.; Corradini, M.G.; Joye, I. Molecular spectroscopy to assess protein structures within cereal systems. Curr. Opin. Food Sci. 2019, 25, 42–51. [Google Scholar] [CrossRef]
  11. Wellner, N.; Mills, E.N.C.; Brownsey, G.; Wilson, R.H.; Brown, N.A.; Freeman, J.; Halford, N.G.; Shewry, P.R.; Belton, P.S. Changes in Protein Secondary Structure during Gluten Deformation Studied by Dynamic Fourier Transform Infrared Spectroscopy. Biomacromolecules 2005, 6, 255–261. [Google Scholar] [CrossRef]
  12. Li, W.; Dobraszczyk, B.J.; Dias, A.; Gil, A.M. Polymer Conformation Structure of Wheat Proteins and Gluten Subfractions Revealed by ATR-FTIR. Cereal Chem. J. 2006, 83, 407–410. [Google Scholar] [CrossRef]
  13. Robertson, G.H.; Gregorski, K.S.; Cao, T.K. Changes in Secondary Protein Structures During Mixing Development of High Absorption (90%) Flour and Water Mixtures. Cereal Chem. J. 2006, 83, 136–142. [Google Scholar] [CrossRef] [Green Version]
  14. Jazaeri, S.; Bock, J.E.; Bagagli, M.P.; Iametti, S.; Bonomi, F.; Seetharaman, K. Structural Modifications of Gluten Proteins in Strong and Weak Wheat Dough During Mixing. Cereal Chem. J. 2015, 92, 105–113. [Google Scholar] [CrossRef]
  15. Bagagli, M.P.; Jazaeri, S.; Bock, J.E.; Seetharaman, K.; Sato, H.H. Effect of Transglutaminase, Citrate Buffer, and Temperature on a Soft Wheat Flour Dough System. Cereal Chem. J. 2014, 91, 460–465. [Google Scholar] [CrossRef]
  16. Georget, D.M.R.; Belton, P.S. Effects of Temperature and Water Content on the Secondary Structure of Wheat Gluten Studied by FTIR Spectroscopy. Biomacromolecules 2006, 7, 469–475. [Google Scholar] [CrossRef]
  17. Belton, P.; Colquhoun, I.; Grant, A.; Wellner, N.; Field, J.; Shewry, P.; Tatham, A. FTIR and NMR studies on the hydration of a high-Mr subunit of glutenin. Int. J. Boil. Macromol. 1995, 17, 74–80. [Google Scholar] [CrossRef]
  18. Bock, J.E.; Damodaran, S. Bran-induced changes in water structure and gluten conformation in model gluten dough studied by Fourier transform infrared spectroscopy. Food Hydrocoll. 2013, 31, 146–155. [Google Scholar] [CrossRef]
  19. Krimm, S.; Bandekar, J. Vibrational Spectroscopy and Conformation of Peptides, Polypeptides, and Proteins. In Cytokines; Elsevier: Amsterdam, The Netherlands, 1986; Volume 38, pp. 181–364. [Google Scholar]
  20. Venyaminov, S.Y.; Kalnin, N.N. Quantitative IR Spectrophotometry of Peptide Compounds in Water (H2O) Solutions. II. Amide Absorption Bands of Polypeptides and Fibrous Proteins in A-, B-, and Random Coil Conformations. Biopolym. Orig. Res. Biomol. 1990, 30, 1259–1271. [Google Scholar] [CrossRef]
  21. Venyaminov, S.Y.; Kalnin, N.N. Quantitative IR spectrophotometry of peptide compounds in water (H2O) solutions. I. Spectral parameters of amino acid residue absorption bands. Biopolym. Orig. Res. Biomol. 1990, 30, 1243–1257. [Google Scholar] [CrossRef]
  22. Kalnin, N.N.; Baikalov, I.A.; Venyaminov, S.Y. Quantitative IR Spectrophotometry of Peptide Compounds in Water (H2O) Solutions. III. Estimation of the Protein Secondary Structure. Biopolym. Orig. Res. Biomol. 1990, 30, 1273–1280. [Google Scholar] [CrossRef]
  23. Byler, D.M.; Susi, H. Examination of the secondary structure of proteins by deconvolved FTIR spectra. Biopolym. Orig. Res. Biomol. 1986, 25, 469–487. [Google Scholar] [CrossRef]
  24. Susi, H.; Byler, D.M. Protein structure by Fourier transform infrared spectroscopy: Second derivative spectra. Biochem. Biophys. Res. Commun. 1983, 115, 391–397. [Google Scholar] [CrossRef]
  25. Cioni, P.; Strambini, G.B. Effect of Heavy Water on Protein Flexibility. Biophys. J. 2002, 82, 3246–3253. [Google Scholar] [CrossRef] [Green Version]
  26. Efimova, Y.M.; Haemers, S.; Wierczinski, B.; Norde, W.; Van Well, A. Stability of globular proteins in H2O and D2O. Biopolym. Orig. Res. Biomol. 2007, 85, 264–273. [Google Scholar] [CrossRef] [PubMed]
  27. Smith, B.C. Fundamentals of Fourier Transform Infrared Spectroscopy; CRC Press: Boca Raton, FL, USA, 2011. [Google Scholar]
  28. Ma, C.-Y.; Phillips, D.L. FT-Raman Spectroscopy and Its Applications in Cereal Science. Cereal Chem. J. 2002, 79, 171–177. [Google Scholar] [CrossRef]
  29. Thygesen, L.G.; Løkke, M.M.; Micklander, E.; Engelsen, S.B. Vibrational microspectroscopy of food. Raman vs. FT-IR. Trends Food Sci. Technol. 2003, 14, 50–57. [Google Scholar] [CrossRef]
  30. Lórenz-Fonfría, V.; Padrós, E.; Lórenz-Fonfría, V.A.; Padrós, E. Maximum Entropy Deconvolution of Infrared Spectra: Use of a Novel Entropy Expression without Sign Restriction. Appl. Spectrosc. 2005, 59, 474–486. [Google Scholar] [CrossRef]
  31. DeAragao, B.J.G.; Messaddeq, Y. Peak separation by derivative spectroscopy applied to ftir analysis of hydrolized silica. J. Braz. Chem. Soc. 2008, 19, 1582–1594. [Google Scholar] [CrossRef]
  32. Dong, A.; Malecki, J.M.; Lee, L.; Carpenter, J.F.; Lee, J.C. Ligand-Induced Conformational and Structural Dynamics Changes inEscherichia coliCyclic AMP Receptor Protein†. Biochemistry 2002, 41, 6660–6667. [Google Scholar] [CrossRef]
  33. Kauppinen, J.K.; Moffatt, D.J.; Mantsch, H.H.; Cameron, D.G. Fourier Self-Deconvolution: A Method for Resolving Intrinsically Overlapped Bands. Appl. Spectrosc. 1981, 35, 271–276. [Google Scholar] [CrossRef]
  34. Rodionova, O.Y.; Brereton, R.G. Chemometrics: Data Analysis for the Laboratory and Chemical Plant, Chichester: Wiley, 2003, 489 pp. J. Anal. Chem. 2005, 60, 994–996. [Google Scholar] [CrossRef]
  35. Gautam, R.; Vanga, S.; Ariese, F.; Umapathy, S. Review of multidimensional data processing approaches for Raman and infrared spectroscopy. EPJ Tech. Instrum. 2015, 2, 1–38. [Google Scholar] [CrossRef] [Green Version]
  36. Di Rocco, H.O.; Iriarte, D.I.; Pomarico, J. General Expression for the Voigt Function That is of Special Interest for Applied Spectroscopy. Appl. Spectrosc. 2001, 55, 822–826. [Google Scholar] [CrossRef]
  37. Arrondo, J.L.; Young, N.; Mantsch, H. The solution structure of concanavalin A probed by FT-IR spectroscopy. Biochim. Biophys. Acta (BBA) Protein Struct. Mol. Enzym. 1988, 952, 261–268. [Google Scholar] [CrossRef]
  38. Shewry, P.R.; Lookhart, G.L. Wheat Gluten Protein Analysis; American Association of Cereal Chemists: Saint Paul, MN, USA, 2003. [Google Scholar]
  39. Ngarize, S.; Herman, H.; Adams, A.; Howell, N. Comparison of Changes in the Secondary Structure of Unheated, Heated, and High-Pressure-Treated β-Lactoglobulin and Ovalbumin Proteins Using Fourier Transform Raman Spectroscopy and Self-Deconvolution. J. Agric. Food Chem. 2004, 52, 6470–6477. [Google Scholar] [CrossRef] [PubMed]
  40. Levitt, M.; Chothia, C. Structural patterns in globular proteins. Nature 1976, 261, 552–558. [Google Scholar] [CrossRef]
  41. Richardson, J.S. The Anatomy and Taxonomy of Protein Structure. In Advances in Protein Chemistry; Elsevier: Amsterdam, The Netherlands, 1981; Volume 34, pp. 167–339. [Google Scholar]
  42. Levitt, M.; Greer, J. Automatic identification of secondary structure in globular proteins. J. Mol. Boil. 1977, 114, 181–239. [Google Scholar] [CrossRef]
  43. Wellner, N.; Belton, P.S.; Tatham, A.S. Fourier transform IR spectroscopic study of hydration-induced structure changes in the solid state of ω-gliadins. Biochem. J. 1996, 319, 741–747. [Google Scholar] [CrossRef]
  44. Pézolet, M.; Bonenfant, S.; Dousseau, F.; Popineau, Y. Conformation of wheat gluten proteins Comparison between functional and solution states as determined by infrared spectroscopy. FEBS Lett. 1992, 299, 247–250. [Google Scholar] [CrossRef] [Green Version]
  45. Aboul-Enein, Y.; Bunaciu, A.A.; Fleschin, S. Evaluation of the Protein Secondary Structures Using Fourier Transform Infrared Spectroscopy. Gazi Univ. J. Sci. 2014, 27, 637–644. [Google Scholar]
  46. Susi, H.; Byler, D.M. Fourier Deconvolution of the Amide I Raman Band of Proteins as Related to Conformation. Appl. Spectrosc. 1988, 42, 819–826. [Google Scholar] [CrossRef]
  47. Lippert, J.L.; Tyminski, D.; Desmeules, P.J. Determination of the secondary structure of proteins by laser Raman spectroscopy. J. Am. Chem. Soc. 1976, 98, 7075–7080. [Google Scholar] [CrossRef] [PubMed]
  48. Edelman, G.M.; Cunningham, B.A.; Reeke, G.N.; Becker, J.W.; Waxdal, M.J.; Wang, J.L. The Covalent and Three-Dimensional Structure of Concanavalin A. Proc. Natl. Acad. Sci. USA 1972, 69, 2580–2584. [Google Scholar] [CrossRef] [PubMed] [Green Version]
  49. Piccirilli, F.; Schirò, G.; Vetri, V.; Lupi, S.; Perucchi, A.; Militello, V. Decoding vibrational states of Concanavalin A amyloid fibrils. Biophys. Chem. 2015, 199, 17–24. [Google Scholar] [CrossRef] [PubMed]
  50. Yu, N.-T.; Liu, C.; O’Shea, D. Laser Raman spectroscopy and the conformation of insulin and proinsulin. J. Mol. Boil. 1972, 70, 117–132. [Google Scholar] [CrossRef]
  51. Belitz, I.H.-D.; Grosch, I.W. Food Chemistry; Springer Science & Business Media: Berlin, Germany, 2013. [Google Scholar]
  52. Delcour, J.A.; Hoseney, R.C. Principles of Cereal Science and Technology. In Principles of Cereal Science and Technology; AACC International Inc.: St. Paul, MN, USA, 2010; pp. 229–235. [Google Scholar]
  53. Delcour, J.A.; Joye, I.J.; Pareyt, B.; Wilderjans, E.; Brijs, K.; Lagrain, B. Wheat Gluten Functionality as a Quality Determinant in Cereal-Based Food Products. Annu. Rev. Food Sci. Technol. 2012, 3, 469–492. [Google Scholar] [CrossRef]
  54. Tatham, A.S.; Miflin, B.J.; Shewry, P.R. The Beta-Turn Conformation in Wheat Gluten Proteins: Relationship to Gluten Elasticity. Cereal Chem. 1985, 62, 405–412. [Google Scholar]
  55. Belton, P. Mini Review: On the Elasticity of Wheat Gluten. J. Cereal Sci. 1999, 29, 103–107. [Google Scholar] [CrossRef]
  56. Zhou, Y.; Zhao, D.; Foster, T.J.; Liu, Y.; Wang, Y.; Nirasawa, S.; Tatsumi, E.; Cheng, Y. Konjac glucomannan-induced changes in thiol/disulphide exchange and gluten conformation upon dough mixing. Food Chem. 2014, 143, 163–169. [Google Scholar] [CrossRef]
  57. Mejia, C.D.; Mauer, L.J.; Hamaker, B.R. Similarities and differences in secondary structure of viscoelastic polymers of maize α-zein and wheat gluten proteins. J. Cereal Sci. 2007, 45, 353–359. [Google Scholar] [CrossRef]
  58. Nawrocka, A.; Szymańska-Chargot, M.; Miś, A.; Kowalski, R.J.; Gruszecki, W.I. Raman studies of gluten proteins aggregation induced by dietary fibres. Food Chem. 2016, 194, 86–94. [Google Scholar] [CrossRef]
  59. Van Velzen, E.J.J.; Van Duynhoven, J.; Pudney, P.; Weegels, P.L.; Van Der Maas, J.H. Factors Associated with Dough Stickiness as Sensed by Attenuated Total Reflectance Infrared Spectroscopy. Cereal Chem. J. 2003, 80, 378–382. [Google Scholar] [CrossRef]
  60. Lawton, J.W. Viscoelasticity of Zein-Starch Doughs. Cereal Chem. 1992, 69, 351–355. [Google Scholar]
  61. Argos, P.; Pedersen, K.; Marks, M.D.; Larkins, B.A. A structural model for maize zein proteins. J. Boil. Chem. 1982, 257, 9984–9990. [Google Scholar]
  62. Momany, F.; Sessa, D.J.; Lawton, J.W.; Selling, G.W.; Hamaker, S.A.H.; Willett, J.L. Structural Characterization of α-Zein. J. Agric. Food Chem. 2006, 54, 543–547. [Google Scholar] [CrossRef]
  63. Shewry, P.R.; Tatham, A.S. The prolamin storage proteins of cereal seeds: Structure and evolution. Biochem. J. 1990, 267, 1–12. [Google Scholar] [CrossRef] [Green Version]
  64. Athamneh, A.I.; Griffin, M.B.; Whaley, M.; Barone, J.R. Conformational Changes and Molecular Mobility in Plasticized Proteins. Biomacromolecules 2008, 9, 3181–3187. [Google Scholar] [CrossRef]
  65. Chen, Y.; Ye, R.; Liu, J. Effects of different concentrations of ethanol and isopropanol on physicochemical properties of zein-based films. Ind. Crop. Prod. 2014, 53, 140–147. [Google Scholar] [CrossRef]
Figure 1. FTIR spectra of the standard proteins in aqueous solution (5.0% w/v); (a) original spectra (replicates), (b) water-subtracted spectra (replicates).
Applsci 10 05918 g001
Figure 2. Infrared spectrum in the amide I region of the aqueous solution of concanavalin A. The upper and lower figures represent the curve fitted, and the second derivative spectrum, respectively.
Applsci 10 05918 g002
Figure 3. Curve fitted amide I regions (1600–1700 cm−1) in FTIR spectra of the reference proteins (a) immunoglobulin G, (b) concanavalin A, (c) trypsin, and (d) lysozyme; α-helix, β-sheet, β-turn, and random coil areas are distinguished with the following patterns ( Applsci 10 05918 i001), ( Applsci 10 05918 i002), ( Applsci 10 05918 i003), and ( Applsci 10 05918 i004), respectively.
Applsci 10 05918 g003
Figure 4. FT-Raman spectra of standard proteins in aqueous solution (20% w/v).
Applsci 10 05918 g004
Figure 5. Curve fitted amide I region (1600–1700 cm−1) in FT-Raman spectra of the reference proteins (a) immunoglobulin G, (b) concanavalin A, (c) trypsin, and (d) lysozyme; α-helix, β-sheet, β-turn, and random coil areas are distinguished with the following patterns ( Applsci 10 05918 i005), ( Applsci 10 05918 i006), ( Applsci 10 05918 i007), and ( Applsci 10 05918 i008), respectively.
Applsci 10 05918 g005
Figure 6. Curve fitted amide I and II regions in (a) FTIR and (b) FT-Raman spectra of hydrated gluten; α-helix, β-sheet, and β-turn areas are filled with the following patterns ( Applsci 10 05918 i009), ( Applsci 10 05918 i010), ( Applsci 10 05918 i011), respectively.
Applsci 10 05918 g006
Figure 7. Curve fitted amide I and II regions in (a) FTIR and (b) FT-Raman spectra of hydrated zein; α-helix, β-sheet, and β-turn areas are filled with the following patterns ( Applsci 10 05918 i012), ( Applsci 10 05918 i013), ( Applsci 10 05918 i014), respectively.
Applsci 10 05918 g007
Table 1. Secondary structure assignments of amide I band components in proteins a.
Amide I Position (cm−1)Assignment
FTIR1610–1627Intermolecular β-sheet
1628–1642β-sheet
1643–1650Random coil
1650–1659α-helix and Gln sidechain
1660–1699β-turn
Raman1620–1648β-sheet
1649–1660α-helix
1660–1665Random coil
1665–1680β-sheet
1658–1680β-turn
1680–1699β-turn
a Data adapted from refs [5,38,39].
Table 2. Relative amount of protein secondary structures determined by FTIR and FT-Raman peak fitting and comparison with X-ray and circular dichroism (CD) studies.
ProteinSecondary Structure (%)Method
α-Helixβ-Sheetβ-TurnRandom Coil
Immunoglobulin G7 ± 167 ± 219 ± 37 ± 1FTIR
964216FT-Raman
3671812X-ray [42]
Concanavalin A9 ± 157 ± 122 ± 112 ± 0FTIR
8592310FT-Raman
3602215X-ray [42]
8–2041–678–156–36CD [7,8]
Trypsin 16 ± 246 ± 329 ± 29 ± 3FTIR
14442912FT-Raman
9562411X-ray [42]
Lysozyme46 ± 321 ± 126 ± 18 ± 0FTIR
4227274FT-Raman
45192313X-ray [42]
4521268CD [8]
Table 3. Absorbance bands of amino acid side chains in the 1600–1700 cm−1 a.
Amino acidAbsorbance Band AssignmentIR Frequency Position (cm−1)
AsparagineC=O (stretching)1678 ± 3
NH bending1622 ± 2
GlutamineC=O stretching1670 ± 4
N-H bending1610 ± 4
ArginineC=N asymmetric1673 ± 3
C=N symmetric stretching1633 ± 3
LysineNH+ asymmetric bending1629 ± 1
TyrosineRing vibration1602 ± 2
a Data adopted from refs [6,51].

