Prediction of the Energy Consumption of School Buildings

Department of Construction Engineering and Management, KFUPM, Dhahran 31261, Saudi Arabia
Appl. Sci. 2020, 10(17), 5885; https://doi.org/10.3390/app10175885
Submission received: 14 July 2020
/
Revised: 13 August 2020
/
Accepted: 18 August 2020
/
Published: 25 August 2020
(This article belongs to the Special Issue Big Data in Construction Engineering and Management)
Abstract
:The energy consumption of a constructed facility is a primary concern as a result of its impact on the total energy expenditure. It has been found that up to 70% of the power consumption in Saudi Arabia are caused by building structures and air conditioning (AC). Energy consumption in government-constructed buildings constitutes a considerable ≈13% of the consumption of the total energy in Saudi Arabia. Therefore, the government of Saudi Arabia initiated the Saudi Energy Efficiency Program (SEEP) that goals to lower the domestic energy severity by roughly 30% by 2030. This paper introduces a study carried out in Eastern Province in Saudi Arabia to identify factors influencing the consumption of energy in school facilities (which are built of concrete in hot and humid climate zones), investigate the correlation between those factors and their impacts on the consumption of energy in school facilities, and finally, develop a prediction model for the energy consumption of school facilities. The study was based on the utilization of 352 real-world datasets of energy consumption of operating schools across Eastern Province in Saudi Arabia. The developed energy prediction model considers eleven identified factors that influence the consumption of energy of constructed schools. The identified factors were utilized as input variables to build the model. A systematic search among different neural network (NN) design architectures was conducted to identify the optimal network model. Validation of the developed model on eight real-world cases demonstrated that the accuracy of the developed model was about 87.5%. Moreover, the findings of this study indicate that the weakest correlation between the input variables was recorded as −0.015 between “type of school” and “AC capacity,” while the strongest correlation was recorded as 0.95 between the variables of “number of classrooms” and “total air-conditioned area (sqm),” followed by “total air-conditioned area (sqm)” and “number of students,” which was recorded as 0.90. It is worth noting that “AC capacity” was the most significant predictor, which increased exponentially for high values of energy consumption, followed by “total school roof area.” The study also found that the age of the schools had a very small impact on energy consumption, although the age of the schools varied from 11 to 51 years. This was probably due to a good maintenance system applied by the Ministry of Education. The implication of the developed prediction model was that the model can be used by the Ministry of Education to predict the energy consumption and its associated cost for public school buildings for the purpose of budget allocation. The model may be utilized as a stand-alone application, or it can be integrated with an existing building information module (BIM)-based system.
1. Introduction
In 2017, Saudi Arabia consumed more than 35% of its oil production domestically, which constitutes 1.89% of world energy consumption [1], while in 2018, domestic consumption was found to be at 3787.568 barrels/day [2]. Furthermore, the consumption of natural gas was equal to the natural gas production [3]. Energy consumption and its associated costs are important elements of the operation of school buildings and represent a considerable cost in the building life cycle [4]. In 2018, the Saudi Ministry of Education allocated 192.92 billion Saudi Arabian Riyal (1 SAR = $US0.27) for the Saudi general educational sectors [4]. This included finishing 719 new public schools. It is anticipated that more new schools are going to be constructed by the end of 2021. In Eastern Province in Saudi Arabia, there are 1500 public schools that provide services to a population of 5 million [5]. The financial success of operating this class of facilities, which is mainly supported and budgeted by the government, can only be measured realistically if the actual expenses are compared to target “predicted” values. The reason of that, in the absence of a reliable cost control tool, the real expenses can overrun the planned expenses [6].
Because of the fast population growth, the Kingdom of Saudi Arabia is observing increased economic development, especially in the energy sector and infrastructure construction fields. The government of Saudi Arabia initiated the Saudi Energy Efficiency Program (SEEP), which focuses s to reduce the domestic energy severity by around of 30% by the year 2030. Government-constructed buildings comprise about 13% of the consumption of the total energy in Saudi Arabia. Thus, predicting the energy consumption for constructed buildings and for newly constructed buildings at the conceptual or initial stage is crucial for owners and designers when carrying out economic analysis. Predicting energy consumption is also equally important for facilities maintenance managers and building owners for allocating a budget for operating buildings.
School buildings represent a major portion of government buildings that are under the domain of governmental finance. Governmental buildings contribute about 13% of the total energy consumption in Saudi Arabia, as presented in Table 1. These figures are expected to increase by 5% annually in the near future [7]. Moreover, the oil consumption in Saudi Arabia is witnessing the largest demand from the electricity sector, as revealed by the Public Utilities Report in February 2016 [7]. According to the World Bank, in 2014, the Saudi consumption of electricity reached 9401 kWh per capita. Compared with four African hot climate countries, the energy consumption in Saudi Arabia is two times higher than the energy consumption of Sudan, Egypt, Tunisia, and Algeria put together [8], while the total population of these countries is eight times higher than the population of Saudi Arabia. In response to such high demand in energy consumption, and as an attempt to control such high demand for electricity consumption, new regulations were introduced to all service categories and they have been utilized as per the Council of Ministers (Decree No. 95), as shown in Table 2. Therefore, a new construction code was imposed in 2018 since the existing structures system is the source of such high consumption.
The literature reveals that internationally, significant efforts have been made in the field of estimating consumption of energy, but locally in the Kingdom of Saudi Arabia (KSA), this field still needs more work and more attention, specifically in governmental agencies. Henceforth, identifying the factors influencing the energy consumption of constructed facilities, ranking the most impactful factors, and developing a prediction model for energy consumption that considers the identified factors are needed. Locally, limited research has been done concerning the prediction of energy consumption and the associated costs of constructed facilities, especially school buildings. Only one study focused on the prediction of consumption of energy along with the associated costs of residential buildings is reported in the literature [10]. Hence, there is a great need for the development of a simple yet effective framework and model for predicting the energy consumption of school buildings that can be easily standardized and used.
The main objectives of this study are (1) identifying the factors influencing the consumption of energy in school buildings in Eastern Province in Saudi Arabia, (2) identifying the correlation between the identified factors and rank the importance of the identified factors according to their impacts on energy consumption, and (3) developing a model for predicting for the consumption of the energy in school buildings. The findings of this study can be more useful for governmental agencies for different purposes and can be easily implemented by experts. Building maintenance managers can also use the developed prediction model for budget allocation. The potential benefits of this research include:
- Offering a simple, accurate, and better tool for improving the future prediction of energy consumption, which contributes to more precise budget allocations.
- Improving energy control by offering a more accurate prediction model of future energy consumption.
- Preparing the ground for further studies in the area of the energy consumption of school buildings for both the public and private sectors.
- The findings of the study can assist decision-makers when selecting the most attractive architectural elements for retrofitting.
Through a comprehensive literature review and face-to-face meetings with a number of local experts, the factors that impact the energy consumption of school buildings were identified, and therefore, the data collection and model development were conducted accordingly, as will be explained later.
2. Literature Review
School buildings are vital assets that play an important role in the educational process. These buildings host students and staff throughout the day in different climate conditions. In light of that, the owners of such buildings spend a considerable portion of the assigned operation and maintenance budget keeping these buildings running in a healthy environment. Energy consumption represents a significant total running cost of this class of facilities. In 2019, the number of public schools in Saudi Arabia that funded by the government reached 31,683 schools across the Kingdom, with 1600 schools in Eastern Province hosting a total of 421,599 students, 28,185 teachers, and 7420 non-academic staff [11].
Assigning the needed budget at the beginning of the fiscal year is a challenging mission for the facilities’ managers and for the Ministry of Education because of the difficulty in predicting the energy consumption of such constructed facilities. The difficulty is due to the involvement of many factors that affect consumption of energy and cannot be predicted in advance. The issue of energy consumption was observed by many studies in the Kingdom of Saudi Arabia and worldwide. Those studies investigated this issue from different angles and for different purposes (see, e.g., References [12,13,14,15,16]. However, the literature reveals that in Saudi Arabia, there is a shortage of studies focusing on the prediction of energy consumption of constructed buildings, especially schools.
2.1. Previous Work on Energy Consumption in Saudi Arabia
Most of the studies conducted in Saudi Arabia regarding energy consumption focused on residential buildings. Taleb and Sharples [12] conducted a study on the current practice of the consumption of energy and water residential buildings in Saudi Arabia to introduce an alternative plan for providing sustainable residential buildings. The study recognized mistakes connected to designs usually found in buildings in Saudi Arabia. Simulation software was used to assess different scenarios for evaluating energy and water consumption. The authors suggested some choices for developing energy efficiency, including efficient glazing systems, enhanced external thermal insulation roofs and walls, energy-efficient lighting, and proper shading. The main drawback of the study is that the study utilized energy simulation software rather than the use of real data-based tools to estimate the energy consumption of architectural design.
Al-Rashed and Asif [13] conducted a study to examine the factors that affect the consumption of energy of residential buildings. The study distinguished the influencing factors that scientifically affect energy consumption, including weather conditions, air-conditioning systems, dwelling types, cooking appliances, and envelopes. The study involved a questionnaire survey of 115 residences, including 28 apartments, 25 traditional houses, and 62 villas on a monthly basis. The authors recommended the adoption of multi-layer-glazing windows and mini-split air-conditioning systems. The study was limited to the investigation of the energy consumption of some architectural elements. Furthermore, the study was based on data collected by a questionnaire rather than using a comprehensive tool. Unfortunately, the finding of this study [13] is not beneficial to school buildings since school buildings have the same structure type but are used for different activities than residential buildings.
Ashraf and Al-Maziad [14] utilized an energy simulation tool for examining the impact of façades on the energy consumption of multistory educational buildings. Many simulation runs were required to assess the performance of different façades. The authors criticized the use of simulation software for carrying out the assessment since simulations need the user to enter a considerable amount of data for each façade alternative, which is the main limitation of the simulation software. Thus, there is a need for a simple tool that can be used by the designer to assess different design scenarios reduce energy consumption [14]. Additionally, architects in the Kingdom of Saudi Arabia suffer from the absence of a particular software that can be utilized to assist in reducing energy consumption. Furthermore, the existing software needs the use of a considerable volume of data, which is the main limitation in current practice [10], especially at the early stage of the design, where such required information is not available.
2.2. Application of Neural Networks (NNs) for Predicting Energy Consumption
Due to the advancement of machine learning and information technologies, novel computer application tools have recently advanced in construction and building management. In different fields, artificial neural networks (ANNs) have received attention as one of the more attractive utilized tools for developing prediction models [10,15]. The accuracy of the anticipated energy consumption is an important consideration with any method of estimation [17]. Lately, an alternative tool for predicting consumption of energy was established by using a new type of tools, namely, artificial neural networks (ANNs), which evolved based on artificial intelligence and has high potential to be used in the construction field, as recent research demonstrated [18], and it is anticipated to have a greater performance compared to the traditional regression analysis [15]. A literature review suggested that neural networks have been intensively adopted in the development of forecasting energy consumption models (see, e.g., References [16,17,19,20,21,22], as it can provide more accurate results compared with regression and simulation-based models [15].
Yedra et al. [17] introduced a prediction model for predicting the electricity demand of CDdI-ARFRISOL-CIESOL Bioclimatic Buildings using neural network. The paper is one of few papers that adopts the use of an NN for developing an energy consumption model for short-period forecasts. Similarly, Nasr et al. [16] developed an ANN-based prediction model for the consumption of energy for electricity in Lebanon by considering only the weather conditions. In China, Meng et al. [23] introduced a model to calculate the increasing trend in energy consumption. Another application of ANN is the prediction of the heat load and the total carbon emissions (see, e.g., Kumar et al. [19]). To enhance their ANN performance, Karatasou et al. [20] proposed the incorporation of ANN with statistical processes, information criteria, cross-validation, and a backpropagation algorithm in their ANN to improve the accuracy at predicting building energy consumption.
Li et al. [24] proposed the amalgamation of stacked autoencoders (SAEs) and an extreme learning machine for developing a prediction model for energy consumption. The model provided better backward propagation neural network (BPNN) and vector-regression-based models. Menezesab et al. [25] investigated the main causes of the discrepancy between the actual performance of constructed buildings and the measured performance at the design stage. The study revealed that unrealistic inputs regarding user behavior and building management in building energy models are the main causes of such discrepancies.
In Saudi Arabia, few studies are reported in the literature for predicting energy consumption and/or its associated cost. Alshibani and Alshamrani [10] introduced a novel conceptual system to predict the cost of energy in residential buildings in Saudi Arabia. The proposed system is a combination of four models: a building information module (BIM), an ANN, a graphical user interface (GUI), and a database model (DBM). The system was applied to 25 houses, 28 apartments, and 62 villas using 10 input variables and one output, which was the predicted energy cost. The system succeeded in achieving a 78% accuracy for predicting the energy cost. The authors recommended that future studies include roof designs and building materials. Furthermore, the authors mentioned that one of the difficulties they faced was the lack of completed design information and specifications for residential buildings in Saudi Arabia. Abdel-Aal et al. [15] introduced a prediction model for electricity consumption in Saudi Arabia. The only factors or elements accounted for was the weather conditions and economic indices. The model predicted the consumption at a national level and did not consider the energy consumption at a building facility level, which is more complex due to the involvement of many factors.
2.3. Prediction of Energy Consumption in School Buildings
Globally, Kim et al. [21] examined the correlation between the consumption of energy of school buildings and the area of school, school class number, school students’ number, and the school system of cooling and heating in South Korea. The study concluded that the average annual consumption of energy was estimated to be 400,000–1,750,000 kWh/year for each school. Out of that, 82% was due to electric power consumption. Ouf and Issa [22] studied the consumption of energy in school’s facility in Manitoba, Canada, for the last ten years. The study revealed that middle-aged schools had the highest rate of energy consumption. The study also found that the retrofit done in some schools had a low effect on the school buildings’ energy consumption. Moon et al. [26] developed two prediction models for the power consumption of higher educational buildings using an ANN and support vector regression. The outputs of the two models were compared and the comparison showed that the two models can provide accurate forecasting for the power consumption of higher educational buildings. Hong et al. [27] introduced a model for selecting the most effective school design in terms of energy savings and with the least CO2 emissions. The authors stated that the application of the model could lead to a saving in energy consumption of 16.58%. Beusker et al. [28] proposed a regression-based model for forecasting the consumption of heating energy in schools and sports buildings. The model was intended to assist a building manager to identify elements for accurate estimation. The study revealed that the energy consumption of indoor swimming pools is 84% higher than that of school buildings. Jeong et al. [29] proposed an estimation using an ANN-based model to predict the annual energy cost budget of school buildings in South Korea. The study was based on a comparison of a developed model with an existing one.
The previously reviewed models, exclusively and/or collectively do not; (1) predict the consumption of energy in constructed school facilities, except References [24,29]; (2) identify the factors affecting the consumption of energy in school buildings; and (3) predict the consumption of energy in school buildings in Saudi Arabia. Thus, the main objectives of this study were to identify the factors affecting the consumption of energy of school buildings, identify the correlation between the identified factors, and to developing a prediction model for energy consumption of school buildings in Eastern Province in Saudi Arabia using a Neural Network.
3. Methodology
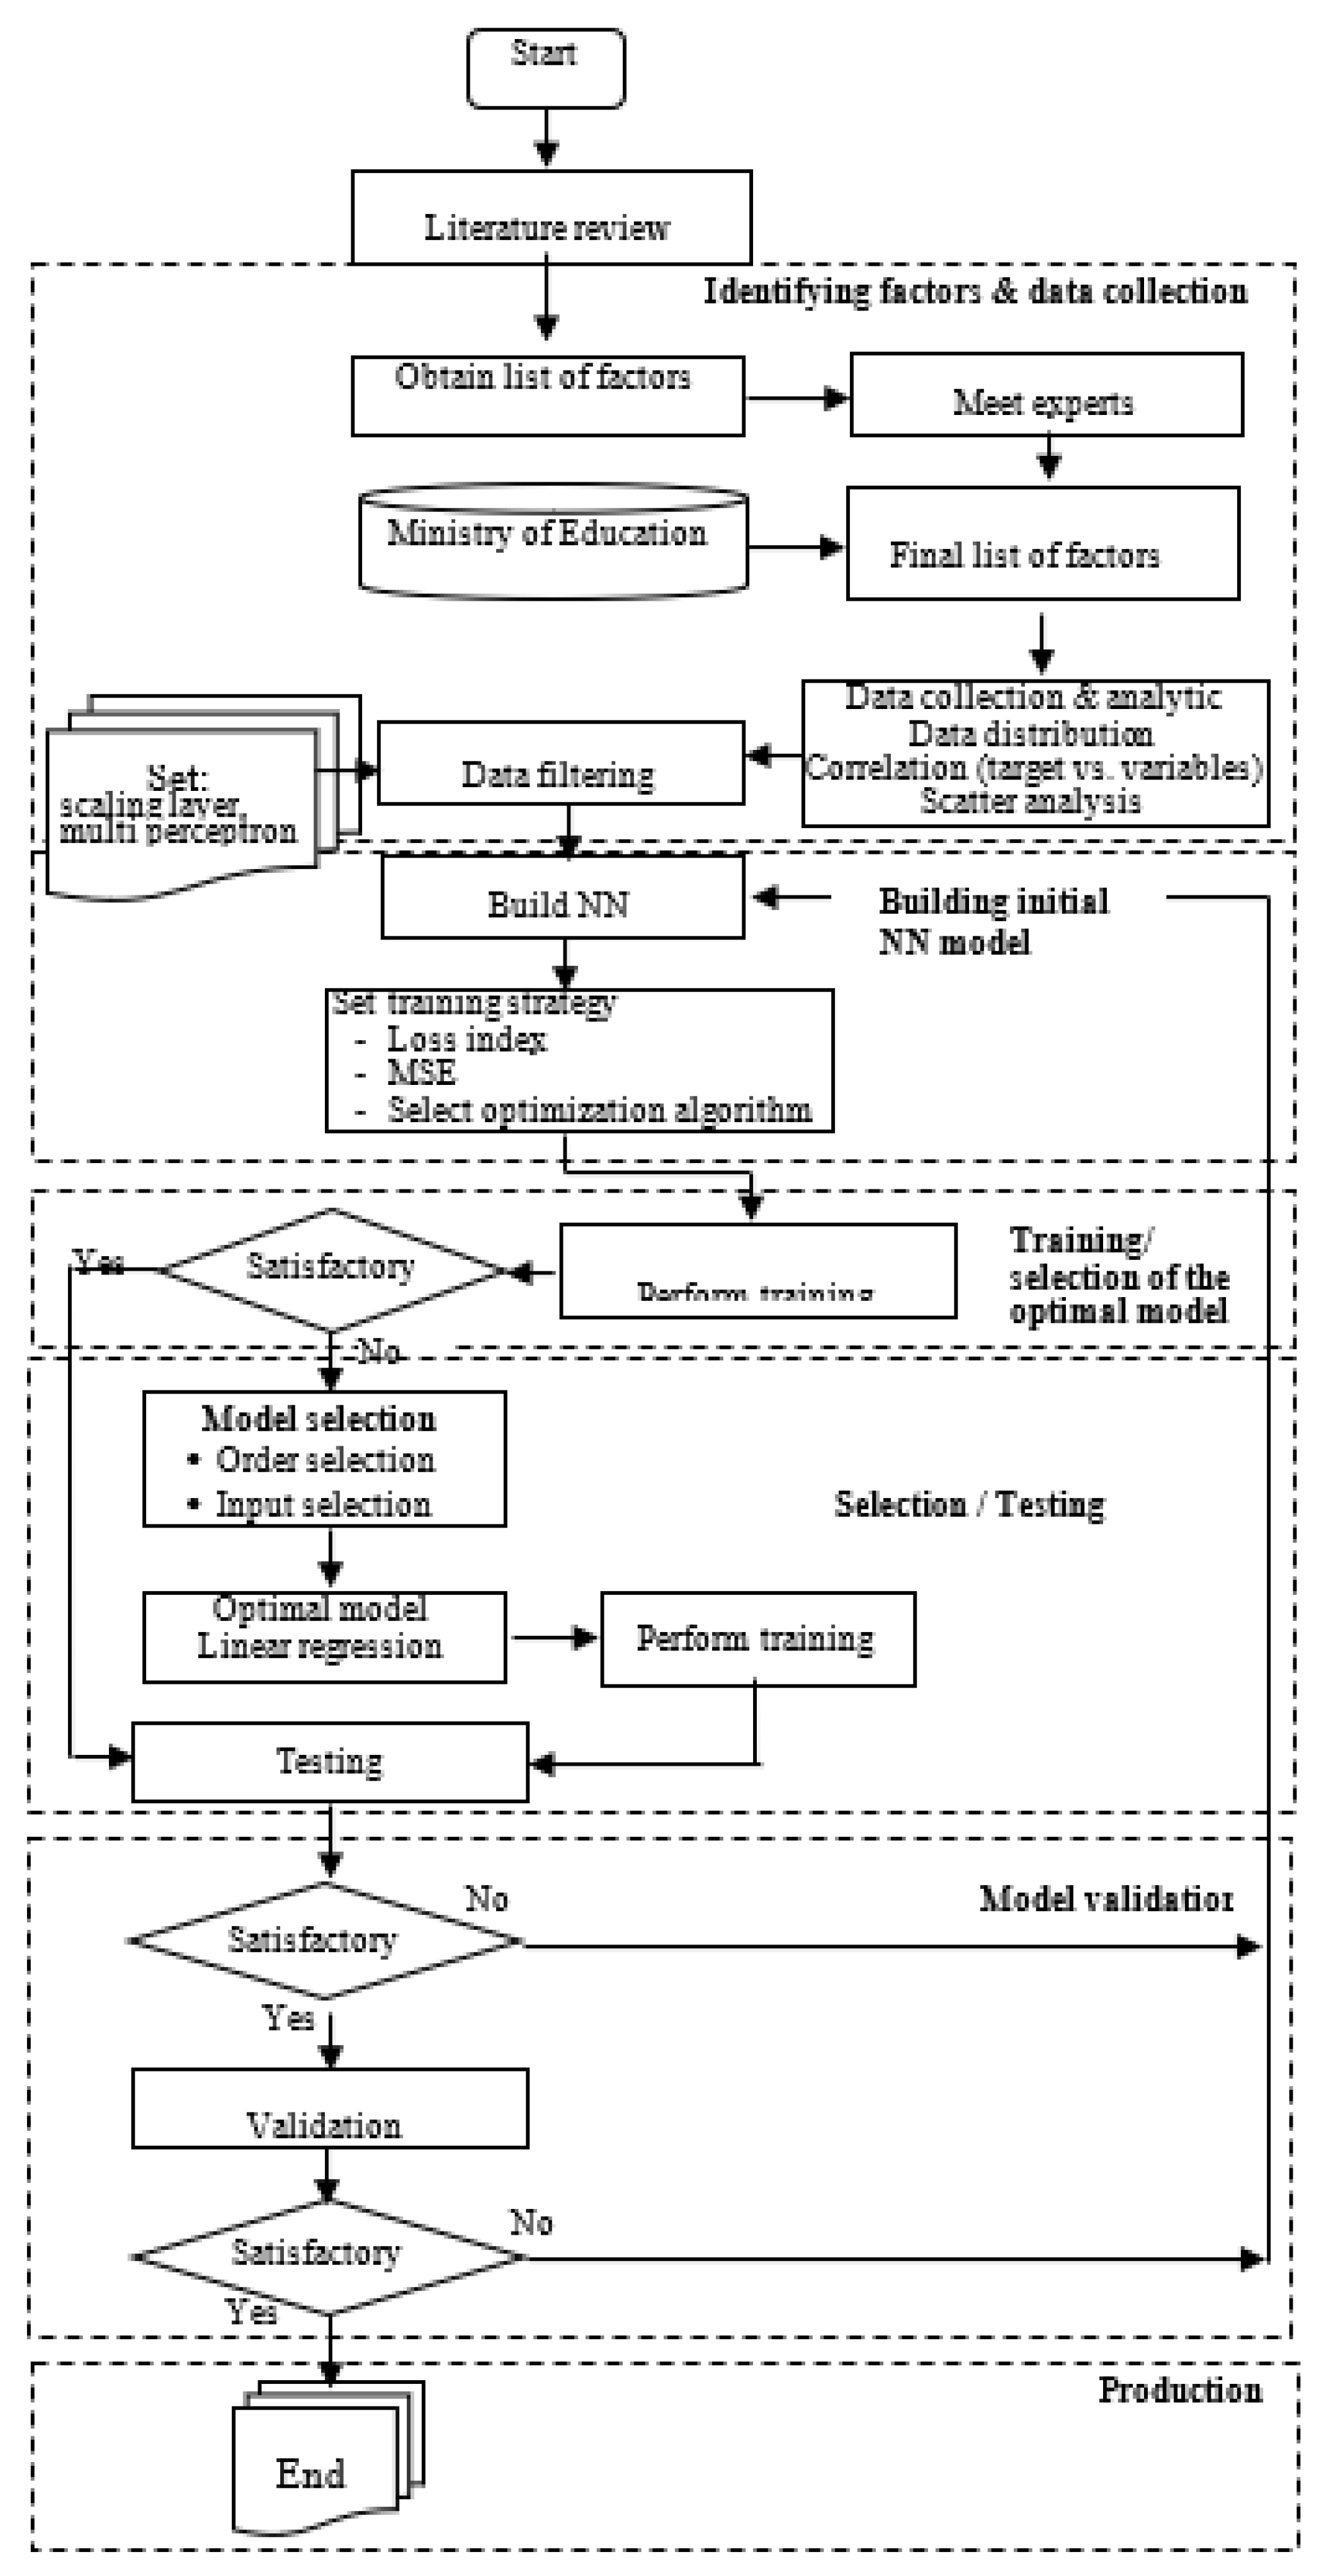
The methodology implemented in this study was designed to meet the purpose of the study. The methodology consisted of four phases in 12 sequential steps. The first phase included the literature review and experts’ interviews to achieve the first objective, which was identifying the factors influencing the consumption of energy in school buildings in Eastern Province in Saudi Arabia. The second objective was achieved by undertaking the remaining steps in phase one, which were data collection and analysis, while building, training, testing, and validation of the developed model were achieved by taking the steps in phases 2–4.
As depicted in Figure 1, to meet the objectives mentioned earlier—which were identifying the factors influencing the consumption of energy in school buildings, identifying the correlation between the identified factors, and developing a prediction model for the consumption of energy in school buildings in Eastern Province in Saudi Arabia—the following methodology sequence was followed, which consisted mainly of four phases.
Phase One: Identifying Factors and Data Collection
- In the first step of this phase, a comprehensive literature review was conducted regarding previous work done in (1) identifying the factors influencing energy consumption in school buildings and (2) in developing a prediction model for the consumption of energy of this class of buildings.
- In the second step of this phase, face-to-face meetings with three experts were conducted. The three selected experts were one from the Saudi Ministry of Education in Eastern Province, one from a Saudi electrical company, and one from the academia from Imam Abdulrahman Bin Faisal University (IAU) in Dammam. It should be noted that Eastern Province is the largest of Saudi Arabia’s thirteen provinces and the third most populous one, with a population of 4,900,325 as of 2017. The purpose of conducting face-to-face meetings with experts was to agree on the most influential factors (variables) regarding the energy consumption of school facilities s in Saudi Arabia.
- The third step of this phase involved the collection of the data required to build the model. Therefore, communication was established with the Ministry of Education in Eastern Province, who is the service provider for more than 1600 public schools.
- The fourth step of this phase involved analyzing the data obtained from the Ministry of Education in Eastern Province for the purpose of data filtering before its use for developing the prediction model.
Phase Two: Building the Initial NN Model
- In the first step, since the problem at hand was an approximation problem, the initial NN contained a scaling layer, multi perceptron layers, and an unscaling layer. The purpose of the scaling layer is to scale the input variables such that all the inputs have the same proper range. The scaling function acts as a layer that links all inputs that hold some basic statistical analysis, such as means, standard deviations, and minimum and maximum values. The perceptron layers are the most important layers that allow for the NN model to learn. Two activation functions were considered in building the initial NN model and before selecting the optimal model architecture; they are the hyperbolic tangent and linear activation function. In building the initial model, the scaling method was set to the mean standard deviation method since the input variables of the approximation problem had a normal distribution, while the perceptron layer(s) was set to hyperbolic tangent.
- In the second step of this phase, the training strategy was set. This included setting the loss index, error measuring method, and the algorithm for selecting the optimal model. The purpose of the training is to obtain the minimum loss possible. The mean squared error (MSE) method was utilized to measure the loss index and quasi-Newton method was applied as the optimization algorithm, which is a good method for quickly training a medium-sized volume of data.
Phase Three: Selection of the Optimal Model
The purpose of model selection is to find the best model architecture that minimizes the loss (error) on the selected instances of the datasets. This phase consists of the following steps:
- order selection
- input selection
- optimal model
- linear regression
- perform training.
Phase Four: Model Validation
The purpose of this phase was to test the final selected model on new datasets to measure its performance when predicting the consumption of energy in schools’ buildings in Eastern Province in Saudi Arabia.
Identifying Factors Influencing the Energy Consumption of School Buildings
As stated in the research methodology section, to achieve the first objective, a comprehensive review of the literature was conducted to identify the relevant factors from previous research, followed by interviews with three selected experts to eliminate and/or add other factors that influence the energy consumption in Saudi conditions. The experts consulted throughout this research were selected from three areas: architectural/building engineering, facility management, and construction and engineering management, and they were familiar of this type of research. The interviews were carried out in a set of semi-structured interviews with the selected experts working in the Ministry of Education and Saudi electricity company firms in Eastern Province in Saudi Arabia. The profile of each expert is presented in Table 3.
Due to the uniqueness of the hot and humate climate conditions in Eastern province and since this research focused on public schools, the literature review indicated that no research of this kind had been reported in Saudi Arabia. Only a few studies reported in the literature with similar objectives focused on predicting the cost of energy consumption of residential buildings (see, e.g., Alshibani and Alshamrani [10]). The study identified seven factors that impact the energy consumption of residential buildings: location, building envelope system, area of the building, insulation (wall), number of occupants, glazing type, and air-conditioning type. Furthermore, Taleb and Sharples [12] studied the design mistakes that can cause increased energy consumption of residential buildings. The authors suggested the development of an energy-efficient design that should include efficient glazing systems, enhanced external thermal insulation roofs and walls, energy-efficient lighting, and proper shading. Al-Rashed and Asif [13] identified influential factors regarding the consumption of energy in residential buildings in Saudi Arabia, including weather conditions, air conditioning (AC) systems, types of dwelling, kitchen appliances, and envelopes.
From the limited studies mentioned above, the factors obtained from the literature are listed in Table 4 and were shared with the selected experts through a set of semi-structured interviews [30]. The table shows these factors along with a decision regarding whether to consider each one based on the experts’ interviews. Furthermore, the table depicts other factors, which were suggested by a school board and they were not included in the factors from the literature obtained above.
4. Model Development
“Neuraldesigner” neural network software [31] was utilized for the development of the prediction model for the consumption of the energy in school facilities in Eastern Province in Saudi Arabia. An ANN is considered an alternative approach to the traditional regression analysis [16]. This technique has a high potential to be used in the construction field in the future, as recent research has demonstrated [18]. A neural network uses multiple processors working at the same time in parallel to get a result (in a way that simulates human neurons). It consists of three layers, where each layer consists of nodes or neurons and these nodes are highly interconnected with the nodes in the previous layer and the node in the next layer, and each of these nodes has its own knowledge, including rules that it has learned by itself.
For developing the energy prediction model, a systematic search was applied to select the best NN architecture that represents the problem of predicting energy consumption from many different network models with different structures. As presented in Figure 1, the systematic search was the process of redoing the building process of the NN until satisfactory results were achieved. The factors influencing the energy consumption of school buildings were defined as “input data” (model-independent variables), while the total energy consumption was defined as “output variables” (model-dependent variables). Three main steps were required to build the proposed energy prediction model in “Neuraldesigner.” They were the preparation of the required data, the machine learning, and then the production of the model, as presented in Figure 2. The process of the model development is described in detail, which can be summarized as follows:
- Data collection and analysis
- Data filtering
- Building of the initial model, where this phase consisted of the following sub-steps:
- setting the network architecture
- model learning (training)
- model selection
- model testing
- model validation.
4.1. Data Collection
Due to the unavailability of digital documentation of the previous energy consumption of school facility records in Eastern Province in Saudi Arabia, as a replacement, the data required were directly collected from schools as actual energy consumption through the Ministry of Education in Eastern Province. This was done from electricity bills. The data collected consisted of twelve variables that were decided by the experts as they had a great impact on the energy consumption in school buildings, as presented in Table 4. Eleven out of the twelve variables were defined as “input data” in the developed ANN model, and one variable that represented the energy consumption (kWh/year) was defined as an output. For an easy application of the model, the data collection was organized in Microsoft Excel 2013 worksheets to build the model. Table 5 shows a sample from the collected datasets that were required for building the ANN model. In this application, 352 datasets were utilized to develop the model. The data were randomly divided, with 60% used as training data (learning), 20% used for selecting, and 20% used for testing the model, while new data was used for model validation.
4.2. Data Analysis
The purpose of the data analysis was to examine the data quality. The identified factors (variables) with brief descriptions are given in Table 6, while Table 7 gives the basic statistics of the collected data, which shows the quality of the data collected and identifies any spurious data, if any. The table shows that there were a variety of school types, sizes, number of classes, etc., which allowed for developing a very realistic model that reflects many cases and conditions.
4.3. Scatter Charts
Scatter charts were used to analyze the collected data to find the dependency between the target (predicted energy consumption) factor and the input variables. Scatter charts were utilized due to their simplicity and effectiveness in presenting the relationship between two variables, it is a good technique for showing a non-linear relationship, and easily understood. For example, Figure 3 shows a strong correlation between the input of “AC capacity” and the target factor “energy consumption” (kWh/year). It also shows that the number of students had a stronger relationship with the target compared to that of the number of classes. Such information can be useful for data filtering, especially in cases where the number of variables is large.
4.4. Input Correlations
The input relationship analysis computed the correlation between the model input variables. A pairwise comparison analysis was carried out between each pair of input variables. The absolute value of the strength relationship was expressed up to a value of one, while no relationship was expressed as a value of zero. Thus, the closer the relationship was to zero, the weaker the relationship was. Table 8 summarizes the input variables’ correlations between the model inputs. The weakest correlation was 0.015 between “type of school” and “AC capacity.” The maximum correlation was 0.95 between the variables “number of classrooms” and “total air-conditioned area (sqm).” It should be noted that a positive value indicates a positive relationship, which means an increase in one variable leads to an increase in the other. On the other hand, a negative value indicates a negative relationship, which means an increase in one variable will lead to a decrease in the other. It is interesting to note that the age of the building had a weak correlation with AC capacity and total air-conditioned area. This could be an indication of good school conditions due to an excellent maintenance plan. The city variable had a weak correlation with all other factors. This was because all schools considered in this study were located in Eastern Province in the same climatic zone. This could be different if the study covered all of Saudi Arabia, with its four climatic zones.
4.5. Target (Energy Consumption) vs. Input Variable Correlations
The purpose of the target vs. input variable correlations analysis was to investigate the correlation between the model output, which was the school energy consumption, and the model input variables. The analysis computed the strength relationship or “correlation coefficient value” between all the model inputs and the output (target). This analysis could have led to two conclusions. The first one was that there would be a correlation close to one, which indicates that a single target was correlated with a certain single input and/or there would be no relationship between a certain input and the target variable, as given by the value being close to zero. Table 9 indicates that the strongest correlation of 0.970322 was between the input variable of AC capacity in ton of refrigeration (TR) and the predicted energy consumption. This finding agrees with a previous finding revealed in Al-Rashed and Asif [13]. It is interesting to note that the age of the school building had a weak relationship with all other variables, including the model output “energy consumption.” This is a good indication that the schools were operating in good condition due to a good maintenance plan, even though the minimum age of the schools was 11 years, while the oldest school was 58 years, with a mean of 32.82 years.
Figure 4 shows the reliance of the predicted energy consumption with the input variables of the model. The figure also represents the concept of a “Pareto chart,” or what is called the 80/20 rule, where 80% of the problem or opportunity of improvement was due to 20% of the reasons. In this case, as can be seen in Figure 4, improving the existing AC system and retrofitting the existing roof could improve the energy consumption (55% opportunity of improvement). It should be noted that such an analysis could have been more representative if the architectural elements were included in the study, such as the walls, windows, and insulations. This can be done for private schools in Saudi Arabia because of the variation in the architectural design, construction material, and differences in AC and lighting systems.
4.6. Building the Initial NN (Setting the Network Architecture)
As presented in Figure 1, building the initial NN was the first step of phase 2 of the model development. This step included defining the following three functions:
- (a)
- scaling function layer
- (b)
- multi perceptron layers
- (c)
- unscaling layer.
The purpose of the scaling function is to scale the inputs of the initial NN model to a suitable range. It contains some basic statistics on the inputs, including the mean, standard deviation, and minimum and maximum values. The method used for scaling the layer was the mean standard deviation method (MSDM).
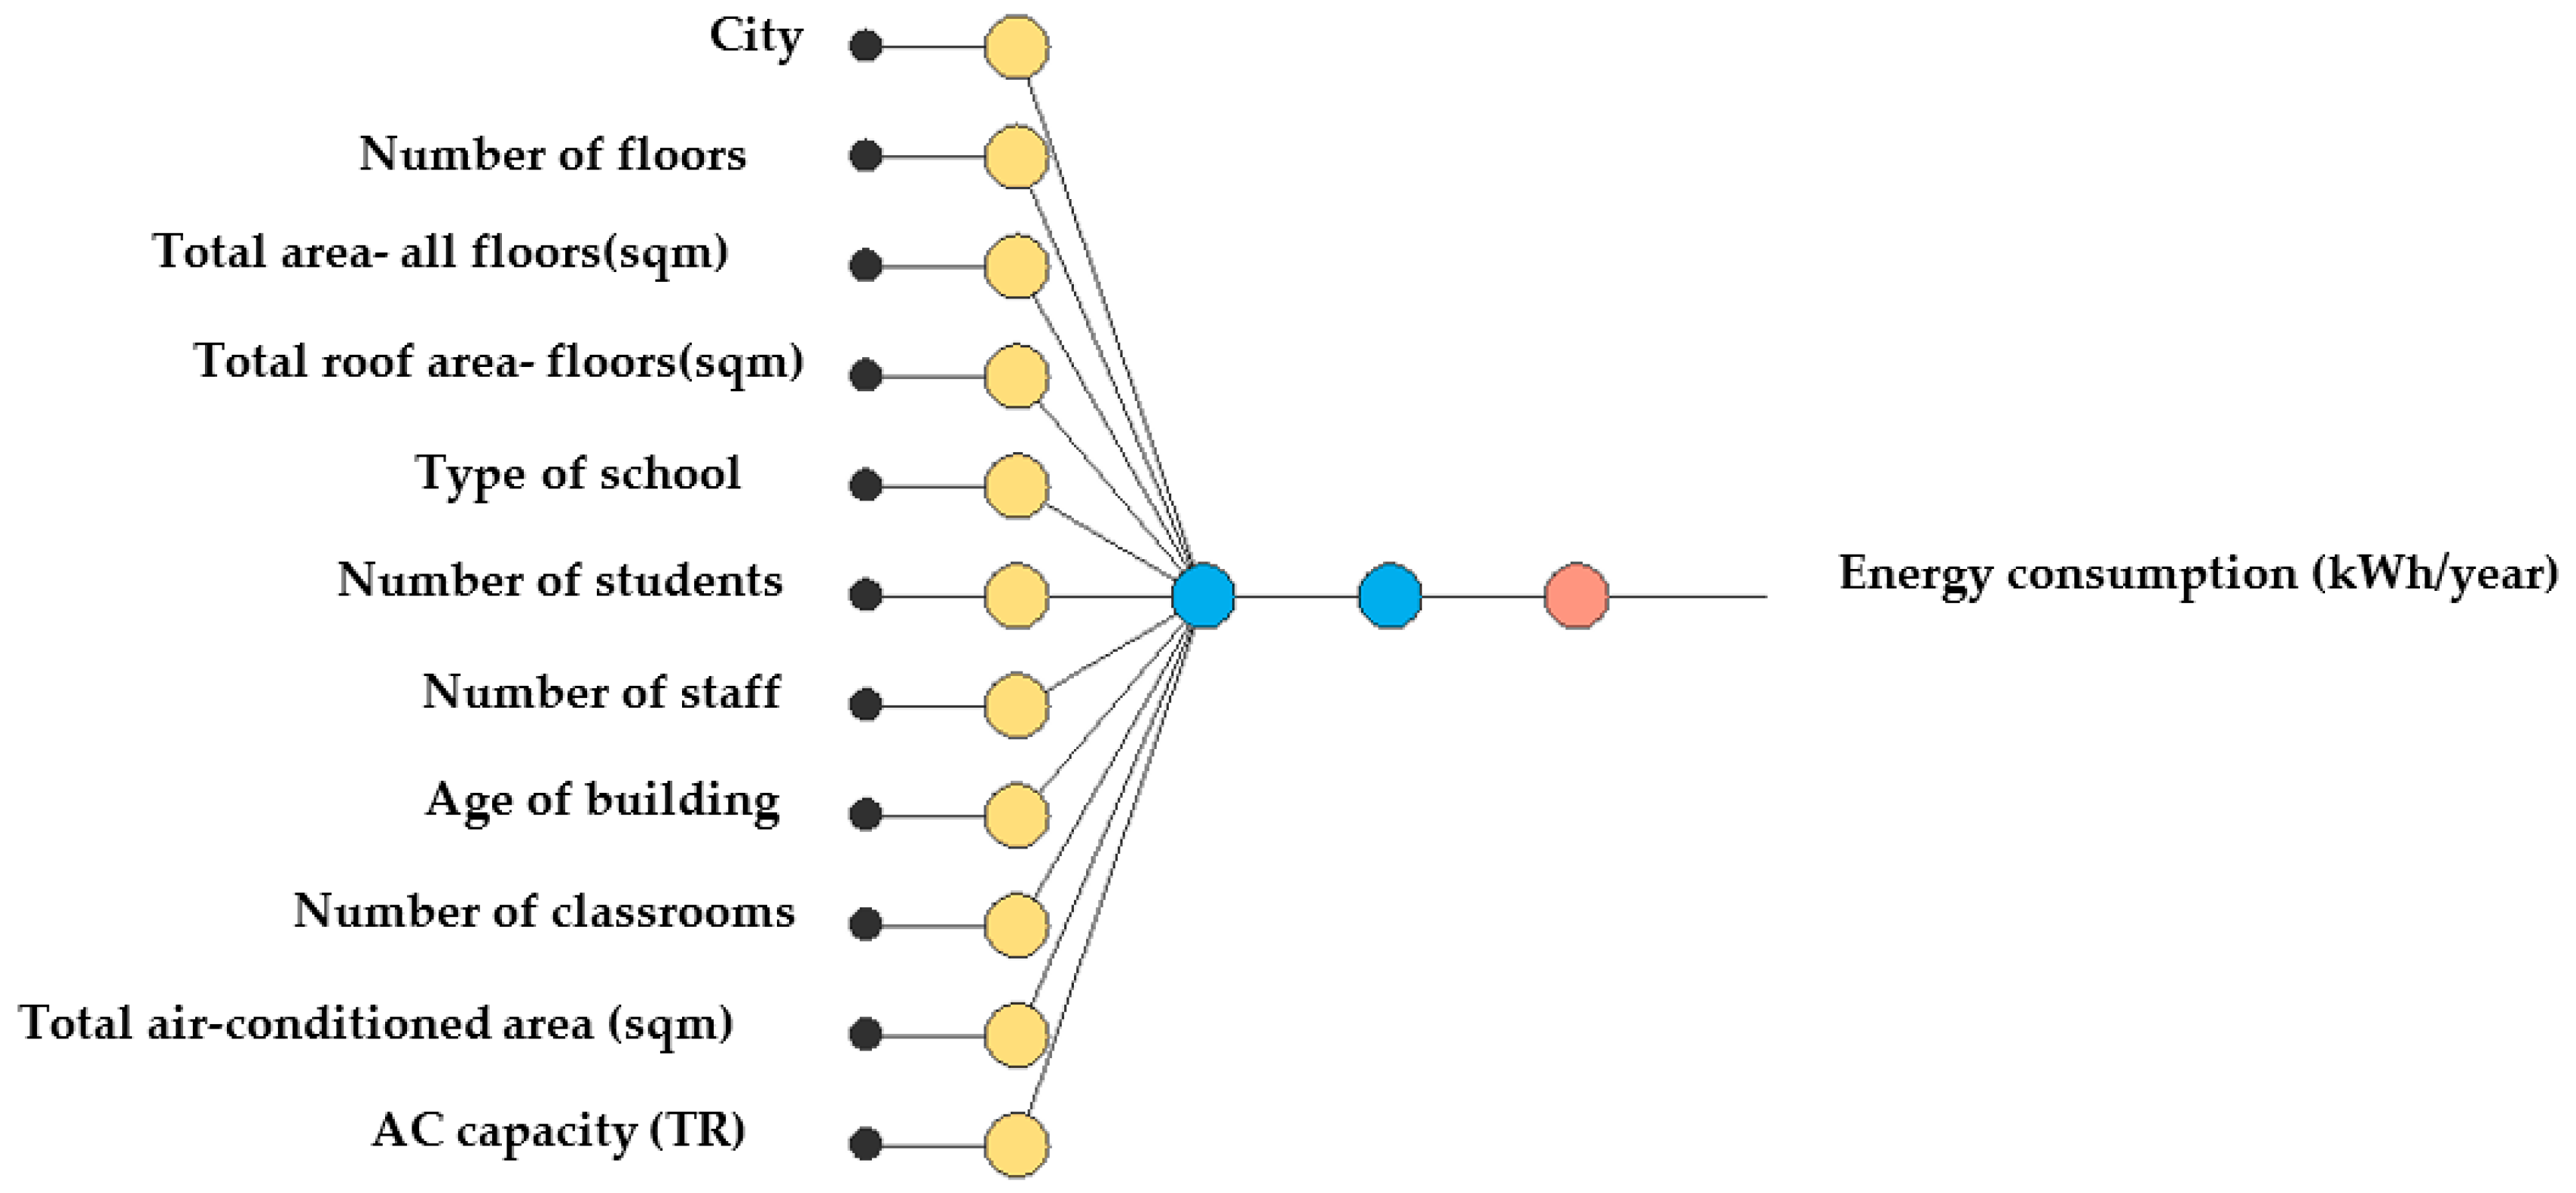
The perceptron layers are the most important layers, which allow the NN model to learn. Two activation functions were considered when building the initial NN before selecting the optimal model: hyperbolic tangent and linear activation functions. Since the input variables of the approximation problem had a normal distribution, the perceptron layers were set using the hyperbolic tangent function, which is a sigmoid function that is the most utilized activation function with a variation between −1 and +1. The number of layers of the perceptron in the ANN was set to two and the number of the model outputs was one. Figure 5 depicts the architecture of the initial built NN. It had 11 inputs (in black circles) and 1 output, and it consisted of a scaling layer (yellow), a perceptron layer with two neurons (blue), and an unscaling layer (red).
4.7. Model Training
The process applied to perform the learning process is called training and its main purpose is to gain the best possible loss (error) by applying the best training strategy. The training process was performed more than once during two stages of developing the model. In the first stage, the training process was performed after building the initial model, and in the second stage, the process of training was implemented after the selection of the optimal model to make sure the selected model’s performance was satisfactory.
To train the initial built NN, 60% of the dataset was randomly selected and used to produce a weight of the inputs (hidden layer). This training dataset was used to measure the NN’s performance. Several network structures were trained and tested in the hidden layer. The best network for the selected model was chosen by conducting a systematic search of many networks with different network structures, as will be explained in the model selection.
The strategy was carried out by finding a collection of parameters (weights and biases) that best fit the datasets of the neural network. The loss is an index for measuring the quality of the model under consideration. The selection of the technique of the loss index that fits the problem under consideration is the key aspect of the problem.
4.8. Error Measurement Using the Loss Index
In the model development, the term error was utilized to express the loss for measuring the fitness of the datasets to the neural network. In the developed model, the mean squared error (MSE) was used for developing the approximation based NN model. In the case of an MSE equal to one, the developed NN is predicting the data “on the mean,” and if the MSE has a value of zero, it indicates an excellent data prediction. Figure 6 depicts the performance of the initial built NN.
Mean squared error (MSE) is calculated using the following equation:
where q: the number of datasets, : value of the output of the NN model for instance number i, and t: actual value of the instance number i.
4.9. Optimization Algorithm
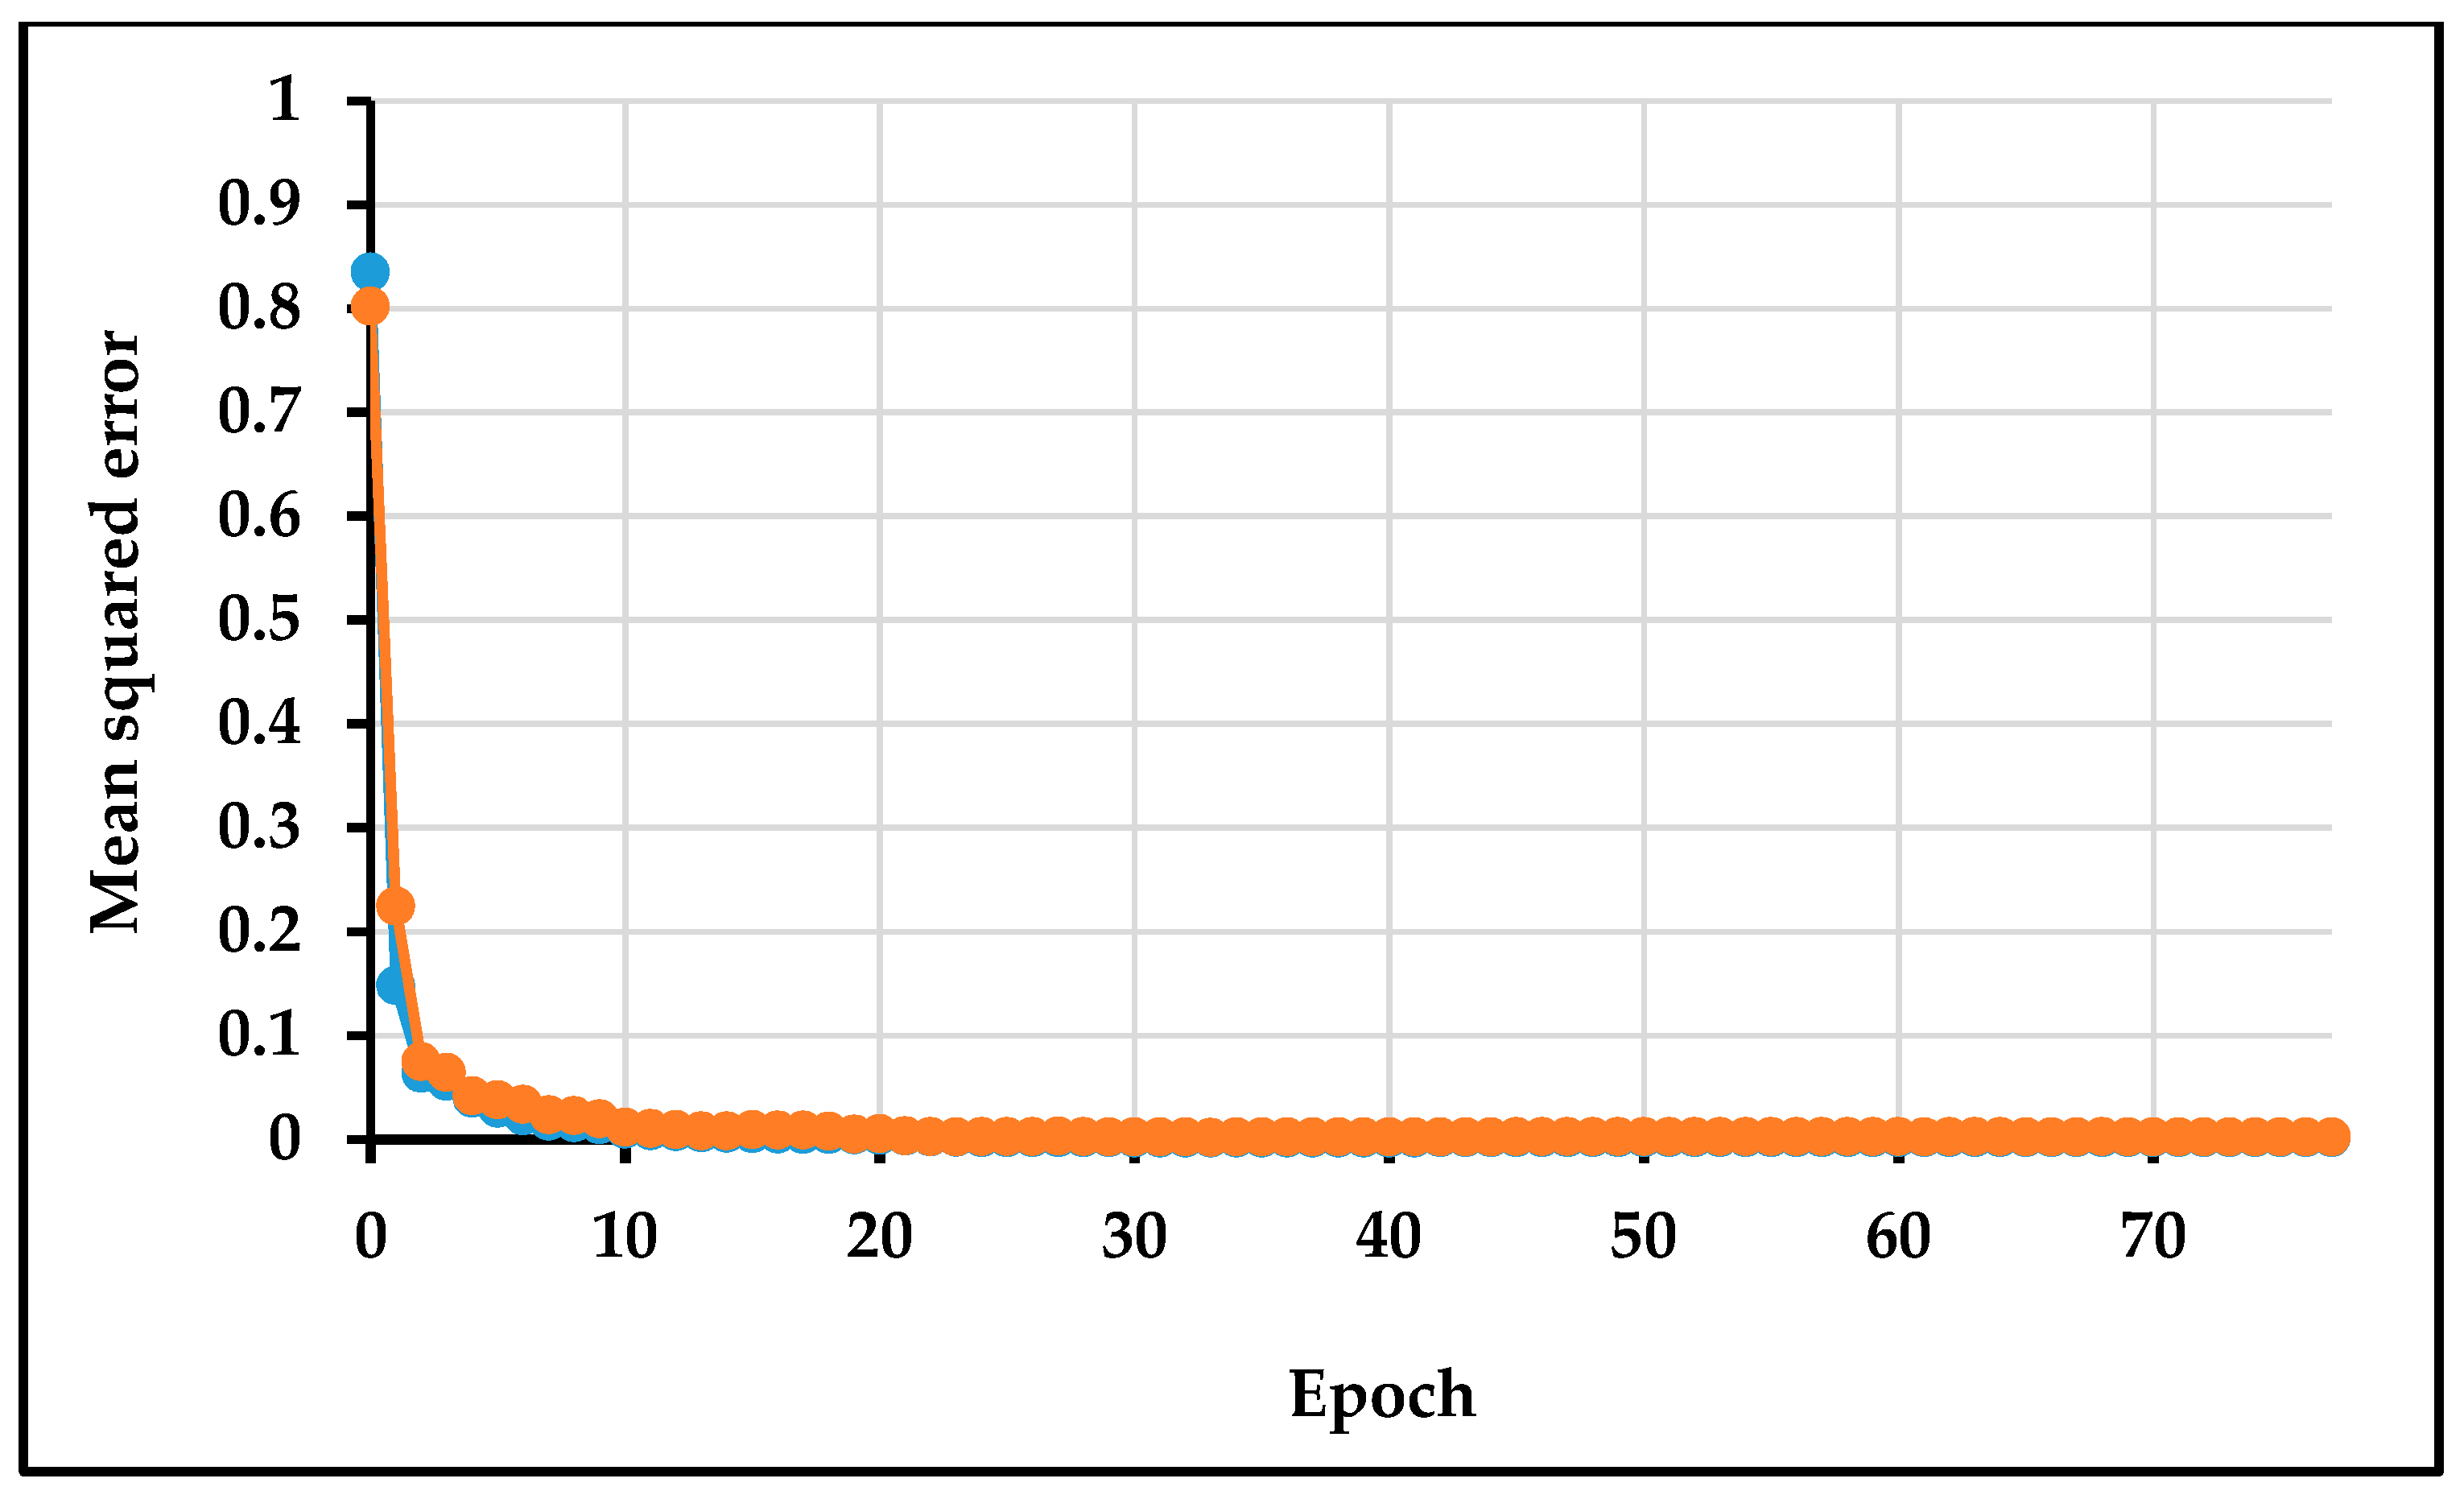
As mentioned earlier, the purpose of training the neural network is to identify the parameters (weight and bias) to minimize the loss. As presented in Figure 7, the quasi-Newton method was utilized to develop the model for training/learning. It used a Hessian function for the loss function, and it calculated the approximation of the inverse Hessian for each repetition of the optimization algorithm by utilizing the gradient information.
Figure 7 presents the selection errors and training for each iteration. The training error is shown using a blue line, while the selection error is shown as an orange line. It should be noted that the training error of the initial value was 0.834803 and the training error of the final value after 77 epochs was 0.00132409, while the selection error of the initial value was 0.801911 and the final value after 77 epochs was 0.00232821, which indicates a considerable improvement compared with Figure 6. Table 10 represents the results of the model training using the quasi-Newton method, which comprises several final states from the ANN, the loss function, and the optimization algorithm.
4.10. Model Selection
The aim of the model selection step was to identify the architecture of the best NN model with the best generalization properties that had the minimum error and displayed the most optimal behavior with new data. The best generalization was accomplished by utilizing the model with complexity that was the most appropriate to produce a high enough quality fit of the data.
The two algorithms used were (1) order selection and (2) input selections. The former one was responsible for figuring out the optimal number of hidden neurons, while the second one was responsible for figuring out the input variables’ optimal subset. The algorithm of the order selection that was used for the development of the model was “incremental order,” which began with the minimum number of neurons (order), as seen in Figure 8a, and then increased with a certain number of perceptions in each iteration. The algorithm selected the neurons (order) with the minimal selection loss. It is worth noting that with a greater the number of neurons, the error of selection increased because of overfitting since it was a complex model. The achieved election error was MSE = 0.0159995. The optimal number of neurons (order) was three, as depicted in Figure 8b.
On the other hand, the algorithm for input selection, which was used for the developed model, was “growing inputs,” in which the inputs were increased according to its correlations with the targets.
Figure 8a displays the error history for the different subsets during the selection process of the “incremental order.” The line in blue gives the training error, while the line in orange illustrates the selection error. On the other hand, Figure 8b displays the error history for the different subsets during the growing inputs selection process. The blue line illustrates the training error, while the orange line illustrates the selection error. The figure shows that the best architectural neural network was the one with three hidden neurons. Figure 9 illustrates the architecture of the optimal selected model, in, where the circles in yellow depict the scaling neurons, the circles in blue depict the neurons, and the circles in red depict the unscaling neurons.
4.11. Model Testing
The main objective of carrying out the model testing was to assess the performance and accuracy of the developed neural network by comparing its output(s) against already known targets in the set of independent variables. After the testing was completed and the neural network under consideration provided satisfactory results, the network could then go to a validation stage, as explained later. For this type of problem, the method of approximation testing was applied, which included measuring the errors of the model using the mean squared error (MSE), as depicted in Table 11 below. The error statistics indicated that the mean of the percentage errors was 2.17%.
The linear regression technique was applied to test the error of the optimal selected model. The analysis compared the output of the model and the known target for an independent testing subset. Three ranges for each output variable were obtained: “A” and “B,” link to the y-intercept, and the slope of the optimum linear regression connecting the scaled outputs and targets. The third parameter, R2, correlated the coefficient between the scaled outputs and the model targets. The slope should be 1 if the regression has the best fit, which means the target is equal to the model output and the y-intercept would be “0.” Table 12 summarizes the linear regression parameters for the scaled output, while Figure 10 charts the linear regression for the scaled output. Figure 11 depicts two lines of comparison of the scaled output. The figure represents the actual ones as circles versus the values predicted by the developed model. The grey line of the linear regression indicates the best linear fit. The analysis parameters of this analysis had a correlation of 0.977 and a slope of 0.932. It should be noted that the correlation coefficient is the most important parameter. Since the value of the correlation was very close to 1, it is clearly seen that the model predicted the consumption of energy reasonably accurately.
4.12. Model Validation
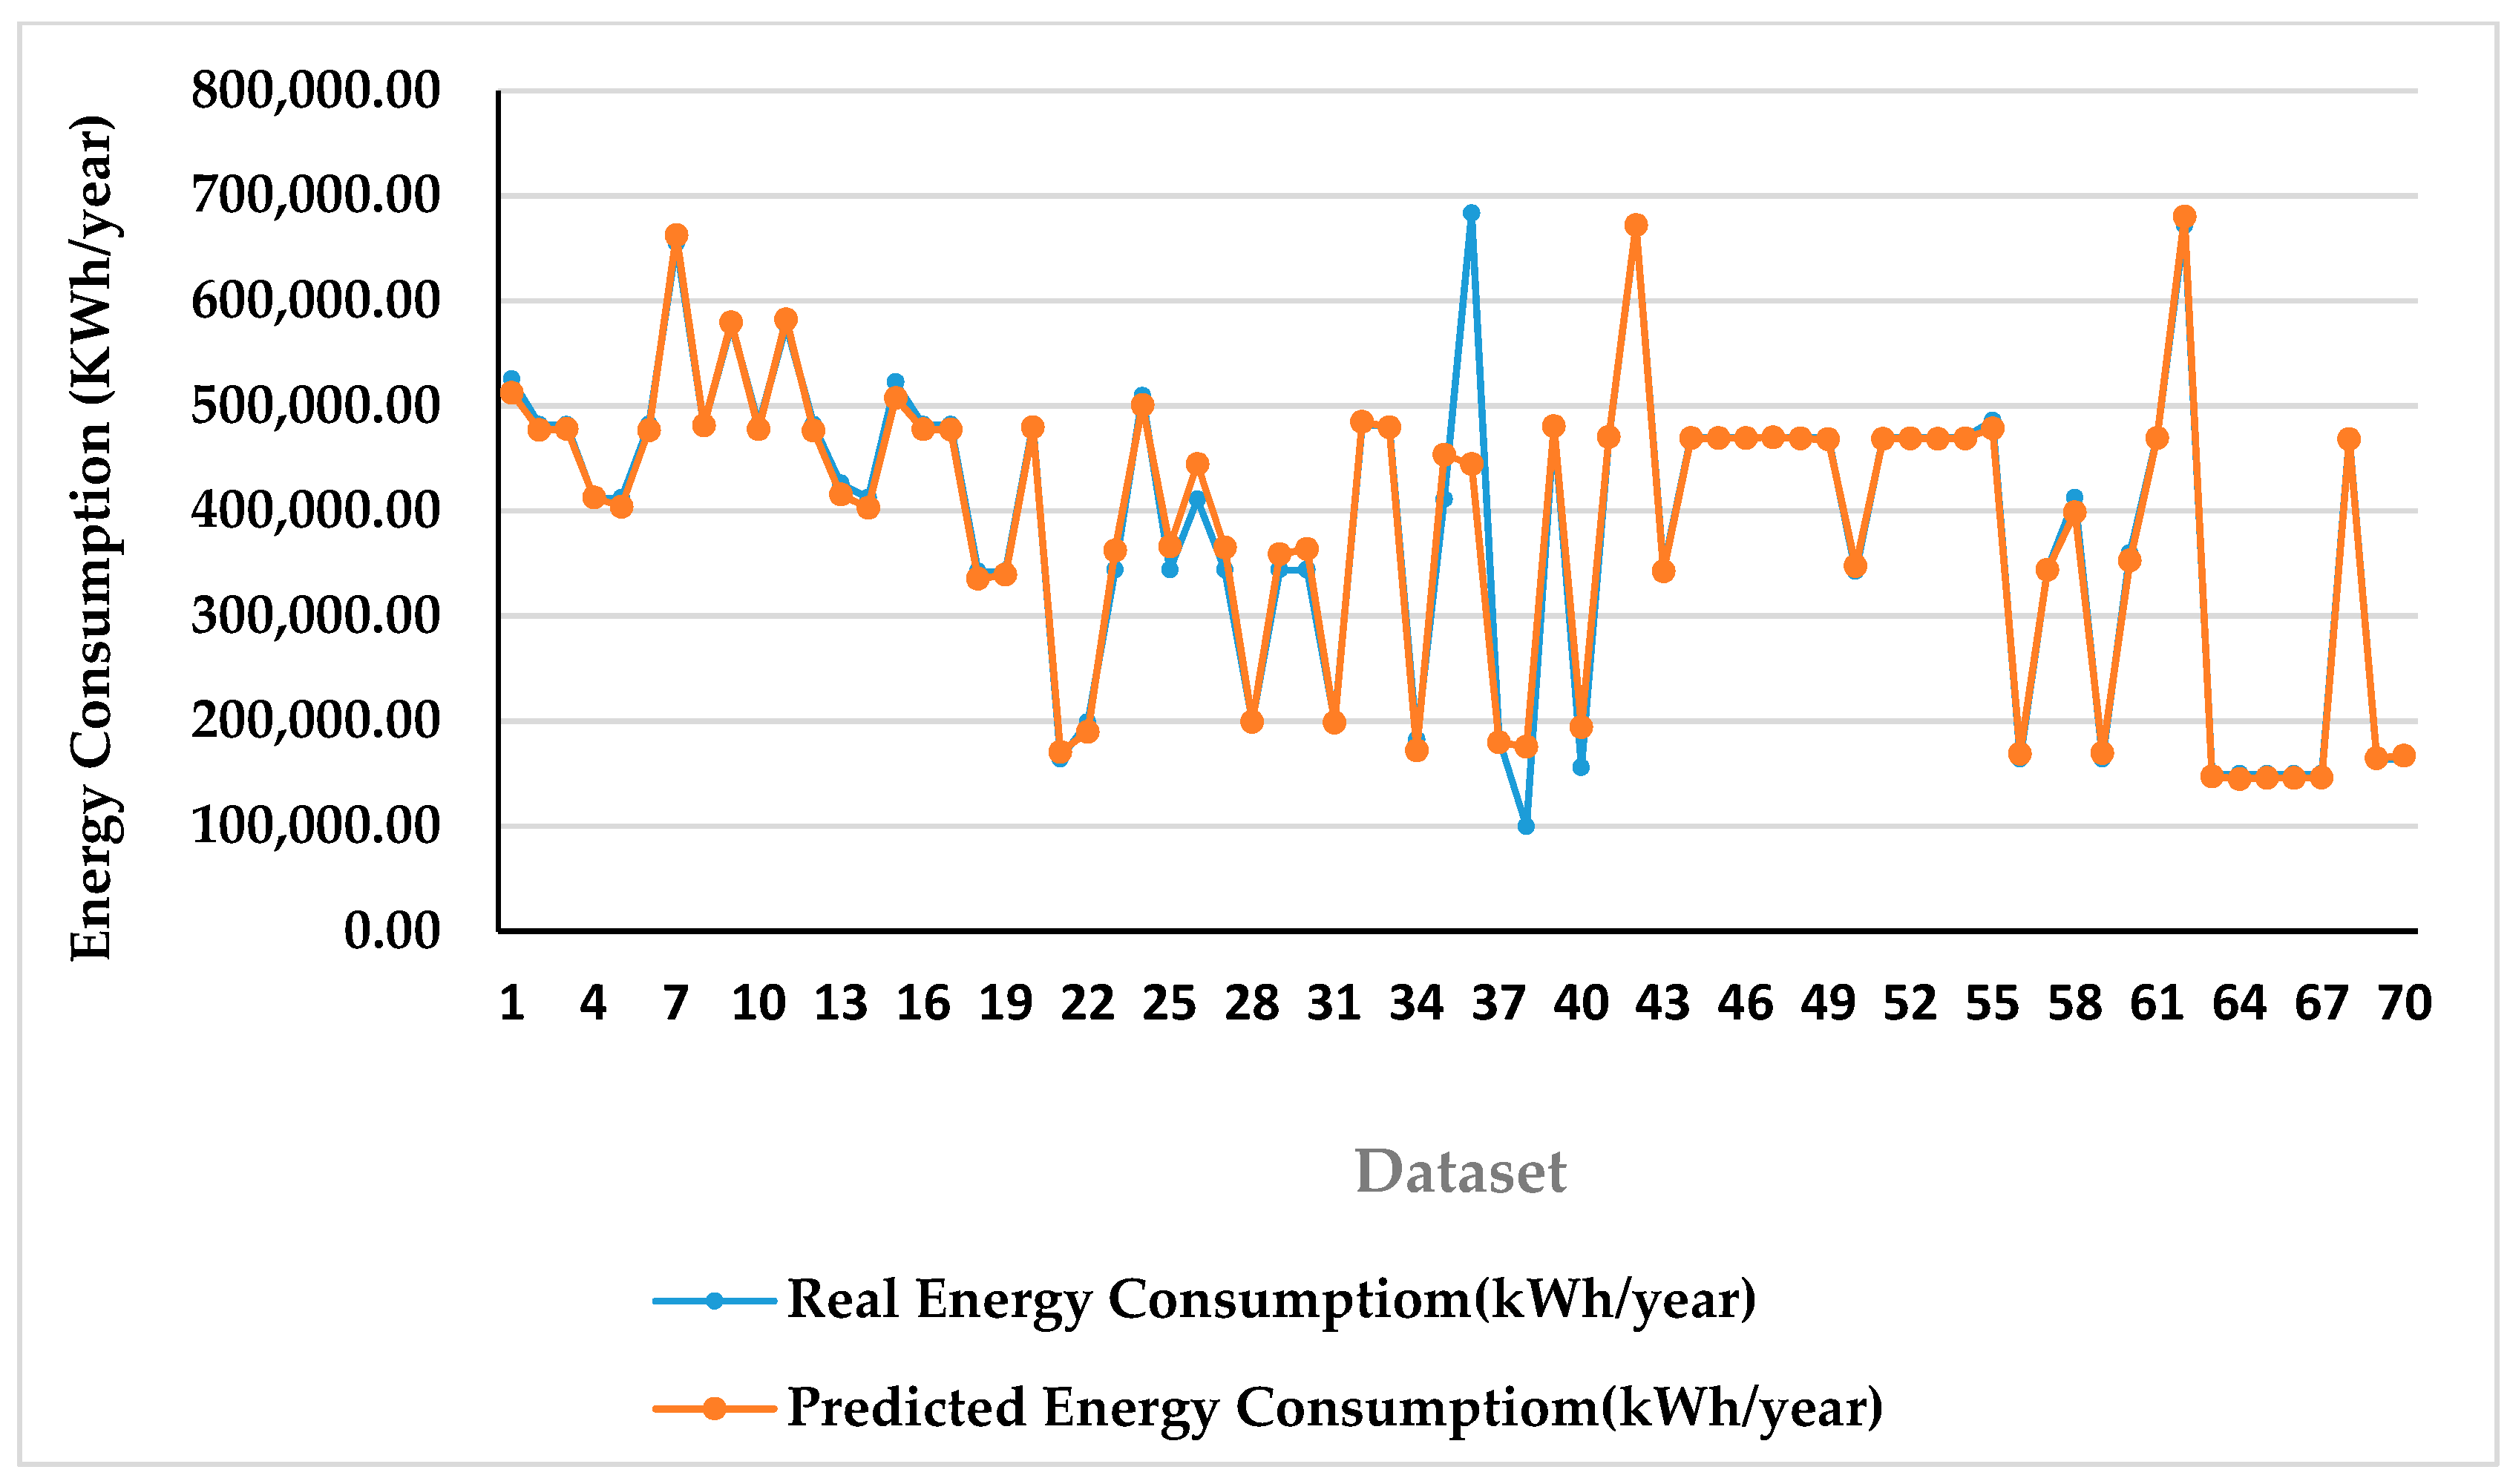
Model validation is the process of applying the developed model to new datasets to assess its performance and accuracy with new data. Eight new datasets that represented different school models from different cities were used. As can be seen from Table 13 and Figure 12, the developed model had excellent accuracy for these cases. The third column in the table shows the error percentage. It is clear that the model provided an excellent prediction and the percentage of error ranged from −3.10% to less than +11%. It was noted that 87.5% of the predicted values had less than 10% error, showing the developed model could predict the energy consumption well. The achieved accuracy is in accordance with the fifth-class estimate issued by “Association for the Advancement of Cost Engineering” (ACCE) [32].
Moreover, a sensitivity analysis was applied to identify the change of the model output as a function of a single input variable, while all the other variables were unchanged. Figure 13 depicts how the input variables varied with the energy consumption (output), while the other input variables were fixed. As can be seen, the total roof area increased exponentially for high values of energy consumption, while the total built area for all floors decreased for high values of energy consumption. Here, it seems that the number of AC units was a function of the number of classrooms rather than a function of the school area. Furthermore, in Figure 13, the number of floors and the number of classes had an inverse relationship with energy consumption. This was as a result of the roof area is the most important factor for energy consumption. For example, a total school area of 3000 sqm that is divided into three floors (1000 sqm each) is much better than if it is divided into two floors (1500 sqm each); therefore, a multi-story school building is better than a one-floor school. Furthermore, the optimal total roof area was 1000 sqm, while the mean floor area of the existing schools was 1524.47 sqm. Note that the point in gray color represents the reference point.
5. Conclusions
The literature shows that in Saudi Arabia, there is a shortage of studies focusing on the prediction of the consumption of the energy in constructed buildings, especially governmental buildings, such as schools. Thus, this paper presented a study conducted in Eastern Province in Saudi Arabia that aimed to (1) identify the factors controlling the consumption of energy in school buildings and (2) develop an energy consumption prediction model for this class of buildings. The model was developed using an artificial neural network and it was built utilizing 352 real datasets. Nine cities and four school types across Eastern Province were included in the study.
The developed energy prediction model can be used to support a government agent in making optimal use of their available constrained budgets, plan taking corrective actions for future schools’ construction, and design to minimize energy consumption. The model can be extended to account for other factors that were not included in this study, such as the schools’ orientation, especially in urban areas. The model can act as a standalone application or it can be integrated with a BIM model that can assist designers with predicting energy consumption instead of using an unrealistic simulation tool that requires a lot of data, which is not available at the conceptual design stage.
The study has found that the weakest correlation between input variables (factors influencing energy consumption) was recorded as −0.35 between “type of school” and “AC capacity,” while the strongest correlation was recorded as 0.95 between the variables of “number of classrooms” and “total air-conditioned area (sqm),” followed by the variables of “total air-conditioned area (sqm)” and “number of students” recorded as 0.90. It is worth noting that “AC capacity” was found to be the most significant predictor, which increased exponentially for high values of energy consumption, followed by “total school roof area.”
Validation of the developed model indicated satisfactory results, with an 87.5% accuracy, which is in good concord with the class 5 parametric estimation (18R-97) issued by the ACCE. The methodology applied in this study for developing the prediction model can be applied for similar projects, while it was shown that it is possible to apply it efficiently for predicting future energy consumption in the same sector of school buildings. A similar study can be conducted for private schools in Saudi Arabia in which the factors influencing energy consumption are different.
Funding
This research received no external funding.
Acknowledgments
The authors would like to thank King Fahd University of Petroleum and Minerals for the buildings and support that contributed to carrying out this research. The authors would also like to thank the experts who participated in this study.
Conflicts of Interest
The authors declare no conflict of interest.
References
- Available online: https://www.worldometers.info/energy/saudi-arabia-energy/ (accessed on 4 August 2020).
- Available online: https://www.ceicdata.com/en/indicator/saudi-arabia/oil-consumption (accessed on 5 August 2020).
- Available online: https://www.bakerinstitute.org/media/files/research-document/09666564/ces-pub-saudienergy-011819.pdf (accessed on 5 August 2020).
- Retrieved From: Ministry of Finance—Kingdom of Saudi Arabia. Available online: https://www.mof.gov.sa/financialreport/budget2019/Documents/%D8%A8%D9%8A%D8%A7%D9%86%20%D8%A7%D9%84%D9%85%D9%8A%D8%B2%D8%A7%D9%86%D9%8A%D8%A9%20U18-3AM.PDF (accessed on 5 August 2020).
- Available online: https://departments.moe.gov.sa/Statistics/Educationstatistics/Pages/GEStats.aspx (accessed on 5 August 2020).
- Edwards, D.J.; Holt, G.D.; Harris, F.C. Estimating life cycle plant maintenance costs. Constr. Manag. Econ. 2000, 18, 427–435. [Google Scholar] [CrossRef]
- Available online: https://www.ecra.gov.sa/enus/MediaCenter/DocLib2/Pages/SubCategoryList.aspx?categoryID=4 (accessed on 6 August 2020).
- Available online: https://data.worldbank.org/indicator/EG.USE.ELEC.KH.PC?locations=SA (accessed on 6 August 2020).
- Available online: https://www.se.com.sa/en-us/customers/Pages/TariffRates.aspx (accessed on 6 August 2020).
- Alshibani, A.; Alshamrani, O. ANN/BIM-based model for predicting the energy cost of residential buildings in Saudi Arabia. J. Taibah Univ. Sci. 2017, 11, 1317–1329. [Google Scholar] [CrossRef] [Green Version]
- Available online: https://www.moe.gov.sa/en/Pages/default.aspx (accessed on 6 August 2020).
- Taleb, M.H.; Sharples, S. Developing sustainable residential buildings in Saudi Arabia: A case study. Appl. Energy 2009, 88, 383–391. [Google Scholar] [CrossRef]
- Al-Rashed, F.; Asif, M. Trends in residential energy consumption in Saudi Arabia with particular reference to the Easternn Province. J. Sustain. Dev. Energy Water Environ. Syst. 2014, 4, 376–387. [Google Scholar] [CrossRef] [Green Version]
- Ashraf, N.; Almaziad, F. Effects of Facade on the Energy Performance of Education Building in Saudi Arabia; World Sustainable Building: Barcelona, Spain, 2014; ISBN 978-84-697-1815-5. [Google Scholar]
- Abdel-Aal, R.; Al-Garni, A.Z.; Al-Nassar, Y.N. Modelling and forecasting monthly electric energy consumption in Easternn Saudi Arabia using abductive networks. Energy 1997, 22, 911–921. [Google Scholar] [CrossRef]
- Nasr, G.E.; Badr, E.A.; Younes, M.R. Neural networks in forecasting electrical energy consumption: Univariate and multivariate approaches. Int. J. Energy Res. 2002, 26, 67–78. [Google Scholar] [CrossRef]
- Yedra, R.; Díaz, F.R.; Nieto, M.M.; Arahal, M.R. A neural network model for energy consumption prediction of CIESOL bioclimatic building. In Proceedings of the International Joint Conference SOCO’13-CISIS’13-ICEUTE’13, Salamanca, Spain, 11–13 September 2013. [Google Scholar]
- Amato, F.; López, A.; Peña-Méndez, E.M.; Vaňhara, P.; Hampl, A.; Havel, J. Artificial neural networks in medical diagnosis. J. Appl. Biomed. 2013, 11, 47–58. [Google Scholar] [CrossRef]
- Kumar, R.; Aggarwal, R.K.; Sharma, J.D. Energy analysis of a building using artificial neural network: A review. Energy Build. 2013, 65, 352–358. [Google Scholar] [CrossRef]
- Karatasou, S.; Santamouris, M.; Geros, V. Modeling and predicting building’s energy use with artificial neural networks: Methods and results. Energy Build. 2006, 8, 949–958. [Google Scholar] [CrossRef]
- Kim, T.; Kang, B.; Kim, H.; Park, C.; Hwa Hong, W. The study on the energy consumption of middle school buildings in Daegu, Korea. Energy Rep. 2019, 5, 993–1000. [Google Scholar] [CrossRef]
- Ouf, M.M.; Issa, M.H. Energy consumption analysis of school buildings in Manitoba, Canada. Int. J. Sustain. Built Environ. 2017, 6, 359–371. [Google Scholar] [CrossRef]
- Meng, M.; Shang, W.; Niu, D. Monthly electric energy consumption forecasting using multi-window moving average and hybrid growth models. J. Appl. Math. 2014, 2014, 1–7. [Google Scholar]
- Li, C.; Ding, Z.; Zhao, D.; Yi, J.; Zhang, G. Building energy consumption prediction: An extreme deep learning approach. Energies 2017, 10, 1525. [Google Scholar] [CrossRef]
- Menezesab, A.C.; Crippsa, A.; Bouchlaghemb, D.; Buswellb, R. Predicted vs. actual energy performance of non-domestic buildings: Using post-occupancy evaluation data to reduce the performance gap. Appl. Energy 2012, 97, 355–364. [Google Scholar] [CrossRef] [Green Version]
- Moon, J.; Park, J.; Hwang, E.; Jun, S. Forecasting power consumption for higher educational institutions based on machine learning. J. Supercomput. 2018, 74, 3778–3800. [Google Scholar] [CrossRef]
- Hong, T.; Koo, C.; Jeong, K. A decision support model for reducing electric energy consumption in elementary school buildings. Appl. Energy 2012, 95, 253–266. [Google Scholar] [CrossRef]
- Beusker, E.; Stoy, C.; Pollalis, S.N. Estimation model and benchmarks for heating energy consumption of schools and sport buildings in Germany. Build. Environ. 2012, 49, 324–335. [Google Scholar] [CrossRef]
- Jeong, K.; Koo, C.; Hong, T. An estimation model for determining the annual energy cost budget in educational buildings using SARIMA (seasonal autoregressive integrated moving average) and ANN (artificial neural network). Energy 2014, 71, 71–79. [Google Scholar] [CrossRef]
- Fellows, R.; Liu, A. Research Methods for Construction, 4th ed.; John Wiley & Sons: Hoboken, NJ, USA, 2015. [Google Scholar]
- Available online: https://www.neuraldesigner.com/ (accessed on 3 August 2020).
- Dysert, L.R. Sharpen your cost estimating skills. J. Cost Eng. 2003, 6, 22–30. [Google Scholar]
Figure 1.
Research methodology. MSE: Mean squared error, NN: Neural network.

Figure 2.
Model development.

Figure 3.
Scatter charts of different factors.

Figure 4.
Target input variable correlations.

Figure 5.
Architecture of the initial built NN.

Figure 6.
Performance of the initial built NN.

Figure 7.
Quasi-Newton method error history.

Figure 8.
Growing inputs and incremental order error plot.

Figure 9.
Optimal selected architecture (developed model).

Figure 10.
Linear regression for the scaled energy consumption.

Figure 11.
Two-line comparison for the model testing.

Figure 12.
Model validation.

Figure 13.
Sensitivity analysis.


Table 1.
Energy consumption in the Kingdom of Saudi Arabia (KSA) in 2017 [3].
Table 1.
Energy consumption in the Kingdom of Saudi Arabia (KSA) in 2017 [3].
| Energy Consumption Category | Proportion |
|---|---|
| Residential | 48.1% |
| Commercial | 16.2% |
| Governmental buildings | 13% |
| Industrial | 18.4% |
| Others | 4.4% |
Table 2.
Revised tariff [9].
Table 2.
Revised tariff [9].
| Consumption Categories (kWh) | Residential (Halalah/kWh) | Commercial (Halalah/kWh) | Governmental (Halalah/kWh) | Private Educational Buildings, Private Medical Buildings (Halalah/kWh) |
|---|---|---|---|---|
| 1–6000 | 18 | 20 | 32 | 18 |
| More than 6000 | 30 | 30 |
1 SAR = 100 Halalah.
Table 3.
Local experts’ profiles.
| Position | Educational Level | Years of Experience (Years) | Area of Expertise |
|---|---|---|---|
| Manager of projects inspection and supervision department in the Ministry of Education | Master’s degree in architectural engineering | 14 | Facility management |
| Saudi Electrical company | Graduate student | 11 | Building energy use |
| Faculty at IMU | PhD in architectural engineering | 12 | Construction and engineering management |
Table 4.
Identified factors that influence the energy consumption of school buildings.
| Identified Factor | Action |
| Location | Considered in the study |
| Age of building | Considered in the study |
| Building envelope system | Not considered since it is common in all schools |
| Number of occupants | Considered in the study (see below) |
| Area of building | Considered in the study |
| Glazing systems | Not considered since it is common in all schools |
| Thermal insulation roofs and walls | Not considered since it is common in all schools |
| Energy-efficient lighting | Not considered since it is common in all schools |
| Proper shading | Not considered since schools are not surrounded by other buildings |
| Weather conditions | Not considered since the study focused only on Eastern Province which has the same climate zone throughout |
| Air-conditioning systems | Considered in the study |
| Cooking appliances | Not considered |
| Factors Suggested by the School Board and Not Included Above | |
| Number of floors | Considered in the study |
| Total air-conditioned area | Considered in the study |
| Total roof area | Considered in the study |
| Type of school | Considered in the study |
| Number of students | Considered in the study |
| Number of staff | Considered in the study |
| Number of classrooms | Considered in the study |
| Operating hours per year | Not considered since it is common in all schools |
| Lighting fixtures | Not considered since it is common in all schools |
| Water pump 3 HP | Not considered since it is common in all schools |
| Fire pump 15 HP | Not considered since it is common in all schools |
HP: Hours power.
Table 5.
Sample of the collected data.
| City | Number of Floors | Total Built Area—All Floors (sqm) | Total Roof Area (sqm) | Type of School | Number of Students | Number of Staff | Age of Building | Number of Classrooms | Total Air-Conditioned Area (sqm) | AC Capacity (TR) | Energy Consumption (kWh/Year) |
|---|---|---|---|---|---|---|---|---|---|---|---|
| 1 | 3 | 4275 | 1425 | 1 | 190 | 16 | 31 | 7 | 409.5 | 200 | 481,799.00 |
| 1 | 3 | 2622 | 874 | 2 | 541 | 23 | 40 | 19 | 1111.5 | 200 | 525,146.00 |
| 1 | 3 | 4275 | 1425 | 3 | 537 | 33 | 31 | 17 | 994.5 | 200 | 481,799.00 |
| 2 | 3 | 4056 | 1352 | 4 | 472 | 24 | 22 | 15 | 877.5 | 247.5 | 577,247.00 |
| 2 | 3 | 2804 | 935 | 1 | 93 | 8 | 29 | 4 | 234 | 154 | 412,194.00 |
| 3 | 3 | 3534 | 1178 | 3 | 245 | 40 | 45 | 10 | 585 | 200 | 481,799.00 |
| 1 | 3 | 4275 | 1425 | 3 | 204 | 19 | 34 | 10 | 585 | 200 | 481,799.00 |
| 5 | 2 | 1634 | 817 | 4 | 497 | 27 | 35 | 18 | 1053 | 154 | 343,587.00 |
TR: A ton of refrigeration.
Table 6.
Identified factors (variables).
| Variables | Definition |
|---|---|
| City | Location of the school in Eastern Province. Data were collected from nine different cities and they were defined in the NN as a number: Dammam = 1, Khobar = 2, Thoqba = 3, Dhahran = 4, Qatef = 5, Naiyrah = 6, Kafje = 7, Abqaq = 8, Qaryah = 9 |
| Number of floors | Number of floors of the school |
| Total built area—all floors (sqm) | Total built area of the school; if the school had three floors and each floor area was 1000 sqm, then the total area = 3000 sqm |
| Total roof area (sqm) | Total roof area = the area of one floor |
| Type of school (four different school types considered) | Type of school included:
|
| Number of students | Total number of students enrolled |
| Number of staff | Academic and non-academic staff |
| Age of building | Age of building |
| Number of classrooms | Number of classrooms |
| Total air-conditioned area (sqm) | Only area covered by AC |
| AC capacity | Capacity of used AC |
Table 7.
Basic statistics of the collected data.
| Variables | Minimum | Maximum | Mean | Deviation |
|---|---|---|---|---|
| Number of floors | 1 | 3 | 2.6 | 0.59 |
| Total built area—all floors (sqm) | 361 | 6900 | 4165.6 | 1902.66 |
| Total roof area (sqm) | 361 | 3078 | 1524.47 | 649.15 |
| Number of students | 10 | 1259 | 381.1 | 217.57 |
| Number of staff | 10 | 76 | 28.18 | 13.01 |
| Age of building | 11 | 58 | 32.82 | 9.35 |
| Number of classrooms | 2 | 40 | 14.26 | 6.12 |
| Total air-conditioned area (sqm) | 117 | 2340 | 817.71 | 354.6 |
| AC Capacity in ton of refrigeration (TR) | 38 | 250 | 160.12 | 55.82 |
| Annual energy consumption (kWh/year) | 99,275 | 683,192 | 410,968.1 | 143,405.3 |
Table 8.
Model input variables correlation.
| Variables | City | Number of Floors | Total Built Area—All Floors (sqm) | Total Roof Area (sqm) | Type of School | Number of Students | Number of Staff | Age of Building | Number of Classrooms | Total Air-Conditioned Area (sqm) | AC Capacity (TR) |
|---|---|---|---|---|---|---|---|---|---|---|---|
| City | 1 | −0.3 | −0.27 | −0.25 | 0.11 | −0.37 | −0.24 | −0.057 | −0.3 | −0.31 | −0.35 |
| Number of floors | 1 | 0.65 | 0.29 | −0.14 | 0.3 | 0.28 | 0.042 | 0.28 | 0.26 | 0.36 | |
| Total built area—all Floors (sqm) | 1 | 0.86 | −0.066 | 0.38 | 0.37 | 0.1 | 0.36 | 0.37 | 0.43 | ||
| Total roof area (sqm) | 1 | 0.018 | 0.34 | 0.28 | 0.065 | 0.3 | 0.31 | 0.58 | |||
| Type of school | 1 | 0.19 | −0.23 | 0.081 | 0.12 | 0.15 | −0.015 | ||||
| Number of students | 1 | 0.7 | 0.086 | 0.88 | 0.9 | 0.3 | |||||
| Number of staff | 1 | 0.054 | 0.72 | 0.73 | 0.16 | ||||||
| Age of building | 1 | 0.072 | 0.068 | 0.083 | |||||||
| Number of classrooms | 1 | 0.95 | 0.24 | ||||||||
| Total air-conditioned area (sqm) | 1 | 0.21 | |||||||||
| AC capacity | 1 |
TR: A ton of refrigeration.
Table 9.
Correlations of the model target vs. input variables.
| Variables | Type | Energy Consumption (kWh/Year) |
|---|---|---|
| AC capacity (TR) | Linear | 0.970322 |
| Total roof area (sqm) | Linear | 0.651111 |
| Total built area—all floors (sqm) | Linear | 0.467787 |
| City | Linear | −0.32561 |
| Number of floors | Linear | 0.321832 |
| Number of students | Linear | 0.308813 |
| Number of classrooms | Linear | 0.249501 |
| Total air-conditioned area (sqm) | Linear | 0.230085 |
| Number of staff | Linear | 0.158932 |
| Age of building | Linear | 0.021651 |
| Type of school | Linear | 0.011883 |
Table 10.
Results of the model training using the quasi-Newton method.
| Parameters | Value |
|---|---|
| Final parameters norm | 2.34 |
| Final training error | 0.00132 |
| Final selection error | 0.00233 |
| Final gradient norm | 0.000798 |
| Epochs number | 77 |
| Elapsed time | 0:00 |
| Stopping criterion | Gradient norm goal |
Table 11.
Developed model’s mean squared errors.
| Training | Selection | Testing | |
|---|---|---|---|
| Mean squared error | 0.00542362 | 0.0159995 | 0.0564305 |
Table 12.
Linear regression parameters.
| Parameter | Value |
|---|---|
| Slope | 0.932 |
| Correlation | 0.977 |
Table 13.
Model validation.
| Predicted Energy Consumption (kWh/Year) | Actual Energy Consumption (kWh/Year) | Error % |
|---|---|---|
| 480,623.86 | 481,799.00 | −0.24 |
| 406,777.85 | 412,194.00 | −1.31 |
| 399,430.36 | 412,194.00 | −3.10 |
| 362,324.47 | 343,587.00 | 5.45 |
| 197,452.39 | 198,800.00 | −0.68 |
| 370,902.12 | 343,587.00 | 7.95 |
| 255,557.65 | 230,180.00 | 11.03 |
| 673,892.46 | 671,537.00 | 0.35 |
© 2020 by the author. Licensee MDPI, Basel, Switzerland. This article is an open access article distributed under the terms and conditions of the Creative Commons Attribution (CC BY) license (http://creativecommons.org/licenses/by/4.0/).
Share and Cite
MDPI and ACS Style
Alshibani, A. Prediction of the Energy Consumption of School Buildings. Appl. Sci. 2020, 10, 5885. https://doi.org/10.3390/app10175885
AMA Style
Alshibani A. Prediction of the Energy Consumption of School Buildings. Applied Sciences. 2020; 10(17):5885. https://doi.org/10.3390/app10175885
Chicago/Turabian StyleAlshibani, Adel. 2020. "Prediction of the Energy Consumption of School Buildings" Applied Sciences 10, no. 17: 5885. https://doi.org/10.3390/app10175885
Note that from the first issue of 2016, this journal uses article numbers instead of page numbers. See further details here.