1. Introduction
Welding is a metal joining process which has a crucial role in the manufacturing industry. This process applies heat on the joined metals, so they are melted, fused and joined. This process usually requires a filler metal and sometimes requires pressure to help the joining process of metals [
1,
2]. Under certain conditions, underwater welding is needed, even recently, underwater welding is widely used for maintenance and repairing the damage of underwater structures and underwater pipelines to extend the lifetime of these facilities [
3]. For example, underwater welding has been applied to the maintaining of nuclear power equipment. Water is a moderator and cooler in a nuclear reactor. For maintaining the nuclear reactor, the underwater welding process must be conducted to prevent pollution of nuclear radiation [
4]. Another application of underwater welding is for retaining the offshore platform structures. Managing of these structures usually requires special underwater repair operations. Although several other methods can be used, underwater welding is still considered one of the best practices based on economic reasons.
Based on the principle of the welding process, two types of underwater welding, underwater dry and wet welding processes are well known. Underwater dry welding is a method of underwater metals joining in a weld chamber which is conditioned in a sterile environment. Weld chamber is used to avoid the adverse effects of water and ensure that welding quality is similar to welding joint on land. Underwater wet welding is an underwater welding process which uses a particular waterproof stick electrode. It is carried out directly underwater, so the arc is surrounded by the water environment. Underwater wet welding generally is recommended due to its advantages including equipment is simple, the welder can more easily mobilize welding equipment in water, the preparation process required is fast, the operation is smooth, and the operation costs is cheap. However, the underwater wet welding (UWW) technique also has disadvantages including a decrease in material ductility, increase material hardness in the heat-affected zone (HAZ) area, defects in the weld metal, weld arc instability and the presence of water waves around the welding area. These can be a significant problem because they affect the underwater welding joint, which is susceptibility to crack propagation, high porosity and low mechanical properties. There are many kinds of welding technique for underwater welding application including manual metal arc, flux cored arc welding, gas metal arc welding, etc. The most popular technology for underwater welding application is manual metal arc (MMA) welding due to it is simple and low cost in equipment and operational. However, it will cause problems where metallurgical quality and weld defects are often found and very dependent both on the welder skills and weld parameters [
5]. It is essential to evaluate the properties of underwater MMA welding based on its settings, including weld current and electrode type. Weld current will affect the arc stability, penetration, heat input and HAZ width [
6,
7]. The electrodes of MMA welding can be classified based on the electrode coating in which it will obtain varies in mechanical properties and low hydrogen diffusible levels of weld metal [
8]. Due to the hygroscopic property of the electrode coating, the electrode is still requiring special treatment before being used to avoid the hydrogen diffusion into weld metal.
Underwater structures are placed in an underwater environment and subjected the corrosive fluid such as seawater with a certain level of salinity. Base metals, HAZs and weld metals of underwater weld joints have different potential to lead the corrosion process to occur. It means that underwater welding process will affect the corrosion resistance of joint area significantly because it is related to the heating and cooling rate as well as the coating type of electrode in underwater welding [
9,
10]. This work aims to evaluate the effects of weld current, type of electrode and depth of water on the corrosion rate of underwater welded steel.
2. Experimental Configurations
The material used in this study was SS 400 steel which was widely applied to marine construction. The specimen size was 100 mm × 100 mm × 3 mm. SS 400 steel is low carbon steel that has a carbon content of 0.05%. The electrodes used were E7016, RB 26 and RD 26 type rutile underwater electrodes with a diameter of 3.2 mm waterproof and protected by wax. The underwater welding process was carried out in the water with a depth of 2.5 m, 5 m and 10 m in the experimental pond using the SMAW welding process. The results of underwater welding are to be compared with ground welding. The welding parameters used in the welding process are electric currents 100 A and 110 A. During an observation in one setting, e.g., water depth. Other parameters, e.g., voltage and current, will be set to be a constant value. Electrodes in this study are selected based on market availability with consideration to the existing range that can be used to weld thin plates with a certain thickness. According to the WPS (welding procedure specification), the lower current limit for low carbon steel plates with a thickness of 3 mm is 100 A. If welding is carried out with a current lower than 100 A, the arc is unstable, and the weld results will have a low penetration. Conversely, the upper limit of the current is 110 A, because if it is welded with a current higher than 110 A, the plate will experience holes.
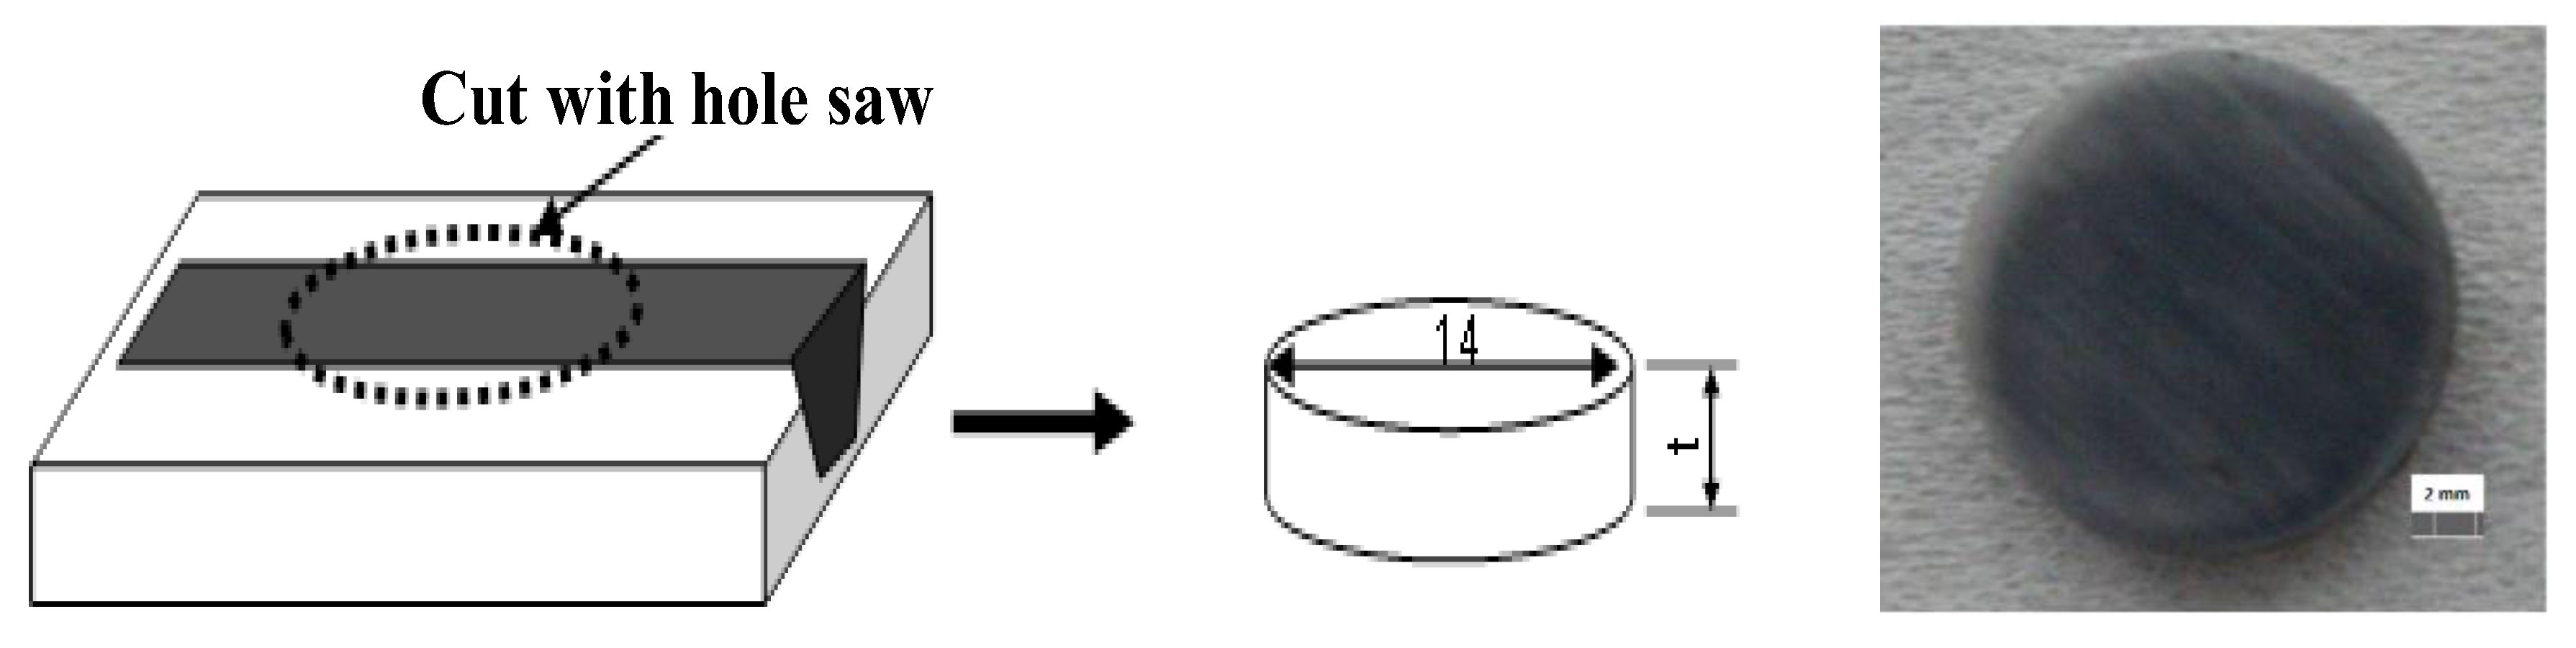
Practically, the three electrodes are often used in welding underwater carbon steel materials, and technically they can substitute one another. However, the technical review of underwater welding is limited to its acceptance of the standards used such as AWS which reviews physical and mechanical properties. The physical properties are in the form of welding defects and appearance of the welding campus, while the mechanical properties consist of tensile, bending and impact strength. Chemical properties in the form of corrosion are not a requirement for acceptance of the welded joints, so the effect of these types of electrodes on corrosion has not been investigated. According to the results of this study, electrode selection recommendations can be added to the corrosion resistance requirements. The corrosion testing method used for this test was the three-electrode polarization resistance method to determine the surface corrosion rate of welded joints. As a comparison, corrosion tests on the results of ground welds were also carried out. Illustration of cutting and dimensions of the specimen is as shown in
Figure 1. Scanning electron microscope (SEM) and energy-dispersive X-ray spectroscopy (EDS) tests were carried out to see the type of corrosion that occurred and the distribution of chemical composition of intermetallic matrix and particles. Corrosion test using VersaStudio 2.50.3 software (AMATEK, Inc., Berwyn, US) and VersaSTAT 4 hardware (AMATEK, Inc., Berwyn, US). This test was carried out with a range of −0.25 V to 0.2 V against corrosion potential (
Ecorr) and a scan rate of 2 mV/s. As a comparison, corrosion tests are also carried out on the ground welding results. Corrosion testing is carried out by scanning V values by rotating the potentiodynamic in stages and obtaining voltage (V) and current (A) data, then plotted in the E–I graph. From this graph plot obtained Tafel constants for anode and cathode in the form of graph slope and corrosion current (
Icorr) which is in the way of the intersection of the two Tafel constants. The corrosion rate is expressed by the formula:
CR is the corrosion rate in miles per year (mpy) which will be converted into mmpy (millimeters per year), 0.1288 is a factor constant in mpyg/μAcm,
Icorr is the current density in μA/cm
2,
ρ is the density in g/cm
3. (
EW) can be expressed as an equivalent weight, where
EW =
Neq−1, whereas Neq can be stated by the formula:
The per cent mass fraction of an element in an alloy is shown by
fi,
ni is the electron valence of the item in question, and
ai is the atomic weight of the component.
3. Results and Discussion
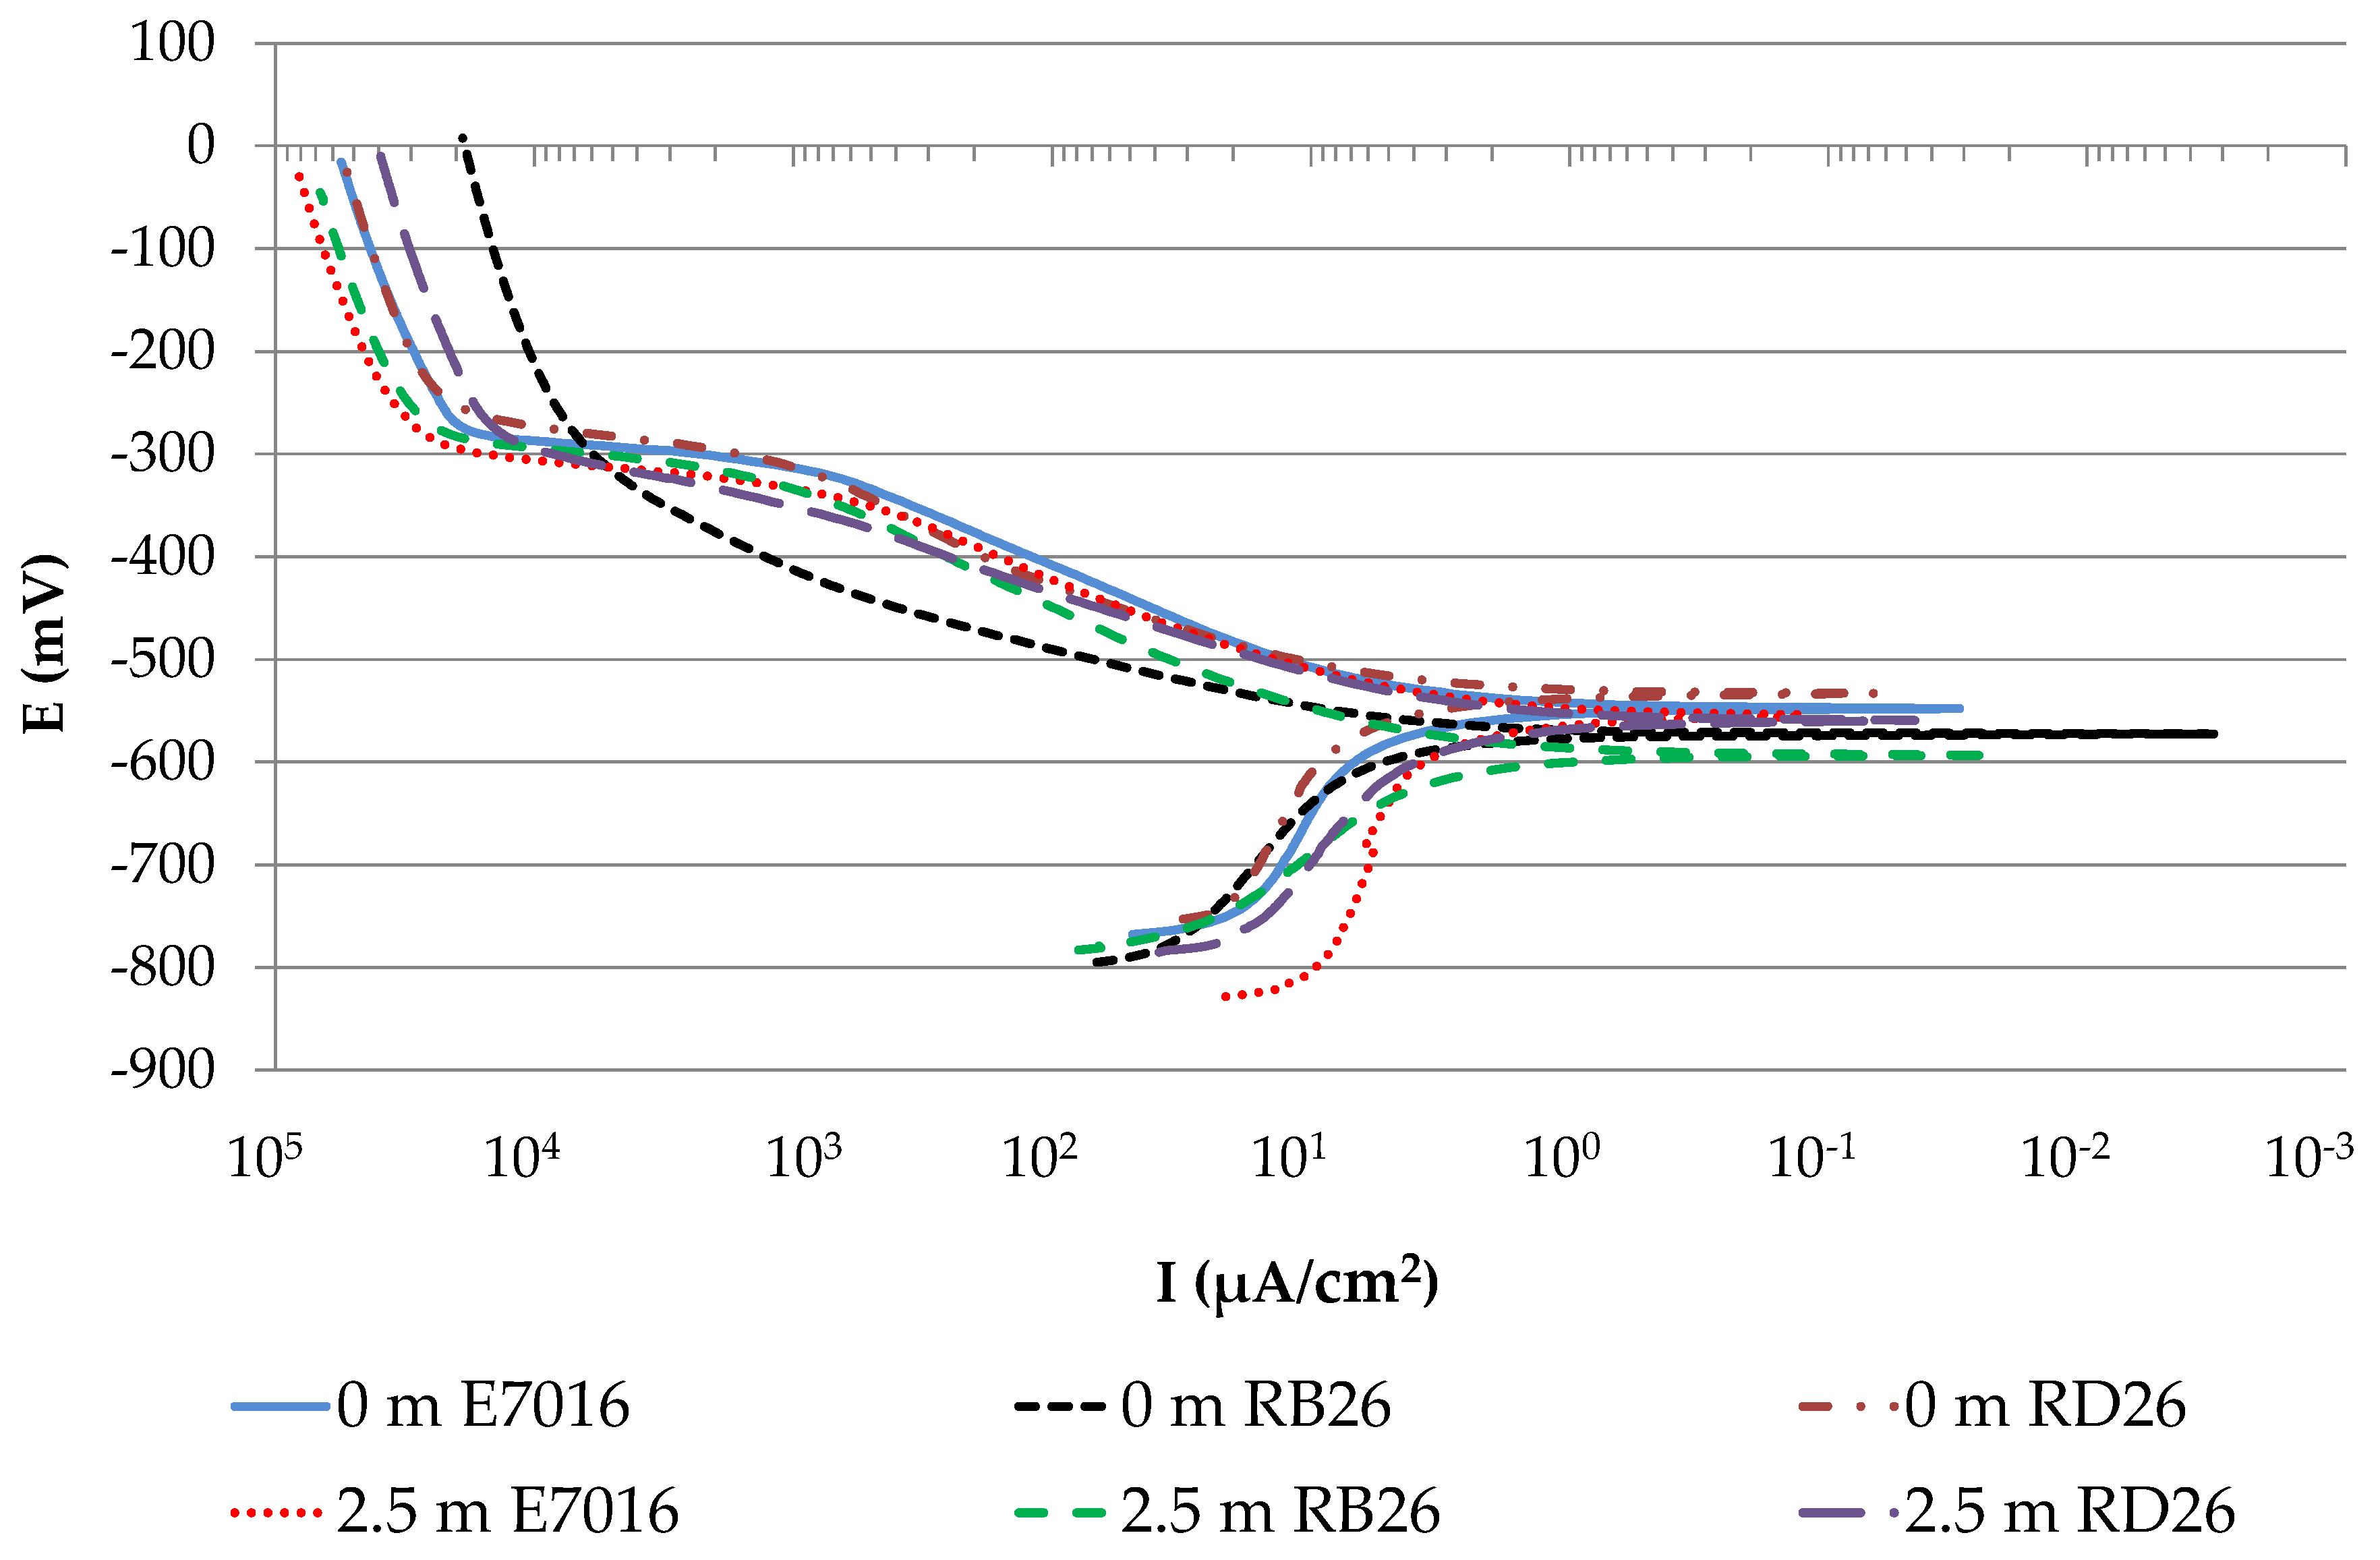
Potentiodynamic polarization testing was carried out using a 3.5% NaCl solution and produced a Tafel diagram to show the corrosion rate of SS400 steel underwater welded specimens. This test is used to see the resistance of samples to oxidation when given potential from the outside so that corrosion occurs. Potential corrosion (
Ecorr) was determined by the amount of negative charge that occurs when the metal is in a NaCl solution and produces chloride ions. These ions will damage the protective layer (passive film) on the metal surface due to chloride ions that infiltrate into small cavities. Damage to this protective layer is utilized by the oxygen element around it so that corrosion occurs [
11]. The results of potentiodynamic corrosion testing are shown in
Figure 2. Corrosion test graphs show polarization curves are close together. The difference lies in the value of
Ecorr and
Icorr and the passivity line. The passivation line whose shape approaches the anodic and cathodic tangents tends to be more corrosion resistant. The corrosion process occurs due to an electrochemical reaction on the surface of the specimen with an electrolyte solution. Chloride ions in NaCl electrolyte solution that damage the surface of the protective layer of steel by infiltrating the small cavities of the underwater weld can cause pitting corrosion to occur [
12].
Potentiodynamic corrosion testing will produce a curve on the Tafel graph, and then resulting data values
Ecorr and
Icorr. Those data values are determined by the number of negative charges formed. The size of the value indicates the tendency of the material to experience oxidation. The highest
Ecorr value is obtained by welding with an RB26 electrode. A low
Ecorr value will have a tendency to be more easily corroded, and vice versa. The corrosion current density was used to calculate the corrosion rate sought using the Tafel extrapolation method based on Faraday’s law [
10,
13,
14]. Corrosion current value (
Icorr) in the Tafel diagram is susceptible to the shape of the curve because the value of
Icorr is taken from the tangent intersection of the curve that changes from the cathode to the anode or vice versa. Hence, even though the shape is almost the same, but when the trajectory changes at a different point it will produce a different
Icorr. A different
Icorr will produce a different corrosion rate. Comparison of corrosion rates on ground welding and underwater welding is shown in
Figure 3.
Figure 3 shows that the lowest corrosion rate occurred in welding with a variation of RB26 electrode and a welding water depth of 2.5 m with a welding current of 100 A which is equal to 0.093126 mm/year. The highest corrosion rate was spotted in welding with variations of RD26 electrodes and 0 m welding depth with a welding current of 110 A, which was equal to 0.23720 mm/year. The reason for the welding corrosion rate on land is higher than underwater welding because, at the time of welding on land, individual underwater welding electrodes that are already in the oven are used, so they are dehydrated. Amount of hydrogen, which can increase weld penetration, decreases on the electrode for underwater welding. Electrodes that are too dry are expected to cause the penetration of the weld experienced deterioration [
15]. The research of Yasari et al. [
16] describes the microstructure that occurs in welding underwater SS400 steel. Grain Boundary Ferrite transformed into a nucleation site for the second phase ferrite during the process of cooling weld metal from high temperatures. The high cooling rate of underwater welding stimulates nucleation. Then columnar grains form along the direction of the cooling temperature. The formation of coarse columnar granules causes mechanical characteristics to decrease so that the corrosion rate of underwater welding will be higher than the speed of ground welding. The results of corrosion tests on underwater welding with a comparison of welding electrodes used showed a corrosion rate on the RB26 electrode lower than the corrosion rate on electrodes E7016 and RD26. The element phosphorus (P) in the electrode affects the corrosion resistance of the material.
Table 1 shows RB26 electrodes having a P element composition of 0.012%, 0.001% more than other electrodes so that it has a slightly better corrosion resistance than other electrodes. This phenomenon is matched with the research of Sigler et al. [
17], who stated that the P element is influencing a better corrosion resistance of the material.
The sulfur element (S) found in the electrode also influences the characteristics of good weld penetration even though it adversely affects heat treatment, cold resistance and corrosion resistance pitting [
18].
Table 1 shows that RD26 electrodes have a high elemental composition of sulfur compared to the other two electrodes which is as much as 0.02%, thus influencing the high corrosion rate that occurs in the weld using the electrode. Much porosity happens in underwater welding results and is one of the essential causes of pitting corrosion. Pitting occurs when the electrolyte starts transporting ions between the anode and cathode. If only a small amount of metal is eroded, this is usually referred to as localized corrosion [
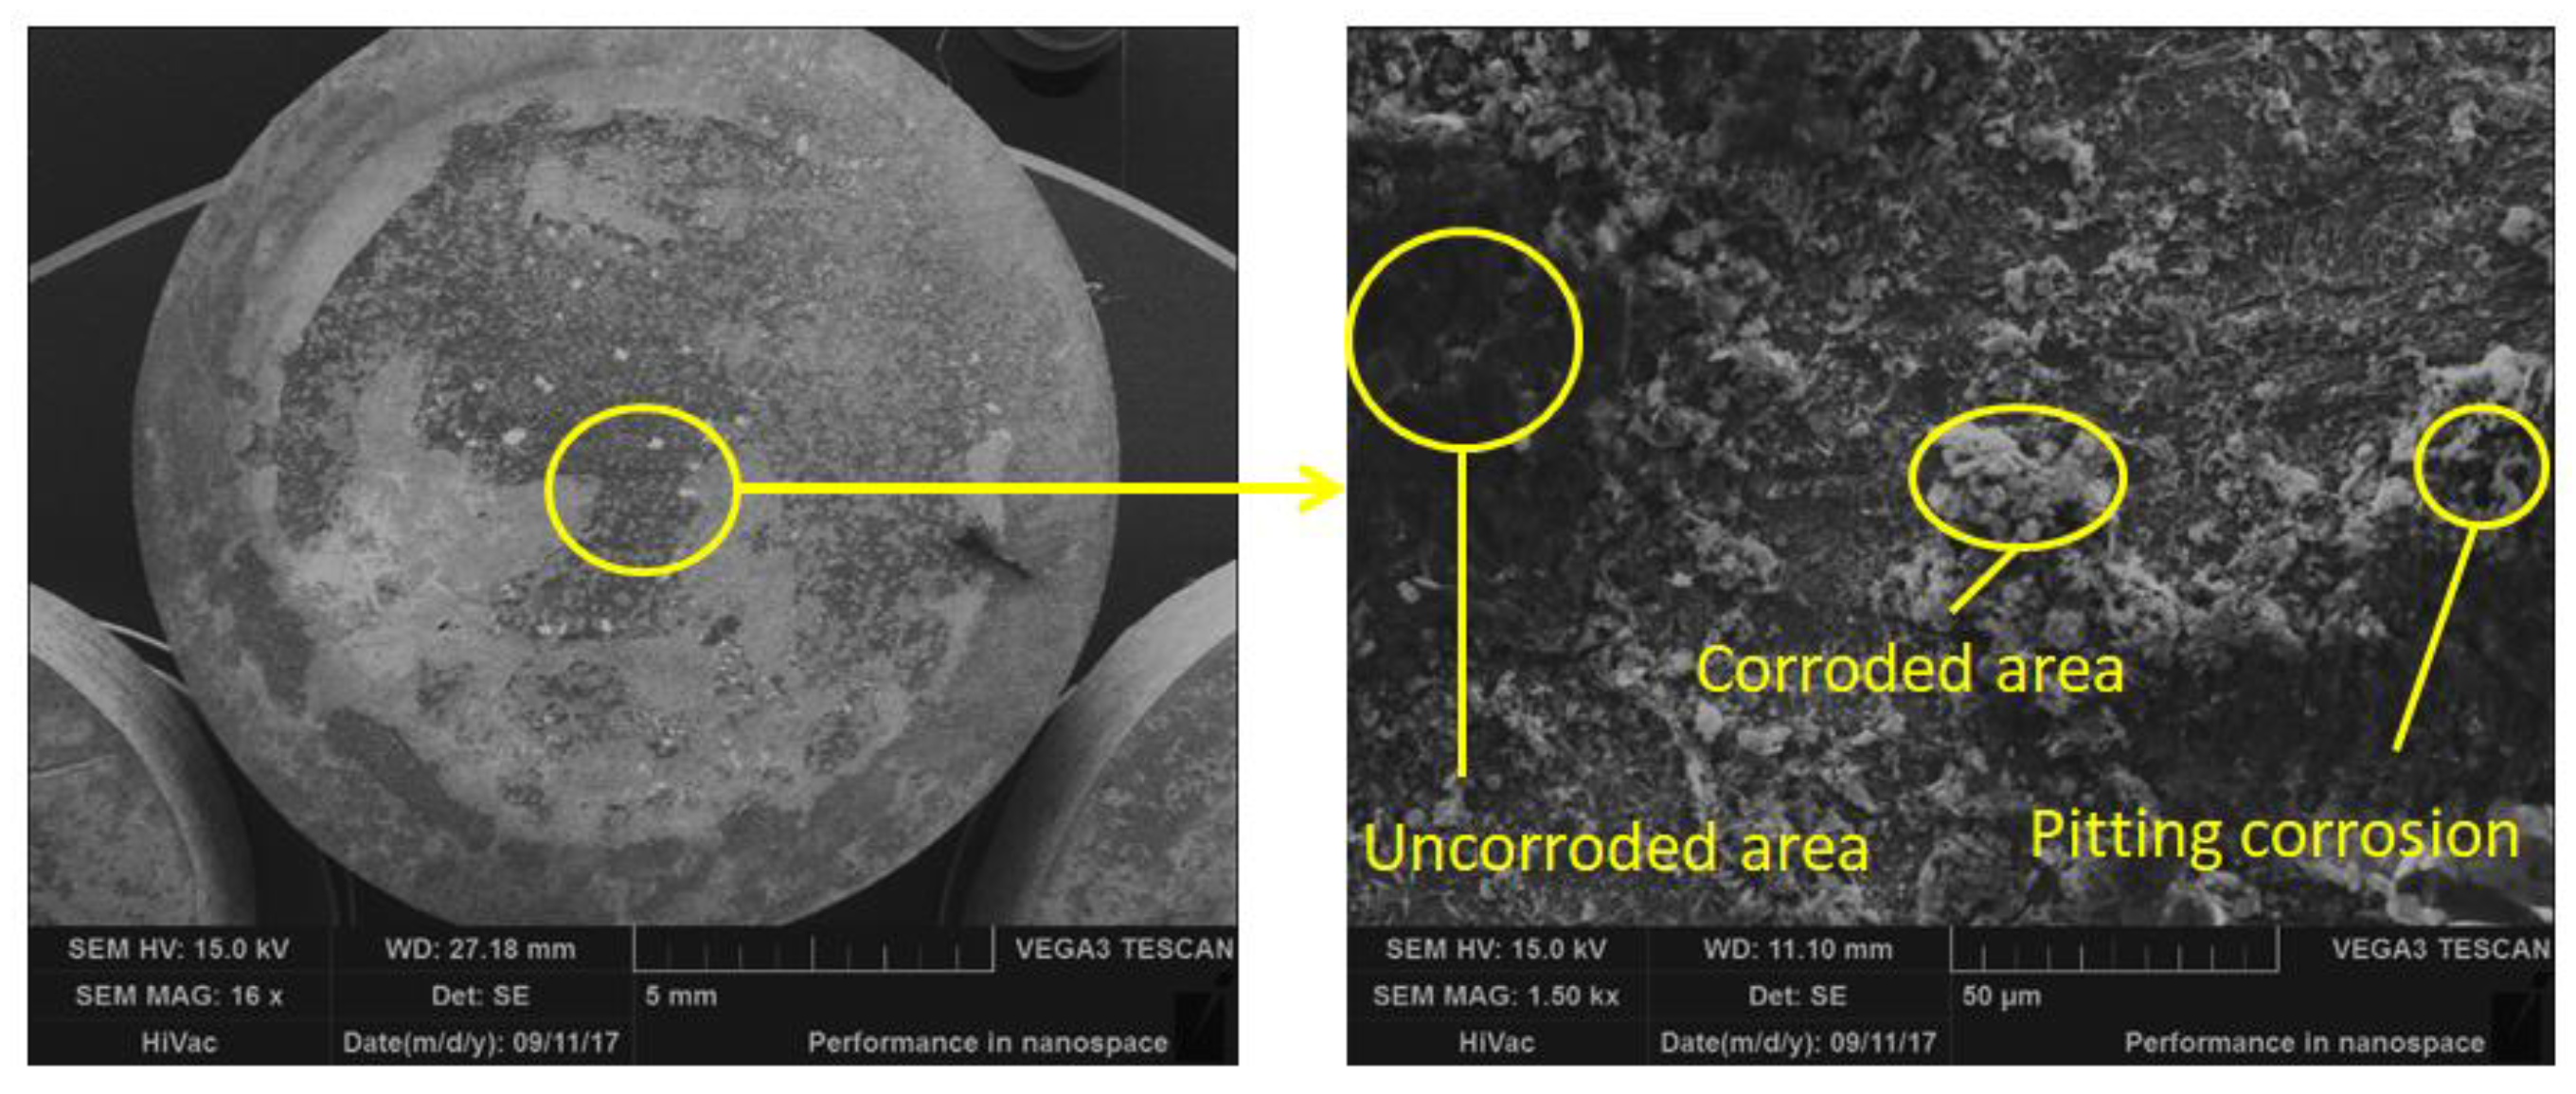
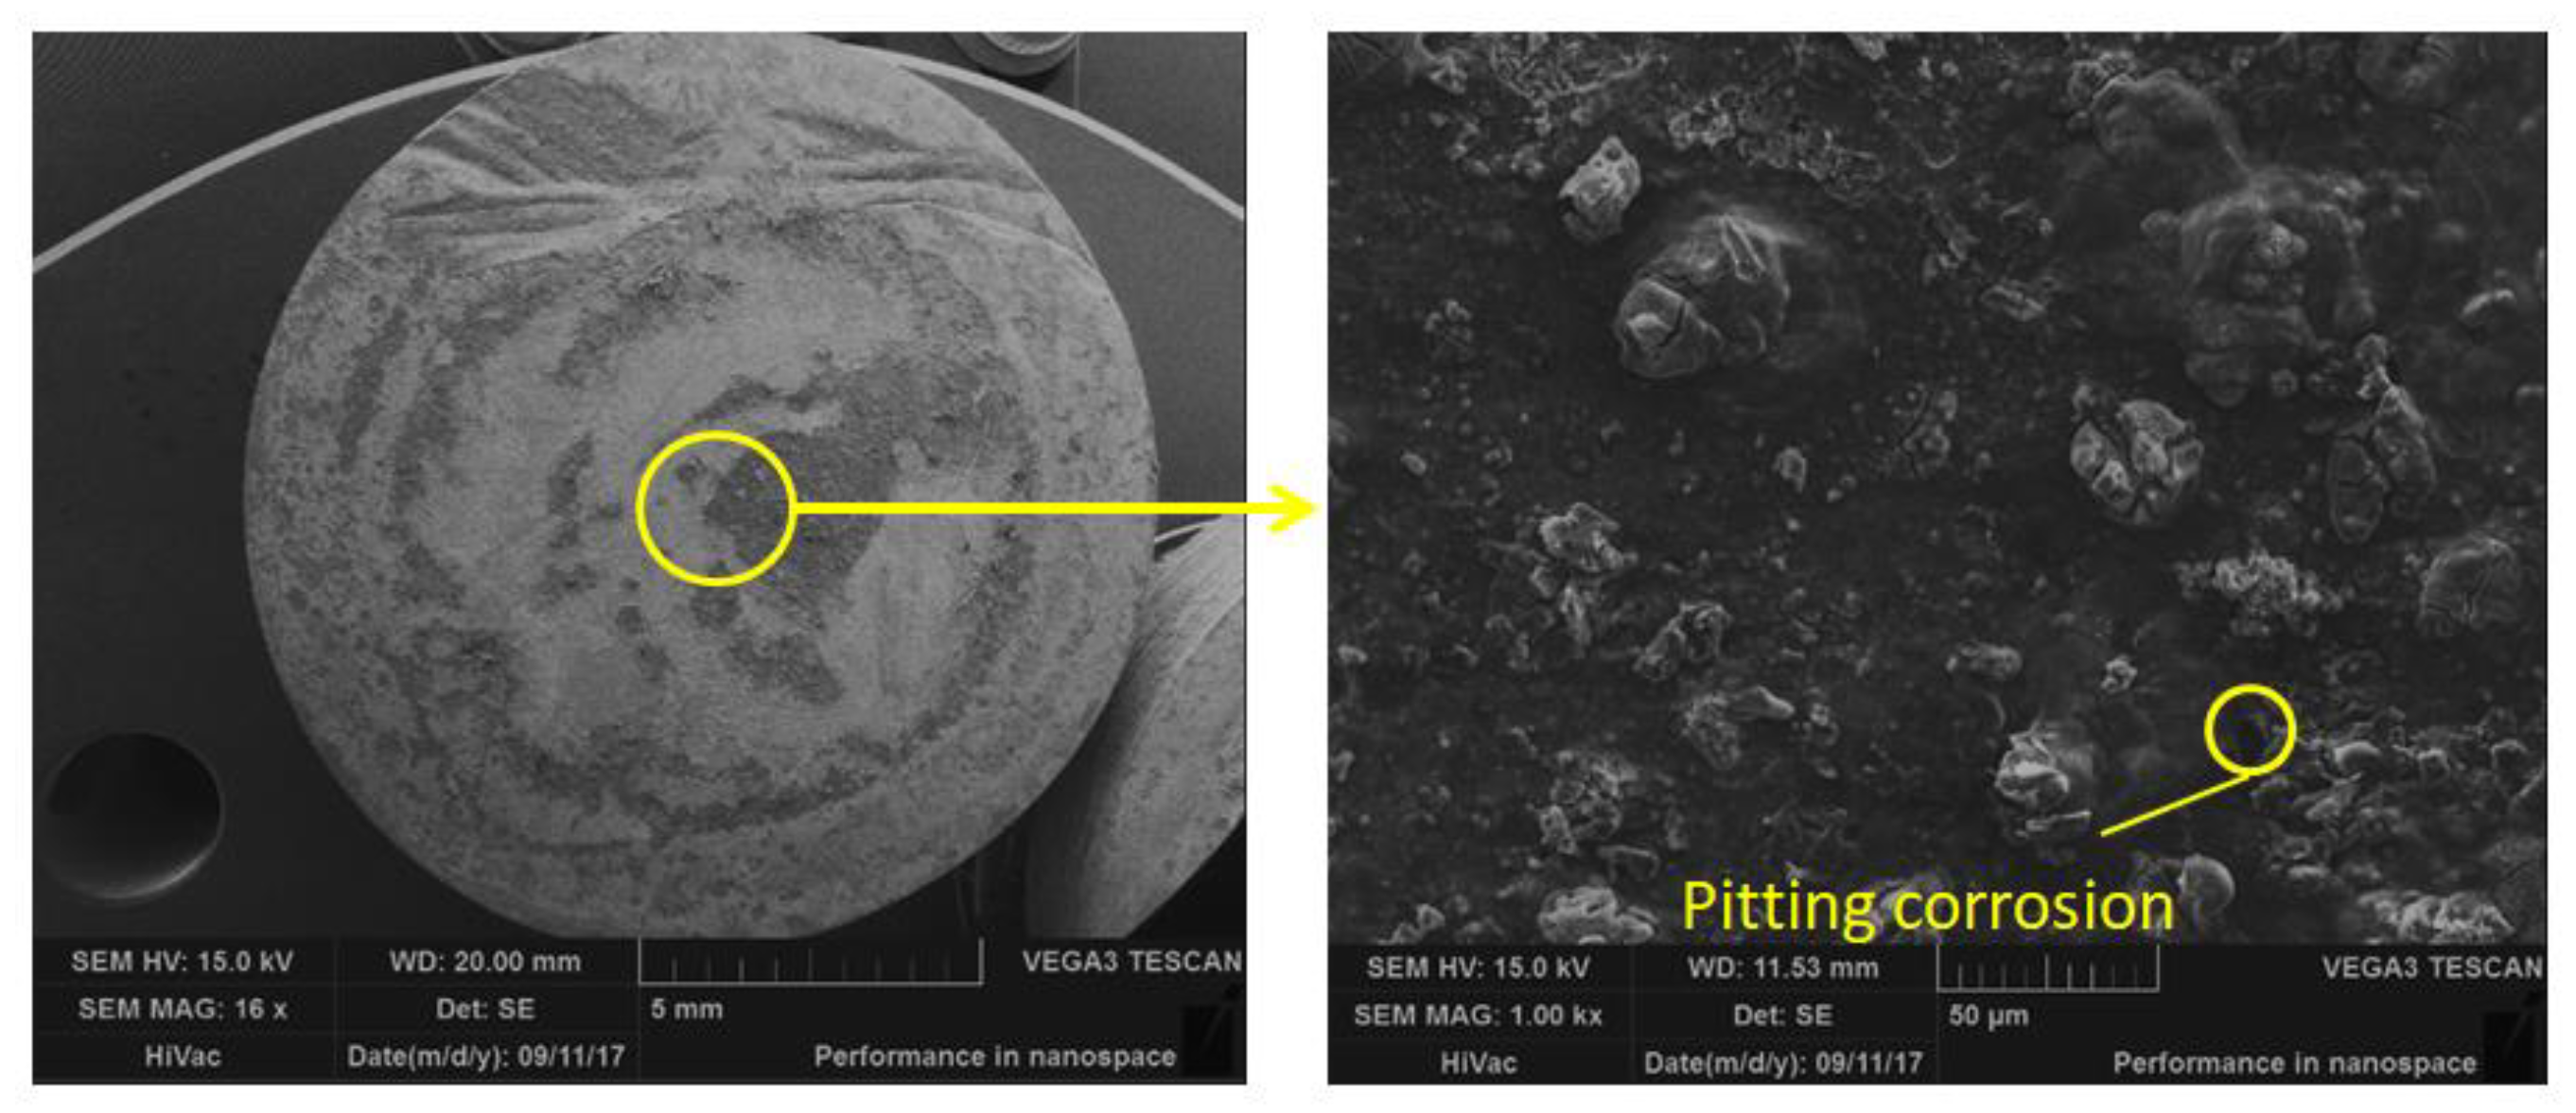
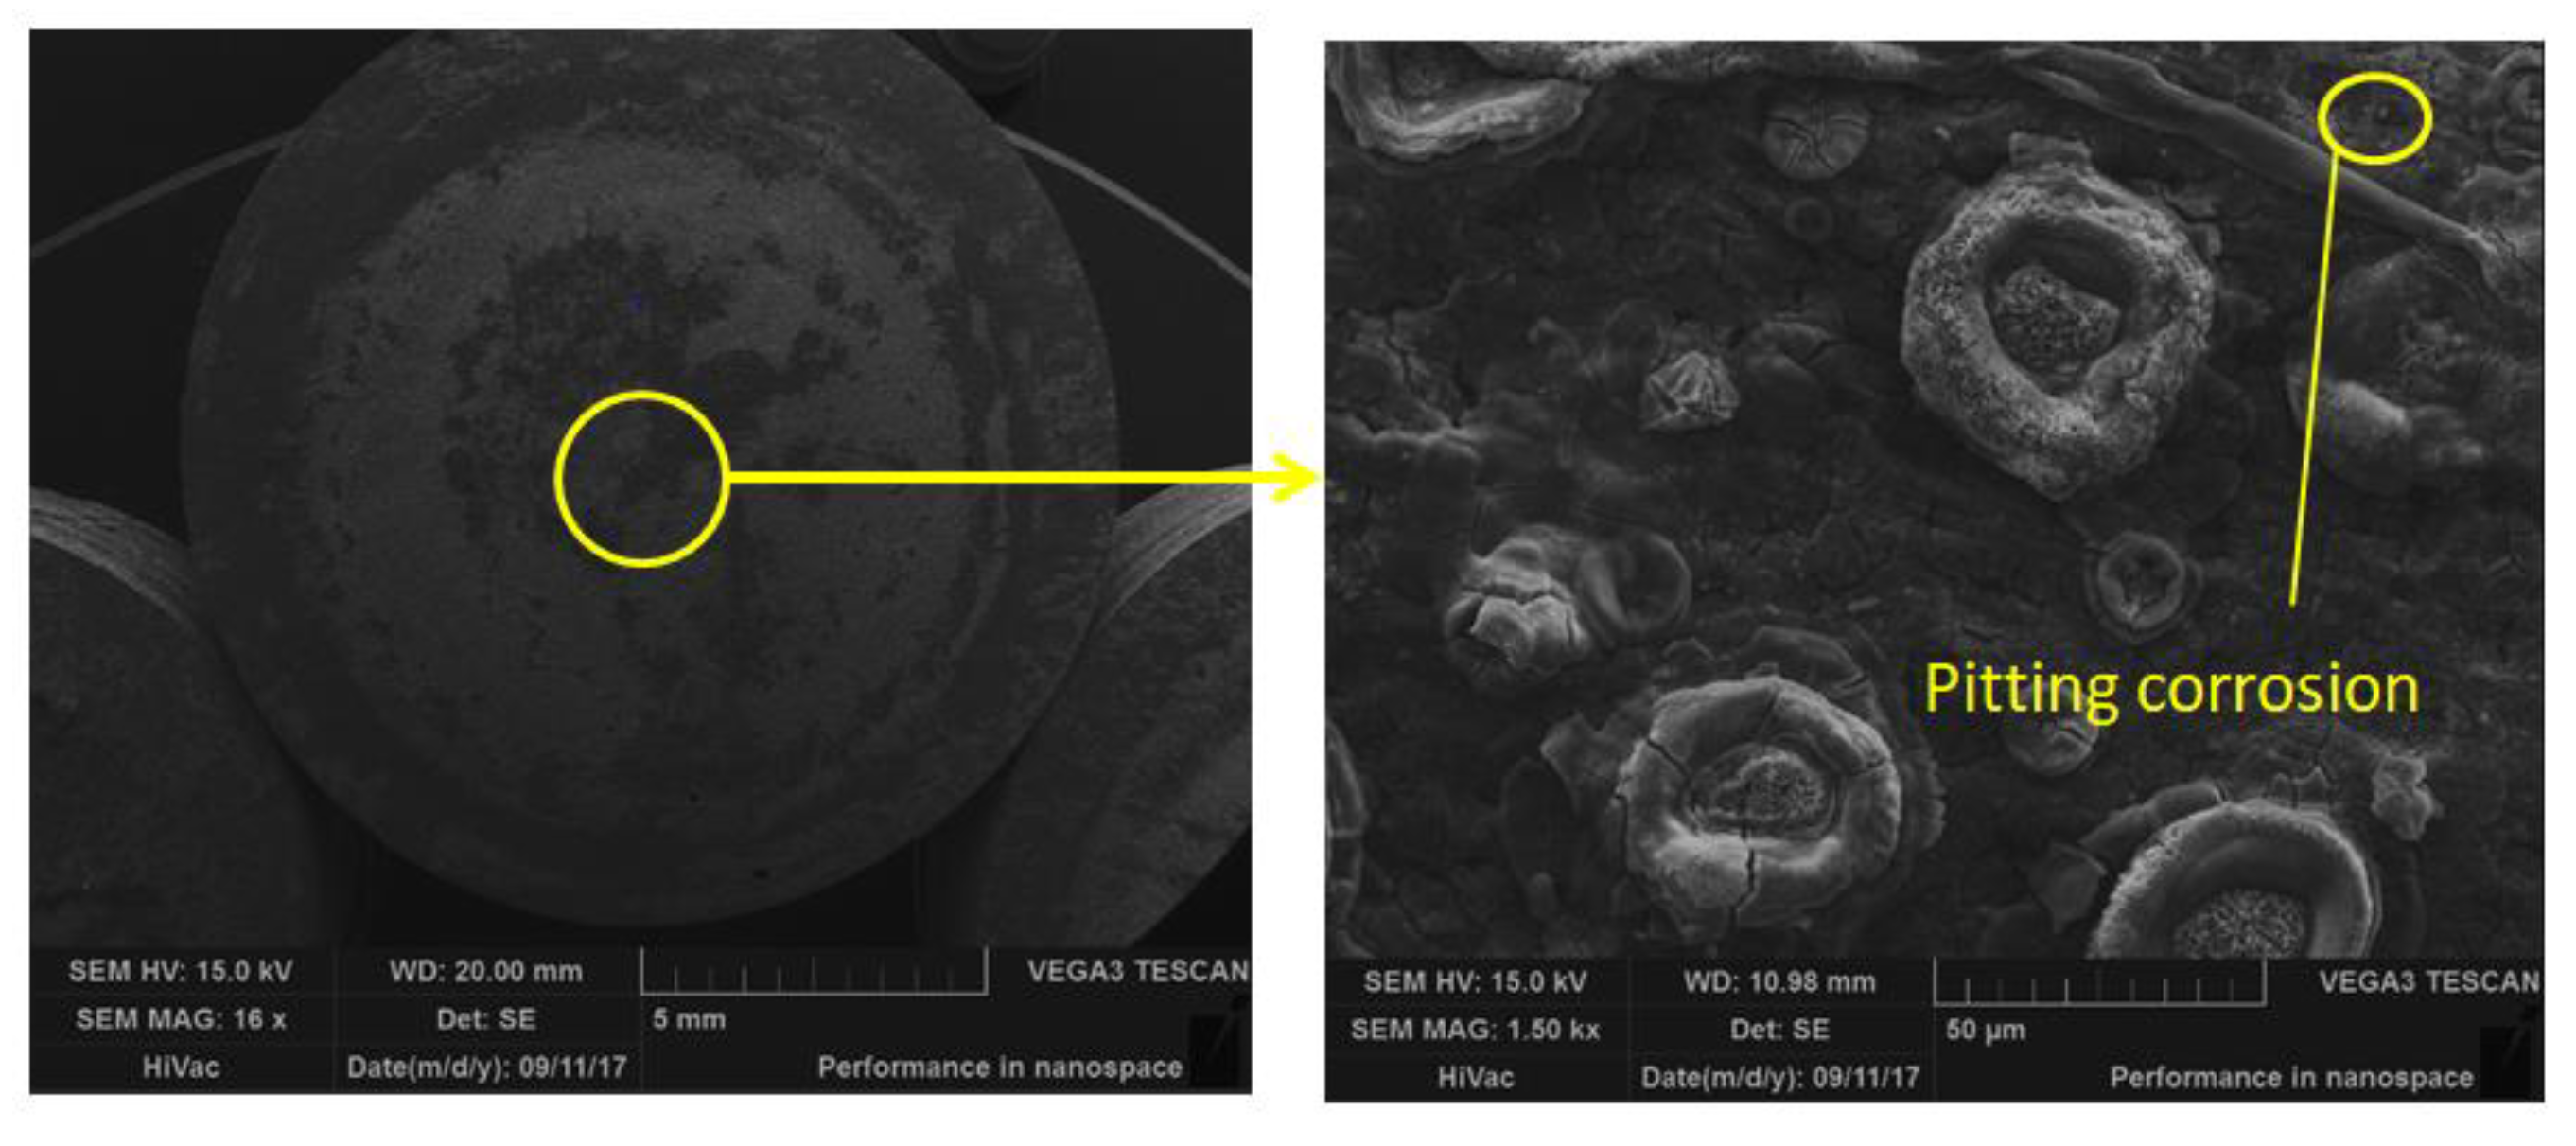
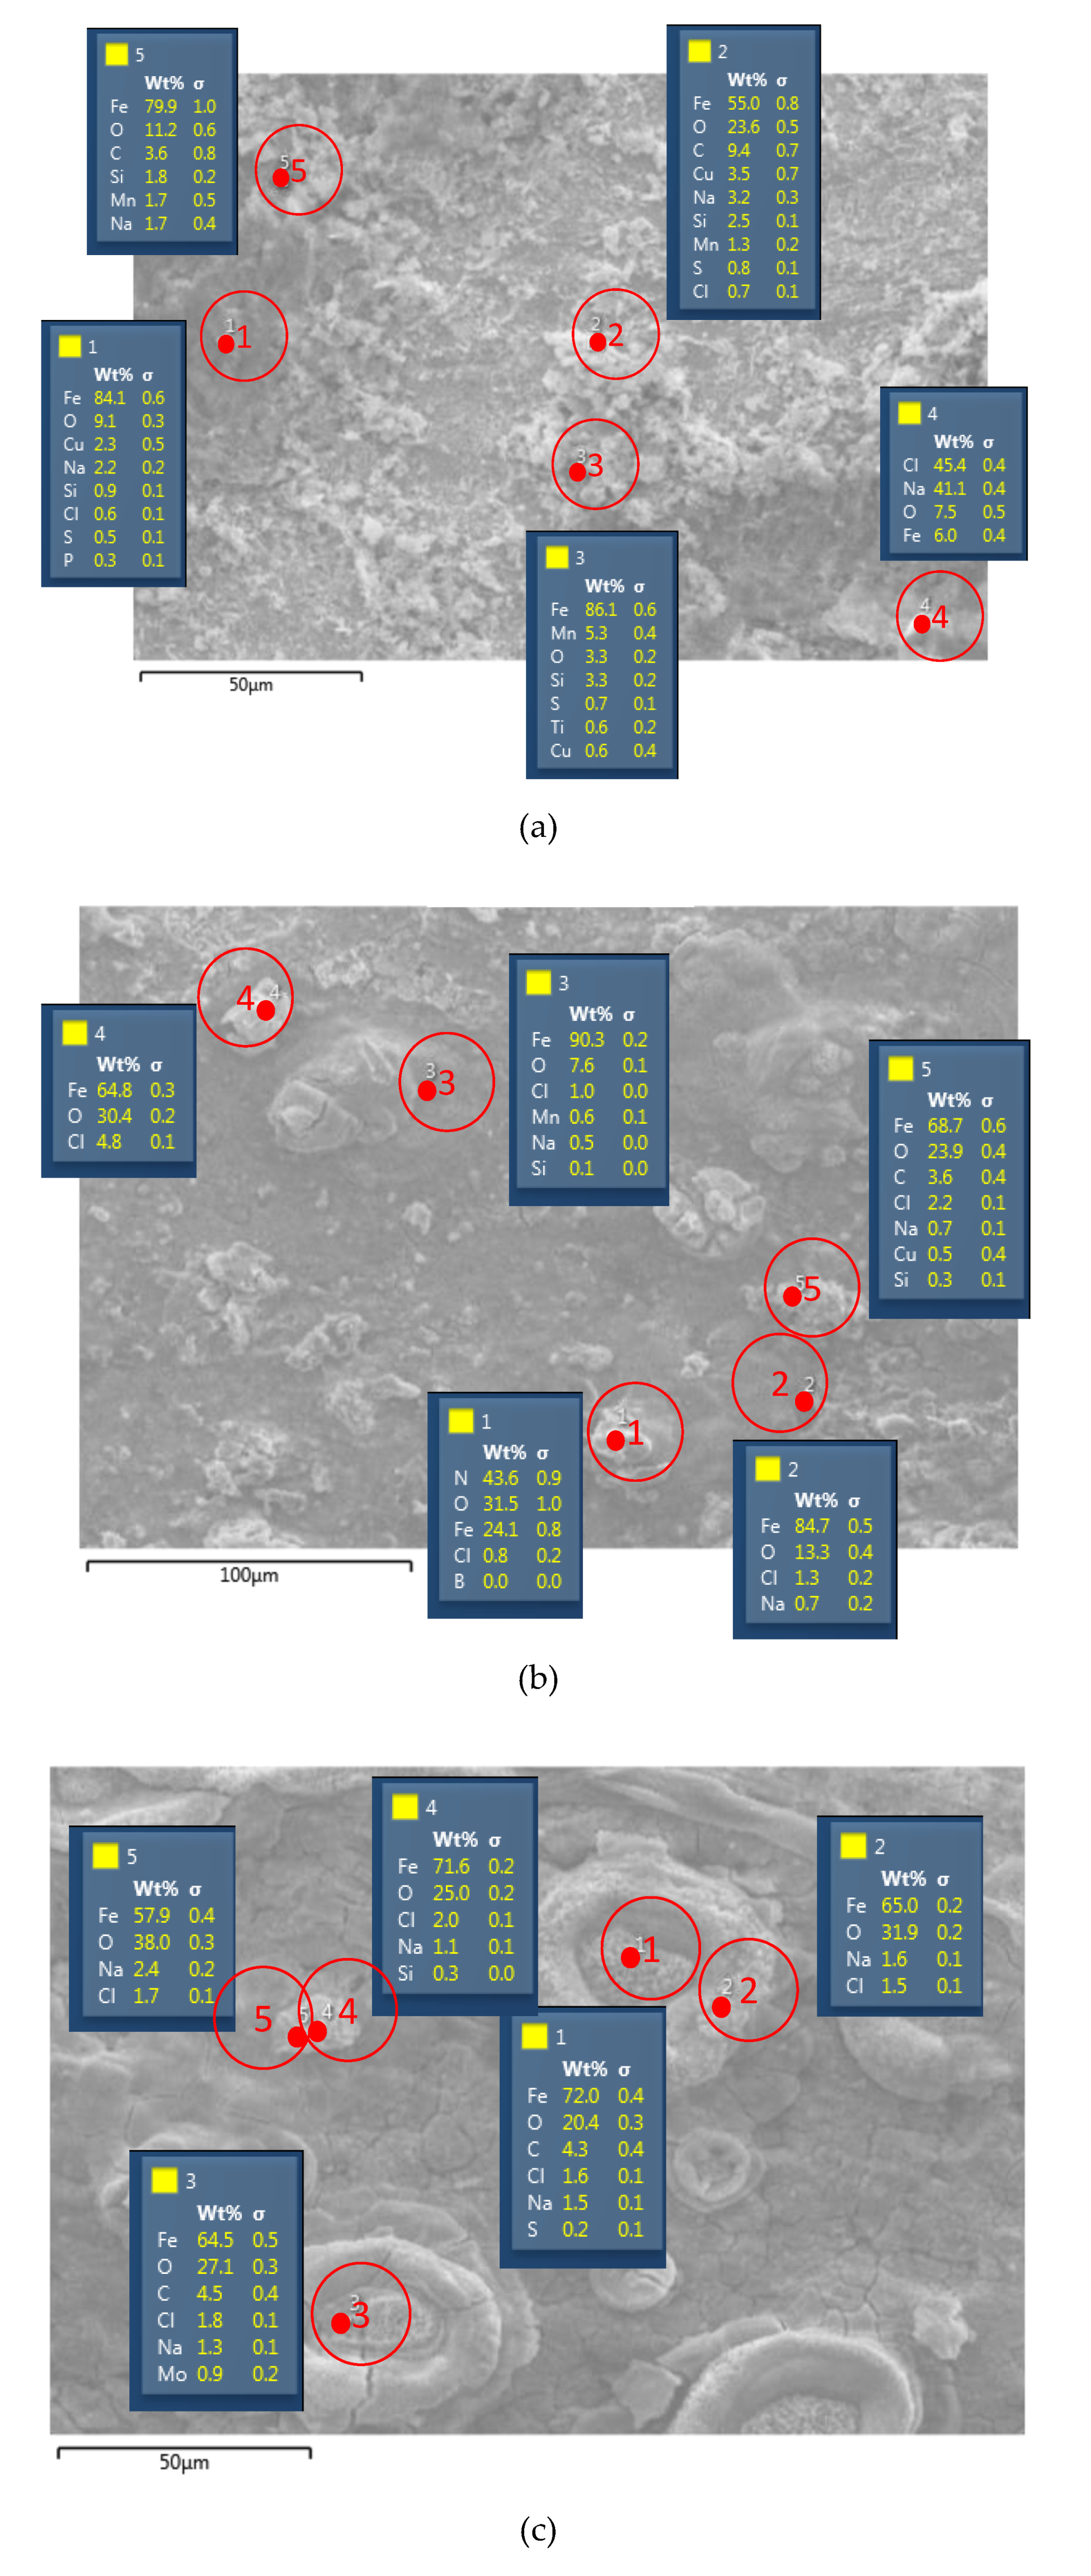
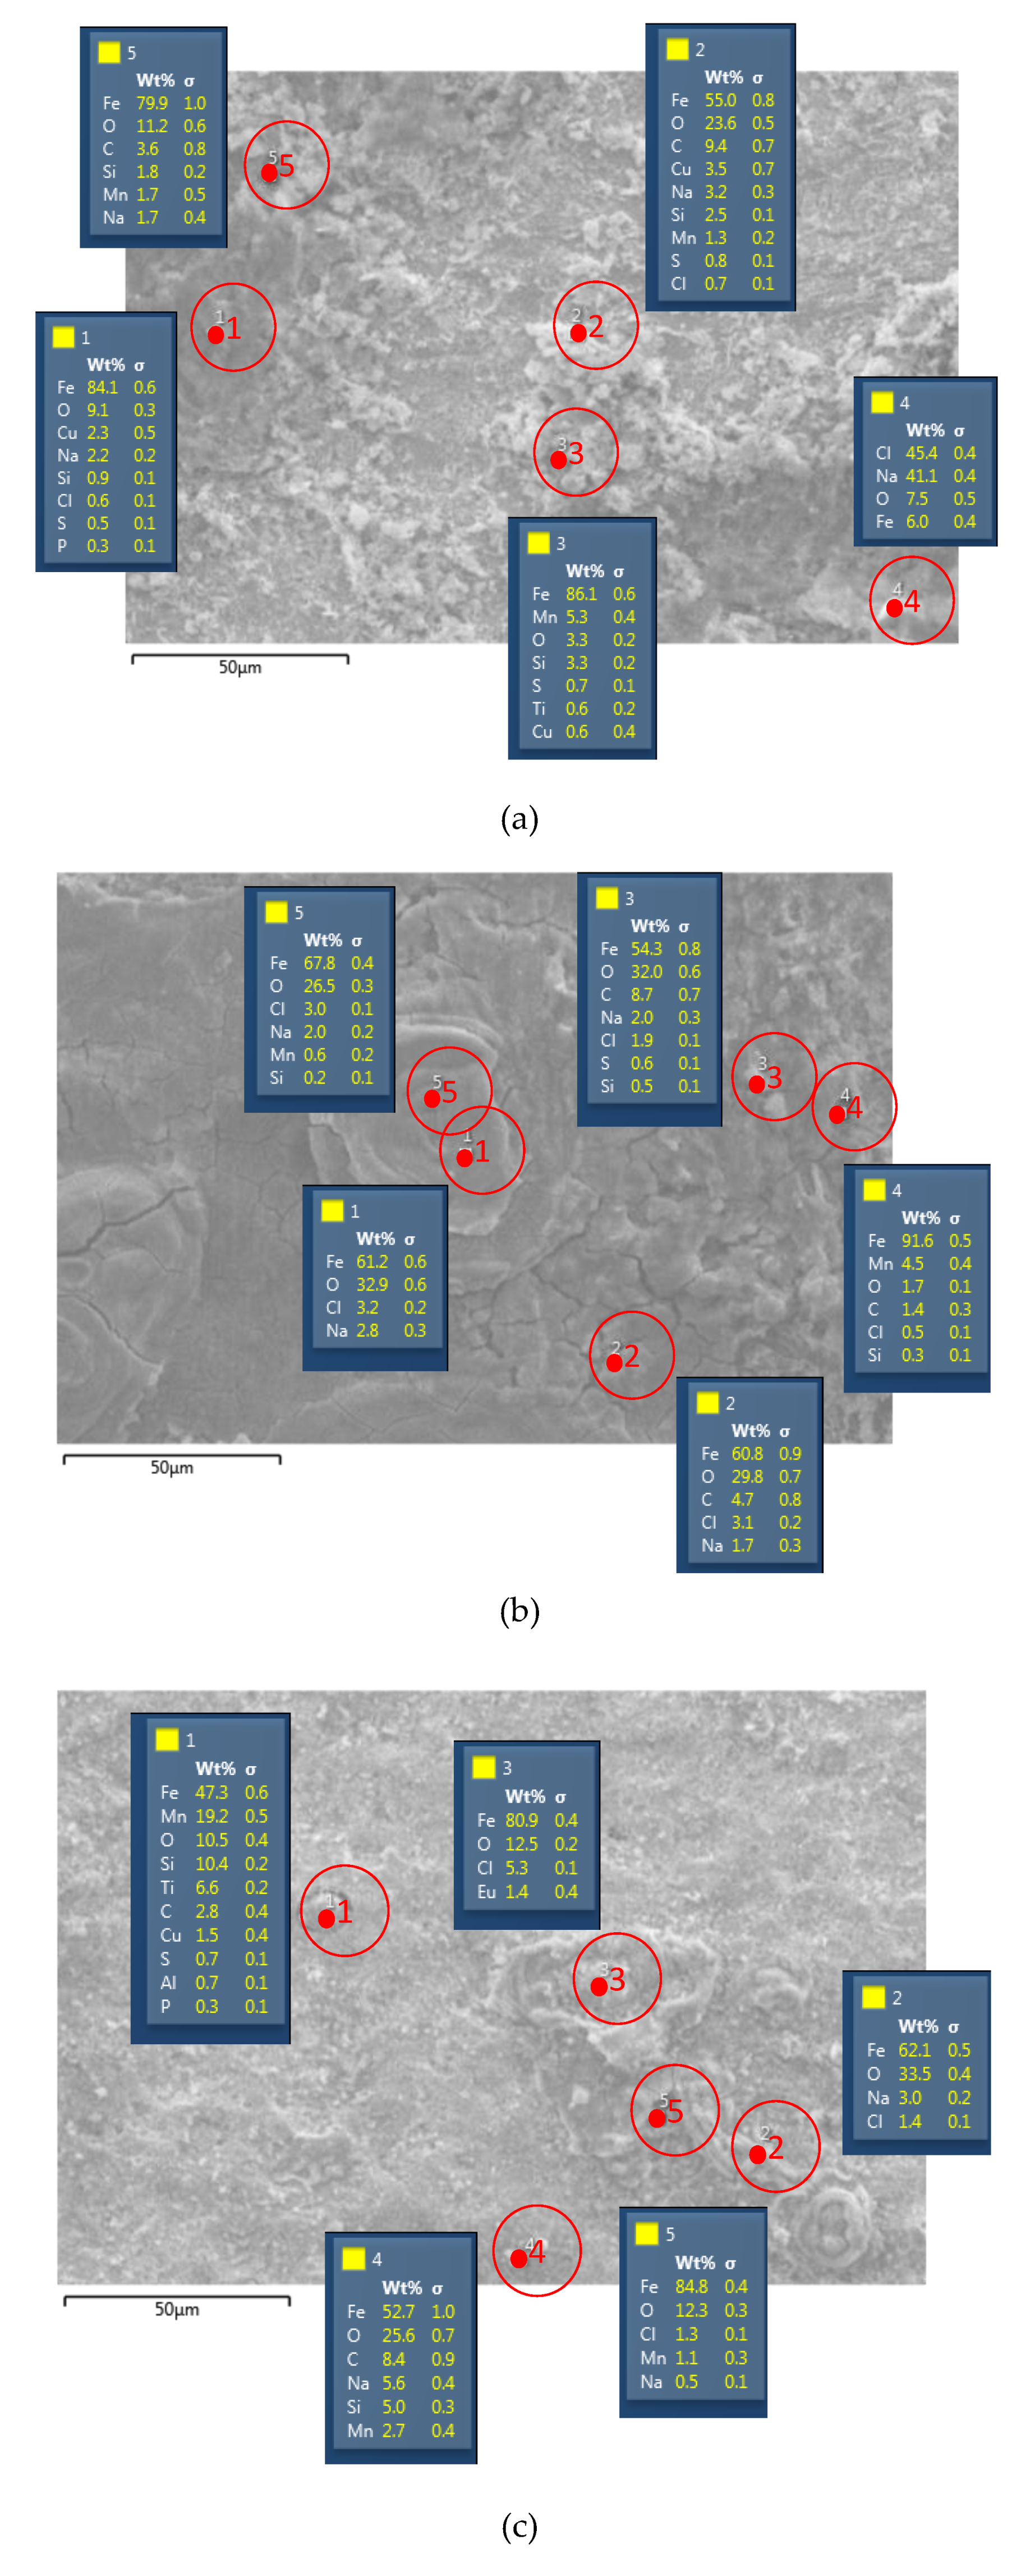
19]. The specimens resulting from corrosion testing were then tested by SEM and EDS to see the surface topography and the distribution of chemical composition of intermetallic matrix and particles.
Figure 4,
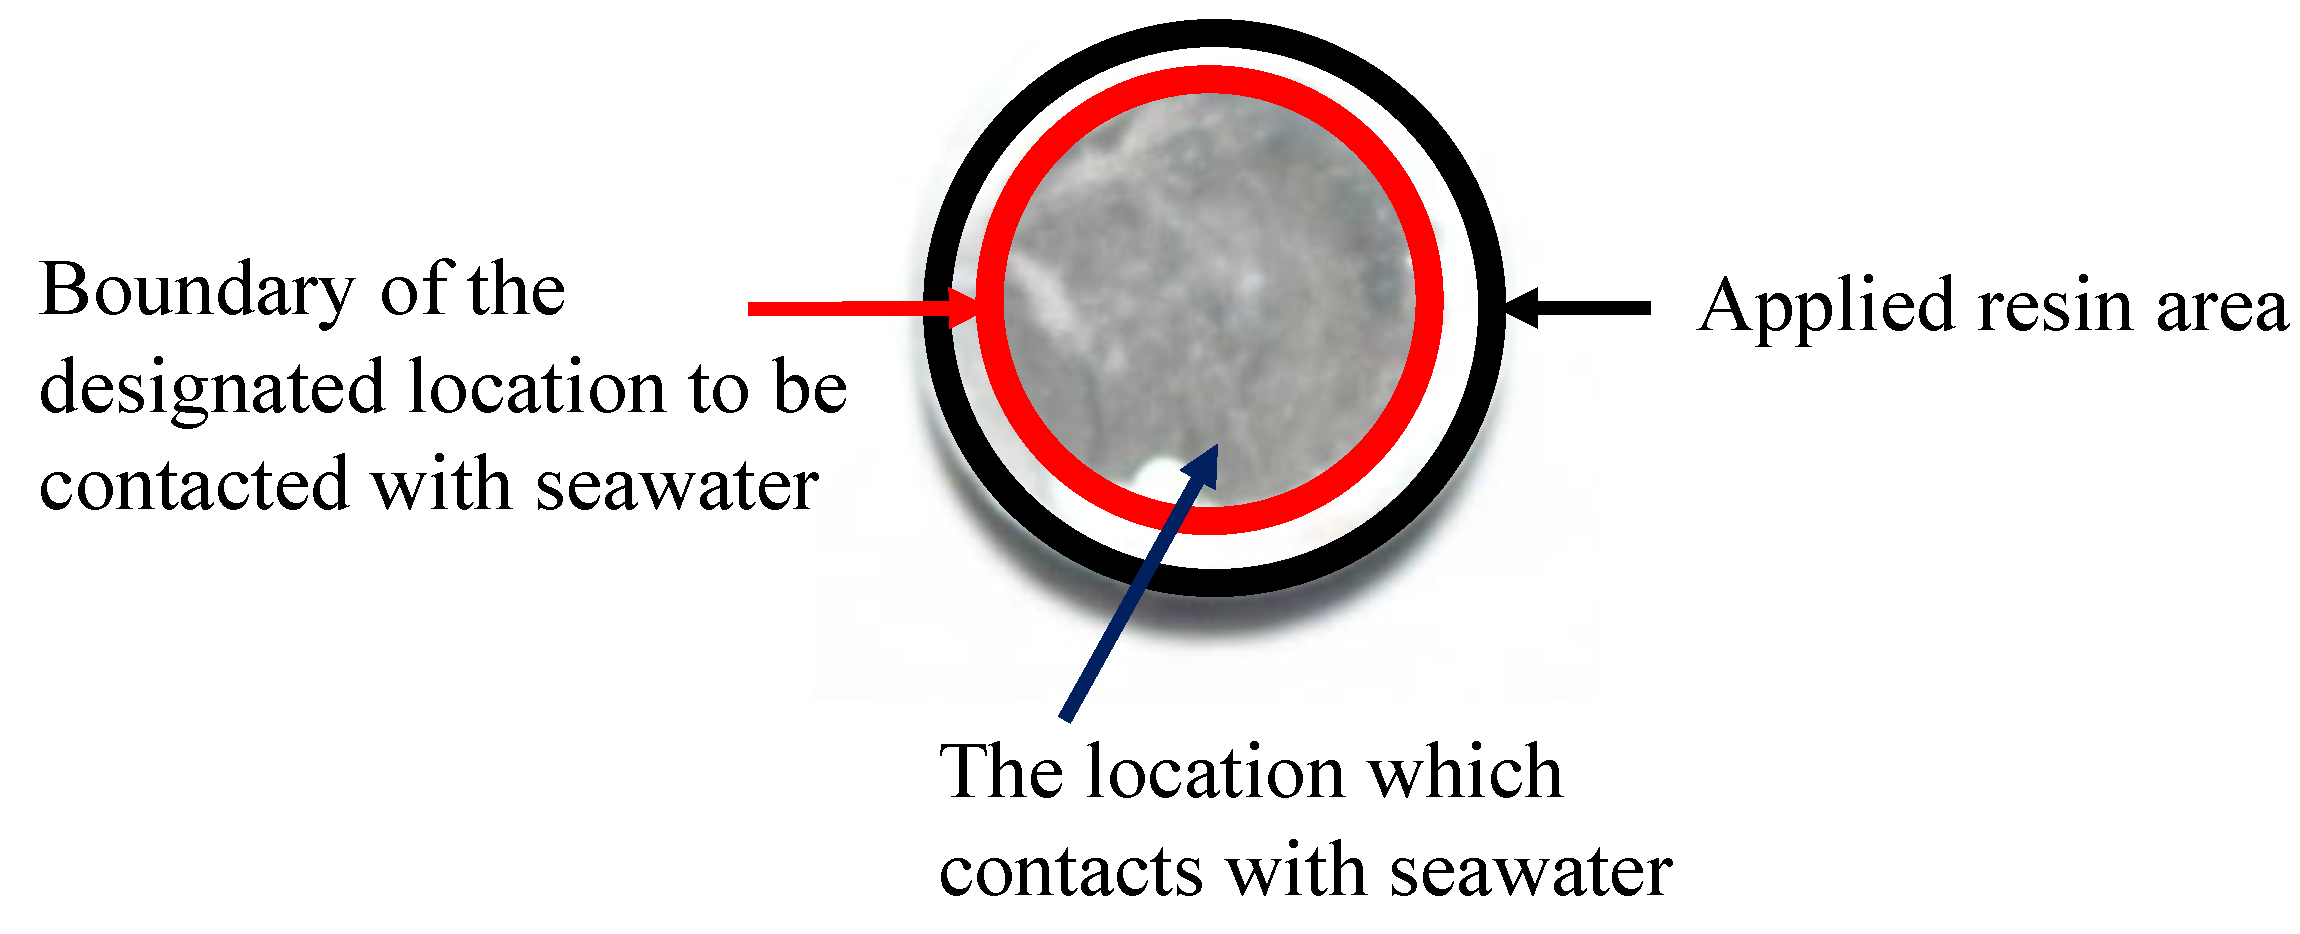
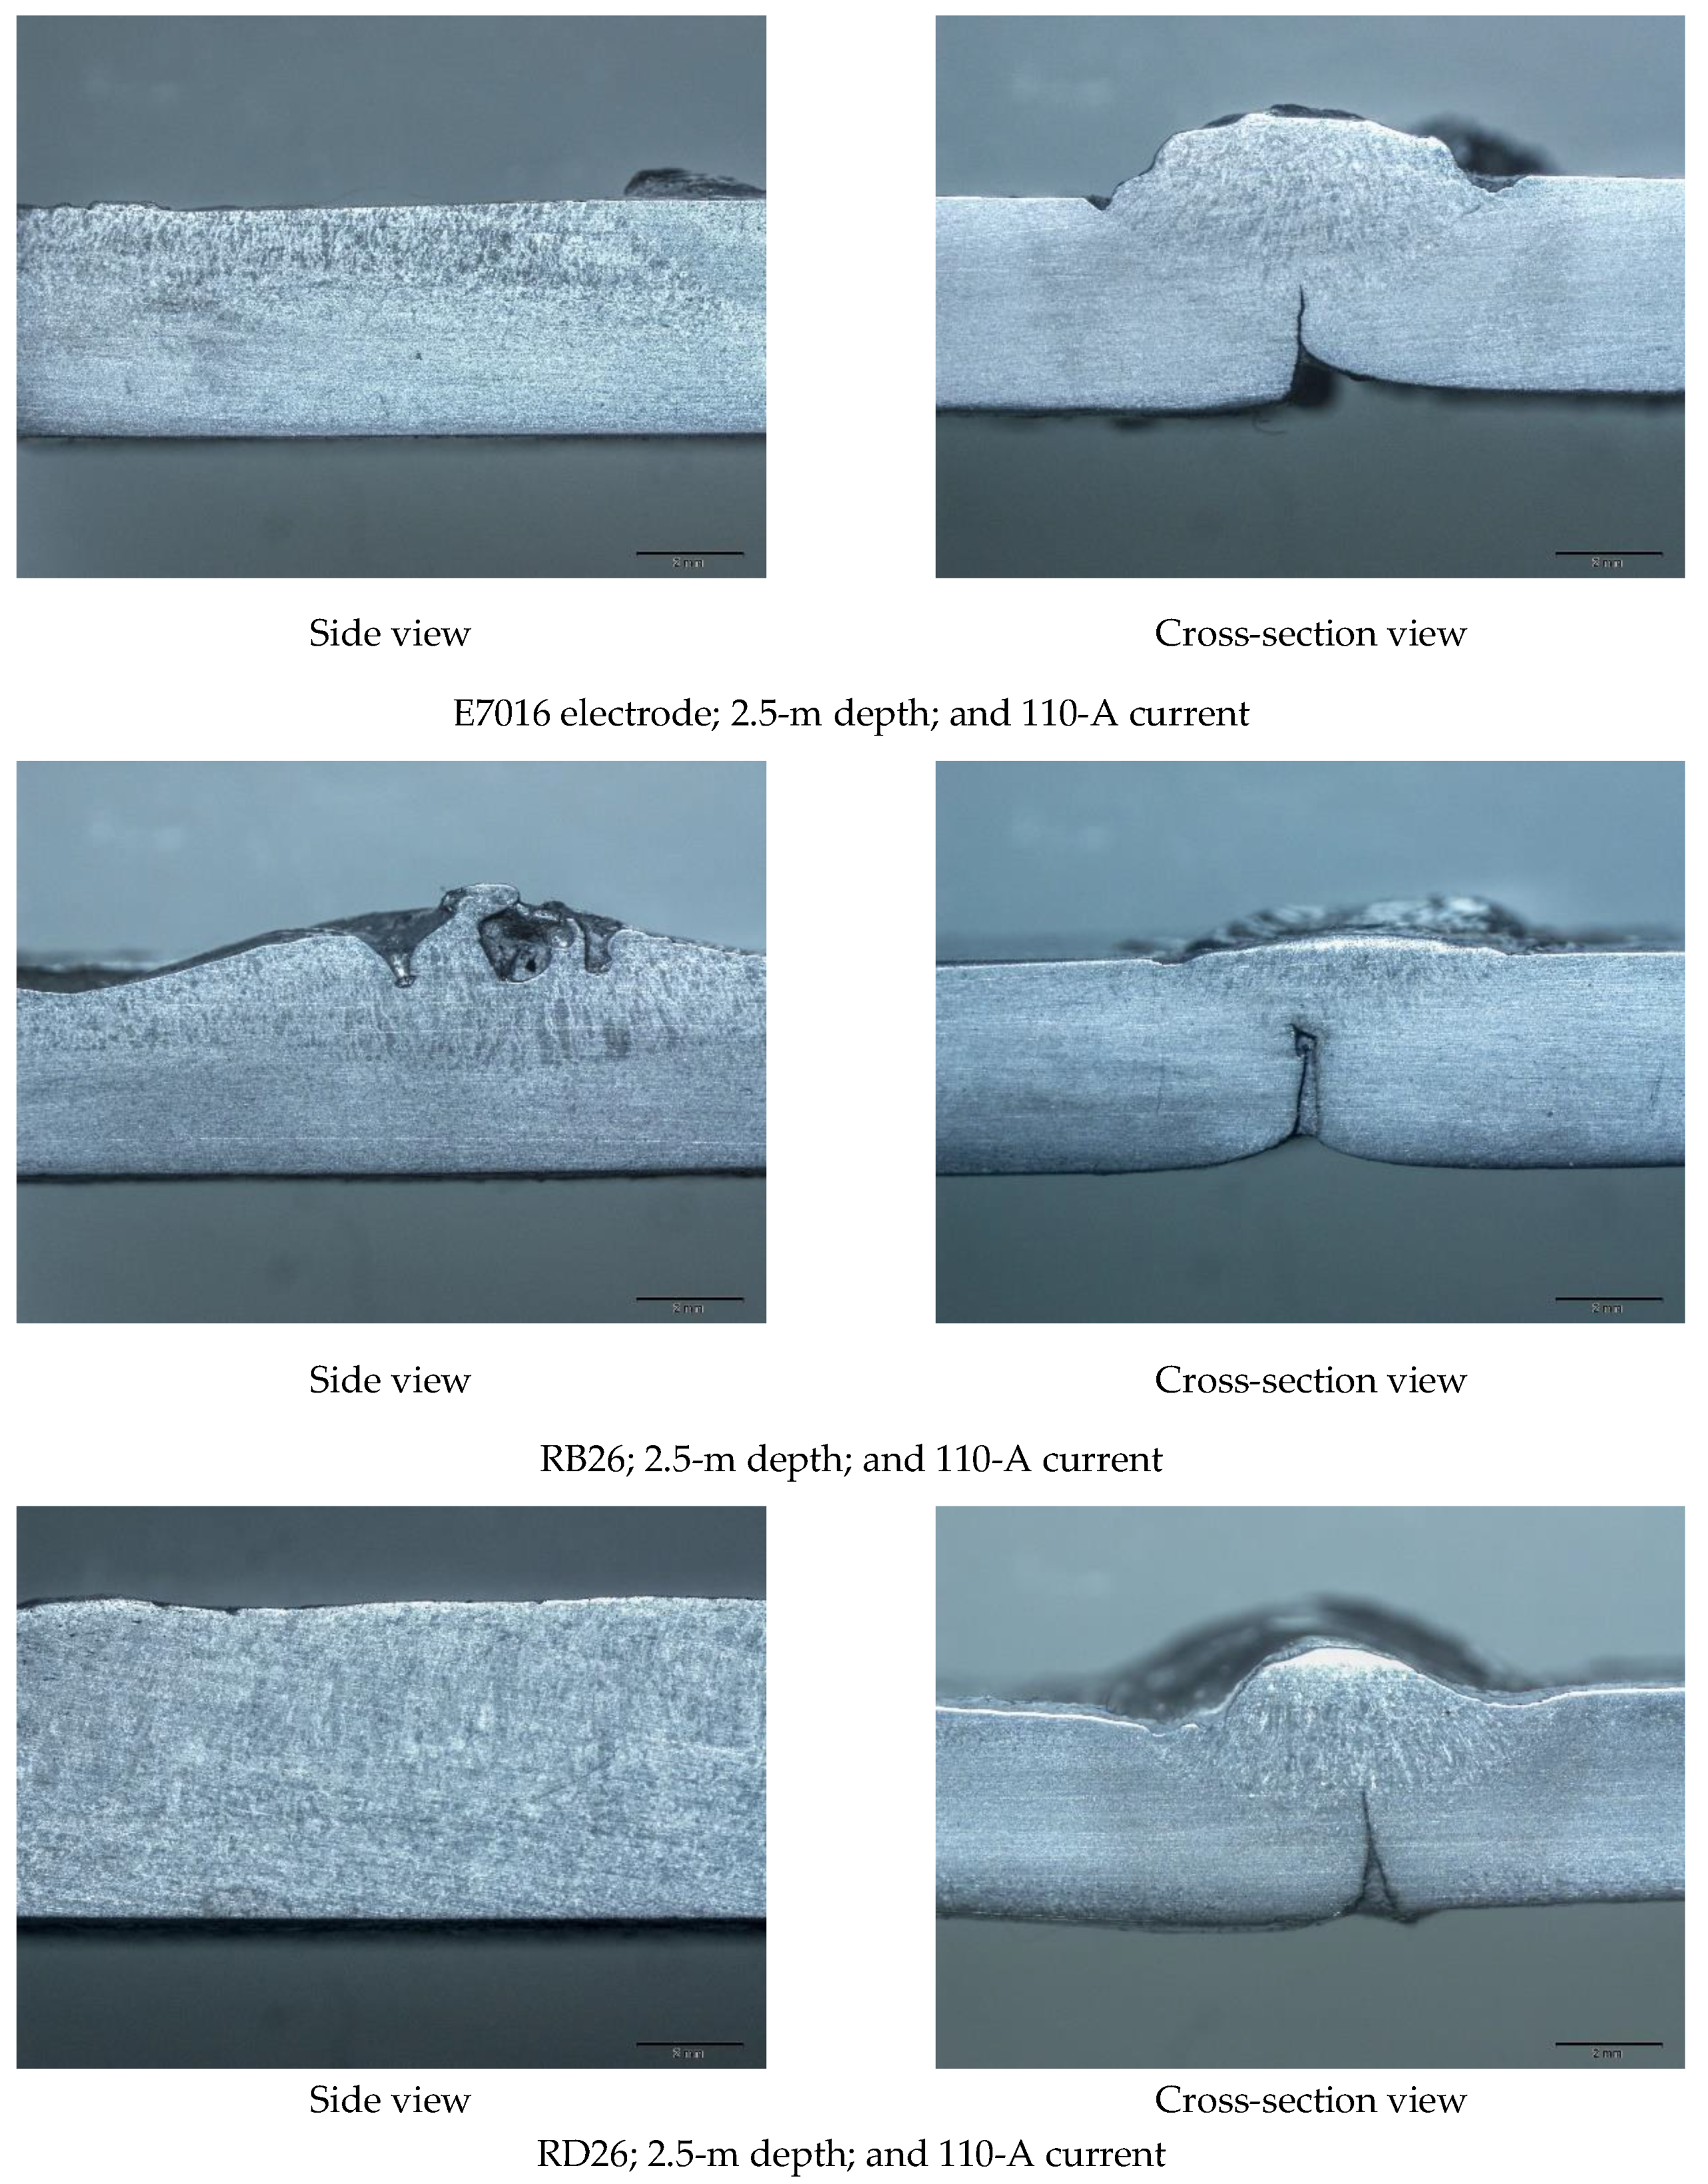
Figure 5,
Figure 6 and
Figure 7 show corrosion test specimens taken first macros then magnified 1500 times at the midpoint. The macro photo on welding with RB26 electrode shows many dark colors which means that the area has not been corroded entirely because the protective layer is still firmly attached to its surface, it was different from welding using E7016 and RD26 electrodes which shows many bright colors, which is a sign of a protective layer already damaged by chloride ions so that corrosion is rapid and occurs locally.
Figure 4,
Figure 5,
Figure 6 and
Figure 7 also show the SEM display of test specimens corroded with variations in welding electrodes, while
Figure 8 and
Figure 9 present macro photo of the tested welds.
Underwater welding has several adverse effects, namely, the high cooling rate and a large amount of diffused hydrogen [
20]. Labanowski et al. [
21] said the cooling rate in underwater welding is higher than ground welding. Hydrogen trapped inside the weld metal will cause porosity [
22]. One of the defects that occur in underwater welding is porosity defects which are also one of the causes of pitting corrosion [
12]. Welding defects that arise in underwater welding can worsen the corrosion resistance of a material. This defect usually causes an initial pitting and crevice attack on weld metal [
16]. Underwater welding has a higher risk of cracking than ground welding. High cooling rates cause surface damage due to corrosion which is characterized by cracks.
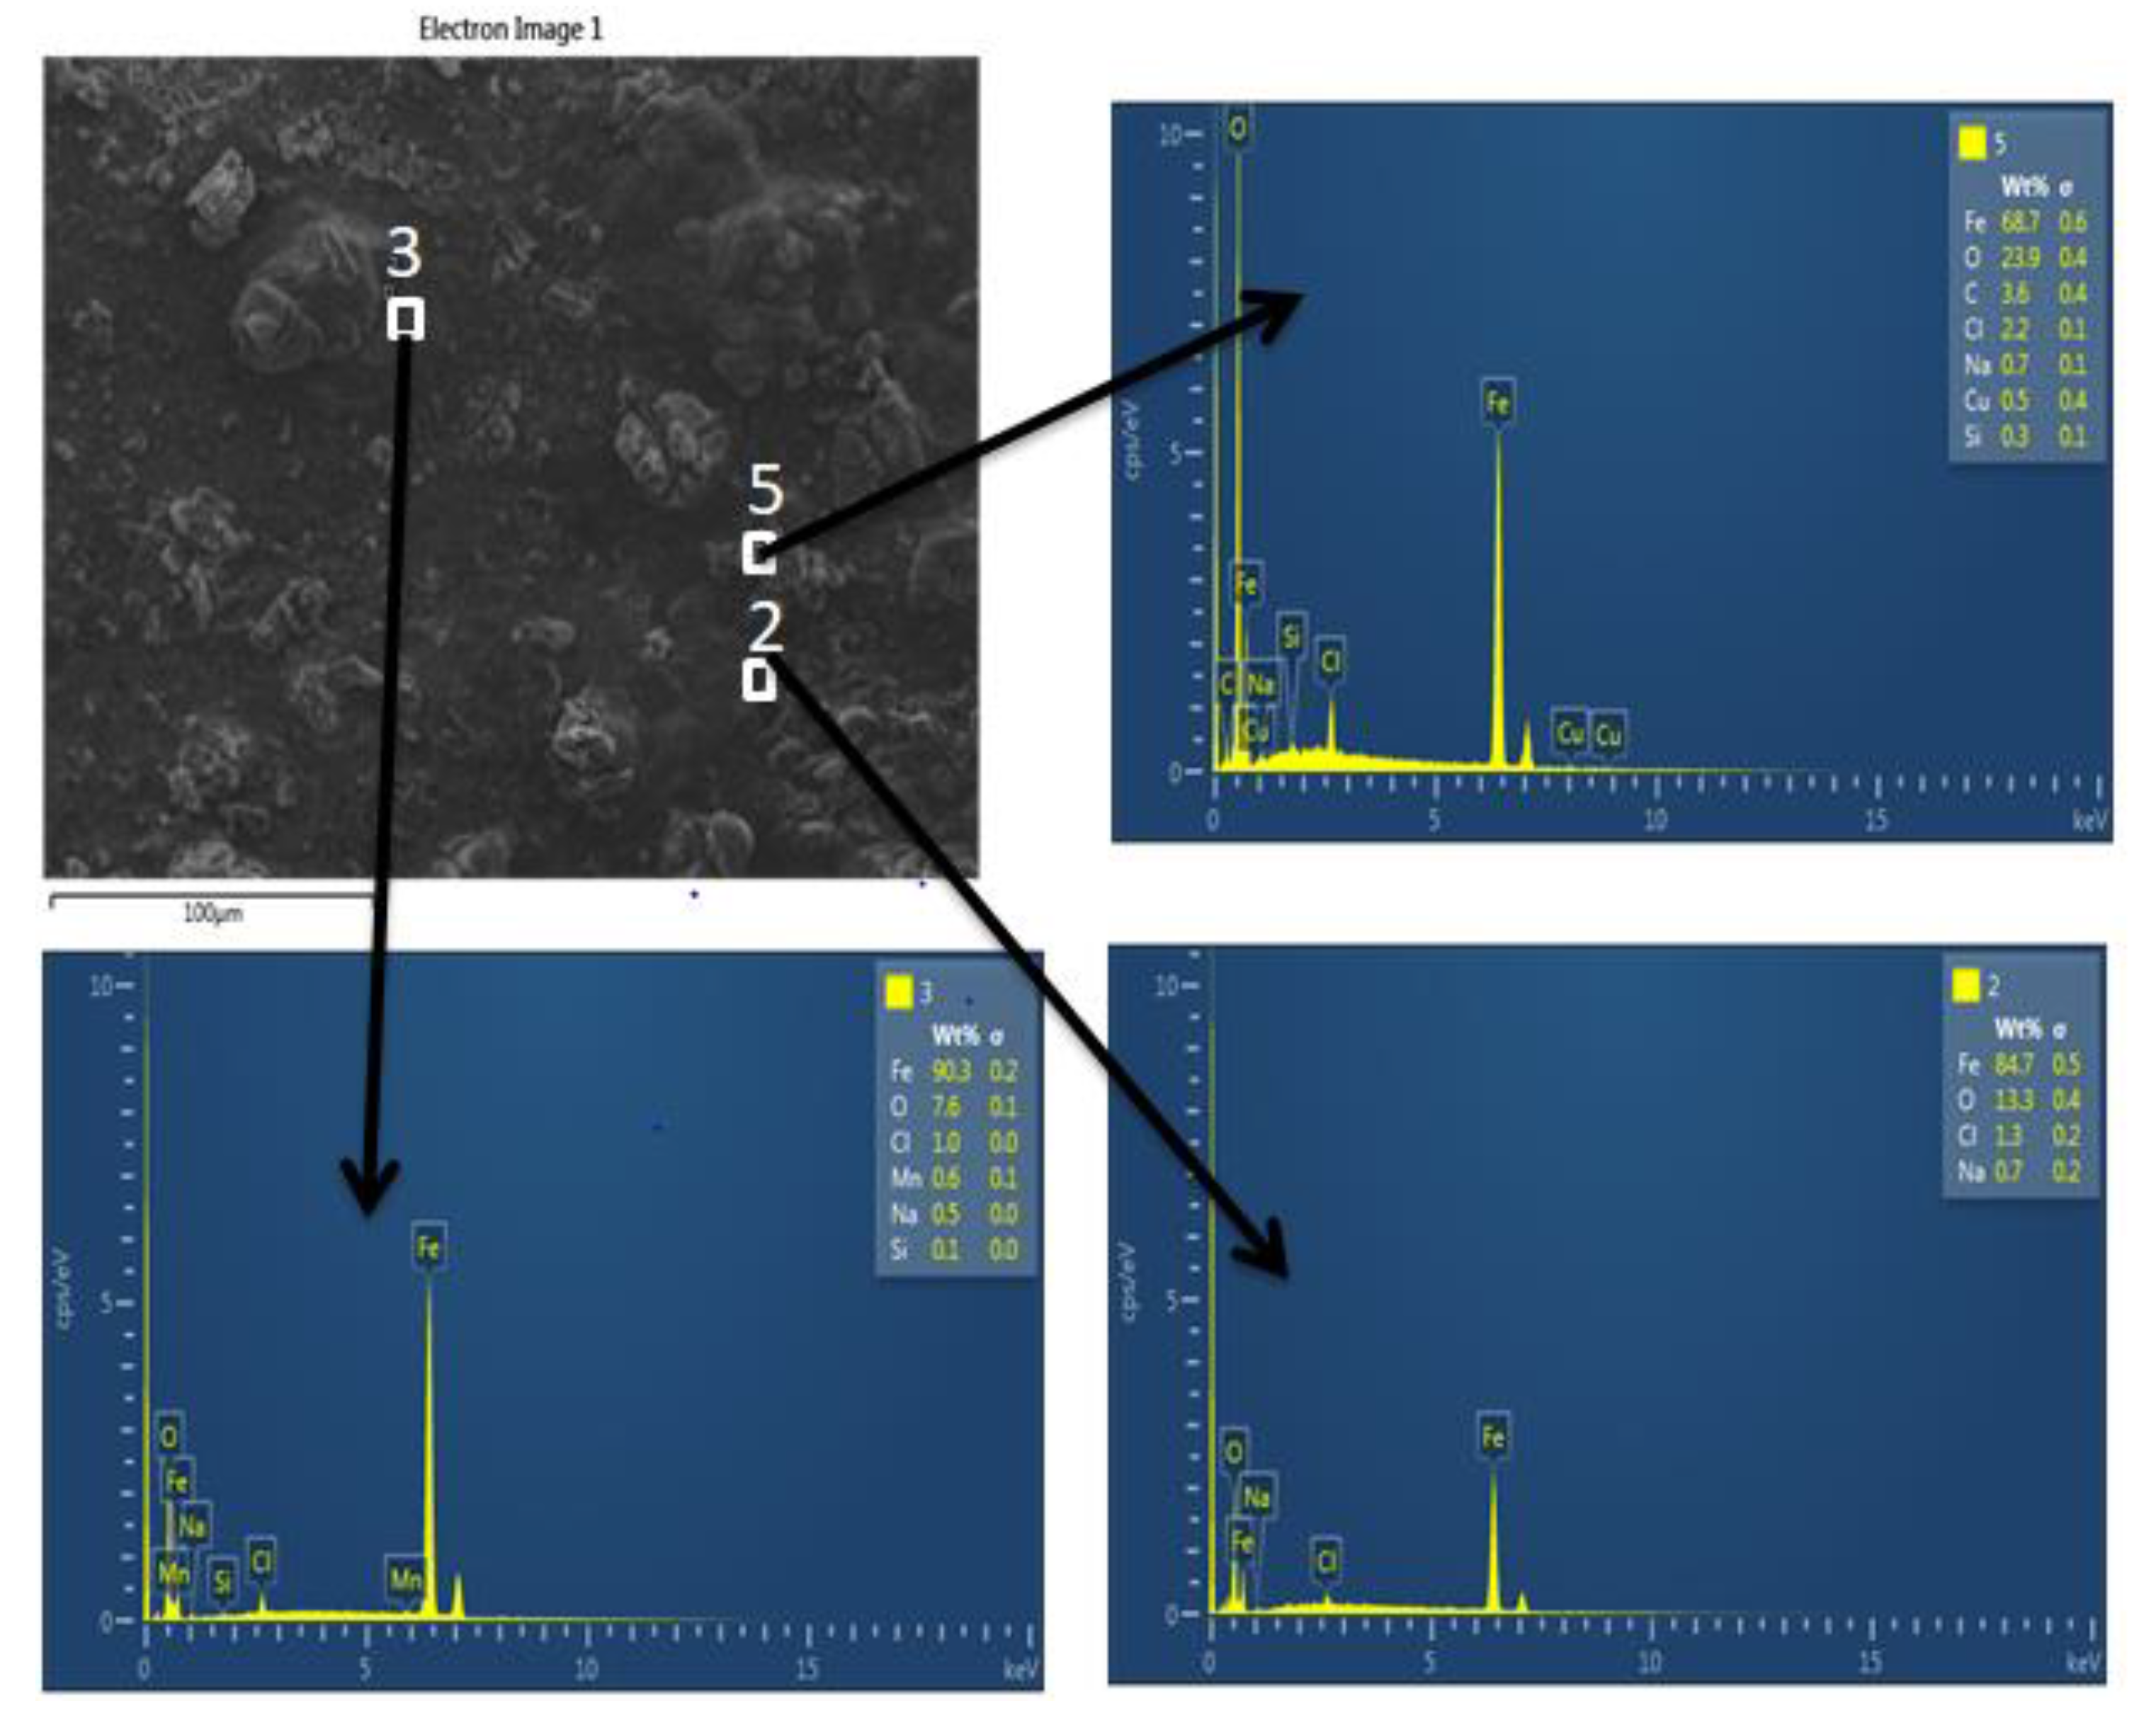
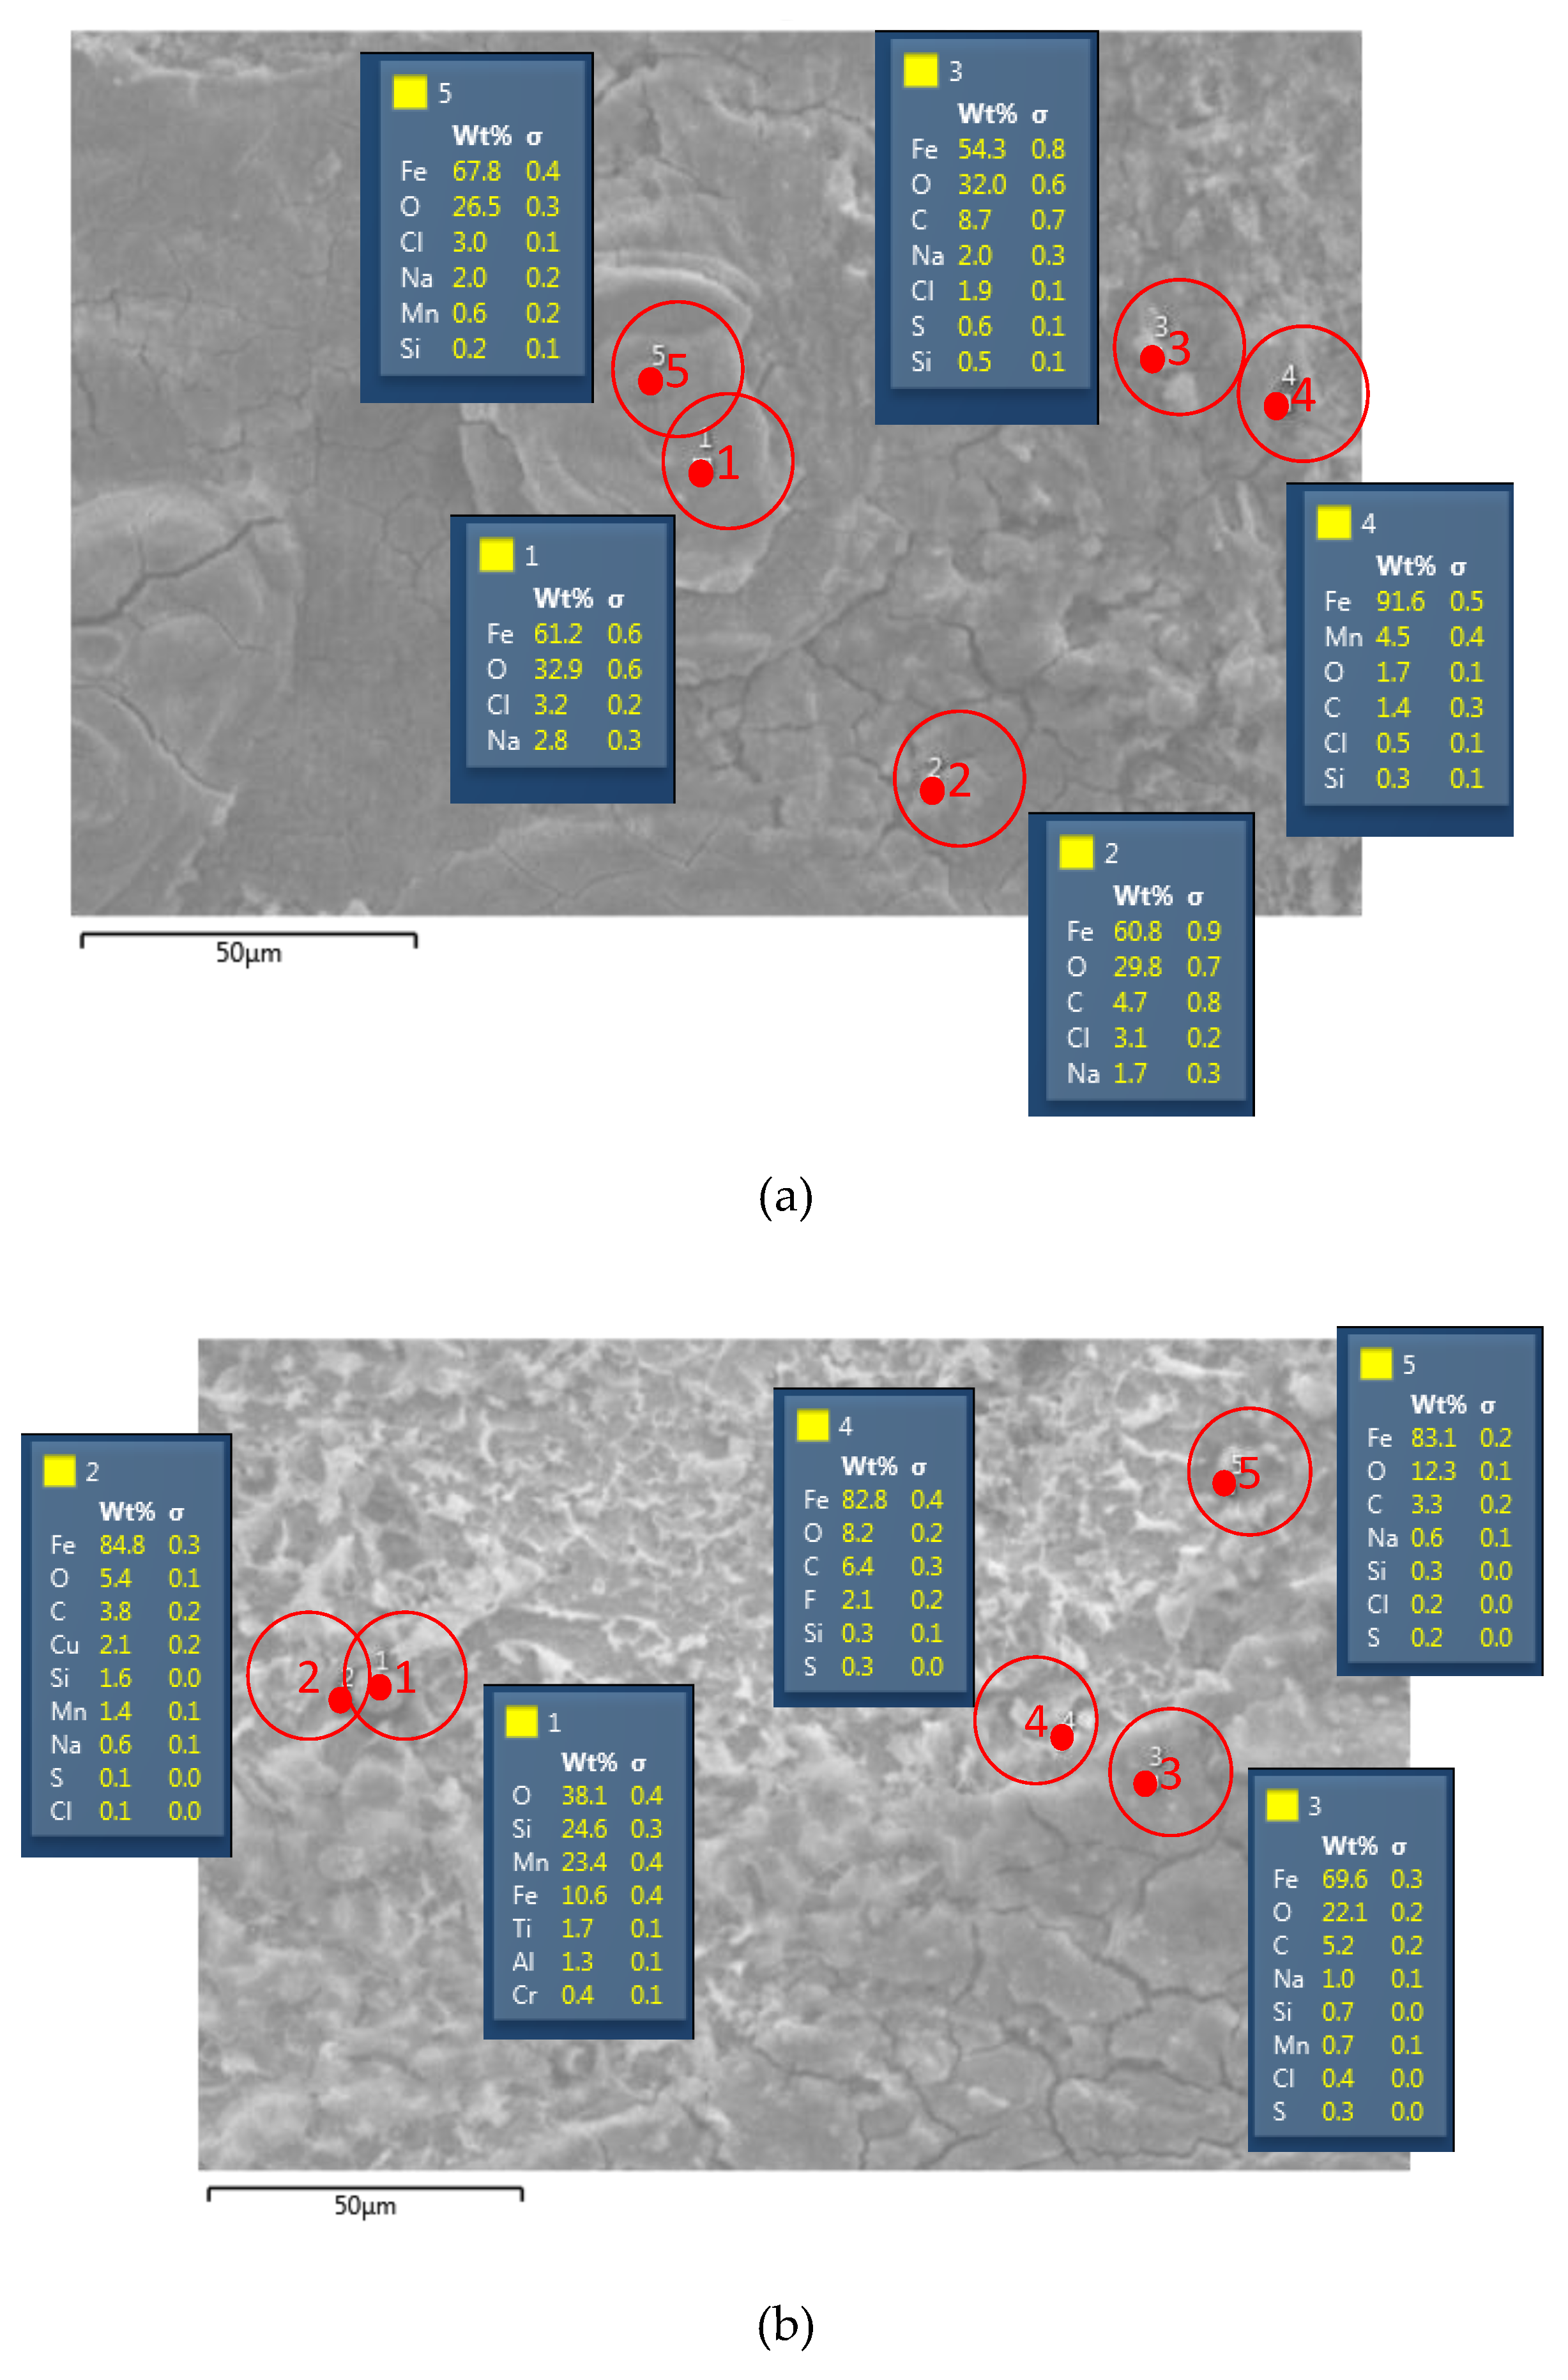
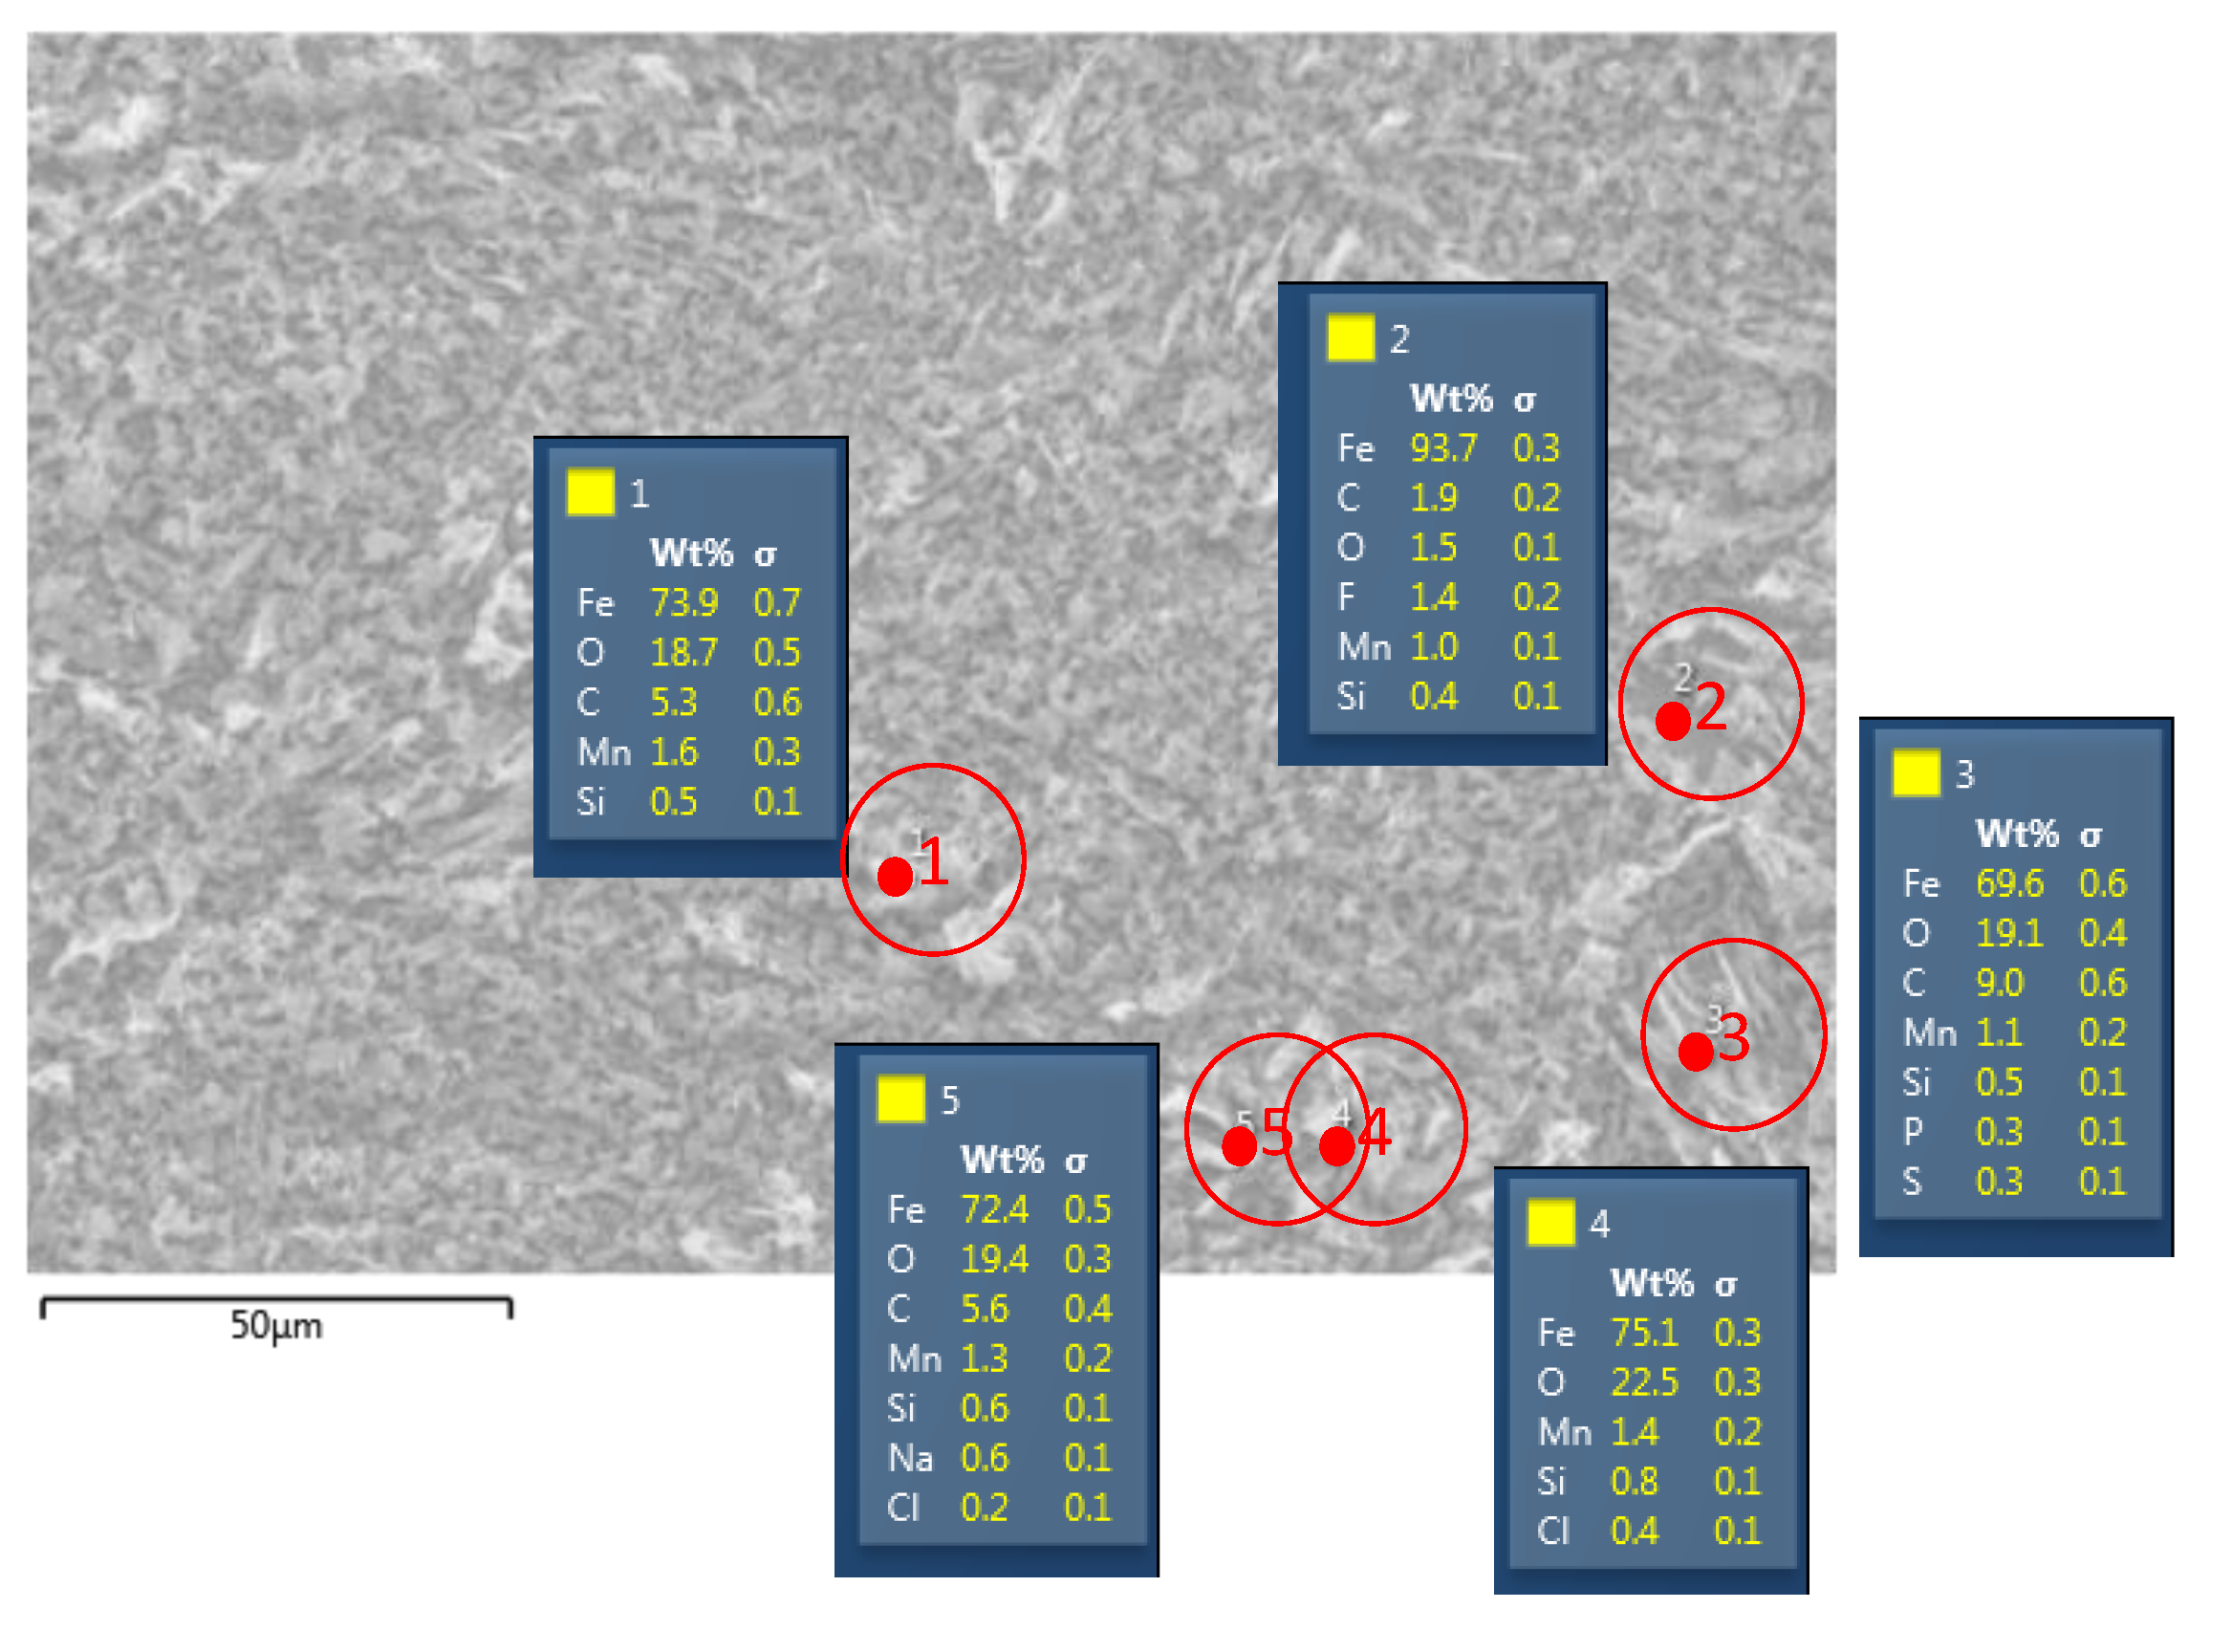
Figure 10 shows the results of underwater welding EDS test with RB26 electrode. Point 5 shows O element content of 23.9%. Point 3 shows elemental O content of 7.6%. The P element found in the chemical composition of the electrode is used as a filler or additional metal which functions to increase the corrosion resistance of material so that the corrosion rate at the RB26 electrode is lower than the other two electrodes. This is also following the study of Sigler et al. [
17]. The scholars said that the P element influences the corrosion resistance of the material so that the appearance of SEM is dominated by parts that have not been eroded (see
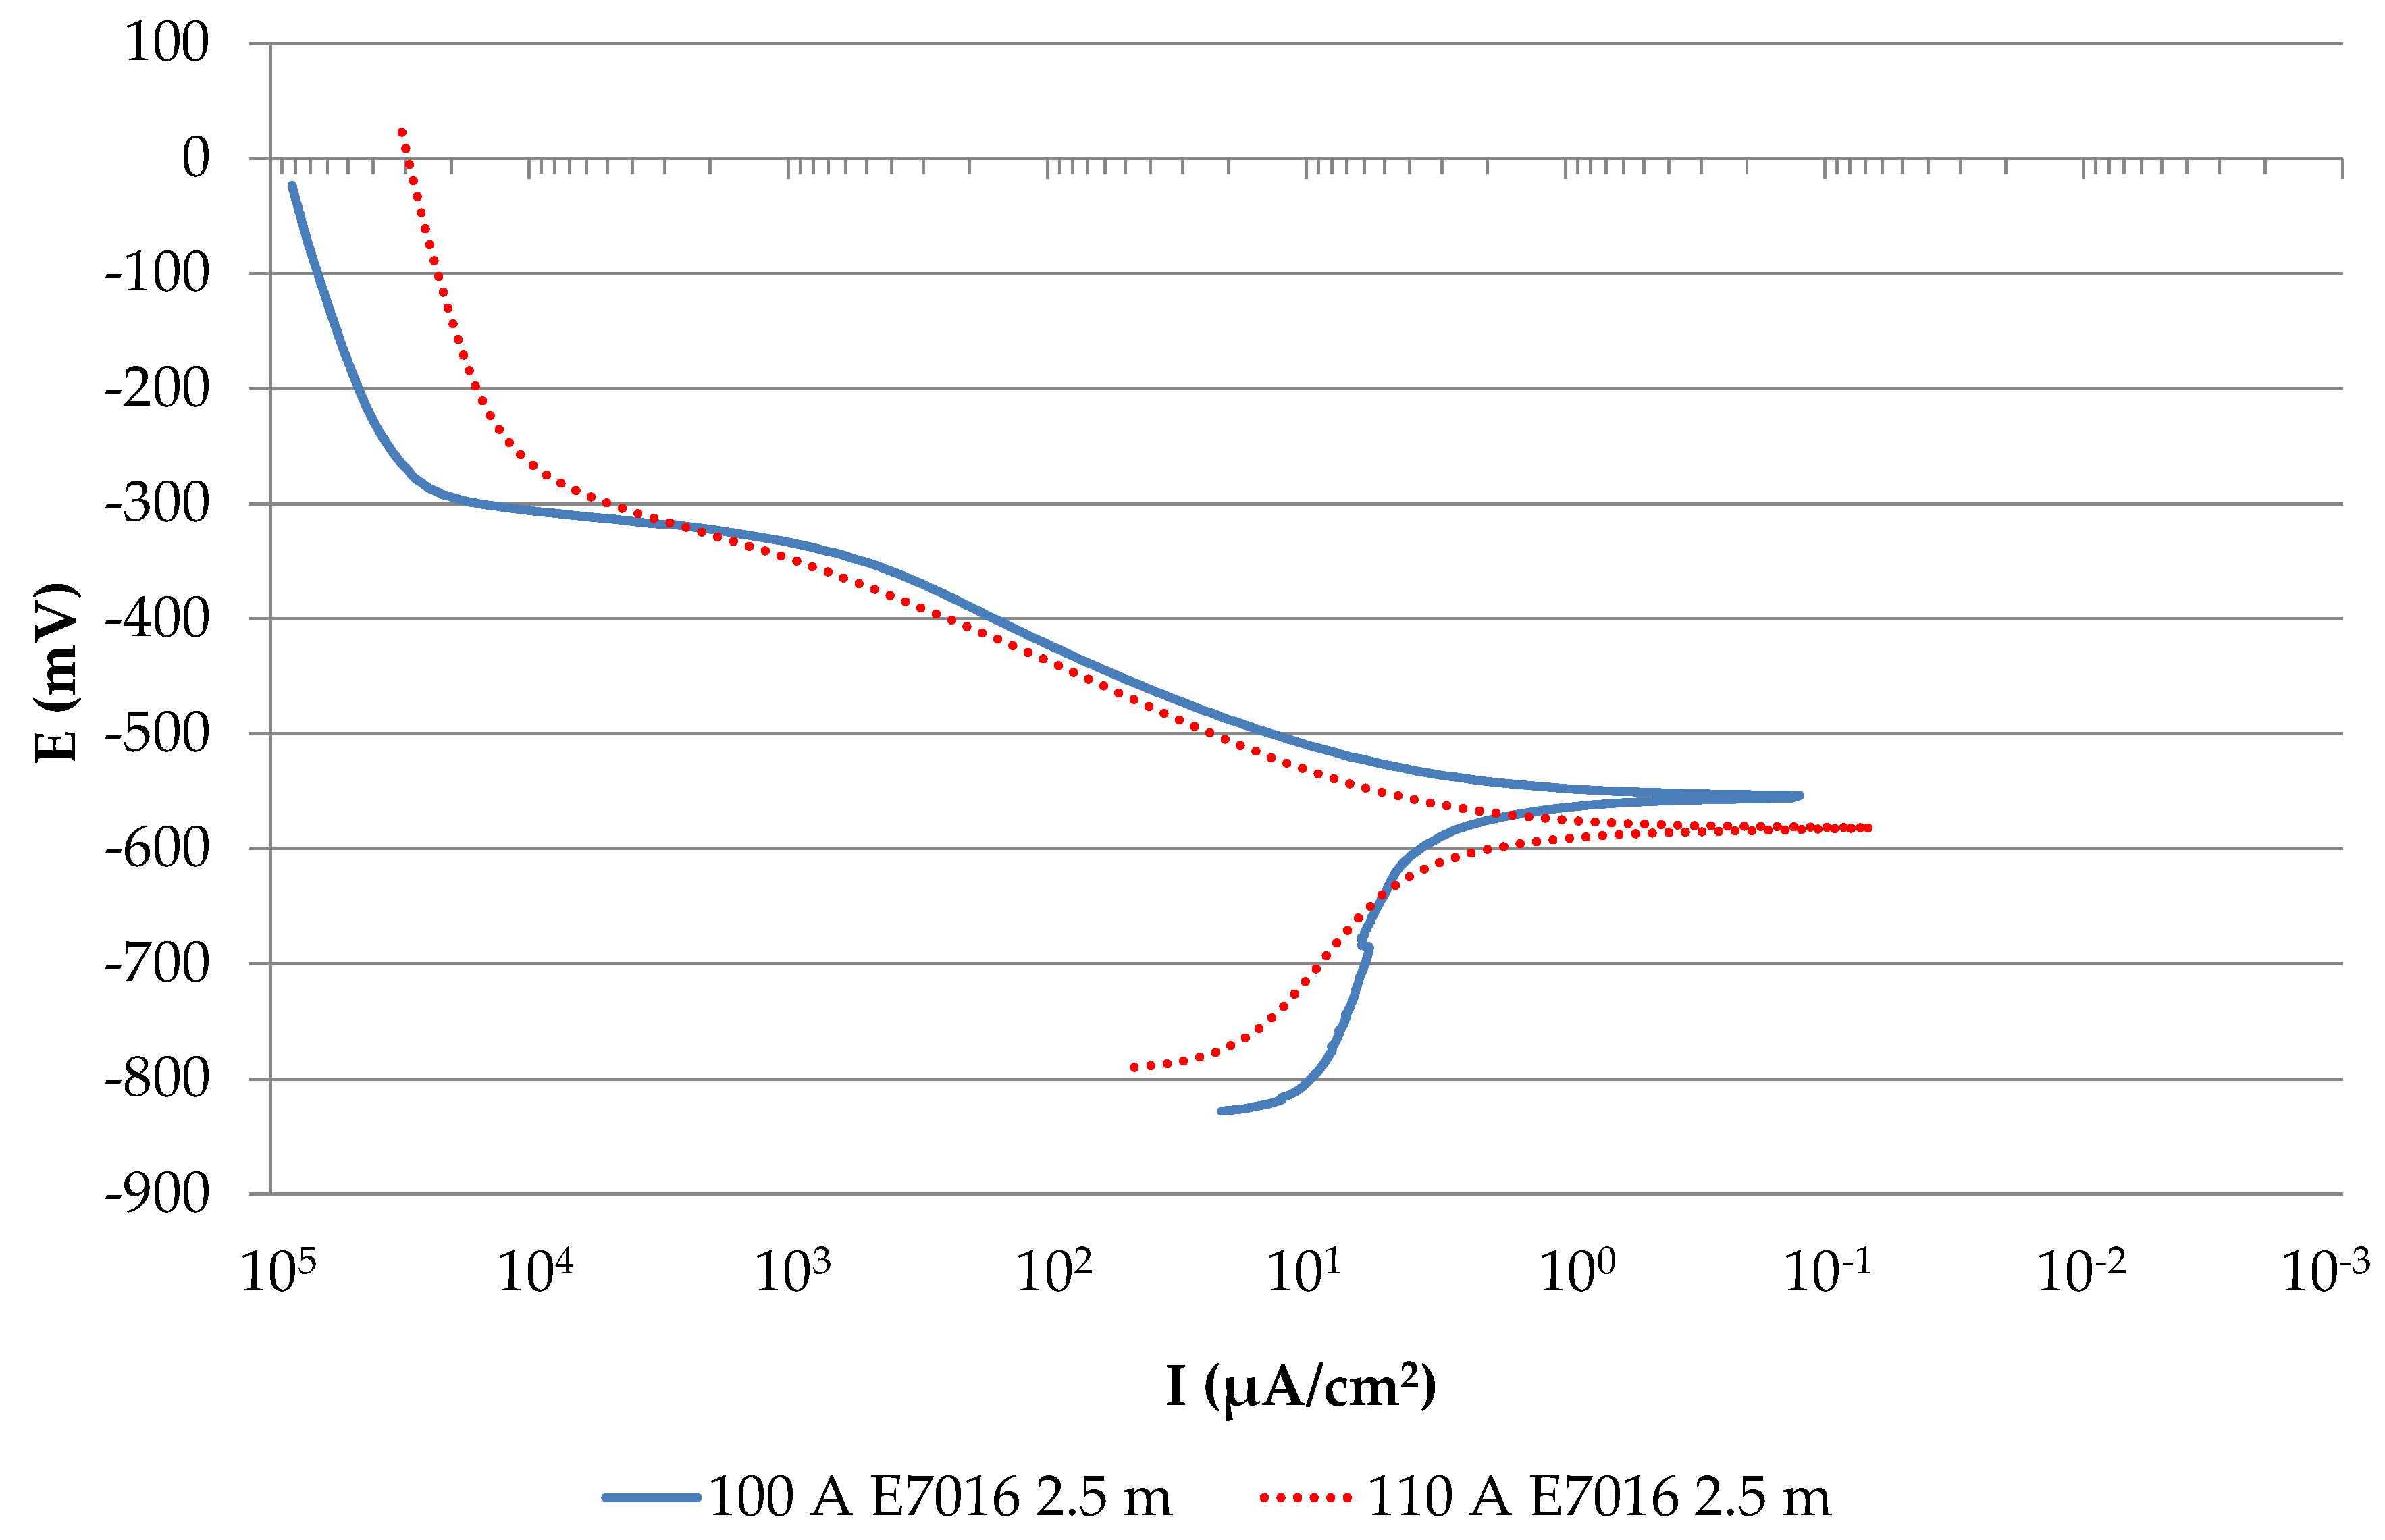
Figure 10). Corrosion testing was also conducted to find the effect of the welding current used on the corrosion rate of the specimens. The compared welding currents are 100 and 110 A. The Tafel graph from the corrosion test for the ratio of current 100 A and current 110 A, is shown in
Figure 11, while the comparison in forms of bar ratio of the corrosion rate is shown in
Figure 12.
Figure 11 indicated that welding with a current of 100 A has a Tafel curve higher than welding with a current of 110 A. The Tafel welding curve with a current of 100 A has an Ecorr value of −554.787 mV. In comparison, the Tafel welding curve with a current of 110 A has an Ecorr value of −582.122 mV. The welding Tafel curve with a positive value of
Ecorr results in a lower corrosion rate than the corrosion test specimens that have a more negative
Ecorr value. A higher Tafel curve results in a high
Ecorr value which tends to be more corrosion resistant.
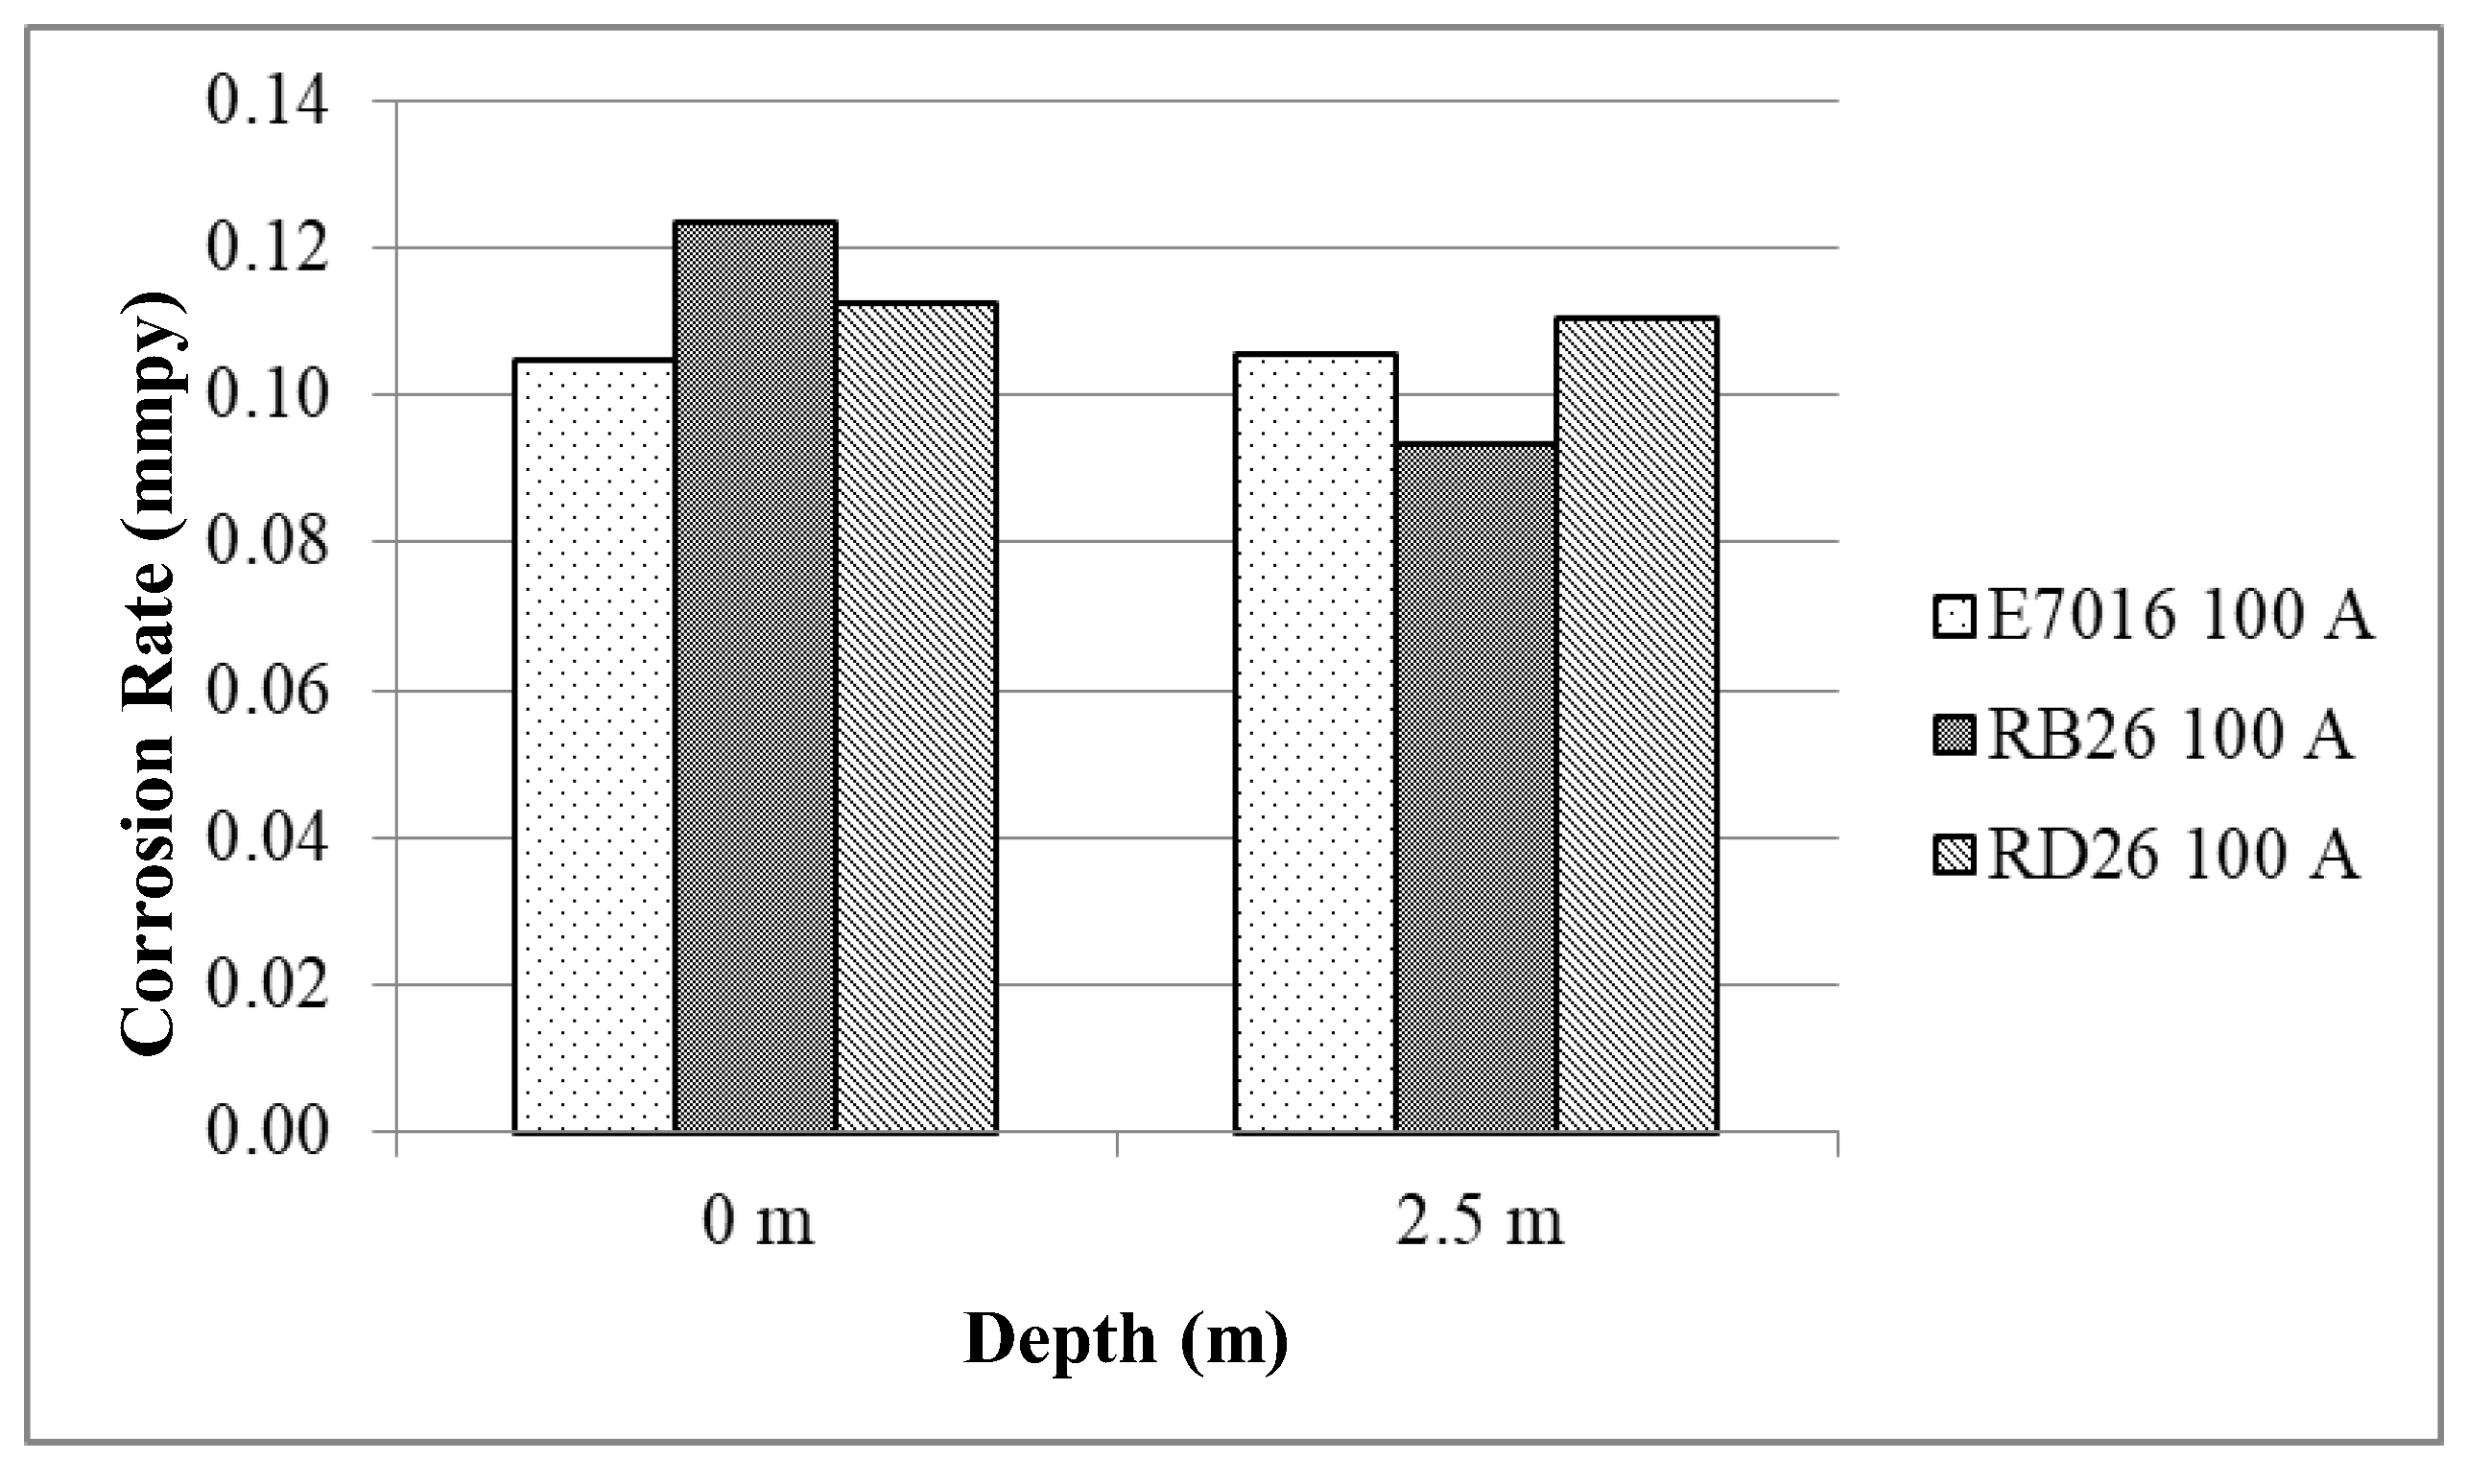
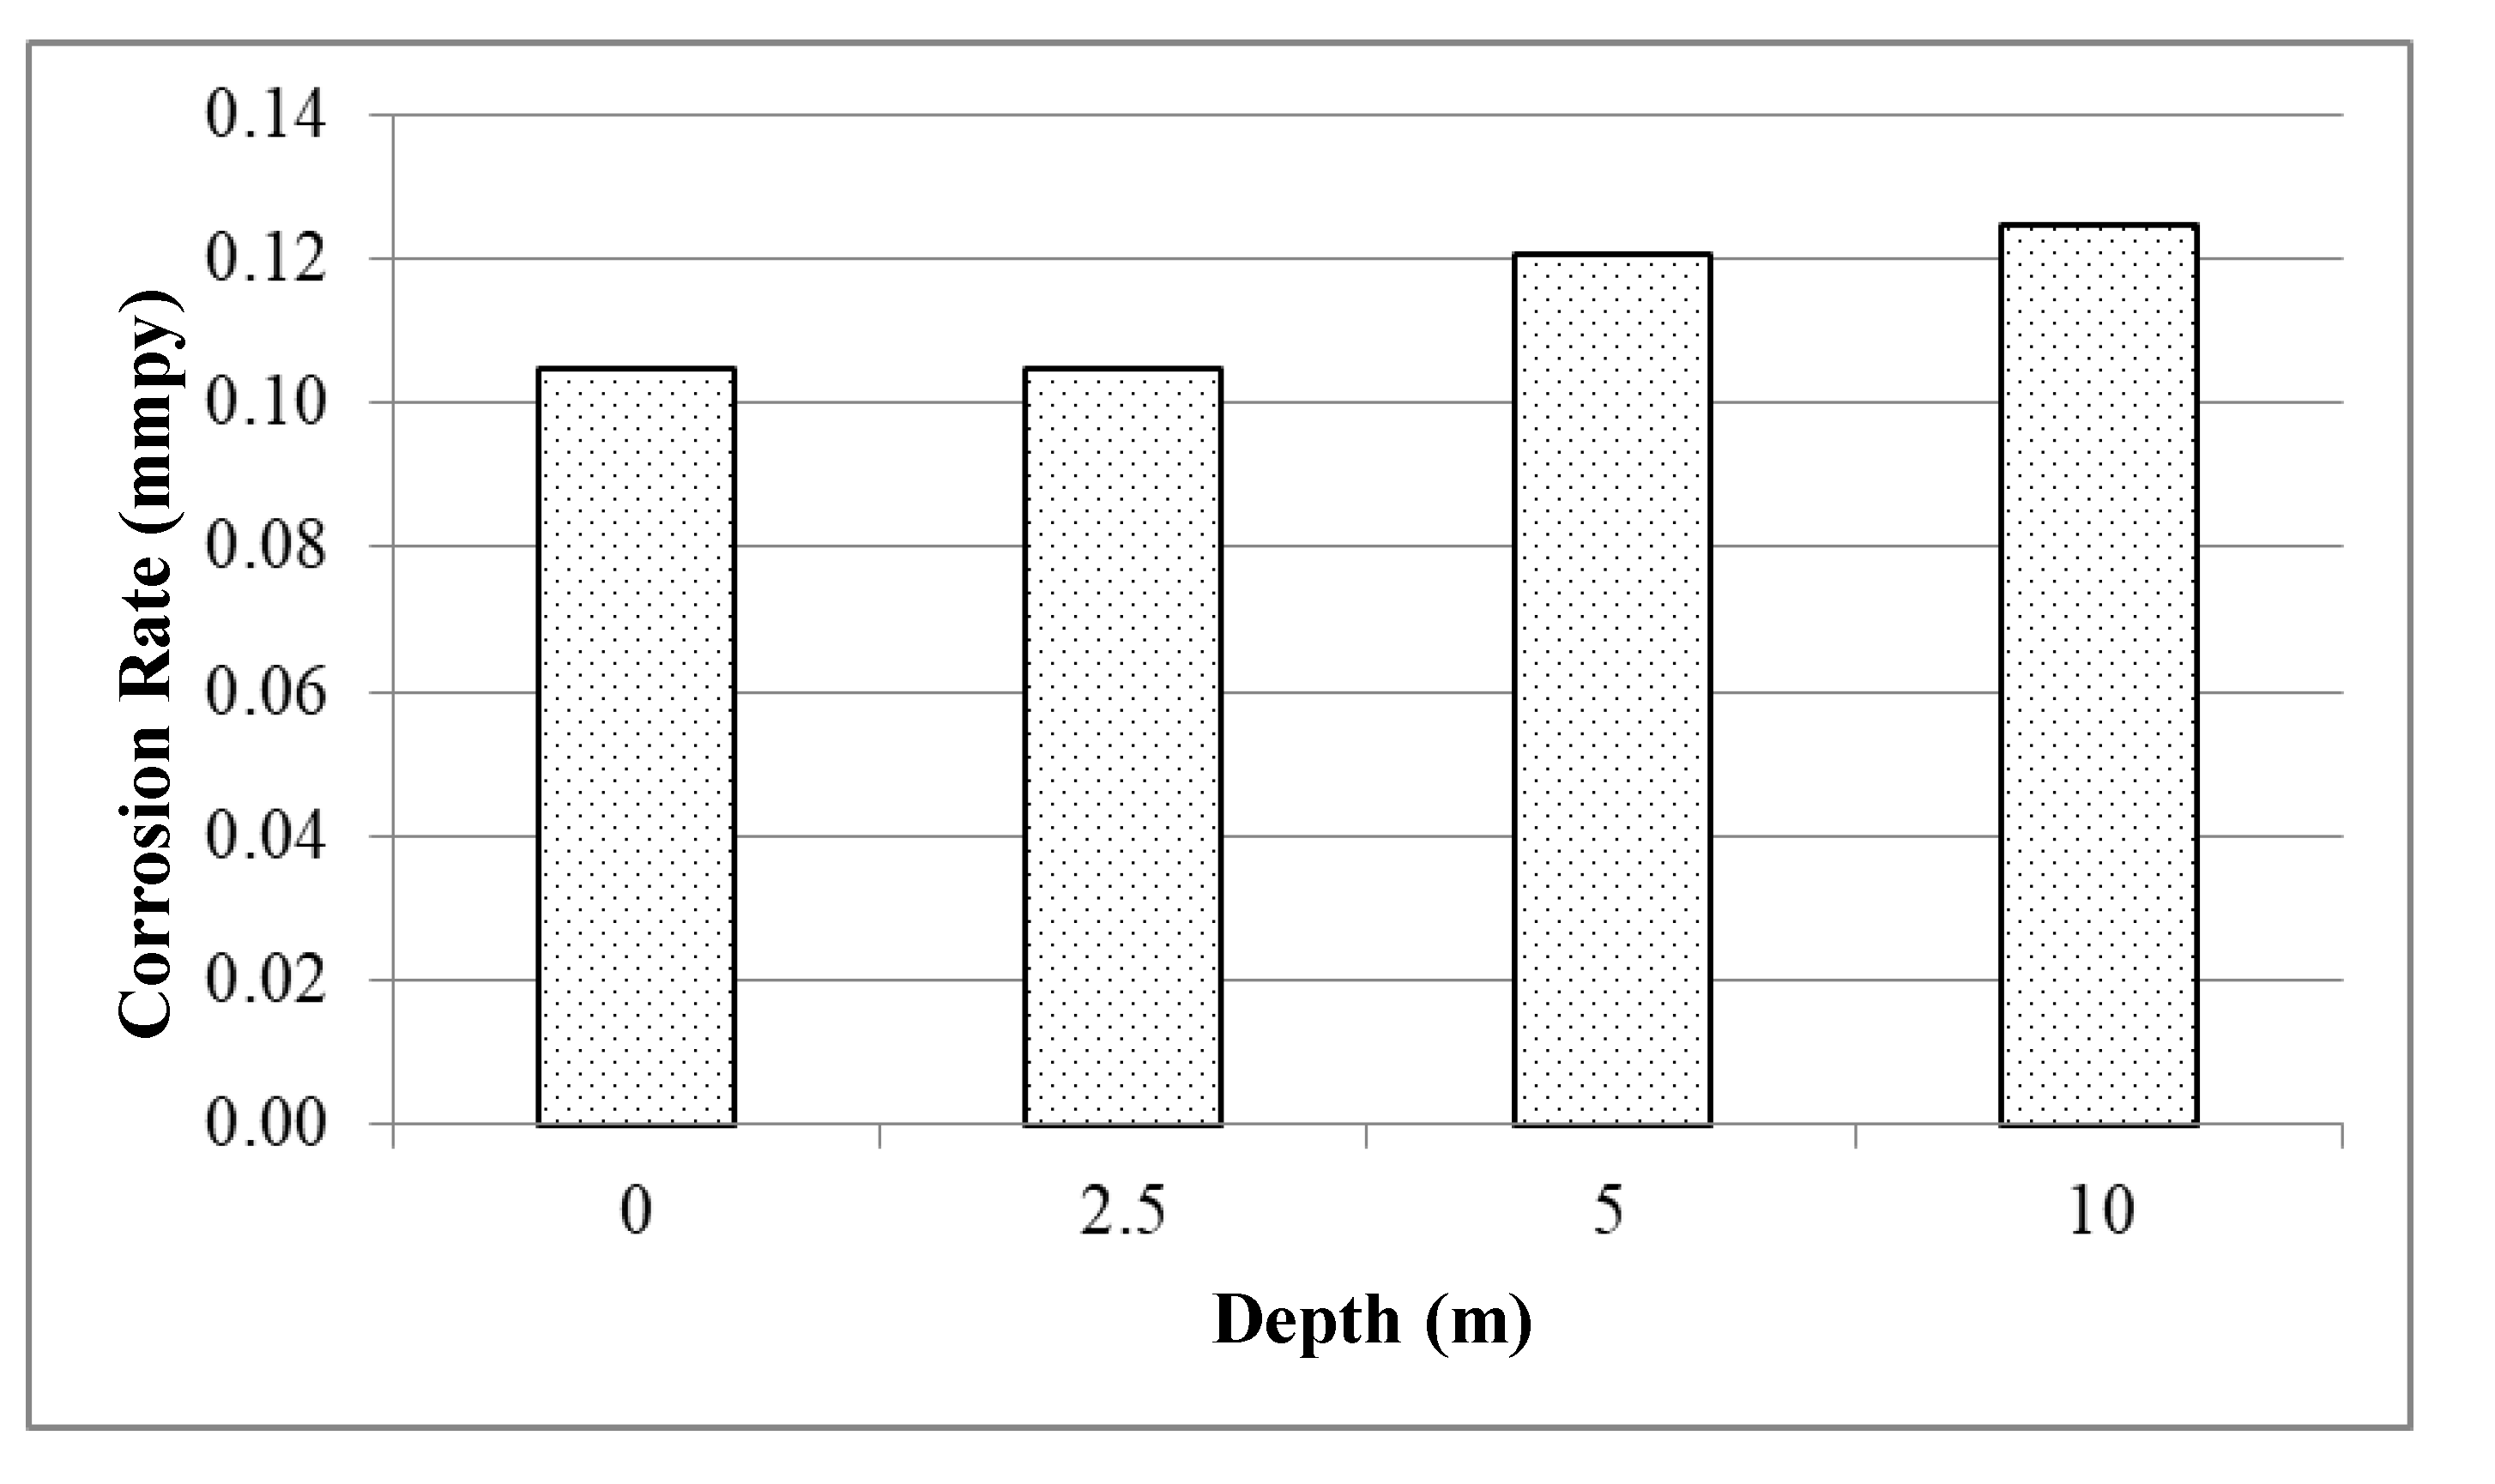
Figure 12 shows a lower corrosion rate found in welding with a variation of the welding current 100 A. The results of corrosion tests on underwater welding with an increase in welding current result in a higher corrosion rate. This phenomenon occurs because large welding currents affect the heat input value during the welding process. Current 100 A gives a corrosion rate that is smaller than 110 A because the higher the heat input value will cause a phase balance disturbance in the weld metal section. In contrast, a low heat input value may not achieve the desired weld penetration [
23]. The input value of heat that is not excessive will push the polarization curve to a positive value so that it can provide better corrosion resistance [
24].
Figure 5 and
Figure 12 show corrosion test specimens taken first in macros then enlarged with a magnification of 1500 times at their midpoint. The macro photo on welding with 100-A current shows darker color is more dominant than welding macro photo with 110-A current. This phenomenon proves that welding with 100-A current is more effective because it has a lower corrosion rate than welding with 110 A.
The results of this SEM test are following the results of corrosion tests where the current 110 A has a higher corrosion rate compared to welding with a current of 100 A. The selection of the right heat input can reduce the amount of porosity in the weld metal. The more porosity will cause stress concentration to occur, which is the beginning of the formation of pitting corrosion [
16]. The elements contained in the specimens resulting from corrosion tests can be seen in
Figure 10. The darker colored parts contain less oxygen because the protective layer has not been damaged so that the corrosion process has not occurred. The brightly colored part contains more oxygen because the protective layer was damaged so that the corrosion process occurs. Water depth parameters also influence the corrosion test results. Therefore, corrosion testing was also carried out at a depth of 5 m and 10 m with a fixed electrode E7016.
Figure 13 shows a Tafel graph of the comparison of depth parameters and
Figure 14 shows a bar diagram of the ratio of corrosion rates to water depths of 0 m, 2.5 m, 5 m and 10 m with a welding current of 100 A. The lowest corrosion rate is obtained by welding with a variation of 2.5-m depth which is equal to 0.10536 mm/year. The highest corrosion rate is obtained by welding with a depth variation of 10 m which is equivalent to 0.12538 mm/year. The results show that the corrosion rate in underwater welding increases with increasing welding depth. The reaction between electrodes and water (H
2O) in underwater welding results the appearance of porosity in the welding specimens.
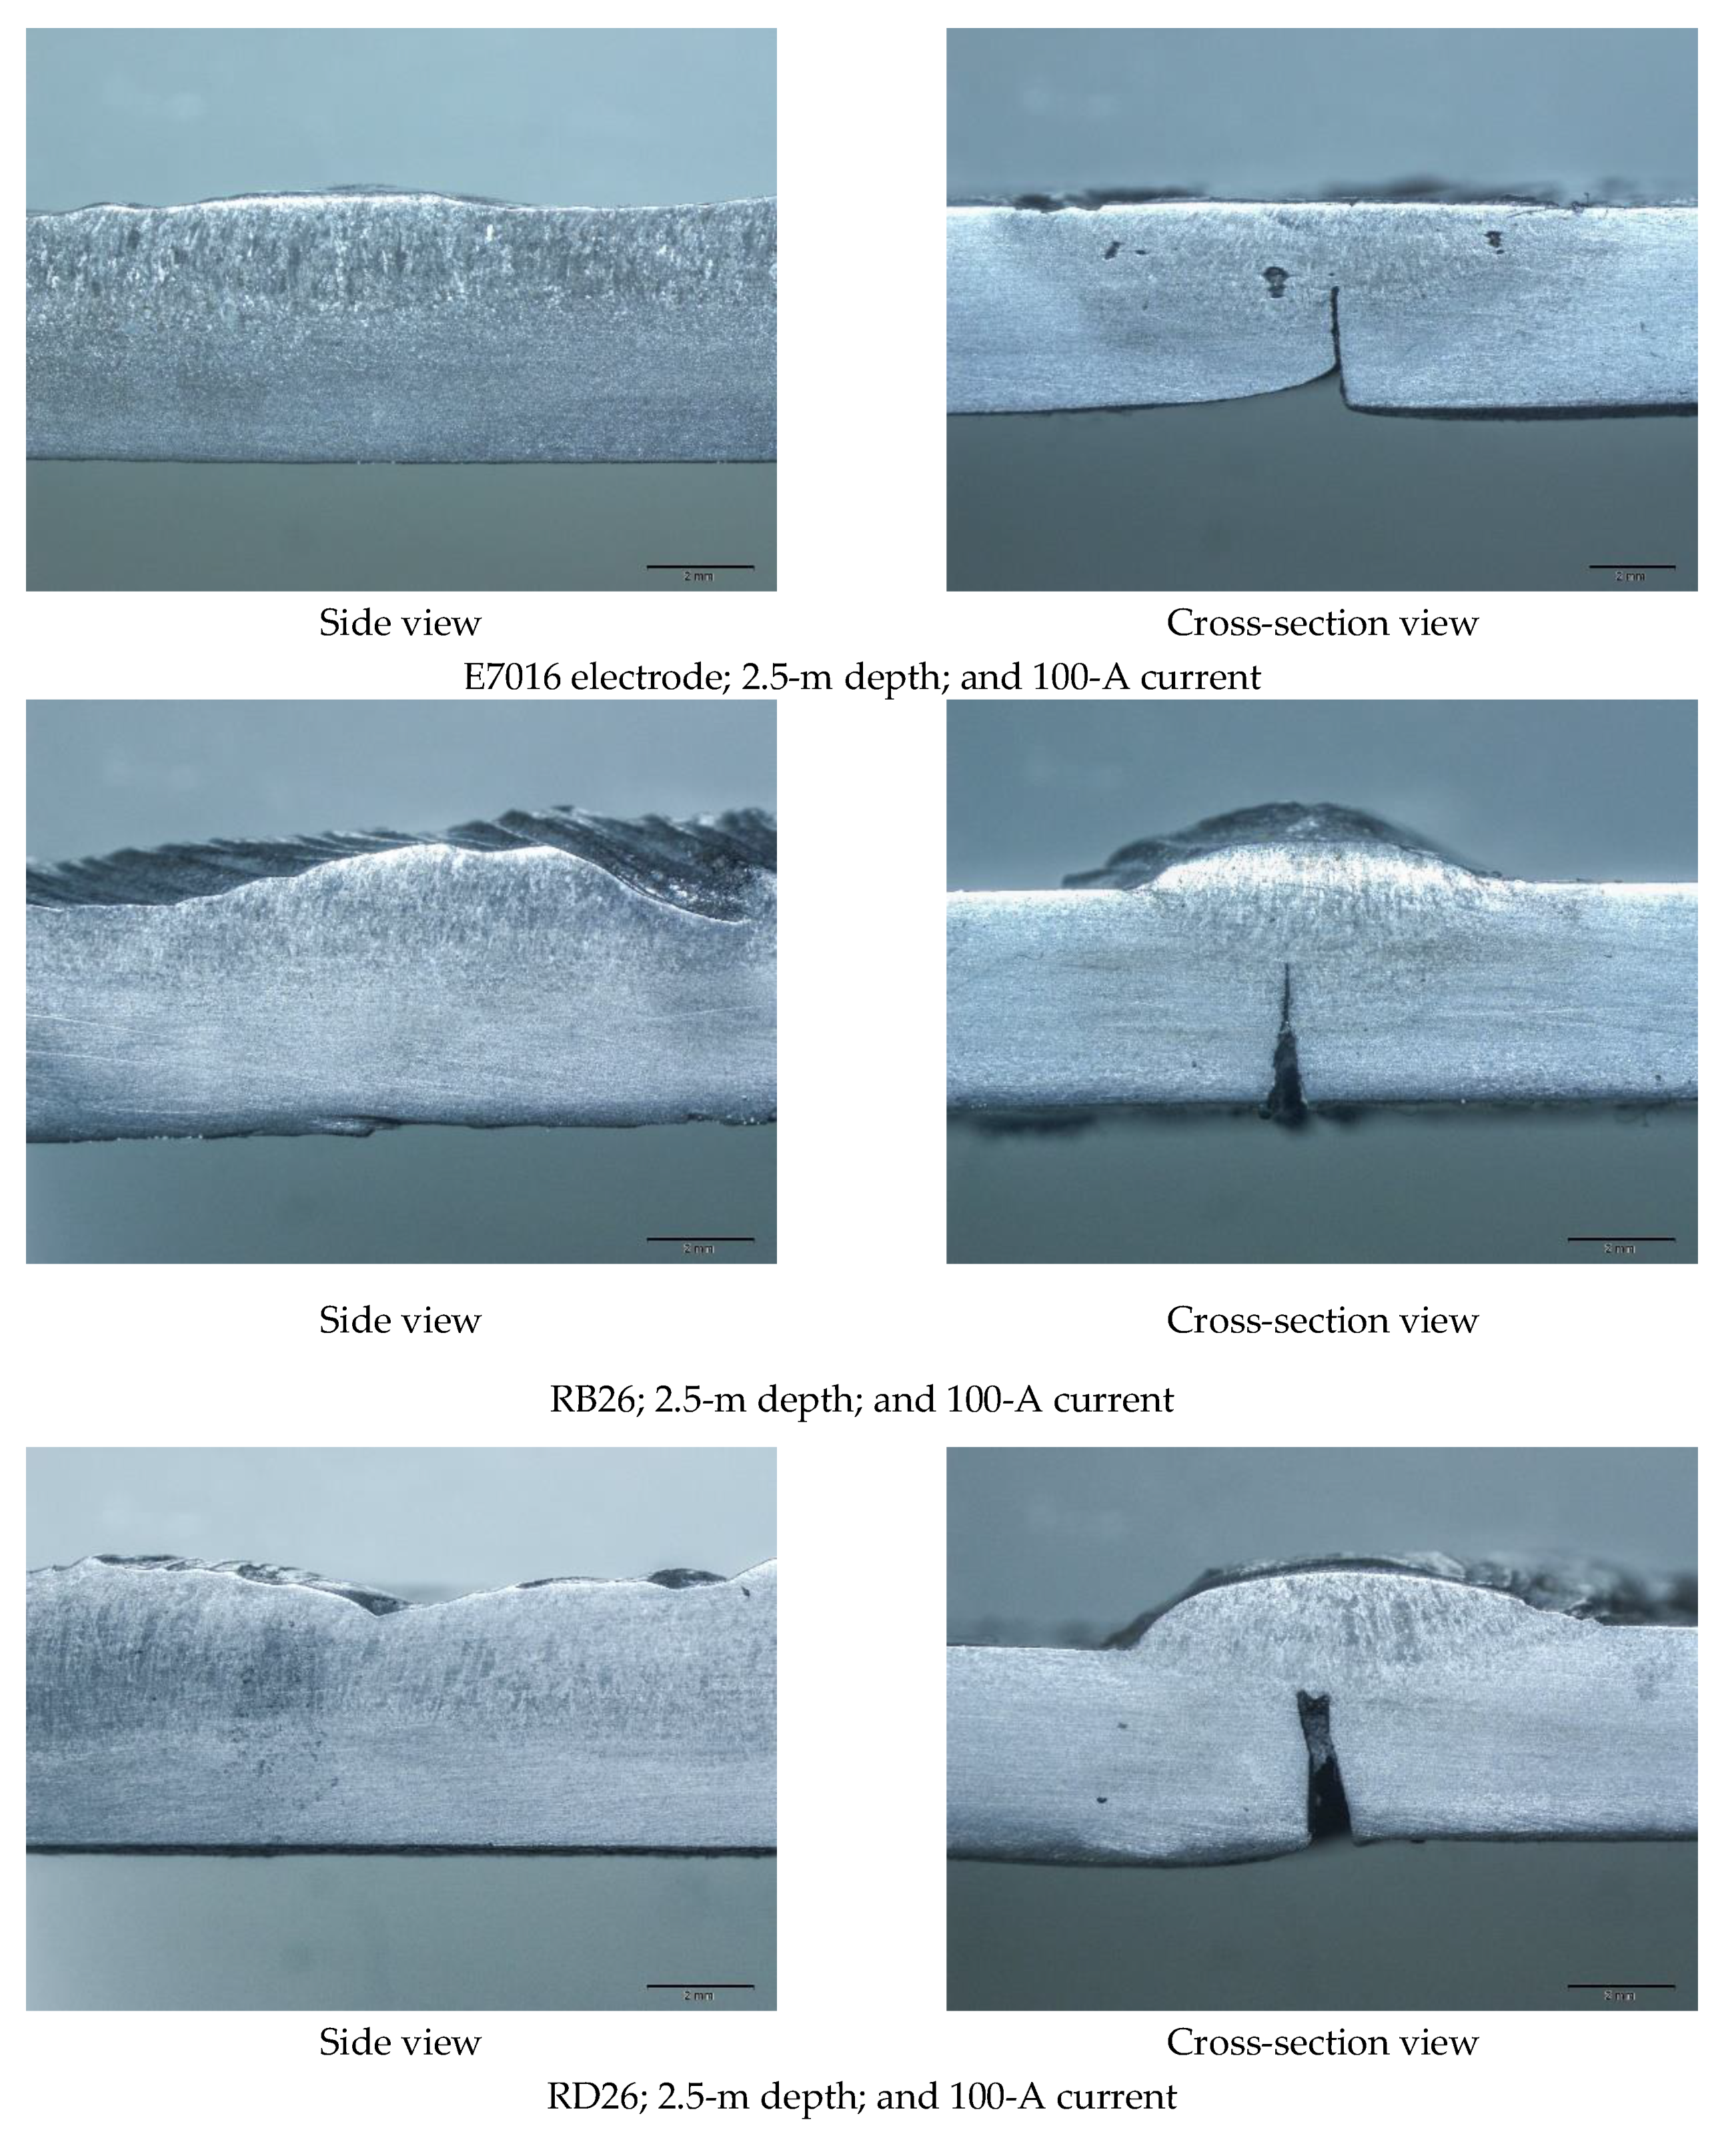
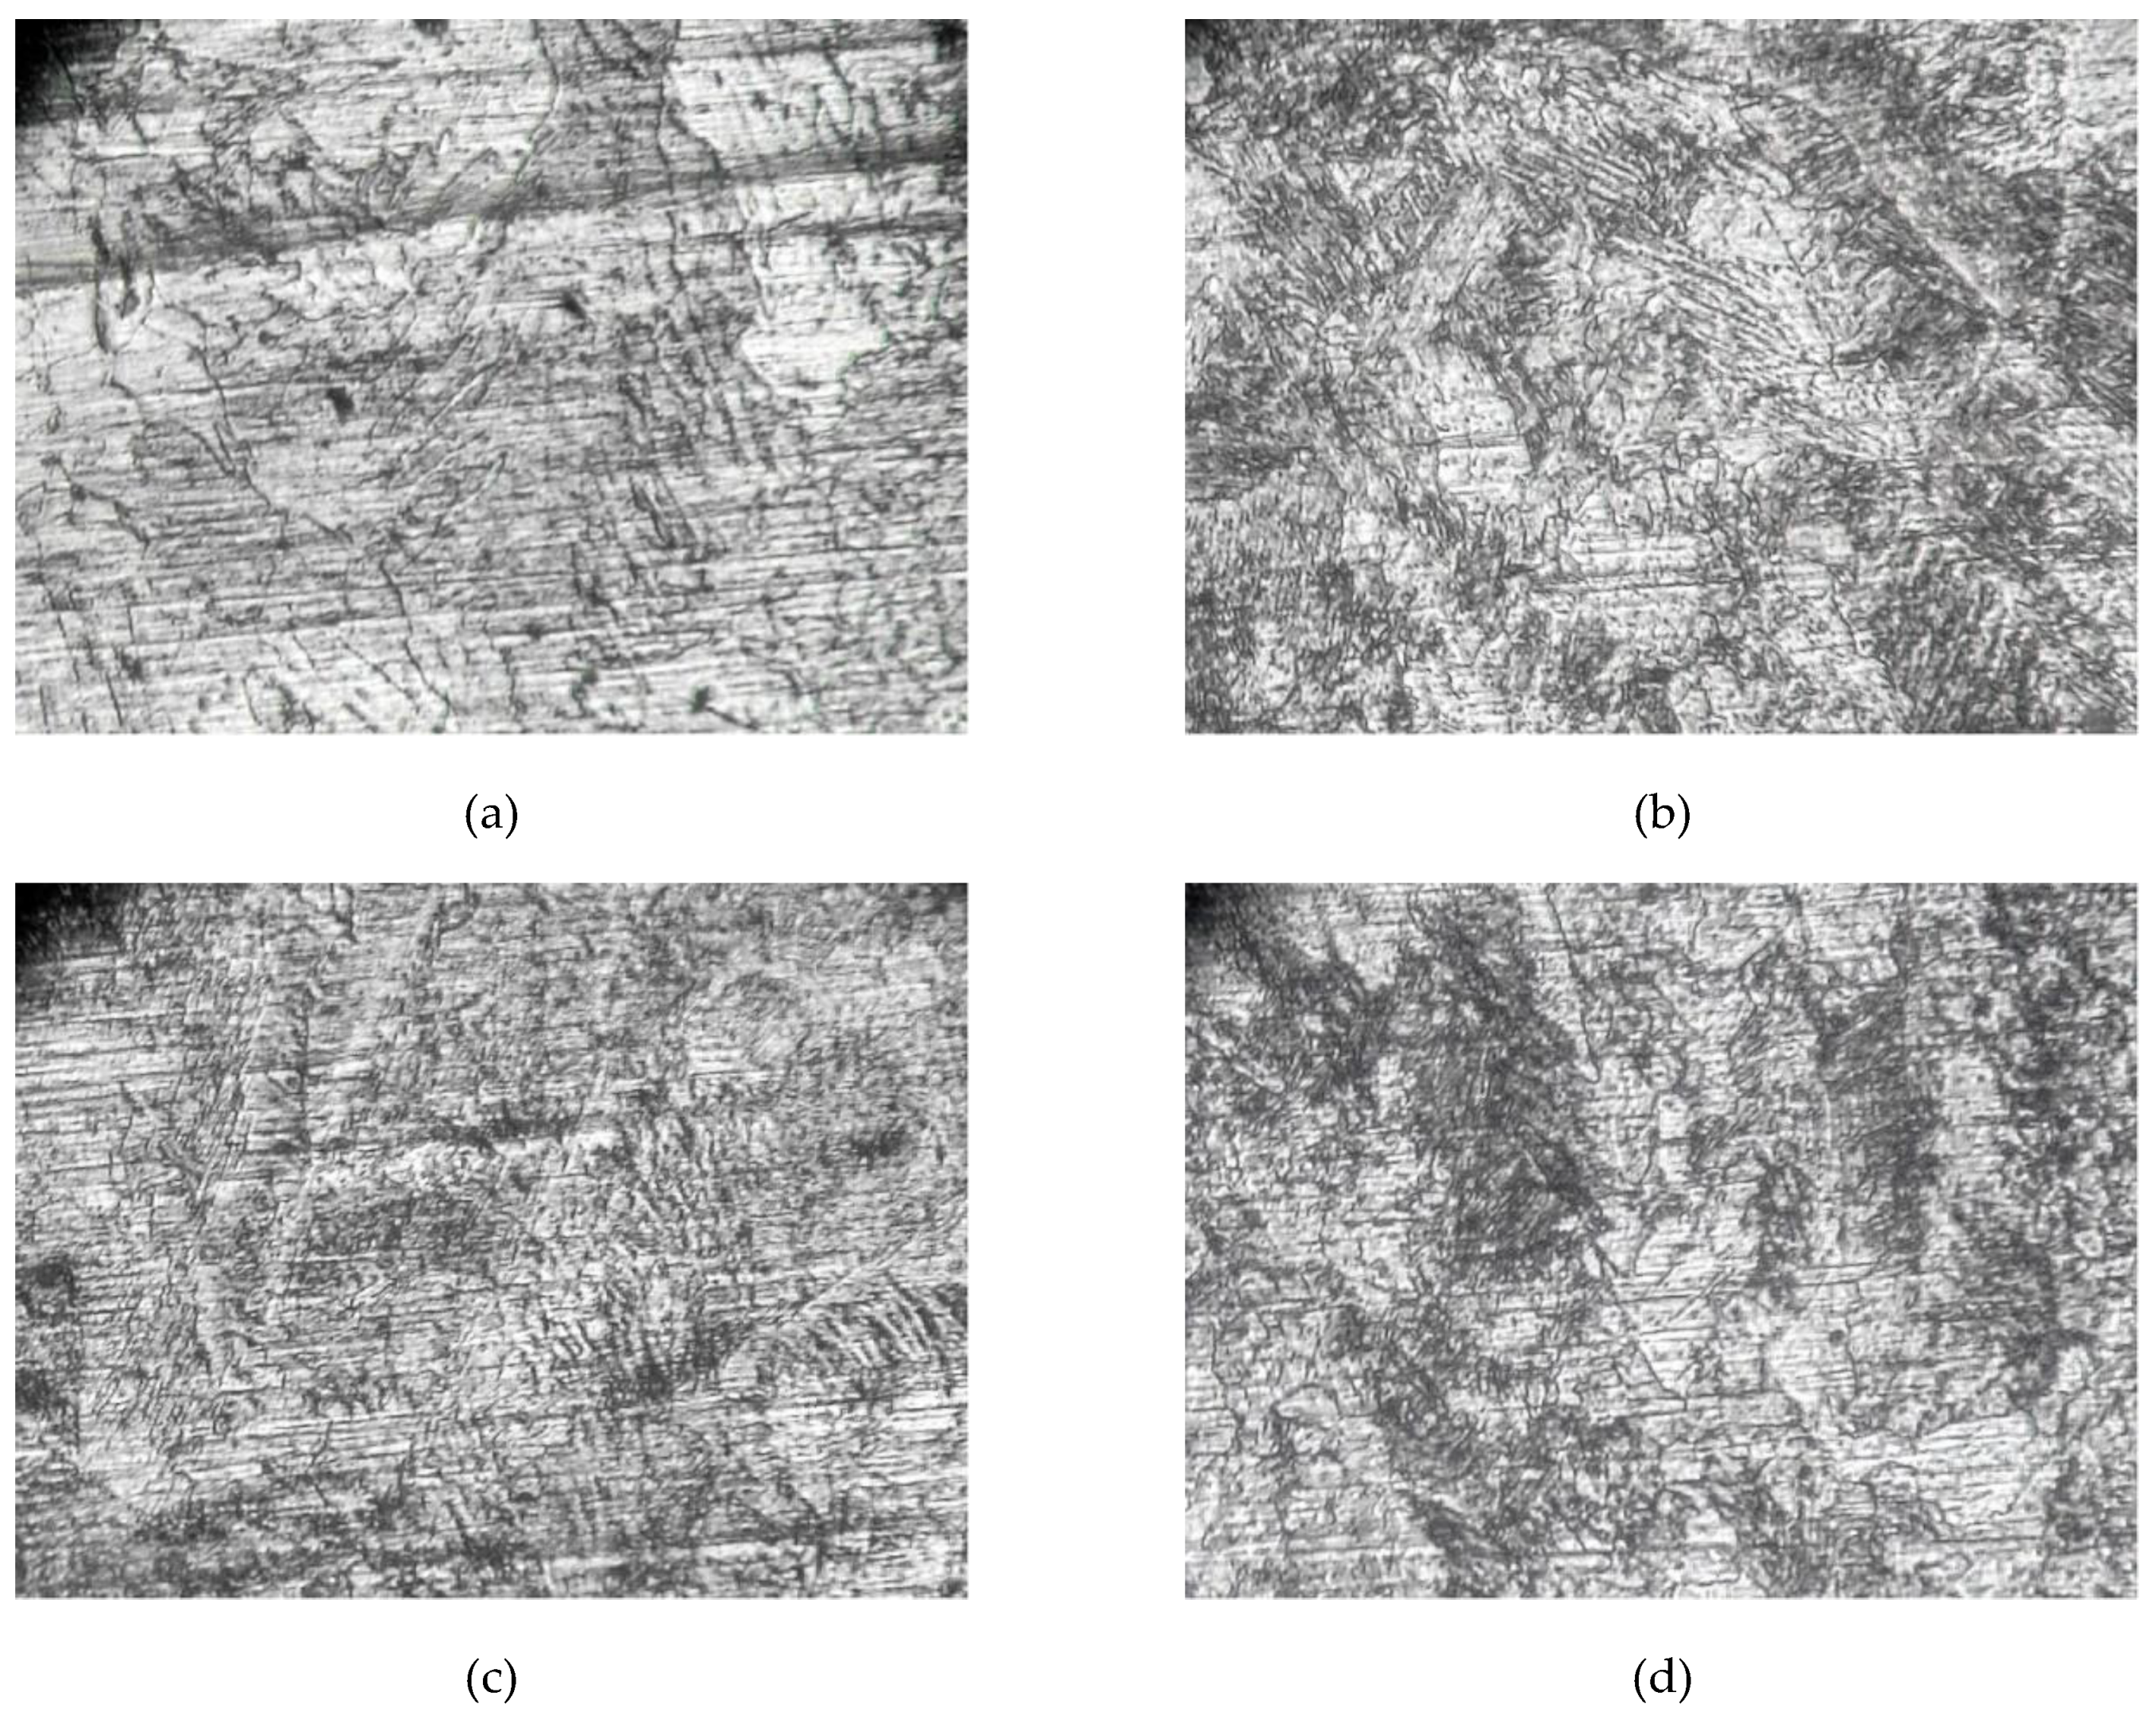
The metal–microstructure phase is dominated by ferrite and pearlite. Increasing water depth causes microstructure that looks more refined because the cooling rate increases and the size of the grain shrinks. Underwater welded joints have more defects compared to welded joints on land. Poor arc stability and the result of the dissociation of water in the form of gas trapped in the weld metal is the leading cause of many defects in underwater welded joints (see
Figure 15).
The increasing depth of water results in the cooling rate also increasing and can adversely affect the results of underwater welded joints [
25]. Guo et al. [
26] and Pessoa et al. [
27] stated that porosity in underwater welding occurs because of an increase in the amount of oxygen and hydrogen. Negatively charged chloride ions play an essential role in the oxidation process on metal surfaces. Anodic and cathodic reactions that occur in successive pits, namely:
Chlorine compounds in the electrolyte solution will react with Fe
3+ ions and form a solid oxide layer (Fe
2O
3) which covers the anode surface so that corrosion occurs. As a result of the above reaction, the pit or hole becomes positively charged so that it contrasts with the electrolytes around the negatively charged pit. This positively charged pit will attract Cl- negative ions so that it can increase the acidity of the electrolyte so that it speeds up the corrosion rate [
28], this is following the reaction:
Water depth in underwater welding affects the corrosion rate of welding results. The deeper the welding is done; the water pressure will also be more significant and will make the welding arc unstable so that it affects the results of welding. Moreover, the amount of oxygen and hydrogen in the welding pool is increasing due to water dissociation, which results in porosity and hydrogen cracks [
26,
27]. Water dissociation that occurs during the underwater welding process is an abundant source of hydrogen gas in the area around the welding arc, which quickly spreads to the weld pool. Water pressure under underwater welding conditions significantly affects the physiochemical balance in the weld pool. High levels of cooling cause susceptibility to phase transformation at HAZ, the presence of slag and the appearance of porosity. The high content of hydrogen in the metal will cause the formation of hydrogen crack, which is one of the causes of corrosion [
21]. Influences of the selected parameters in this study are also quantified in terms of chemical composition, especially Fe, which is a fundamental element of metal. As presented in
Figure 16 for applied currents, which it can be observed that higher current caused a difference in Fe composition, which 110 A produced lesser Fe wt% compared to 100 A with gap approximately 7.42%.
Figure 17 for selected electrodes, which indicates RD26 produced the lowest maximum Fe among all selected electrodes with value 72 wt% or 20% lesser than the highest Fe composition in the specimen with electrode E7016. As for variation on welding location (water depth) as presented
Figure 18 and
Figure 19, it can be concluded that Fe composition in land-based welding is superior to the underwater welding, which gap between the highest Fe exceeds 8%. It is recommended to conduct a comparison of the composition test data using EDS with the chemical composition test data using spectrometer analysis, which is capable of presenting overall chemical elements in a specimen. Nevertheless, the analysis of chemical composition using EDS is considered good enough to offer discussion data if spectrometer analysis is unavailable, primarily when research time and testing facility are restricted.

 ,
, 


