Article

Prediction of As, Cd, Cr, Hg, Ni, and Se Concentrations in Organic Amendments Using Portable X-ray Fluorescence and Multivariate Modeling

by
Rafael López-Núñez
*,
Fátima Ajmal-Poley
and
Pilar Burgos-Doménech
Instituto de Recursos Naturales y Agrobiología de Sevilla (IRNAS-CSIC), Avda, Reina Mercedes 10, 41012 Sevilla, Spain
*
Author to whom correspondence should be addressed.
Appl. Sci. 2020, 10(17), 5726; https://doi.org/10.3390/app10175726
Submission received: 23 June 2020 / Revised: 11 August 2020 / Accepted: 13 August 2020 / Published: 19 August 2020

Abstract

:

Featured Application

Extended use of portable X-ray fluorescence (XRF) instruments to analyze organic amendments (composts, sewage sludges, organic fertilizers) to assess compliance with quality standards. The analysis could be cheaply and quickly carried out.

Abstract

Portable X-ray fluorescence (pXRF) has been a widely used technique in various applications. However, its use for the analysis of organic amendments (composts, sewage sludges, organic fertilizers) is scarce. In these matrices, concentrations of some elements are below their detection limit. The objective of this work was to find multiple linear regression equations that were able to predict the aqua-regia-soluble concentrations of the elements As, Cd, Cr, Hg, Ni, and Se using the pXRF readings of other measurable elements as predictor variables. For this, a set of 30 samples of organic amendments (composts, sewage sludges, and organic fertilizers) from the Manure and Refuse Sample Exchange Programme of the Wageningen Evaluating Programs for Analytical Laboratories (MARSEP-WEPAL) was used. Several amendment type-dependent single or multiple linear functions were found based on 1, 2, or 3 predictors. The predictor readings corresponded to the concentration of elements of geogenic (Fe, Si, Ti, Cl, Zr Al, Ca, S, Mn, and Ba), anthropogenic (Zn and Pb), and agricultural (P and K) origin. The regression coefficients of these functions were r = 0.90–0.99; therefore, they allowed for the quantitative determination of the target elements. These results will allow for fast and reliable analysis of organic amendments using pXRF that is valid for quality control in treatment plants.

1. Introduction

Portable X-ray fluorescence (pXRF) instruments and related techniques are increasingly becoming a staple of research laboratories with increasing applications in the environment, geology, cultural heritage, and soil science [1]. These instruments are quite accurate for the determination of the concentrations of elements present in moderate to high concentrations in soils [2]. Detection limits are much higher for pXRF compared to the usual laboratory-based methods, but its portability, ease of use, and high throughput rate make it a valuable tool, especially for field-based studies [3]. For example, Rouillon and Taylor [4] have shown that pXRF is a suitable alternative to analysis using inductively coupled plasma atomic emission spectroscopy (ICP-AES) of the total contents of Ti, Cr, Mn, Fe, Cu, Zn, Sr, Cd, and Pb in soils contaminated with metals. The technique presents great possibilities for soil and geochemical research [5,6]. Other important agronomic properties in soils, such as pH, soil organic Carbon (SOC, texture (clay and sand contents), and cation exchange capacity (CEC) can be inferred from these elementary concentrations using chemometric procedures, such as multiple linear regression models [2]. Other authors [7] have used various multivariate models to predict the geographic variation of certain parameters.
Despite the possibilities of this technique, its use for the analysis of organic amendments, such as compost, sewage sludge, and organic fertilizers, has been limited [8,9,10,11,12,13]. Only a few elements (Ca, Cr, Cu, Fe, K, Mn, P, and Zn) have shown potential for quantitative determination in dry samples [11], and only qualitative results were obtained for a few more. In a 2016 review, Götze et al. [14] indicated that the XRF analyzer was only used to analyze Cd, Cu, Cr, Fe, Mn, Ni, Pb, and Zn in 3–10% of samples of household waste fractions. The standardized method EN16424 [15,16] has been developed for waste materials at a screening level. A semi-quantitative analysis for the screening of residues, sludge, and soil samples has also been developed in standard EN15309 [17] but through using desktop equipment and specific sample preparation. The organic matter in the sample matrix produces matrix effects that affect the precision of the results obtained and forces specific calibrations to be made for the organic materials [17]. This may be of particular relevance for the elements considered since some of them may accumulate in the organic fraction. Keeping those limitations in mind, Havukainen et al. [8] recommend the technique for qualitative analysis in waste treatment processes as the first line of quality control in waste treatment plants and landfills. In soils, Adler et al. [7] show that multivariate modeling can compensate for some of the shortcomings of the pXRF device (e.g., high limits of detection for certain elements and some elements not being directly measurable), making pXRF instruments capable of predicting elemental concentrations at comparable levels of accuracy to conventional laboratory analyses.
In line with the aforementioned for soils, two recent investigations have shown that some properties of organic amendments can be predicted from elementary pXRF readings. Weindorf et al. [18] used elemental data as a proxy for the prediction of compost salinity, and using principal component regression models, calculated the compost electrical conductivity and pH values with a good correlation between the measured and predicted datasets. López–Núñez et al. [19] obtained calibration functions using multiple linear regression, which allowed for the quantitative determination of the aqua-regia-extractable contents of Fe, K, P, S, Zn, Cu, Pb, Sr, Cr, and Mn, as well as the organic matter content, and a semi-quantitative assessment of Al, Ca, V, Ba, Ni, and As contents.
The pXRF technique has a wide range of quantifications but its detection limits were poorer than those of desktop XRF analyzers, ICP, or atomic absorption spectroscopies commonly used for elementary analysis. The usual levels in composts and organic amendments of the elements Cd, Co, Hg, Mg, Na, Sb, Se, and Sn are not attainable using pXRF, and for As, Ba, Ni, Cr, and V, only a fraction of all samples can be measured. In these matrices, elements were usually determined using the aqua-regia-extractable form [20,21], which constitutes a difference with the measurement made with pXRF that corresponds to the total content.
Relationships between elements have been frequently found in compost from different origins [22,23,24] using principal component analysis, factor analysis, correlations between them, and other chemometric procedures. These studies show how a set of data can be reduced to a few factors. Organic amendments are samples composed of fractions of different origins. Modeling with multiple linear equations thus makes sense since the total amount of a certain element in the amendment would be the sum of the contributions of different sources of the element, and it is usual that in these sources that share an origin, high correlations are found between groups of elements.
We hypothesized that elementary data obtained from a pXRF analyzer can serve as a proxy for aqua-regia-extractable contents in organic amendments of the elements Cd, Co, Cr, Hg, Ni, and Se below the pXRF detection limits. According to the results of our previous work [19], we also hypothesized that multiple linear regression functions can be used to predict the concentrations of the target elements. The objective of this work was the calibration of a pXRF instrument to determine the aqua-regia-extractable contents of elements below the detection limit using a training set of calibration samples.
Although pXRF analyzers are making significant improvements regarding the analysis of numerous types of samples, their applicability and reliability for organic amendments have been limited until now.

2. Materials and Methods

2.1. Field Portable X-ray Fluorescence (pXRF) Analysis

The analyzer Niton XL3t 950s GOLDD+ XRF (Thermo Scientific Inc., Billerica, MA, USA), with its laboratory stand, was used throughout the study. More detailed information about the analyzer can be found on the manufacturer’s website [25]. This analyzer was equipped with an X-ray tube with an Ag anode, operated at 50 keV, 200 µA, and 2 W, with a geometrically optimized large Si drift detector (GOLDD). The analyzer can measure elements from Mg to U. Detailed information on the fundamentals of the technique can be found in References [5,6]. The analyzer can operate in two factory calibration modes called mining (m) mode and soils (s) mode. Hereafter, the letters (m) and (s) are used after the chemical symbol of each element to indicate the measurement mode in which the readings were recorded. The mining mode is a fundamental parameter calibration and it is recommended for high concentrations and quantification [5]. In the mining mode, readings were obtained for the following elements (the number of samples of the Manure and Refuse Sample Exchange Programme (MARSEP) with results above the limit of detection (LOD) are in parenthesis): Mo (11), Zr (29), Sr (30), Rb (30), Pb (22), As (10), Zn (30), Cu (26), Fe (30), Mn (20), Cr (24), V (22), Ti (29), Ca (30), K (29), S (30), Ba (22), Sn (11), Ag (9), Bal (30), Nb (11), Al (22), P (30), Si (30), Cl (29), Mg (9). The mining method gives a parameter called Bal (30), which is the difference from 100% of the sum of all measured elements. This parameter is likely related to the organic matter content of the amendment. The elements U (0), Th (0), Au (0), Se (0), Ni (0), Co (1), W (0), Sb (0), Cd (4), Pd (1), and Bi (1) were also measured, although few readings were obtained since they were below the LODs, and consequently, these were not included in the following statistical procedures. The mining mode is recommended for element concentrations greater than 10 g kg−1.
The soil mode is based on Compton normalization and is often used for scanning and detection for soil metallic elements [4] at low concentrations (<1%). In this mode, readings were obtained for the following elements: Mo (19), Zr (29), Sr (30), Rb (30), Pb (24), As (15), Zn (30), Cu (28), Ni (12), Fe (30), Mn (26), Cr (17), V (14), Ti (29), Sc (28), Ca (30), K (30), S (30), and Ba (18). Furthermore, U (5), Th (5), Au (0), Se (0), Co (0), Hg (0), W(0), Cs (5), Te (0), Sb (1), Sn (6), Cd (0), Ag (4), and Pd (0) were included in soil mode, although they were below the LODs in almost all samples and they were not used in the following.
Dried and finely ground samples were measured by filling an XRF container (model SC-4331, 26 mm internal diameter, 24 mm height, Premier Lab Supply Inc., Port St. Lucie, FL, USA) capped with a 4 μm propylene film (model 240255, 63 mm diameter, Premier Lab Supply Inc., Port St. Lucie, FL, USA). The container was placed in the window of the laboratory stand, the analyzer was attached to this stand, each sample was scanned in triplicate in each of the mining and soil modes, and the average elemental readings for each mode were used thereafter. The analysis time for each scan was 90 s for the soil mode and 120 s for the mining mode.

2.2. Samples

The training set of samples consisted of organic amendments (composts, sewage sludges, and organic fertilizers) provided by the MARSEP program, which is part of the Wageningen Evaluating Programmes for Analytical Laboratories (WEPAL) [26]. Samples corresponding to the 1 and 3 quarterly periods of 2011 to 2019 (30 different samples) were included. The samples were of the following types: compost (14 samples), sewage sludge (11), and organic fertilizer (5). The samples came from different countries: Belgium (5), Netherlands (3), Switzerland (18), Philippines (1), and the United Kingdom (2). Samples were dried and finely crushed powders. These dry test samples have been shown to be stable over a number of years when stored at room temperature. The descriptive statistics (mean, minimum, and maximum values) for the aqua-regia-extractable contents of the selected elements in the three types of organic amendments are shown in Table 1.
The reference material SdAR-M2, which corresponded to a metal-rich sediment produced by the US Geological Survey [27], was used to assess the accuracy and stability of the pXRF instrument. For the verification check to be acceptable, it was considered that the measured value for each target analyte in these samples should be within ±20% relative difference (RD) of the true value [28]. The results for the readings taken seven times during the course of the work are shown in Table 2. As indicated by the RD values, the precision was very good for Pb(s), Ca(m), and Fe(m), and good for the rest of the elements considered, except for Ti(s) and Al(m), which were estimated by default, and S(s) and P(m), which were estimated in excess. The difference between the maximum and minimum values (range) showed great stability of the instrument during the study for Cu(s), Mn(s), Pb(s), Zn(s), Zr(s), Ca(s), Fe(m), and Si(m). The readings of K(s), Ti(s), Al(m), and P(m) varied by more than 10% with a maximum range of 20% for S(s).

2.3. Statistical Data Analysis

Discriminant analysis was carried out to build a predictive model for group membership by considering the type of amendment (compost, sewage sludge, and organic fertilizer) as the grouping variable. The model was composed of a discriminant function (or, for more than two groups, a set of discriminant functions) based on linear combinations of the predictor variables that provided the best discrimination between the groups.
For each amendment type, multiple linear regression analysis was used to predict the aqua-regia-extractable contents of the target elements (As, Cd, Cr, Hg, Ni, and Se) reported by the MARSEP program (dependent variable was called X(ae), where X is the chemical element) from independent (input) variables, which were the soil (Y(s)) or mining (Y(m)) readings of the pXRF instrument (corresponding to Y elements for which readings above the LOD were obtained). The first adjustment consisted of a single linear regression equation using an element for which a higher Pearson coefficient was obtained for the X(ae)–Y(s or m) relationship. After this first adjustment, the residuals were calculated and their correlations with other elemental readings were determined. The parameters with a higher and significant Pearson coefficient were then added one by one into the equation, and the process was repeated to look for additional significant independent variables. The new variables introduced did not present a correlation with those previously introduced to avoid collinearity. The calibration obtained in this way was considered quantitatively acceptable for a specific analyte if the correlation coefficient was greater than r = 0.98 [28]. The regression equations were calculated without the transformation of the data. The studentized deleted residuals from the compost and sewage sludge equations were obtained and plotted. These residuals referred to cases that would have large residuals if the model was estimated without the respective cases. These were cases that were not well accounted for by the independent variables.
The predicted values, X(predicted), obtained from the regression equations for the three types of amendments were then combined into one set of data and then compared with the real values, X(ae), by considering the whole set as confirmatory data. Since the confirmatory data sets expanded by more than an order of magnitude, the data were log-transformed for the comparison using a paired samples t-test and a 95% confidence probability in accordance with themethod of the Environmental Protection Agency of the United States (EPA) [28]. A few negative predicted concentrations were discarded for the t-test. The determination coefficient (R2) of the least-squares linear regression analysis between the predicted and reported X(ae) values was used to check the performance of the adjustments obtained.
The EPA method for soils [28] indicated that the R2 coefficient should be 0.5 or greater for the pXRF data to be considered screening level data. If the R2 is 0.8 or higher, the data could potentially meet definitive level data criteria.
The relative difference (RD), that is the difference as a percentage between the predicted and actual values, was calculated for the individual results of each sample.
All statistical analyses were carried out with IBM© SPSS© Statistics version 25 (SPSS, Chicago, IL, USA).

3. Results

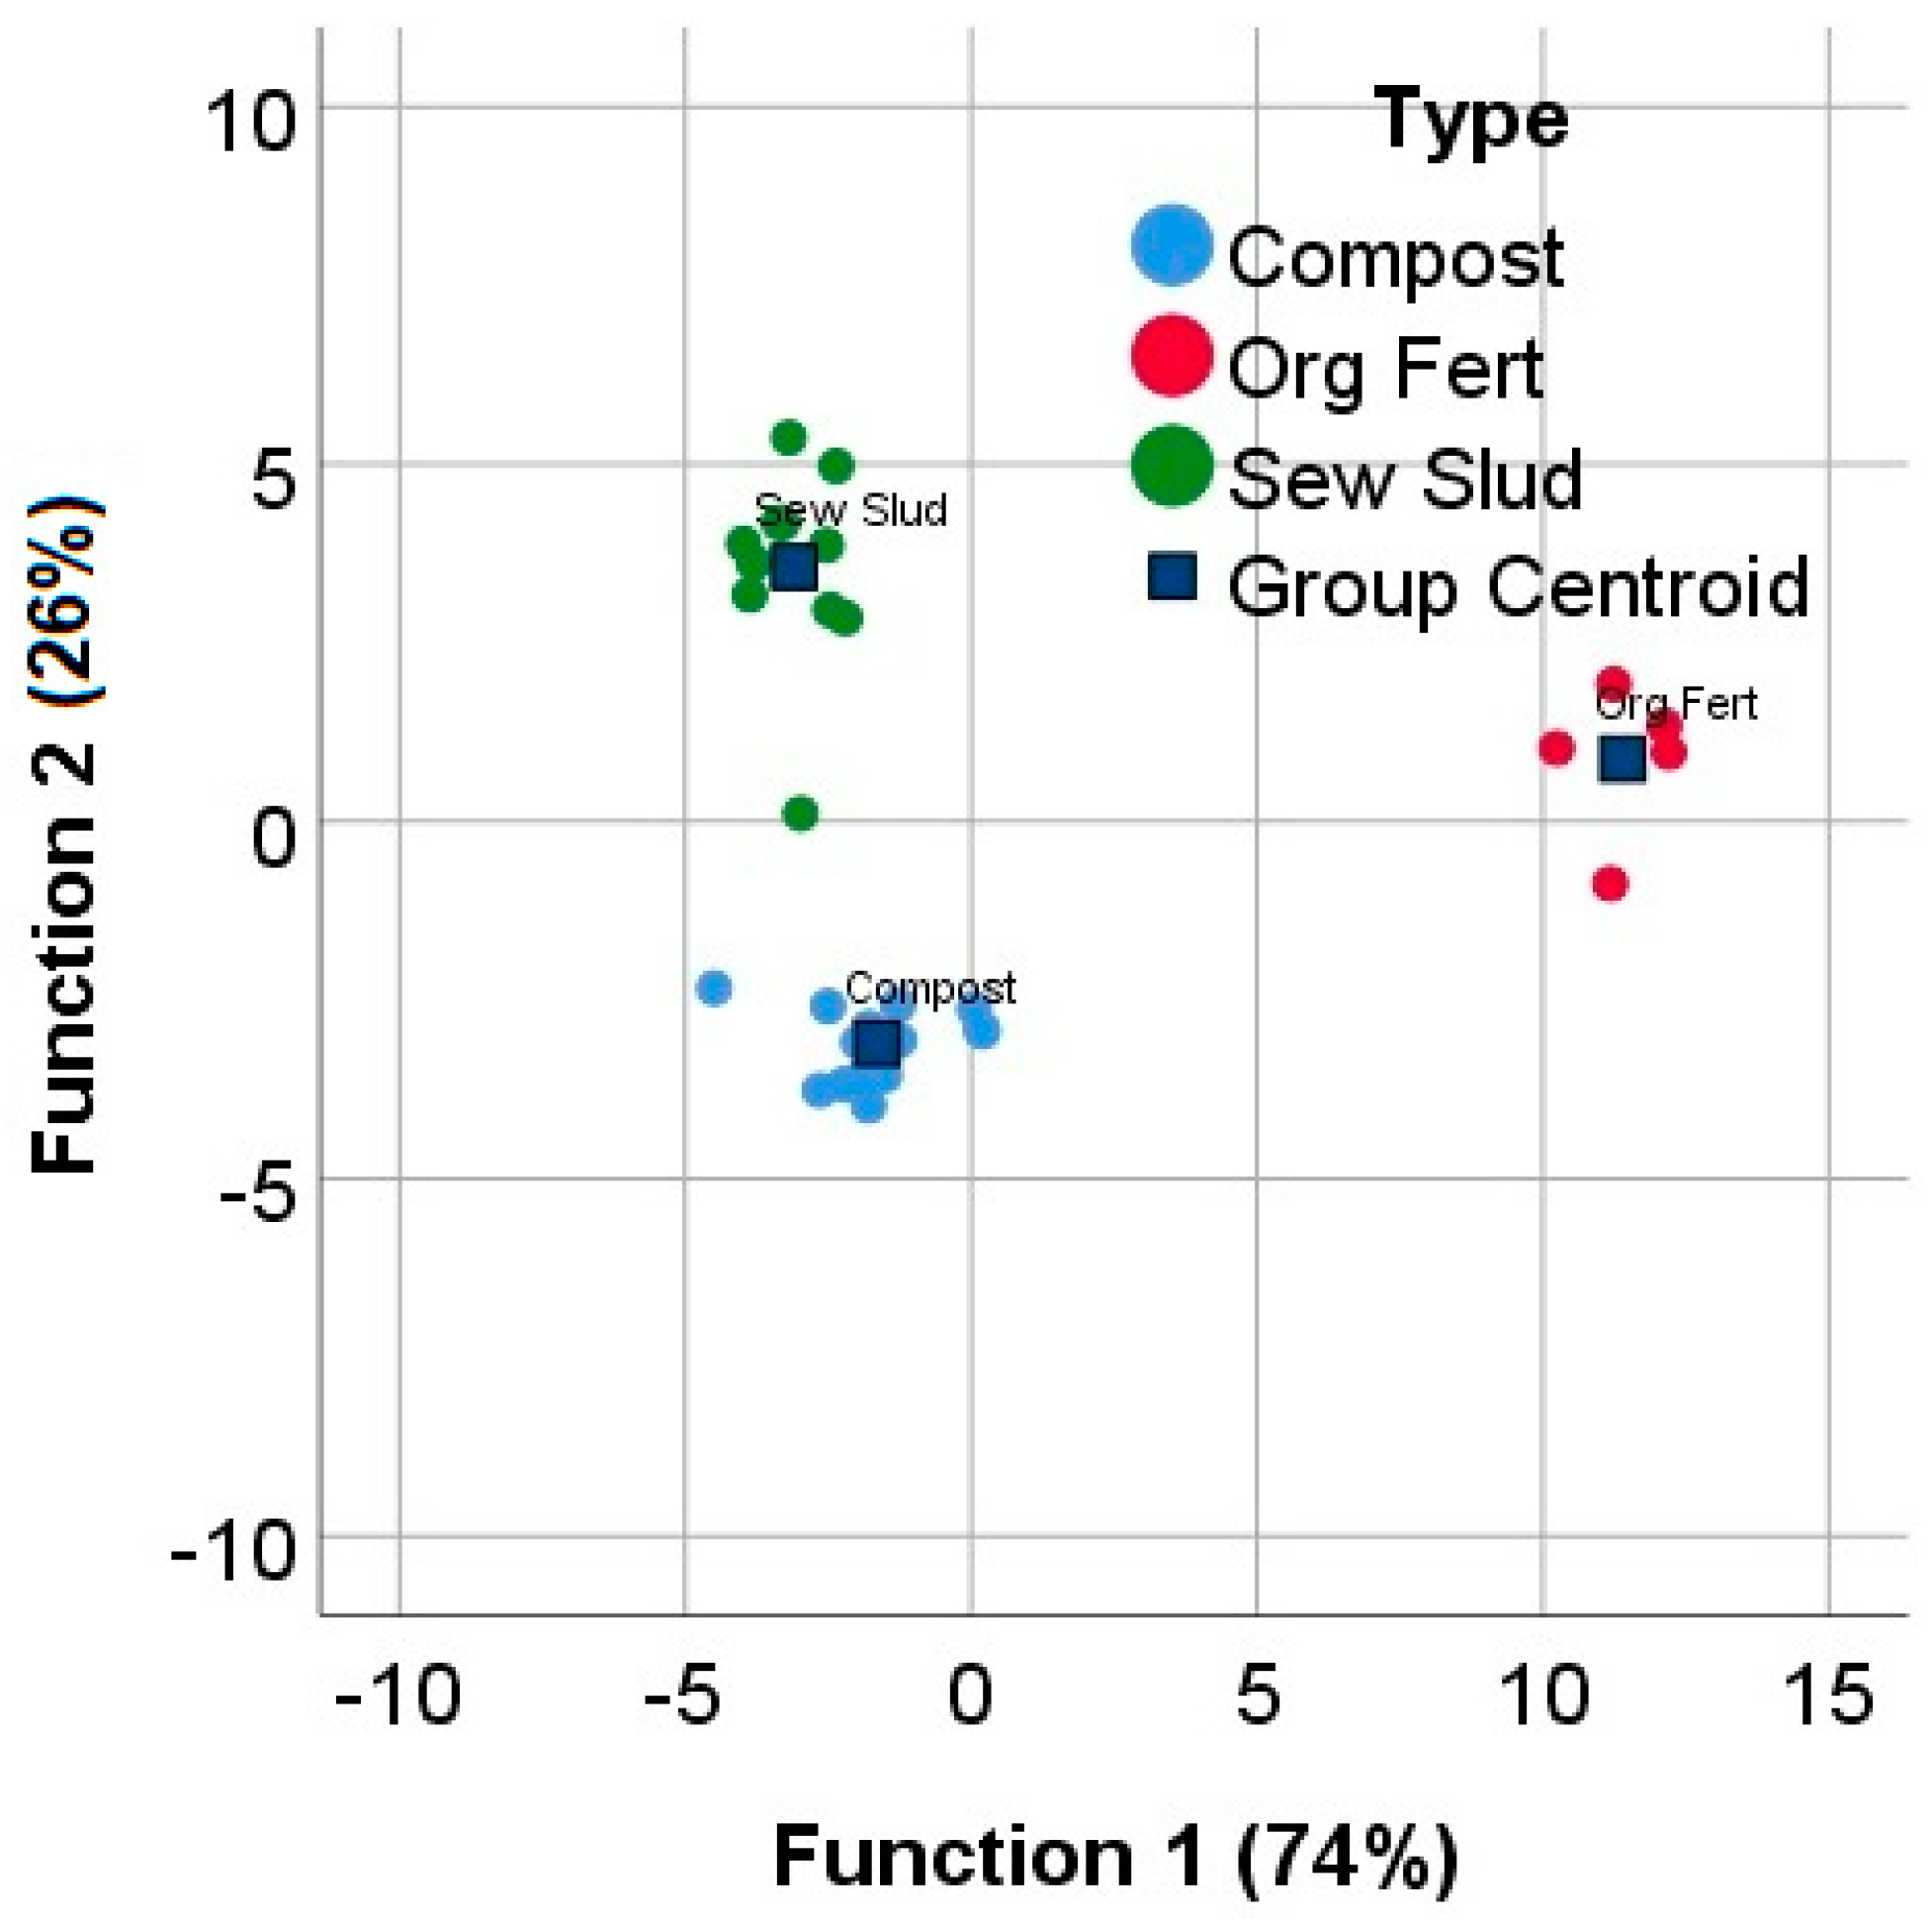
3.1. Discriminant Analysis

The result of the discriminant analysis is shown in Figure 1. Discriminant function 1, which explained 74% of the variance, separated the amendment types, but types compost and sewage sludge were close along this axis. The standardized coefficients (data not shown) for this function indicated that the readings of Zn(s), Ca(m), Si(m), Bal(m) (i.e., organic matter content), and Zr(s) were responsible for the discriminant effect. Discriminant function 2, which explained 26% of the variance, mainly separated the amendment types compost and sewage sludge. The standardized coefficients for this function indicated a greater discriminant ability for Bal(m), Ca(m), P(m), and Si(m). The predicted group membership from the discriminant analysis coincided at 97% with the actual membership of each amendment type; therefore, for the purposes of calculating multiple linear regressions between the parameters that follow, these were performed separately for each of the types compost, sewage sludge, and organic fertilizer.

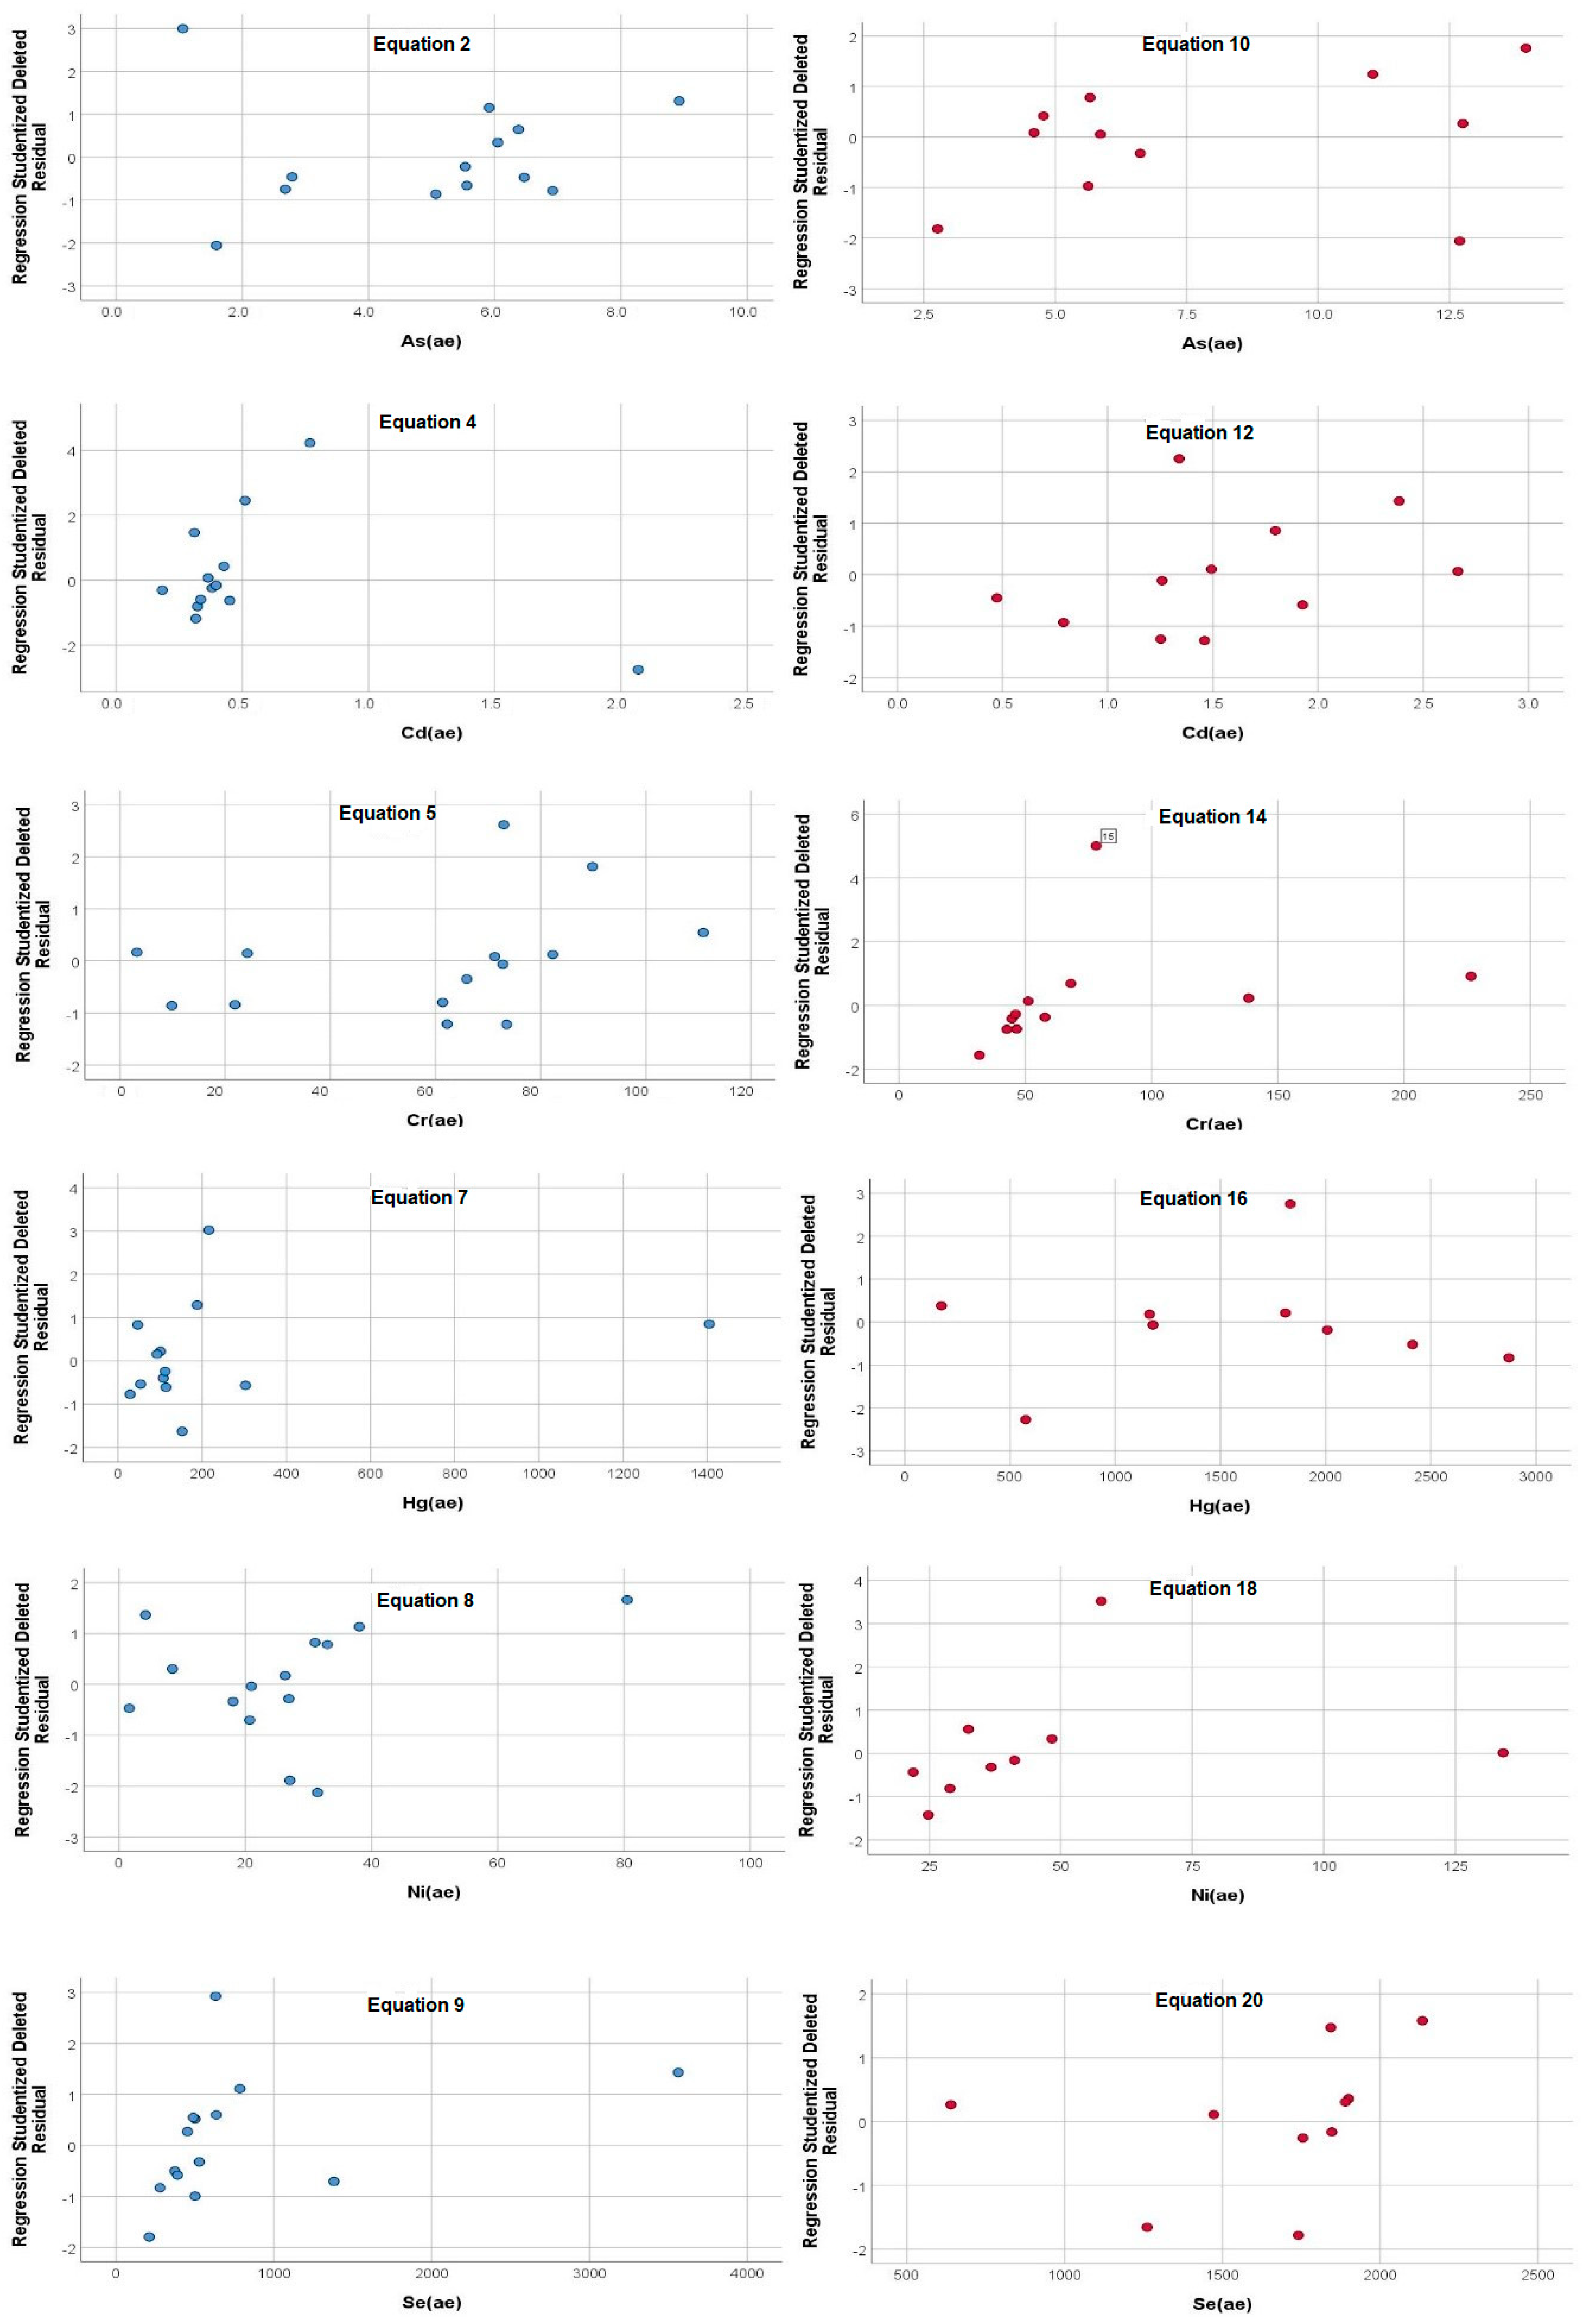
3.2. Linear Relationships in Compost Samples

The multiple linear equations obtained for the target elements in compost-type samples are:
[ As ( pred ) ] = 0.407 + 0.0374 [ Si ( m ) ] + 0.0233 [ Zr ( s ) ] ,  
[ As ( pred ) ] = 0.245 + 0.0381 [ Si ( m ) ] + 0.0157 [ Zr ( s ) ] + 0.0102 [ Pb ( s ) ] ,
[ Cd ( pred ) ] = 0.0298 + 0.00162 [ Zn ( s ) ] + 0.00170 [ Zr ( s ) ] ,
[ Cd ( pred ) ] = 0.0222 + 0.00166 [ Zn ( s ) ] + 0.00180 [ Zr ( s ) ] 0.0000654 [ Mn ( s ) ] ,
[ Cr ( pred ) ] = 3.13 + 2.925 [ Fe ( m ) ] + 1.102 [ K ( s ) ] 1.206 [ S ( s ) ] ,
[ Hg ( pred ) ] = 73.3 + 1.171 [ Zn ( s ) ] ,
[ Hg ( pred ) ] = 29.2 + 1.213 [ Zn ( s ) ] 0.171 [ Mn ( s ) ] 3.323 [ S ( s ) ] ,
[ Ni ( pred ) ] = 42.7 + 2.259 [ Fe ( m ) ] + 0.442 [ Bal ( m ) ] ,  
[ Se ( pred ) ] = 444 + 2.877 [ Zn ( s ) ] 4.628 [ Zr ( s ) ] ,
Their statistics are shown in Table 3. The correlation coefficients of aqua-regia-soluble elemental concentrations, X(ae), and the pXRF readings are shown as supplementary material (Table S1). The Si(m) reading was used for the first linear adjustment factor of As(ae) (Equations (1) and (2)); the Zn(s) was used for modelling Cd(ae) (Equations (3) and (4)), Hg(ae) (Equations (6) and (7)), and Se(ae) (Equation (9)); and the Fe(m) was used for Cr(ae) (Equation (5)) and Ni(ae) (Equation (8)). These predictors showed the highest correlation coefficient (Table S1) and valid readings were obtained for all compost samples (N = 14). In the case of As, after the first linear adjustment, the residuals were successively correlated with the Zr(s) and Pb(s) readings, which were then introduced by obtaining the Equations (1) and (2). The best fit (r = 0.980, Table 3) was obtained with Equation (2), and hence it was used for the prediction of As, but only in n = 13 out of the 14 compost samples due to the lack of a Pb(s) datum in one of the samples. For the remaining sample, Equation (1) was used. It should be noted that the additional terms that are introduced into the equations did not necessarily correlate initially with the target element; in the case of As, Pb(s) did not show an initial correlation with As(ae) (Table S1), although its coefficient in Equation (2) was statistically significant (p = 0.029, Table 3).
In the case of Cd, good fittings were obtained with Zn(s) and Zr(s) (Equation (3), used for n = 1 sample, r = 0.989) and Mn(s) (Equation (4) for n = 13 samples, r = 0.996). In the case of Cr, the best fitting was obtained with Fe(m), K(s), and S(s) (Equation (5), r = 0.975). Despite the fact that the Cr(s) readings could be obtained in 10 compost samples, the correlation with Cr(ae) of these readings (r = 0.764) was of lesser magnitude than the fitting obtained from Equation (5) (r = 0.975). In the case of Hg, a mediocre fitting (r = 0.949) was obtained with Zn(s) (Equation (6)), but it was improved (r = 0.995) by including Mn(s) and S(s) (Equation (7)). Ni was modelled with Fe(m) and Bal(m) (Equation (8), r = 0.977)). Selenium was modelled with Zn(s) and Zr(s) (Equation (9), r = 0.981). The elements Cd and Se were modeled with the same predictors Zn(s) and Zr(s) in Equations (3) and (9), which agreed with the significant correlation observed between Cd(ae) and Se(ae) in the compost samples (r = 0.918, n = 14). All the terms included in the fitting equations were statistically significant (p-values < 0.05). In general, the equations for compost can be considered quantitatively acceptable for calibration (r > 0.98) [28].
The studentized deleted residuals for several compost equations are shown in Figure 2. No outliers were observed in these plots, except one Cd datum. Furthermore, the absence of a pattern in the distribution of residues in the plots corresponding to compost in Figure 2 indicates that there was likely no significant bias affecting the equations.

3.3. Linear Relationships in Sewage Sludge Samples

The multiple linear equations obtained for the target elements in the sewage sludge samples are:
[ As ( pred ) ] = 2.297 + 0.0427 [ Pb ( s ) ] ,
[ As ( pred ) ] = 5.06 + 0.970 [ As ( s ) ] ,
[ Cd ( pred ) ] = 0.089 + 0.00146 [ Zn ( s ) ] + 0.00321 [ Pb ( s ) ] ,
[ Cr ( pred ) ] = 0.747 [ Cr ( s ) ] ,
[ Cr ( pred ) ] = 54.2 + 0.0299 [ Cl ( m ) ] + 0.0345 [ Ti ( s ) ] ,  
[ Hg ( pred ) ] = 804 + 7.85 [ Pb ( s ) ] 46.1 [ K ( s ) ] ,
[ Hg ( pred ) ] = 235 + 6.75 [ Pb ( s ) ] 44.0 [ K ( s ) ] + 45.3 [ Al ( m ) ] ,
[ Ni ( pred ) ] = 34.7 + 0.406 [ Ti ( s ) ] 0.468   [ Fe ( m ) ] ,
[ Ni ( pred ) ] = 26.9 + 4.81 [ Al ( m ) ] ,
[ Se ( pred ) ] = 658 + 52.2 [ P ( m ) ] 5.79   [ Fe ( m ) ] ,
[ Se ( pred ) ] = 567 + 55.9 [ P ( m ) ] 1.91 [ Ba ( s ) ] ,
Their statistics are shown in Table 4. The correlation coefficients of the aqua-regia-soluble elemental concentrations, X(ae), and the pXRF readings are shown as supplementary material (Table S2). The Pb(s) readings showed a high correlation with As(ae) and Hg(ae), and thus it was used as the first factor for the calculation of the linear equations of these elements (Equation (10), for As and Equations (15) and (16) for Hg). Successive improvements in the Hg equations were obtained when including the K(s) and Al(m) readings. Zn(s) showed the highest correlation coefficient with Cd(ae) and it was used for modeling Cd (Equation (12)). An additional Pb(s) term was also used in the Equation (12). The readings Cl(m) correlated with Cr(ae) in all 11 sewage sludge samples (Table S2) and was used in Equation (14) with a second significant Ti(s) coefficient. Ti(s) was also correlated with Ni(ae) (Equation (17)) but the Al(m) coefficient was better in nine sewage sludge samples and Equation (18) was also obtained for Ni. The Fe(m) readings further improved Equation (17). The P(m) readings showed a correlation with Se(ae) and Equations (19) and (20) used P(m). The second coefficients in these equations were Fe(m) and Ba(s). In a certain number of samples, significant and high correlations were observed for the As(s) and Cr(s) readings with the corresponding values of As(ae) and Cr(ae) such that direct relationships were fitted between these parameters (Equations (11) and (13)) when the corresponding pXRF readings were above the LOD. All the element coefficients included in the fitting equations were statistically significant (p-values < 0.05). In general, the equations for sludge cannot be considered quantitatively acceptable for calibration (r < 0.98) [28]. The studentized deleted residuals for several sewage sludge equations are shown in Figure 2. No outliers were observed in these plots except one Cr (no. 15) and one Ni data. Furthermore, the absence of a pattern in the distribution of residuals in the corresponding plots in Figure 2 indicates that there was likely no significant bias affecting the equations.

3.4. Linear Relationships in Organic Fertiliser Samples

The multiple linear equations obtained for the target elements in organic fertilizers are:
[ As ( pred ) ] = 1.106 + 1.464 [ Fe ( m ) ] ,
[ As ( pred ) ] = 0.026 + 0.146 [ Zr ( s ) ] ,
[ Cd ( pred ) ] = 0.028 + 0.121 [ Si ( m ) ] ,
[ Hg ( pred ) ] = 17.1 + 0.00237 [ Cl ( m ) ] 0.187 [ Ca ( m ) ] ,
[ Ni ( pred ) ] = 4.17 + 5.89 [ Fe ( m ) ] ,
[ Ni ( pred ) ] = 0.7 + 0.641 [ Zr ( s ) ] ,
[ Se ( pred ) ] = 380 + 56.1 [ Fe ( m ) ] ,
Their statistics are shown in Table 5. Correlation coefficients of aqua-regia-soluble elemental concentrations, X(ae), and the pXRF readings for the organic fertilizers are shown as supplementary material (Table S3). For the organic fertilizers, the best correlation of As(ae) was with Zr(s) in four out of the five samples and it was used in Equation (22). Fe(m) also resulted in a mediocre correlation and was used in Equation (21) for the prediction of the remaining sample. Equations (21) and (22) could not be improved with additional terms. Cd(ae) correlated with Si(m) and their relationship corresponded to Equation (23). There was no correlation of Cr(ae) with any of the elements read using pXRF. Hence, Equation (13) obtained for sewage sludge samples was used for one organic fertilizer sample for which the Cr(s) reading was above LOD. The RD for this calculated value was 17.5%. Hg(ae) correlated with Cl(m) and the corresponding formula was Equation (24), which included an additional Ca(m) term. Ni(ae) correlated with both Fe(m) in Equation (25) and Zr(s) in Equation (26) for four samples. Se(ae) was predicted using Fe(m) in Equation (27). The coefficients of the element terms were significant (p < 0.05) in all the adjustment equations. The equations used for most of the organic fertilizer samples can be considered quantitatively acceptable for calibration (r > 0.98) [28].

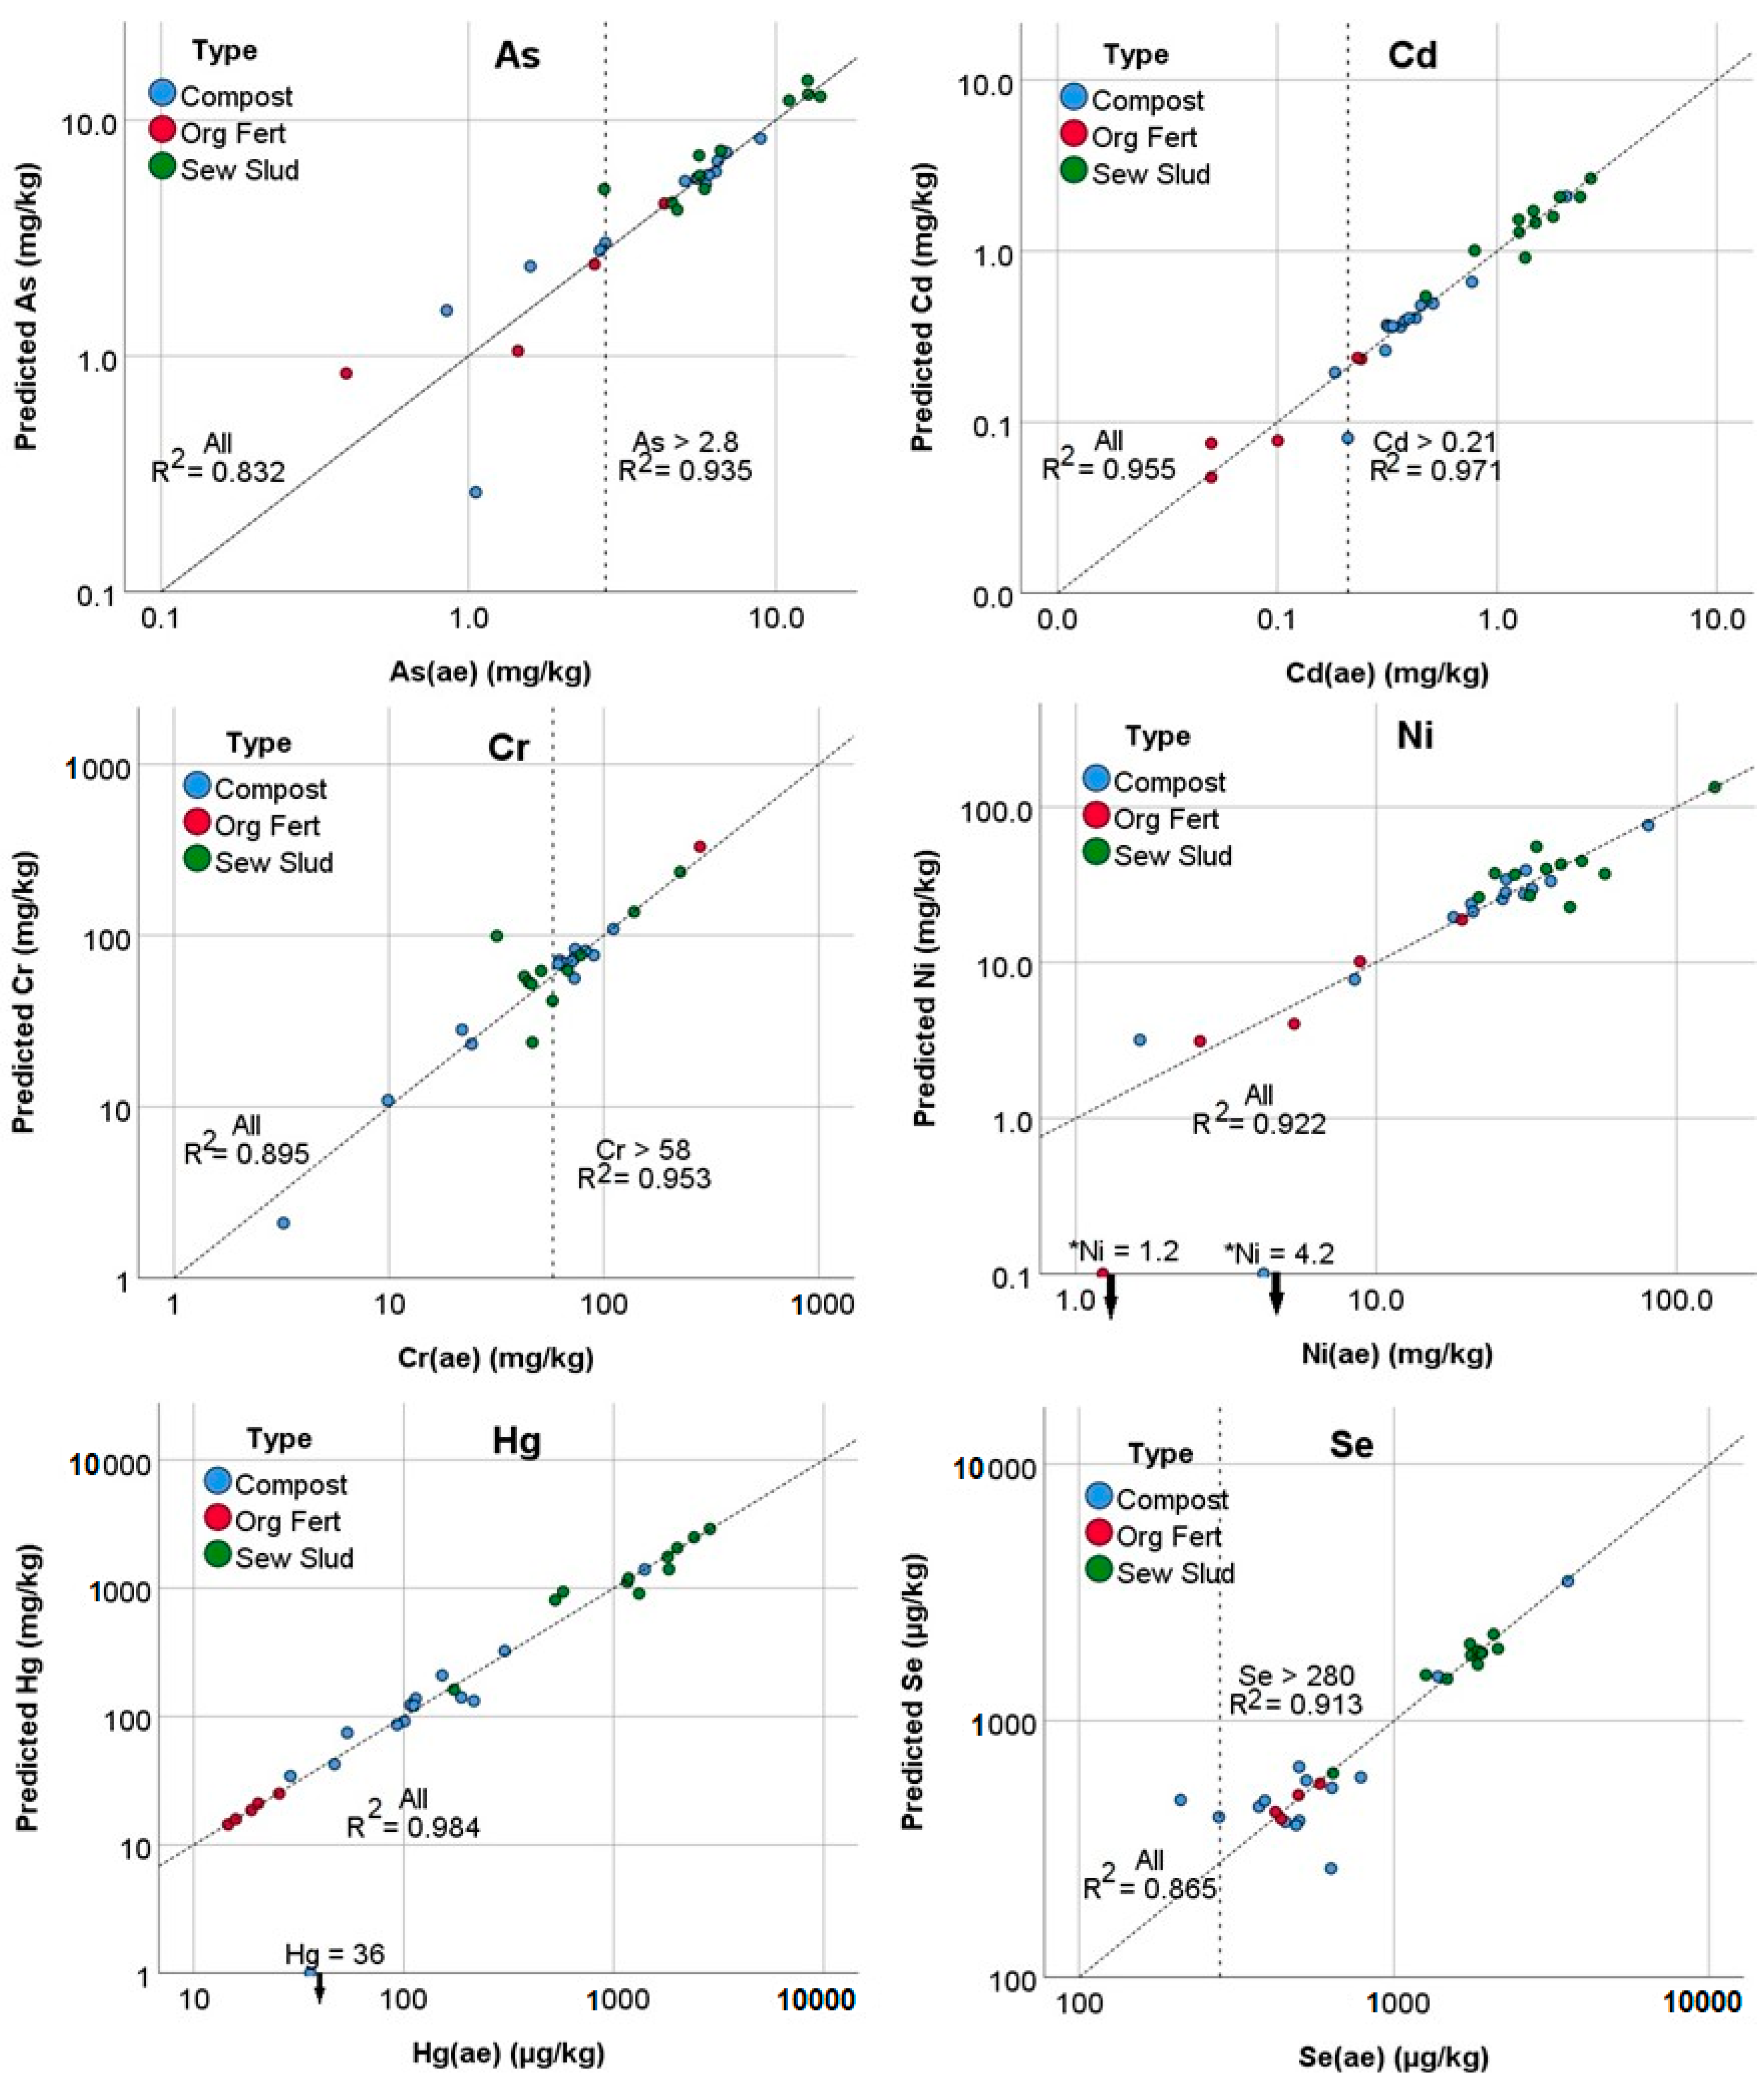
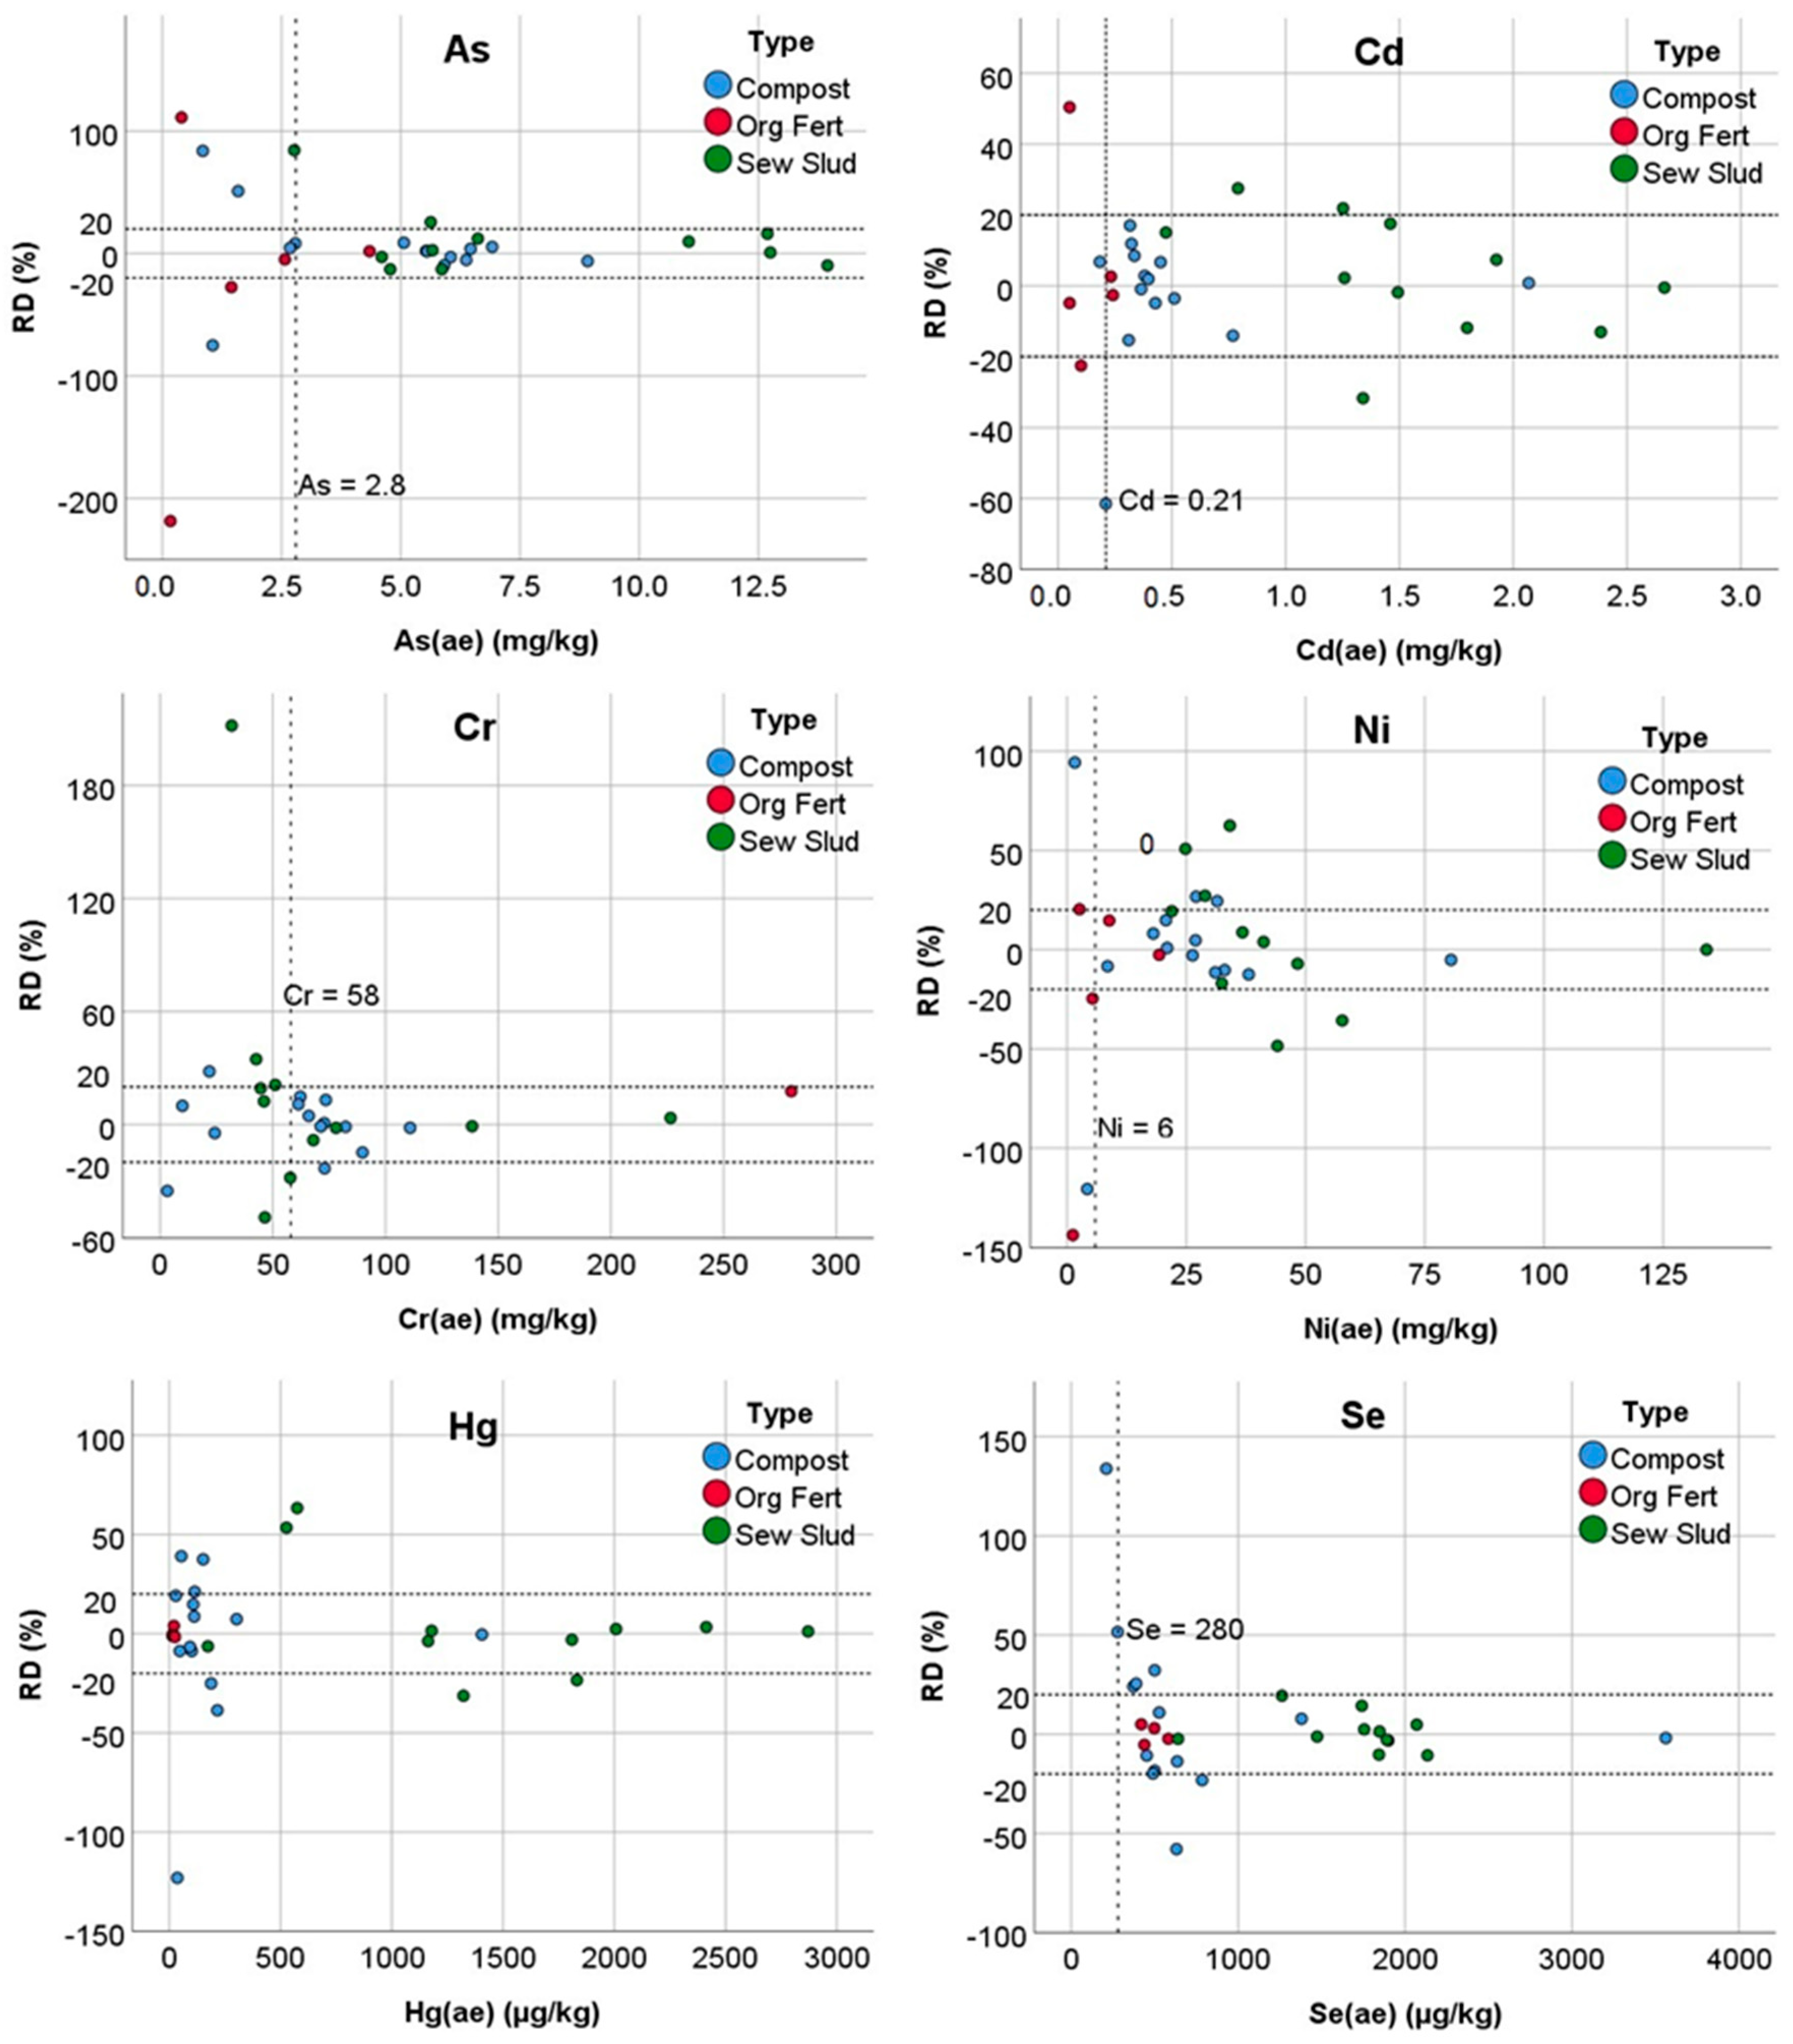
3.5. Combined Relationships for All Sample Types

The predicted values for each element, X(pred), obtained for the three amendment types with the equations in Table 3, Table 4 and Table 5 are plotted in Figure 3 (in log scale) against each corresponding “true” aqua regia concentration, X(ae). The R2 coefficients are shown on each plot. The linear equations (data not shown) presented a very small value for the 0 intersections and the slopes were very close to 1. This can be seen by the proximity of points to the 1:1 line that is represented in the plots. When all the data were considered, the values of R2 ranged between 0.83 in the case of As to 0.98 in the case of Hg.
Figure 4 shows the RD values for all the samples. In general, the RD values were lower than 20%, except for a few samples with lower concentrations of the elements of concern. The number of samples for which RD was greater than 20% was: 7 for As, 6 for Cd, 7 for Cr, 11 for Ni, 9 for Hg, and 7 for Se. The number of samples for which RD was greater than 50% was: 5 for As, 1 for Cd, 1 for Cr, 4 for Ni, 3 for Hg, and 2 for Se.
When some of the samples with low concentrations (As < 2.8 mg kg−1, Cd < 0.21 mg kg−1, Cr < 58 mg kg−1, Se < 280 µg kg−1) were discarded, the R2 values improved and were higher than 0.91 in all cases (Figure 3).

4. Discussion

4.1. The Meaning of the Equations

In general, the fitting equations obtained (Table 3, Table 4 and Table 5) required few elementary terms (11 equations with one element term, 11 equations with two terms, and 5 equations with three terms) to obtain satisfactory approximations for the target elements (average r = 0.959 for all the equations).
The element most involved the most times in the equations in Table 3, Table 4 and Table 5 was Fe(m). It was present as the most important term in the fitting equations for Cr and Ni in compost, as a negative secondary term for Ni and Se in sludges, and as the most important term for As, Ni, and Se in organic fertilizers. Oxides and hydroxides of Fe and Mn are relatively common constituents in soils and they are closely related to trace metal behavior [29,30]. Tella et al. [23] observed a Cr–Ni–Fe relationship of geogenic origin when studying 17 compost samples of varied sources using PCA. Thus, the significant influence of Fe could be due to the variable proportion of soil mineral particles in the different samples, which would greatly affect the concentrations of the target trace elements.
The second most included element in the equations was Zr(m). It influenced As, Cd, and Se in compost and As and Ni in organic fertilizers. Zirconium occurs in several complex silicates that are frequently associated with Ti and Hf minerals. It does not accumulate in plants (levels in food plants vary from 0.005 to 2.6 mg kg−1), but the crustal abundance of Zr varies from 100 to 200 mg kg−1 [29]. Therefore, this element is also an indicator of the contribution of soil or mineral material in each sample. Anjos et al. [31] also suggested that the presence of Zr (as well as Fe, Ca, Ti, Rb, Sr) in samples of organic compost suggests that the compost was mixed into the soil in the composting process. The relevance of Fe and Zr is not only because they are a clue of the presence of soil in the samples, but it may also be related to their low LOD (see Anjos et al. [31] for LODs), allowing for good precision and time stability in their pXRF measurements (see Table 2).
The Si(m) readings are included for As in the compost equations and for Cd in the organic fertilizer equations. Arsenic is abundant in argillaceous sediments [29]; hence, its influence is likely related to the presence of soil clay particles in the amendments.
The readings of Ti(s) are included in Cr and Ni equations for sludges. As indicated before, Ti is also indicative of the presence of soil particles because it is an abundant element in the Earth’s crust. Tella et al. [23] defined the Cr-Ni grouping as being of geogenic origin. Nevertheless, as Ti is used in many industrial applications, it cannot be ruled out that the Ti–Cr–Ni relationship in sludge may have another cause. Sager [22] indicated that in Austrian composts, a factor including Ni-Cr might have a common source, namely, the abrasion of tools. The Cr and Ni elements could also come from plastic films, textiles, footwear, paper, cardboard, glass, and packaging waste that can appear in municipal solid waste [32].
The elements Zn and Pb showed wide representation as they are the main predictors of As, Cd, Hg, and Se in compost, and for As, Cd, and Hg in sludge. All these elements (Zn, Pb, As, Cd, Hg, and Se) are commonly considered as being of anthropogenic origin [33] and generally accumulate in the fine size fractions [23]. The concentrations of Zn and Pb in the amendments (Table 1) were generally higher than their LOD for pXRF (<10 mg kg−1 [31]) such that these elements, when measured with good precision, can be considered good predictors.
Phosphorus appeared as a predictor of Se in sludge. In a study covering 68 rock phosphates and 162 P-containing fertilizers sold in Germany, Kratz et al. [34] found up to 12.1 mg kg−1 of Se. Kabata-Pendias and Pendias [29] indicated that there was up to 25 mg Se kg−1 in P fertilizers. Therefore, although P salts are usually used in wastewater treatment, the P–Se ratio may be indicative of an agricultural origin of both elements.
Predictive elements K, S, Ca, Cl, Al, Bal (i.e., organic matter), Mn, and Ba generally appeared as a second or third term in the equations. Therefore, they exercised a lower level of influence. These elements are major (K, S, Ca, Al) or common (Mn, Ba) constituents of the soil/plant system and phenomena, such as complexation, edaphic characteristics, redox conditions in the soil or during composting processes, and the treatment process of wastewater in the case of sludge, could be the causes of the relationships. For volatile elements, such as Hg and Se, atmospheric transport and deposition would also be involved. To explain their effects on the target elements, additional studies would be required.
After taking into account the small number of cases (5) used, the relationships found in the case of organic fertilizers should be taken with caution.
For compost and sludge, it should be noted that several equations included any of the elements of anthropogenic origin as the first predictor term (Equations (6), (10), and (12)), and in some other equations, any of the elements of edaphic or geogenic significance was added as a second term. (Equations (3), (4), (7), (9), (15), and (16)). Taking into account that the (standardized) coefficients of the first terms were always higher than those of the following terms, this indicates the importance of anthropogenic contamination in these matrices (compost and sewage sludge) and the common origin for a significant fraction of the elements included in these equations (Cd, Hg, Se, As, Zn, Pb). However, the crustal elements (Zr, Mn, S, K, Al) that represent the contribution of the edaphic or geological environment, although to a lesser extent, had a significant effect on the concentration of the objective elements (Cd, Hg, Se).

4.2. Confirmatory Analysis

For an empirical calibration to be acceptable, the regression equation for a specific analyte should have a correlation coefficient of r ≥ 0.98 [28]. Eleven out of the 27 equations given in Table 3, Table 4 and Table 5 met this requirement. Additionally, the proxies obtained (Figure 3) for Cd, Ni, and Hg indicated that the predicted data were of high quality (definitive, R2 > 0.9) while those for As, Cr, and Se can be considered to be screening-level data (R2 > 0.5) according to the EPA criteria [28]. In Figure 2 and Figure 3, it can be observed that the highest RD values were observed for the smallest concentrations of the target elements. For the reference samples, the EPA method [28] indicated that the measured value for each target analyte should be within ±20% RD of the true value to be acceptable. This value (20%) is considered as the limit of adequate precision of the individual results.
Discarding the data below the limits indicated in Figure 3 (As < 2.8 mg kg−1, Cd < 0.21 mg kg−1, Cr < 58 mg kg−1, Se < 280 µg kg−1), the remaining predicted data reached the R2 criteria of definitive (high-quality) data for all the elements. These cutoff limits have been selected approximately using visual observation of the plots in Figure 3. The limits could be considered as an approximation to the quantification limits (LOQ) of the adjustments used.
For the elements As, Cd, Ni, and Cr, most of the organic fertilizer samples were found among the discarded samples. The sample with high RD values was the one with the lowest concentrations of all the elements considered (Figure 4). However, the predictions of Hg and Se values in organic fertilizers were satisfactory, despite the low number of samples of organic fertilizers used in the calibration and the low concentration of these elements in these samples. In the case of compost samples, in general, the predictions were good and only a higher magnitude RD was observed in Figure 4 for the two to three samples that presented the lowest concentrations of the target elements. In the sludge type, a significant RD (>50%) was found for the Ni and Hg predicted contents of several samples. The fit of the equations used for sludge (Table 4) can be improved and it may be necessary to have a larger number and more geographic diversity of samples for calibration such that additional terms may be included in the equations.
The limits established by European legislation [35] for these contaminants in a growing medium are 1.5 mg Cd kg−1, 1000 µg Hg kg−1, 50 mg Ni kg−1, and 40 mg inorganic As kg−1. As can be seen in Figure 2, these limits are included (for Cd, Hg, Ni) or are higher (for As) than the ranges in which these elements have been determined. Furthermore, the precision of the predictions (Figure 4) above the indicated values was, in general, satisfactory. Only a few samples of sewage sludge, a type for which much higher statutory limits apply [36], exceeded the RD limit of 20%. This means that the pXRF technique with the indicated proxies could be valid to test the compliance of these types of products, at least for quality control purposes in the field or the factory applications. Even an analyte with more than 20% RD may be used, as long as its linearity is satisfactory, as it could allow for properly ranking samples and detecting outliers [37].

5. Conclusions

This study highlights the potential of portable XRF analyzers for a fast, cheap, and reliable analysis of heavy metals and trace elements in organic amendments (composts, sewage sludges, and organic fertilizers), even if these elements cannot be directly determined by the analyzer due to them being below their limits of detection. Using a chemometric procedure based on multiple and simple linear equations, the elements As, Cd, Cr, Ni, Hg, and Se were predicted quantitatively. Predictive linear equations were created that included as the most important terms the readings obtained with pXRF for a few elements to which a different origin or source can be attributed. The elements Fe, Si, Ti, Cl, and Zr indicate a geological or pedogenetic origin; the elements Zn and Pb signify contamination of an anthropogenic origin; and the element P denotes an agricultural/anthropogenic influence. The readings of the elements Al, K, Ca, S, Mn, and Ba were also present in the equations as secondary factors. The degree of importance of each factor was dependent on the predicted target element as well as on the type of amendment (compost, sewage sludge, organic fertilizer) in question.
Considering that the correction factors only made use of the pXRF analyzer readings, and that the scans required a very short analysis time (3.5 min), the proposed analytical approach could be usable in field conditions without requiring other additional parameters that must be obtained in the laboratory.
Although the calibration equations obtained in this study were obtained with a well-characterized set of samples of compost, sewage sludge, and organic fertilizers from various European countries, their universal validity may be questionable. It could be possible that the factors found or their relative weights were different depending on the materials present in the amendments, the regional geological or edaphic characteristics, and the possible sources of anthropogenic contamination. It would be necessary to obtain specific calibrations for other types of amendments, for example, manure, and this would be possible as long as a homogeneous group could be separated. For samples of amendments of an unknown type, we understand that it would be feasible to first apply a process to classify the sample according to its analytical results (discriminant analysis or similar) and then apply the corresponding calibration. In addition, specific (locally or regionally adapted) and interlaboratory calibrations should be obtained to assess the generalization of the relationships found or to find those specifically adapted. However, although the results presented here show a high degree of consistency with basic knowledge about organic amendments, soil science, and potential sources of contaminants, a more detailed analysis of the statistical quality of the forecast equations is still needed. Specifically, subsequent calibration studies should be carried out that expand the number or types of sample to corroborate the results of this work, taking into account the compositional nature of the data [38]. The cross-checking of equipment from different brands and suppliers is also necessary. In any case, the proposed analytical approach would be very useful for quality control and regulatory compliance tasks in waste treatment facilities (composting plants, wastewater treatment plants) or the manufacturing of organic amendments, avoiding much more tedious routine analytical procedures. In these situations, we believe that the pXRF technique represents a valuable decision support tool aimed at proper environmental management.

Supplementary Materials

The following are available online at https://www.mdpi.com/2076-3417/10/17/5726/s1: Correlation coefficients of aqua-regia-soluble elemental concentrations, X(ae), and readings (methods soil (s) and mining (m)) from portable X-ray fluorescence (pXRF) spectrometry in compost samples (Table S1), in sewage sludge samples (Table S2), and in organic fertilizer samples (Table S3).

Author Contributions

Conceptualization, R.L.-N.; methodology, R.L.-N.; formal analysis, F.A.-P.; writing—review and editing, R.L.-N.; resources, P.B.-D. All authors have read and agreed to the published version of the manuscript.

Funding

This research was funded by the Consejo Superior de Investigaciones Científicas (CSIC) of Spain, grant number COOPB20365, 2019.

Acknowledgments

To WEPAL for allowing the use of the average contents.

Conflicts of Interest

The authors declare no conflict of interest.

References

  1. Vanhoof, C.; Bacon, J.R.; Fittschen, U.E.A.; Vincze, L. 2020 atomic spectrometry update–A review of advances in X-ray fluorescence spectrometry and its special applications. J. Anal. At. Spectrom. 2020. [Google Scholar] [CrossRef]
  2. O’Rourke, S.M.; Stockmann, U.; Holden, N.M.; McBratney, A.B.; Minasny, B. An assessment of model averaging to improve predictive power of portable vis-NIR and XRF for the determination of agronomic soil properties. Geoderma 2016, 279, 31–44. [Google Scholar] [CrossRef]
  3. West, M.; Ellis, A.T.; Streli, C.; Vanhoof, C.; Wobrauschek, P. 2017 atomic spectrometry update–A review of advances in X-ray fluorescence spectrometry and its special applications. J. Anal. At. Spectrom. 2017, 32, 1629–1649. [Google Scholar] [CrossRef]
  4. Rouillon, M.; Taylor, M.P. Can field portable X-ray fluorescence (pXRF) produce high quality data for application in environmental contamination research? Environ. Pollut. 2016, 214, 255–264. [Google Scholar] [CrossRef] [PubMed]
  5. Lemière, B. A review of pXRF (field portable X-ray fluorescence) applications for applied geochemistry. J. Geochem. Explor. 2018, 188, 350–363. [Google Scholar] [CrossRef] [Green Version]
  6. Weindorf, D.C.; Bakr, N.; Zhu, Y. Chapter One—Advances in Portable X-ray Fluorescence (PXRF) for Environmental, Pedological, and Agronomic Applications. In Advances in Agronomy; Sparks, D.L., Ed.; Academic Press: Cambridge, MA, USA, 2014; Volume 128, pp. 1–45. ISBN 0065-2113. [Google Scholar]
  7. Adler, K.; Piikki, K.; Söderström, M.; Eriksson, J.; Alshihabi, O. Predictions of Cu, Zn, and Cd Concentrations in Soil Using Portable X-ray Fluorescence Measurements. Sensors 2020, 20, 474. [Google Scholar] [CrossRef] [Green Version]
  8. Havukainen, J.; Hiltunen, J.; Puro, L.; Horttanainen, M. Applicability of a field portable X-ray fluorescence for analyzing elemental concentration of waste samples. Waste Manag. 2019, 83, 6–13. [Google Scholar] [CrossRef]
  9. Healy, M.G.; Fenton, O.; Forrestal, P.J.; Danaher, M.; Brennan, R.B.; Morrison, L. Metal concentrations in lime stabilised, thermally dried and anaerobically digested sewage sludges. Waste Manag. 2016, 48, 404–408. [Google Scholar] [CrossRef] [Green Version]
  10. Manohara, B.; Belagali, S.L. Evaluation of energy dispersive scanning electron microscopy and X-ray fluorescence techniques for analysis of compost quality. Anal. Methods 2017, 9, 253–258. [Google Scholar] [CrossRef]
  11. McWhirt, A.; Weindorf, D.C.; Zhu, Y. Rapid analysis of elemental concentrations in compost via portable x-ray fluorescence spectrometry. Compost. Sci. Util. 2012, 20, 185–193. [Google Scholar] [CrossRef]
  12. Wang, T.; Li, Y.; Zhang, J.; Zhao, J.; Liu, Y.; Sun, L.; Liu, B.; Mao, H.; Lin, Y.; Li, W.; et al. Evaluation of the potential of pelletized biomass from different municipal solid wastes for use as solid fuel. Waste Manag. 2018, 74, 260–266. [Google Scholar] [CrossRef] [PubMed]
  13. Weindorf, D.C.; Sarkar, R.; Dia, M.; Haggard, B.; McWhirt, A.; Wooten, A.; Wang, H.; Chang, Q. Correlation of X-ray Fluorescence Spectrometry And Inductively Coupled Plasma Atomic Emission Spectroscopy for Elemental Determination in Composted Products. Compost. Sci. Util. 2008, 16, 79–82. [Google Scholar] [CrossRef]
  14. Götze, R.; Boldrin, A.; Scheutz, C.; Astrup, T.F. Physico-Chemical characterisation of material fractions in household waste: Overview of data in literature. Waste Manag. 2016, 49, 3–14. [Google Scholar] [CrossRef] [PubMed] [Green Version]
  15. CEN (European Committee for Standardization). Characterization of Waste. Screening Methods for the Element Composition by Portable X-ray Fluorescence Instruments; EN16424:2014; CEN (European Committee for Standardization): Brussels, Belgium, 2014; p. 36. [Google Scholar]
  16. Vanhoof, C.; Holschbach-Bussian, K.A.; Bussian, B.M.; Cleven, R.; Furtmann, K. Applicability of portable XRF systems for screening waste loads on hazardous substances as incoming inspection at waste handling plants. X-ray Spectrom. 2013, 42, 224–231. [Google Scholar] [CrossRef]
  17. CEN (European Committee for Standardization). Characterization of waste and soil. Determination of Elemental Composition by X-ray Fluorescence; EN 15309:2007; CEN (European Committee for Standardization): Brussels, Belgium, 2007. [Google Scholar]
  18. Weindorf, D.C.; Chakraborty, S.; Li, B.; Deb, S.; Singh, A.; Kusi, N.Y. Compost salinity assessment via portable X-ray fluorescence (PXRF) spectrometry. Waste Manag. 2018, 78, 158–163. [Google Scholar] [CrossRef]
  19. López-Núñez, R.; Ajmal-Poley, F.; González-Pérez, J.A.; Bello-López, M.A.; Burgos-Doménech, P. Quick Analysis of Organic Amendments via Portable X-ray Fluorescence Spectrometry. Int. J. Environ. Res. Public Health 2019, 16, 4317. [Google Scholar] [CrossRef] [Green Version]
  20. CEN (European Committee for Standardization). Sludge, Treated Biowaste and Soil—Digestion of Aqua Regia Soluble Fractions of Elements 2012; EN 16174; CEN (European Committee for Standardization): Brussels, Belgium, 2012. [Google Scholar]
  21. CEN (European Committee for Standardization). Characterization of Waste—Digestion for Subsequent Determination of Aqua Regia Soluble Portion of Elements 2002; EN 13657; CEN (European Committee for Standardization): Brussels, Belgium, 2002. [Google Scholar]
  22. Sager, M. Trace and nutrient elements in manure, dung and compost samples in Austria. Soil Biol. Biochem. 2007, 39, 1383–1390. [Google Scholar] [CrossRef]
  23. Tella, M.; Doelsch, E.; Letourmy, P.; Chataing, S.; Cuoq, F.; Bravin, M.N.; Saint Macary, H. Investigation of potentially toxic heavy metals in different organic wastes used to fertilize market garden crops. Waste Manag. 2013, 33, 184–192. [Google Scholar] [CrossRef]
  24. Villar, P.; Villar, M.; Callejón, M.; Pérez, J.L.; Jiménez, J.C.; Alonso, E.; Guiraúm, A. Evolution of polycyclic aromatic hydrocarbons (PAHs) and heavy metals in sludge samples from conventional activated sludge wastewater treatment plants. Environmetrics 2009, 20, 561–574. [Google Scholar] [CrossRef]
  25. Analizer XRF NitonTM XL3t GOLDD+. Available online: https://www.thermofisher.com/order/catalog/product/XL3TGOLDDPLUS#/XL3TGOLDDPLUS (accessed on 17 April 2020).
  26. Houba, V.J.G.; Uittenbogaard, J.; Pellen, P. Wageningen Evaluating Programmes for Analytical Laboratories (WEPAL), organization and purpose. Commun. Soil Sci. Plant Anal. 1996, 27, 421–431. [Google Scholar] [CrossRef]
  27. International Association of Geoanalysts. Reference Material Data Sheet SdAR-M2 Metal-Rich Sediment; International Association of Geoanalysts: Nottingham, UK, 2015. [Google Scholar]
  28. EPA. Method 6200: Field Portable X-ray Fluorescence Spectrometry for the Determination of Elemental Concentrations in Soil and Sediment; Rev 0, February 2007; EPA: Washington, DC, USA, 2007. [Google Scholar]
  29. Kabata-Pendias, A.; Pendias, H. Trace Elements in Soils ad Plants, 4th ed.; CRC Press: Boca Raton, FL, USA, 2011. [Google Scholar]
  30. Adriano, D.C. Trace Elements in Terrestrial Environments: Biogeochemistry, Bioavailability, and Risks of Metals, 2nd ed.; Springer: New York, NY, USA, 2001. [Google Scholar]
  31. Anjos, M.J.; Lopes, R.T.; Jesus, E.F.O.; Assis, J.T.; Cesareo, R.; Barroso, R.C.; Barradas, C.A.A. Elemental concentration analysis in soil contaminated with recyclable urban garbage by tube-excited energy-dispersive X-ray fluorescence. Radiat. Phys. Chem. 2002, 65, 495–500. [Google Scholar] [CrossRef]
  32. López, R.; Burgos, P.; Madrid, F.; Camuña, I. Source Separate Collection of Recyclables Reduces Chromium and Nickel Content in Municipal Solid Waste Compost. CLEAN—Soil Air Water 2015, 43, 427–433. [Google Scholar] [CrossRef]
  33. Zhang, H.; He, P.J.; Shao, L.M.; Lee, D.J. Source analysis of heavy metals and arsenic in organic fractions of municipal solid waste in a mega-city (Shanghai). Environ. Sci. Technol. 2008, 42, 1586–1593. [Google Scholar] [CrossRef] [PubMed]
  34. Kratz, S.; Schick, J.; Schnug, E. Trace elements in rock phosphates and P containing mineral and organo-mineral fertilizers sold in Germany. Sci. Total Environ. 2016, 542, 1013–1019. [Google Scholar] [CrossRef]
  35. EU (European Union). Regulation (EU) 2019/1009 of the European Parliament and of the Council of 5 June 2019 Laying Down Rules on the Making Available on The Market of EU Fertilising Products 2019, L170; EU (European Union): Brussels, Belgium, 2019; p. 114. [Google Scholar]
  36. EU (European Union). EuropeanUnion Council Directive of 12 June 1986 on the Protection of the Environment, and in Particular of the Soil, When Sewage Sludge is Used in Agriculture (86/278/EEC); EU (European Union): Brussels, Belgium, 1986. [Google Scholar]
  37. Lemiere, B.; Laperche, V.; Haouche, L.; Auger, P. Portable XRF and wet materials: Application to dredged contaminated sediments from waterways. Geochem. Explor. Environ. Anal. 2014, 14, 257–264. [Google Scholar] [CrossRef] [Green Version]
  38. Pawlowsky-Glahn, V.; Egozcue, J.J.; Tolosana-Delgado, R. Modeling and Analysis of Compositional Data; Wiley: Chichester, UK, 2015. [Google Scholar]
Figure 1. Canonical discriminant functions for the three types of organic amendments using pXRF readings as input variables (missing values corresponding to readings below LOD are replaced with a 0).
Applsci 10 05726 g001
Figure 2. Studentized deleted residuals for the indicated regression equations for compost (blue dots) and 4 for sewage sludge (red dots).
Applsci 10 05726 g002
Figure 3. Predicted values for each element obtained for each type of amendment with the equations in Table 3, Table 4 and Table 5 against each corresponding aqua regia concentration.
Applsci 10 05726 g003
Figure 4. Relative differences (RDs) of the predicted aqua regia concentrations of the target elements.
Applsci 10 05726 g004
Table 1. Ranges of aqua-regia-extractable contents of selected elements of the different amendment types.
CompostSewage SludgeOrganic Fertilizer
Elem 1UnitMin 2Max 2MeanMin 2Max 2MeanMin 2Max 2Mean
LOI 3%9.3990.040.534.661.652.856.681.170.6
Feg kg−10.9933.912.212.010550.10.732.71.69
Cag kg−121.732081.831.659.447.926.850.836.5
Kg kg−10.7522.08.351.3314.83.2718.610151.8
Pg kg−10.6728.26.203.4834.128.06.1433.622.3
Sg kg−11.5322.04.092.1614.89.105.4355.628.8
Znmg kg−134.91295242193130585965.0186127
Pbmg kg−13.118041.949.02901391.406.943.38
Bamg kg−18.766813010652440810.016746.9
Asmg kg−10.858.924.702.7713.97.850.174.351.79
Cdmg kg−10.182.070.500.472.661.530.050.240.13
Crmg kg−13.2311158.731.7226.575.63.5828062.1
Hgµg kg−129141021117428711443152619
Nimg kg−11.6380.526.322.0134.145.91.2319.37.46
Seµg kg−1210356276564021341687420582484
1 Element. 2 Minimum and maximum values. 3 LOI: Loss on ignition.
Table 2. Evolution of the readings (n = 7) of the reference material sediment SdAR-M2 as determined using the mining (m) and soil (s) methods of the portable X-ray fluorescence (pXRF) spectrometer.
ReadingUnitCERT 1MeanMin 2Max 2RD (%) 3Range (%) 4
Cu(s)mg kg−1236222213226−6.05.9
K(s)g kg−141.538.636.241.1−6.912.7
Mn(s)mg kg−11038851829877−18.05.6
Pb(s)mg kg−18088148008310.73.8
S(s)mg kg−197012551132138429.420.0
Ti(s)mg kg−11798139213081485−22.612.7
Zn(s)mg kg−1760714 695743−6.16.7
Zr(s)mg kg−12592752692866.16.2
Al(m)g kg−166.042.839.145.3−35.114.5
Ca(m)g kg−16.005.745.665.85−4.43.3
Fe(m)g kg−118.418.318.018.7−0.53.8
P(m)mg kg−134545641249332.117.8
Si(m)g kg−1343292280300−15.06.8
1 Certified value. 2 Minimum and maximum readings. 3 RD: relative difference between the mean and the certified value. 4 Range = (Max − Min) × 100/Mean.
Table 3. Statistics of linear equations for the prediction of aqua-regia-extractable contents of trace metals (X(pred)) from the readings (soil and mining methods) obtained using pXRF on the compost samples.
p-Values
Equationp(B)p(C)p(D)rMean 1N(n) 3
(1)0.0000.006 0.9674.7014(1)
(2)0.0000.0300.0290.9804.9913(13)
(3)0.0000.014 0.9890.50314(1)
(4)0.0000.0090.0310.9960.52513(13)
(5)0.0000.0000.0030.97558.714(14)
(6)0.000 0.94921114(1)
(7)0.0000.0000.0300.99522513(13)
(8) 20.0000.029 0.97726.314(14)
(9)0.0000.007 0.98176514(14)
1 Values are in mg kg−1 except Hg(pred) and Se(pred) in µg kg−1. Units of Si(m), Fe(m), and K(s) are g kg−1. 2 Bal(m) in % is the difference from 100% of the sum of all measured elements. 3 N: number of data points for the adjustment; between brackets, n: number of data used for the Figure 1.
Table 4. Statistics of linear equations for the prediction of aqua-regia-extractable contents of trace metals (X(pred)) from the readings (soil and mining methods) obtained using pXRF on the sewage sludge samples.
p-Values
Equationp(B)p(C)p(D)rMean 1N(n) 2
(10)0.000 0.9277.8511(5)
(11)0.001 0.9699.316(6)
(12)0.0000.001 0.9321.5311(11)
(13)0.000 0.99595.96(6)
(14)0.0000.007 0.94575.611(5)
(15)0.0010.025 0.904144311(2)
(16)0.0020.0100.0240.97215589(9)
(17)0.0000.011 0.90745.911(2)
(18)0.000 0.96147.49(9)
(19)0.0000.025 0.906168711(1)
(20)0.0000.010 0.931164810(10)
1 Values are in mg kg−1 except Hg(pred) and Se(pred) in µg kg−1. Units of Cl(m), Fe(m), Al(m), and K(s) are g kg−1. 2 N: number of data points for the adjustment; between brackets, n: number of data used for Figure 1.
Table 5. Statistics of linear equations for the prediction of aqua-regia-extractable contents of trace metals (X(pred)) from the readings (soil and mining methods) obtained using pXRF on the organic fertilizers.
p-Values
Equationp(B)p(C)p(D)rMean 1N(n) 2
(21)0.015 0.9451.795(1)
(22)0.022 0.9782.194(4)
(23)0.003 0.9830.1355(5)
(13) 3 329(1)
(24)0.0090.041 0.994195(5)
(25)0.036 0.9037.55(1)
(26)0.012 0.9889.04(4)
(27)0.045 0.9554844(4)
1 Values are in mg kg−1 except Hg(pred) and Se(pred) in µg kg−1. Units of Fe(m) and Ca(m) are g kg−1. 2 N: number of data points for the adjustment; n: number of data used in Figure 1. 3 Equation (13) for sewage sludge samples was used for one organic fertilizer sample.

