1. Introduction
Energy consumption in buildings represents 32% of total final energy consumption [
1]. This is also a hot research topic with several publications [
2,
3,
4,
5]. The energy savings process can be greatly increased with user’s participation since, in most cases, they can change local parameters like heating/cooling or lights. In this context, IoT real-time sensing data represents an important step toward consumption reduction via the identification of local patterns and, in some cases, promoting automatic interactions to reduce costs [
6]. In this research, we integrate people as part of the process with the following two complementary Things2People approaches: (1) where real-time sensor data is integrated into a 3D building user interface and (2) using predictions of energy consumption and costs related to users’ possible actions.
The knowledge about the predictions of energy consumption in buildings is essential for producers and consumers. IoT real-time information on energy, temperature, and humidity can be stored and correlated with external events to identify consumption patterns. Since the heating/cooling system is responsible for a significant percentage of the energy consumption in the building, the prediction also gives essential information about possible savings if we increase or decrease the inside temperature by as much as one degree.
To facilitate Things2People interaction, we developed an IoT building management system, where measurements were performed and represented in building information models (BIMs), where user real-time interactions and automatic actions can be predicted regarding heating/cooling systems. In this research, we describe one of our contributions toward Things2People, like the 3D IoT data representation and personalized prediction using past local data.
Because building energy consumption prediction depends on a variety of factors, starting with random human behaviour, IoT implementation with associated data analytics platforms helps by reducing dependent variables, but to improve accuracy and precision, data analytics and associated dashboards are essential tools to extract knowledge from data for the identification of waste. Correlation with external events also has an important role, and predictions can help in savings actions.
Predictions algorithms, using locally collected data, can be very important to change user behaviour, and taking into account that energy suppliers can result in a rough prediction of community energy needs for heating or cooling.
Figure 1 illustrates our major work outputs and developed modules. The IoT platform developed in previous work [
6] gives real-time data to people through a 3D interface and feeds the developed predictive process for the personalized forecast. The system is also used to generate alerts when it detects abnormal behaviours or consumptions.
2. State of the Art
2.1. Energy Consumption Prediction
The study of models for forecasting energy demand is currently the object of research by many authors. By doing a search in Google Scholar with the query “Energy Demand Forecasting,” 99,400 works since 2016 are shown. Using the same filters but using the query “Energy Consumption Forecast,” the number of works account for 62,400. These numbers can be an indication of the importance of this subject for researchers and society in general. Within energy consumption or energy demand forecasting, buildings have an important role. In some developed countries, the consumption of energy in buildings account for up to 40% of the countries’ total energy consumption. Moreover, these values relate directly with greenhouse gas emissions, where, in these same developed countries, greenhouse gas emissions by the building sector accounted for 40% of total emissions [
7], thus showing the importance of forecasting energy consumption in buildings as a strategy to decrease greenhouse gas emissions and improve energy efficiency.
There are two main approaches for building energy consumption prediction—the physical modelling approach and the data-driven approach [
8,
9]. Physical models rely on thermodynamic rules for detailed energy modelling and analysis, whereas data-driven models learn from historical data for prediction. The latter method has gained a lot of research attention in the last few years, as several variables must be taken into account when developing a predictive model that can provide results that are as accurate as possible, like weather conditions or Heating, Ventilation, and Air Conditioning (HVAC) systems [
10]. Because of this complexity, the analysis of past data to identify patterns is very important to develop a forecasting model. These patterns can be identified by applying time-series forecasting techniques, as it uses the ordered historical data to identify patterns and use this information to forecast future values.
For this work, and considering the data available, the data-driven approach will be the most suitable, where the application of time-series forecasting algorithms will be used to forecast energy consumption.
Time-series forecasting techniques have been widely applied to forecast energy consumption, and depending on the data used, each model will be more suitable for that specific problem, as data can be univariate (only one variable is registered) or multi-variate (several variables are analysed as well as their interaction) [
10].
For the identification of the predictive models to be applied in this work, several works were reviewed where the application of time-series forecasting models related to energy consumption in buildings provided fairly good results. The AutoRegressive Integrated Moving Average (ARIMA) model and its respective variations depending on the existence of trend and seasonality in data are an example of that. This model was applied in works of Chou and Tran [
11], and Musbah and El-Hawary [
12].
In the first work [
11], a comparison between machine learning algorithms for energy consumption forecasting was made with data from a typical three-floor building in Xindian District, New Taipei City in Taiwan. The authors categorized the predictive models into the following three categories: single models (ANN, SVM, ARIMA, etc.), ensemble models (Bagging, AdaBoost), and hybrid models (ARIMA-ANN, SARIMA-MetaFA-LSSVR). The results provided showed that the hybrid model using SARIMA-MetaFA-LSSVR (a version of the ARIMA that takes into account seasonality) had an RMSE of 0.164 and an MAE of 0.028. The latter work applied the SARIMA model to forecast short-term electric load data, with hourly data from January 2017 to December 2017, where the results obtained were good enough for the authors to consider the SARIMA model as suitable for the problem at hand.
Another technique that can be used for time-series predictions is the Holt–Winters exponential smoothing method which deals with seasonality. This applicability of this method was observed for forecasting short-term electrical load showing MAPE results of 3.94% with one step ahead and 4.49% for seven steps ahead [
13]. Another study applied this method for energy consumption forecasting in the Cajamarca region, Peru, in the short and medium term [
14]. Similar to the previous studies, the Holt–Winters method was also applied to forecast data centres power consumption to increase energy efficiency [
15].
Neural networks can also be utilized for time series forecasting, with long short-term memory (LSTM) being one of the used techniques. This model was utilized to forecast energy consumption in buildings within the campuses of the City University of New York [
16]. Another study showed the applicability of the LSTM method to forecast housing energy consumption to create a stable power supply since electricity is simultaneously consumed as it is generated by power plants. This method was tested with data provided by the University of California, Irvine (UCI) machine learning repository that contained an individual household’s electrical power consumption and showed results of MSE of 0.37 [
17].
Hong et al. in the work [
18] covered a combination of methods to measure and collect data on occupant behaviour, new occupant behaviour models, and the integration of these models with building simulation programs, and it highlights case studies demonstrating the use of these tools to solve real-world problems to improve building design, operation, and retrofit.
The ‘drivers-needs-actions-systems’ (DNAs) framework, described in [
19] presents an ontology providing a common technical language for the building simulation community to observe, model, and simulate energy-related occupant behaviour in buildings. The proposed framework captures the vast majority of occupant behaviour, which directly or indirectly impacts building energy use. The DNAs framework presented in the paper facilitated the quantification of the impact of occupant behaviour on building energy efficiency.
2.2. Building Information Model
A building information model (BIM) is a 3D illustration of a building and its elements—mechanical frameworks, furniture, and materials. Data can be related to the physical elements in addition to the spaces, e.g., their capacity or usage. BIM is another procedure of work and joint effort for the architecture, engineering, and construction (AEC) industry. BIM execution is powerful in the principal stages (plan and development) of the structure life-cycle and more fragile in the last stages (activity and decommissioning) [
20]. For new offices, a BIM model is created during the structure stage and refreshed during development. In the most pessimistic scenario, this model will hold a portrayal of the math and materials, and in the best-case scenario, important hardware, room names, and a depiction might be accessible.
Autodesk’s Revit from San Rafael, CA 94903, USA. [
21] is one of the most broadly utilized BIM programs and uses a database. It is available with API [
22]; for example, VB.NET and C# render it conceivable to interface the model to outside data frameworks and import building-related data. The Dynamo [
23] language gives simpler access to Revit’s API through visual programming. On account of moderately straightforward applications that do not request elite, Dynamo considers a faster turn of events, although the upkeep cost is higher.
A database is used to provide the model itself with all context information, which is periodically updated and refreshed in the UI.
The university where the current case is being developed already has a BIM model of the campus buildings under development [
24]. This model incorporates the total mathematical portrayal of the structure, including all room names.
The Dynamo scripting language was utilized to separate rooms with their location, name, floor, and building; a rundown of signals with directions and ID data and the directions of the closest step and lift, and naturally created pictures of the walkable areas in each floor.
For visualization purposes, the model was imported to Unity and integrated with a local database where the sensor’s readings are stored. Each room’s temperature or humidity is displayed using colour gradient functions—with red for higher temperatures, green for lower temperatures, dark blue for higher humidity values, and light blue for lower humidity values. As example of this process is illustrated in the
Figure 2.
Related work with Internet of Things (IoT) systems and BIM, such as [
25], integrate sensor data with the model; however, no user interaction is considered, and the proposed approach results only in static content and technical data. In [
26], wireless sensors collect room environment data to integrate with BIM and present it in a graphical user interface, allowing the person in charge to manage the room’s conditions such as air quality. The proposed approach can automatically adapt the AC inside the room; however, it does not take into account the users behaviour (only the sensor data).
In [
27], the authors developed a context-aware predictive model using users’ smartphone datasets and machine learning, proving that user historical or real-time data contribution can increase a prediction model effectiveness. In [
28], another context-aware prediction model is presented that uses smartphone apps and random forest machine learning techniques, with good results compared to other common techniques. Their results also indicate a major contribution from user data to the prediction process. The authors also presented other user behaviour modelling using machine learning in [
29], and a survey about data-driven context-aware systems [
30].
3. IoT System
To develop our sensor’s data collection system, we used one of the latest IoT technologies design for sensors and devices that do not require high data rates or low latency. LoRa or Long-Range is a communication technology with a maximum range between 5 km to 30 km, low-power consumption, and low data rates, that allows easy deployment for 100 s of sensors with just one gateway. We built an IoT System to gather and analyse information (for details, see [
6]), partitioned into the following three fundamental layers:
The sensor layer is responsible for local data environment collection. We use DHT11 with the accuracy of ±0.3 °C to get local temperature, humidity, luminosity integrated into a LoRa32u4 II board and energy integrated into an Arduino MKR WAN. These prototypes are welded to circuit boards powered by small 2400 mAh lithium batteries, and the entire circuit is placed inside a 3D printed box drawn in AutoCAD. The prototype power consumption sensors use an Arduino MKR 1300 connected to current Transformers sensor that measure current based on the power consumption passing through the main cable at the time. Errors vary between 3–10%, and to get the power, we need to measure the local voltage. For details, see [
31].
In the network layer, since we have a battery sensor, we need low-power communication. Since we have a LoRa network at our IoT Laboratory in Instituto Superior de Ciências do Trabalho e da Empresa (ISCTE), we configured sensors that send data to the gateway and stay asleep for 5 min before repeating the transmission. The application server stores the IoT collected data, performs the data analytics process to extract knowledge, and exports this data to the BIM server. The development was based on Python Flask Framework [
32], which allows the creation of a server in a short time and with very little code.
In the knowledge layer, we implement MariaDB databases that provide the data storage and backup, and a Unity application displays the 3D model of the building. For details, see [
6].
4. Personalized Context Data Prediction
From our IoT-developed platform, illustrated in
Figure 3, several data sets have been created based on the local installation in public spaces, like universities and schools. To explain the developed work, we use a dataset used for this work that contains information on energy consumption from a kindergarten in Amadora, situated in Lisbon, Portugal. The data is an IoT dataset developed in a master thesis [
33], and the data can be accessed at
https://www.kaggle.com/brunomataloto/loems-lora and contains the hourly energy consumption of that school from September 2016 until the last day of September 2019, which represents three years of hourly information on energy consumption in kWh (kilowatt hours). Each month was recorded in a dataset, meaning there were 46 individual datasets of energy consumption in this school during this period.
The energy usage pattern is constant during the weekends, and during workdays, it presents a pattern of energy consumption that increases during lunch hours and in the middle of the afternoon, which is when kitchen appliances, such as the dishwasher, are being used. Instant energy consumption can reach up to 7 kWh during that time, and stand-by power (the lowest energy usage values) is usually between 70 to 90 watts.
Being a widely accepted framework through several industries, the Cross Industry Standard Process for Data Mining (CRISP-DM) methodology was used for data analysis (
Section 4.1), modelling (
Section 4.2), and evaluation (
Section 4.3).
4.1. Data Analysis
During the analysis of the data, it was identified that some data was not prepared for this work: (1) The end of a dataset always contained the first day of the next month, so the energy consumption in kWh of this record was always 0. (2) From 1 September 2016 to 13 September 2016 and from 6 April 2019 until 30 April 2019, there were no records of energy consumption. These anomalies were caused by faulty batteries that were powering the energy sensor. Any duplication in the datasets was removed, considering only the record that had the real value.
In terms of missing values, and specifically for the data analysed in April 2019, the option was to use the same kWh consumption recorded in April 2018 and fill that interval. Since there was no data before 13 September, all the missing values were removed from the data set. For the rest of the missing values, this was considered to be the best approach, and since this is a time series problem, we applied a moving average method with a rolling window of 5.
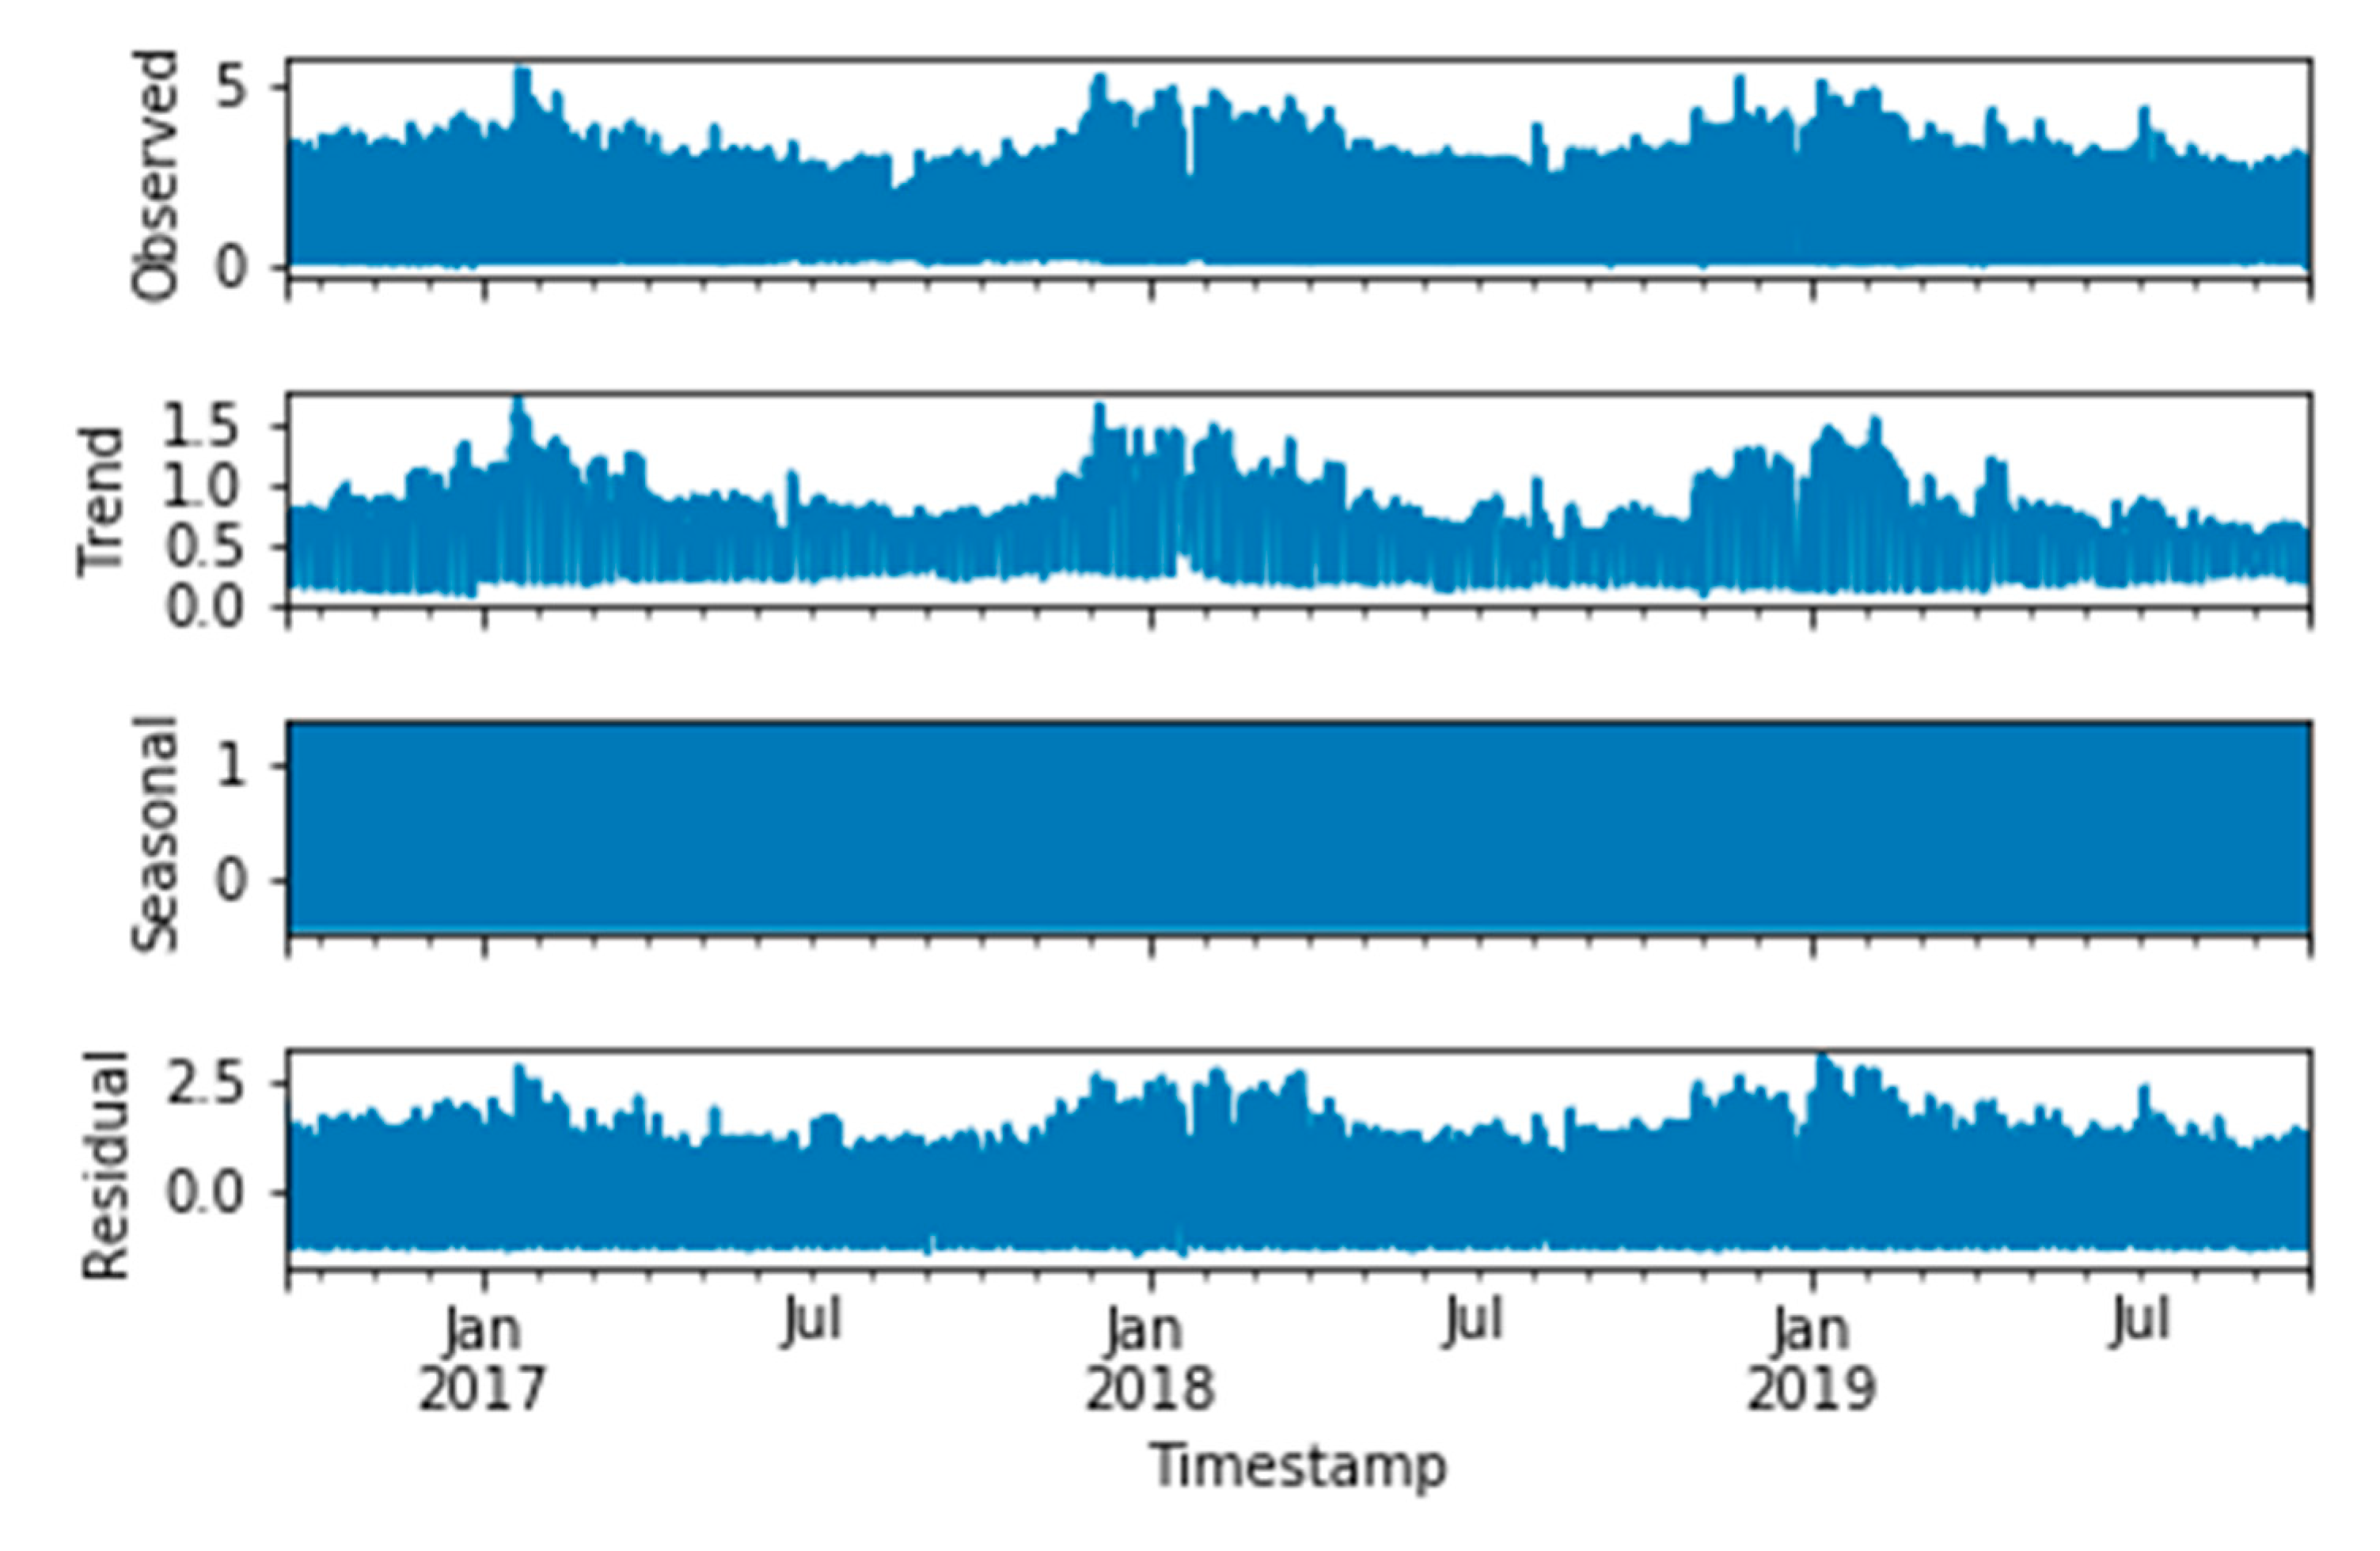
One of the important steps for posterior forecasting was to verify the overall view of the data in terms of stationarity and seasonality. The augmented Dickey–Fuller test was applied to confirm if the null hypothesis was rejected, or in other words, if the data was stationary. The p-value obtained was 0.00, meaning that the data was stationary, thus confirming that there was no need to transform the data in this regard.
In terms of seasonality, by plotting the data, there is clear evidence of its existence. The consumption of energy shows an increasing trend until the first or second month of each year, where it starts decreasing until August of each year. During December, January, February, and March, Portugal are having the Winter period, where temperatures can go between 5 °C and 12~15 °C. Most schools use central heating to guarantee that all students and school personnel are comfortable, thus increasing energy consumption. During August, Portugal is in the summer period, where most families are on vacation, thus decreasing the need to use cooling systems, turn the lights on, or use other appliances that would be necessary during the normal active period. The plotted data can be observed in
Figure 4 and
Figure 5.
4.2. Modelling
Personalized predictive models were developed based on open-source software to create a real-time personalized prediction of current user location. The predictive models applied to the dataset were developed on the open-source Python (version 3.6.8) and with the following libraries: pandas, numpy, searborn, statsmodels, matplotlib, and keras. All of these libraries were used to analyse the data, make the needed transformations, identify patterns, develop predictive models, and provide results.
Due to the scope of this work, we identified three models that can be used to forecast time-series with overall suitable results, based on the available literature analysed on this subject.
4.2.1. SARIMA Model
The SARIMA model is a version of the ARMA model. The ARMA model is comprised of 2 sections—autoregression (AR), which is represented by ‘
p’, and moving average (MA), represented by ‘
q’. In case the data is not stationary, this model does not provide excellent results. The model is explained in Equation (1)—ARMA Model Equation.
To be able to deal with the trend in data, the integrated term ‘
i’ is applied, converting the not stationary data into stationary data and naming the model ARIMA. Data that has a pattern that repeats in a set of periods implies that there is seasonality. To take that into account, the ARIMA model developed to a seasonal ARIMA (SARIMA). The SARIMA model can be explained by Equation (2)—Sarima Model Equation, where
D represents the seasonal differencing and
s the seasonal period.
4.2.2. Holt–Winters Exponential Smoothing
Holt–Winters exponential smoothing is a widely used model for predictions that can handle seasonal and trend variation. This model has two variations for seasonality—(1) additive and (2) multiplicative. The additive Holt–Winters model takes into consideration that the seasonal variation is the same size throughout the periods and can be explained by Equation (3)—Holt-Winters Additive Model Equation.
The multiplicative Holt–Winters models consider that the seasonal variation changes in proportion with the time series in the analysis. This model can be explained by Equation (4)—Holt-Winters Multiplicative Model Equation.
With the application of this algorithm, we seek to develop a predictive model that has the best evaluation scores in order to guarantee that the predicting values are almost identical with the real values. The bt expresses the trend component, while st expresses the seasonal component.
4.2.3. Long Short-Term Memory Neural Network (LSTM)
The long short-term memory neural network (LSTM) is a type of recurrent neural network. This neural network is differentiated from the deep neural networks in terms of its usage, in that a deep neural network generates predictions considering its current input and discriminating previous input. For time-series data, this type of neural network would eliminate the dependencies between inputs that are observed for time series problems.
The application of recurrent neural networks helps mitigate this loss on dependency problem by memorizing the valuable input throughout sequences. Although being able to hold information through the various sequences, it is still unable to hold that same information for extended sequences since the traditional recurrent neural networks utilise backpropagation in model training.
The LSTM was developed considering this loss, allowing the information to be held in longer sequences. This is achieved by using the logic of maintaining only information that is important in a sequence and forgetting the irrelevant information through internal mechanisms called gates.
The LSTM model can be explained by Equation (5)—LSTM Model Equation.
where
i indicates the input,
f the forgotten information,
g the update step,
o the output,
c the cell memory state, and
h the hidden state, [
34].
4.3. Evaluation Model
The application of these models in the dataset will predict values that will show errors, or in other words, it will show differences between the real value and the predicted value. The value of the accuracy of these models will depend on the forecast of these errors. Thus, for the evaluation of the models implemented in this work we will use three measures of accuracy—(1) mean absolute error (MAE), (2) mean squared error, and (3) root mean squared error (RMSE). The mean absolute percentage error (MAPE) could not be applied since, during the exploratory data analysis component, it was shown that some hours had 0 kWh registered.
These measures can be explained by Equation (6)—MAE Equation, (7)—RSME Equation and (8)—MAPE Equation, respectively.
5. Personalized Context Predictions
Taking into account the methodology and developed tool, in this section, we show the main results using the collected IoT data, created from the IoT system described in
Section 3.
5.1. Models Evaluation
When applying the predictive models into the cleaned data, some parameter identifications had to be done to correctly generate the forecasted values. For the development of all predictive models, the dataset was divided into two years for training and one year for the test.
The identification of the parameters for the SARIMA model was made by analysing the lowest value of the Akaike’s information criterion (AIC) through the
auto_arima library, based on the following intervals identified on
Table 1.
The results indicated that the lowest AIC was achieved with the parameters (2,0,1) (3,1,1,24). For the LSTM and Holt-Winters several experiments were done to identify the best results. The LSTM model was executed with 50 LSTM neurons, ‘ReLU’ activation, ‘ADAM; optimizer, ‘MSE’ loss, and with two hidden layers. For the Holt–Winters models, the seasonal component was used as ‘additive’.
The forecasting was done for the next 24 h where
Table 2 presents the accuracy values of the three predictive models, concluding that the Holt–Winters model registered the best results, with an MSE and RMSE closer to zero.
5.2. Prediction Results
With the Holt–Winters as the model with the best accuracy values for 24-h forecasting, a visual comparison of the predictive values and the real values was done to analyse the quality of the predictions. As shown in
Figure 6, the forecasted value and the real value in 24 h are very similar, thus leading us to identify that the Holt–Winters model is a suitable predictive model to be included in the proposed sensor-driven monitoring system with energy consumption through time.
6. 3D Visualization toward User Influence
In recent years, mobile devices have allowed researchers and practitioners to collect data about human behaviour using the sensors embedded in these devices—in particular, the global positioning system (GPS), accelerometers, microphones, cameras—and can be used as a fast interaction method approach.
This time, our system, together with mobile devices, creates a user interaction approach whose purpose is to warn and influence people to take actions, save energy, and work in a better environment.
By letting individuals cooperate with tablets set at key spots like passages, user reaction raises and offers real-time data of the building’s current state that can also reduce the time between an anomaly detection and correction.
A mobile application can allow people to interact with the system and evaluate each room’s thermal comfort, with a simple classification system. The collected data is used to colour both rooms and avatars within the 3D visualization tool. With the app, a user can also have an overview of the building and quickly identify strange behaviours or anomalies.
On the primary dashboard (
Figure 6), users have different views for various factors—for example, temperature, moistness, movement, or light. Each perspective presents a warning when a warning event is identified with that variable. At the point when the temperatures mode is chosen (
Figure 7), each room presents a colour identified with the current temperature. The system takes into account the defined temperature for the room and, using the prediction model, how much energy is required to reach it. If the current temperature is within comfortable limits and the AC is turned on, the system suggests the user turn it off, and presents the predicted energy cost for keeping the current temperature till closing hours for one week. This warning provides a medium-term estimative of a small action possible savings, considering the average energy consumption when the AC is on, and the average amount of time people use the room, together with the prediction model.
To avoid energy waste when ACs are working, and people open windows, every sensor module has a red LED that lights up when the outside temperature is higher than the indoor temperature during summer and the reverse during winter. If, despite everything, this circumstance occurs, by contrasting the most recent indoor temperature readings, it is conceivable to decide an irregularity when the AC is on, and the temperature continues rising, setting off an alarm to the person responsible.
If the motion sensor of the room does not detect movement for more than 5 min, it displays a red warning on the 3D model, and it sends an email alert to the person in charge of that room. Using the prediction model, it is also possible to influence people to take actions by referring to how interacting with the system can improve the room temperature further on.
Another view mode of the dashboard is light and motion (
Figure 8), in which it is possible to observe the current light level determined by the light sensor and which rooms have artificial light turned on. For example, in a situation that the natural light level is considered enough based on pre-defined values. If the system detects that artificial light has been turned, on it issues an alert to the 3D model warning about the unnecessary energy waste and how much it would cost to leave the lights on for the rest of the day for a week of repeating the same behaviour, using the average light consumption amount per room. This is also where people can identify warnings about rooms with artificial light turned on and no motion detected therein.
Besides the referred views, the system uses predicted energy consumption data to detect anomalies before closing hours, which prevents more significant energy losses during the night or weekends.
By comparing real-time measurements with the predicted energy consumption for a determined hour, a text warning is displayed on the 3D model and is sent by email to the person in charge, with the severity of the anomaly. These energy anomalies are classified by the deviation amount from the predicted value.
To improve user perception of each room’s conditions like temperature, it is possible based on an App previous installed by the users to collect their temperature feedback and check their presence using Wi-Fi probe requests [
28]. This information can be represented in a 3D using BIM models using colouring avatars inside each room. People can evaluate their current thermal comfort and act according to their needs. The avatar’s colour is defined by compiling the average room evaluation provided by people with the mobile APP. Each user can evaluate the thermal comfort as ‘low temperature’—blue, ‘good temperature’—green, or ‘high temperature’—red, based on user collected feedback.
7. Use Case Discussion and Results
Our use case was performed at one controlled room related to the identified IoT system. From May 2019 to October 2019, six-month data from an area wherein an average of 20 persons performed their work daily. In these six months of testing, the 20 persons went to a web application (alternative to the mobile device) when they arrived each day. The web applications show the information of sensors collected data (interior room and external temperature). These data are represented in dashboards with history and real-time and also 3D representation (BIM) parameters collected in a Things2People approach; this representation is made with colours taking into account internationally defined comfort values. After taking this information, the user expresses his ‘feeling’ of the temperature, light level, via the web application, in a pre-defined template with three levels—cold, regular, and hot. Then, we receive visual information about the other people in the place (see
Figure 9). Finally, we ask the user if we intend to change room temperature and how many degrees and lights and receive the prediction information of energy that will be used or saved with their intended action as an example of Things2People interaction.
As illustrated in
Figure 9, over time, the warning was significantly reduced due to our implemented approach where people interaction was achieved. People react before the system generate alerts. As the output of our approach, we can say that we give the user tools to have a real perception of the environment and take actions as an individual or as a group by understanding the overall room indicators and energy consumptions, leading to more conscious decisions and less energy waste.
Figure 10 presents energy consumption for that building section for the research period and previous years. From the collected data, it is possible to determine an average energy consumption reduction of 11% compared with 2017 and 3% compared with 2018. The results compared with 2018 were less obvious because of the lack of frequent heat waves during that year, which prevented air conditioning from being used.
It is important to point out that the system was a localized test case, which could have much better results if implemented throughout the building.
The overall assessment of users (20 employees) collected as a yes or no type of question demonstrated that the reaction to the UI was positive, and the framework is flexible enough to be implemented in more rooms and structures, a very good answer for lessening temperature issues during winter and summer seasons. Taking into account the collected feedback, 65% of changes in temperature were reconsidered based on provided predictive energy consumption. Fewer temperature changes on heating/cooling systems were performed, and our results show an average savings of around 4% of total energy consumed in this location.
We are extending this approach to other cases, involving students and classrooms, (
Figure 11).
8. Conclusions
The test case results indicate that sensors can influence user behaviour and reduce energy waste, increasing collective comfort indirectly since users can warn the system of the room state, thus reducing the time it would take to change the environmental conditions. The proposed approach allows people to interact with a sensor-driven monitoring system and create significant saving actions based on people’s influence. People-tailored information in real-time interaction is mandatory in any process involving local conditions (Things2People) information to achieve significant collective savings. To capture people’s attention, it is necessary to introduce human–sensorial interactions, and this was accomplished by providing visual information with a coloured 3D model of the building and real-time warnings that people can interact with and take actions. This interactive Things2People process created conditions to model users’ actions and acquire collective and sustainable behaviour. Associating cost information about users’ actions also plays an essential role by creating energy spending awareness previously unknown to most users. The prediction model allowed us to create estimates for energy consumption reasonably close to the real values, taking into account the locally collected data. This information is used to compare forecasts against the collected data, and differences above 10% (configurable parameter) are used to identify abnormal behaviour and to generate alarms that lead to human action.
The visual indicators of these metrics create awareness within the community, and after a small period, it is possible to notice behaviour changes by the creation of a collective thermal comfort. This collective visualization creates social and physical opportunities to engage in sustainable tasks that have been very successful [
29]. According to the results, strategies such as providing feedback on energy usage and instructions on how to responsibly use resources help reduce energy consumption. Also, Sarker in [
30] shows that employees improve their ecological behaviour when they get positive criticism on their drive to reduce energy usage and know that their activities positively affect their working environment, so our approach is also aligned with this.
Our system is easily scalable to large buildings such as ISCTE-IUL University at Lisbon, where a single room can spend more than 1000 watts of power just with lighting.
In this research, we show the representation of sensor-tailored information to local people and influence their behaviour by creating awareness about their actions in the test room. Data represented in a human-understandable manner also plays an important role. If people see that environment temperature or light is represented by a red colour and the estimated monetary saving for turning off the lights is high, they feel compelled to take action. Therefore, behaviour that wastes energy tends to reduce, as shown in
Figure 9, and people try to act more in this standard pre-defined approach. We also notice that people react to disruptive effects—for example, a window open in a winter day, or the sun heating a room in summer. In these disruptive effects, the room colour changes after a certain period, and local people react to close the window or close the blinds. In a future work, we are working on an approach where standard conditions are defined based on the collective feelings of people that work in that space.


