Article

Microscopic Characteristic Analysis on Sandstone under Coupling Effect of Freeze–Thaw and Acidic Treatment: From Nuclear Magnetic Resonance Perspective

School of Resources and Safety Engineering, Central South University, Changsha 410083, China
*
Author to whom correspondence should be addressed.
Appl. Sci. 2020, 10(16), 5699; https://doi.org/10.3390/app10165699
Submission received: 1 August 2020 / Revised: 11 August 2020 / Accepted: 12 August 2020 / Published: 17 August 2020

Abstract

:
Microscopic characteristics greatly affect mechanical and physical properties as they exert vital impact on the stability and durability of materials. In this paper, widely distributed sandstone was chosen as the research object. Sandstone was treated with a coupled effect of Freeze–Thaw (F–T) weathering and acid solution, where freeze–thaw cycles were set as 0, 10, 20, 30 and 40 cycles, and the pH of the acid solution were set as 2.8, 4.2, 5.6 and 7.0, respectively. Then, nuclear magnetic resonance was applied to measure the microscopic characteristics of sandstone, then porosity, pore size distribution and permeability before the fractal dimensions were obtained and calculated. Results show that porosity increases when F–T cycles increase, and its increase grows with the pH of acid solution decrease during the first 10 F–T cycles. Macro porosity, meso porosity and micro porosity account for the largest, second largest and smallest ratio of porosity growth. Meso porosity, micro porosity and macro porosity account for the largest, second largest and smallest ratio of total porosity. Permeability increases obviously with F–T cycle increase, while acid erosion exerts little influence on permeability increment overall. Fractal dimensions of meso pores and macro pores increase with F–T cycle increase overall, and they increase with pH decrease overall. Porosity has strong exponentially correlation with permeability. Fractal dimensions of meso pores and macro pores have good linearly correlation with permeability, while correlation between porosity and fractal dimensions are not that obvious.

1. Introduction

Porous materials are widespread in human living environments, including rock materials of slopes, tunneling, and artificial materials of roads and bridges. Pores and cracks in porous rocks are of great influence, which affect their physical and mechanical properties, such as porosity, permeability, pore size distribution and static and dynamic properties. They have quite an important impact on the stability and durability of these materials.
Freeze–thaw (F–T) is a kind of special natural environment caused by temperature change, whose covering area accounts for over 60% [1] of China’s territory. F–T weathering causes remarkable damage to the inner structure of porous material. As F–T weathering is caused by the temperature fluctuates at the freezing point of water, frost heaving and osmotic effects caused by water–ice phase transition inside the porous medium exert frost heaving force and penetration force to porous material [2,3,4], eventually changing the microstructural parameters of the material, resulting in the damage of the material. Therefore, F–T weathering is a major factor that damages porous materials.
Scholars have conducted many studies on the material damage caused by F–T weathering. A number of researchers adopted the deterioration of mechanical properties, including uniaxial static compression [5,6,7], uniaxial split strength [8,9], and dynamic strength [10,11] to characterize the damage of material. Although mechanical properties are closer to engineering, this method is indirect to characterize material damage. Amitrano [12] studied micro-structure evolution by collecting and analyzing the acoustic emission of rock samples under F–T cycles. Kranz [13] and Monteiro [14] adopted Scanning Electron Microscopy (SEM) and Computerized Tomography (CT) to reveal the external and internal structure of porous materials. Li et al. [15,16] characterized microstructure evolution of F–T treated rock samples by porosity and pore size distribution.
Chemical erosion is another important factor affecting rock inner structure, especially when porous rocks are soluble in chemical environment. Among chemical erosion, acid erosion caused by acid rain caused great damage to the geotechnical engineering and environment. Take Sichuan as an example, it underwent acid rain with an extreme low pH of 3.05 and 2.80 in 2004 and 2012, respectively, which caused irreversible damage to the environment. On this background, research on rocks under coupled the effect of freeze–thaw weathering and chemical erosion became a hot issue. Zhang [1] and Ding [17] investigated the mechanical properties of rock samples under the coupled effect of F–T and chemical erosion. Tian et al. [18,19] revealed the structure evolution of sandstone under the coupled treatment of F–T cycles and various chemicals reacting from the perspective of porosity and pore size distribution. Overall, only little attention has been drawn to the microstructure of rocks under coupled treatment of F–T process and chemical erosion, while it is vital to rock engineering in cold regions.
Currently, CT [20,21], Mercury injection porosimetry (MIP) [22], SEM [14] and Nuclear Magnetic Resonance (NMR) [23,24,25,26] are commonly adopted as microstructure detecting methods. CT detects the microstructures of materials based on the theory that X-ray attenuation of pores is different from aggregates. MIP detects the microstructures of materials based on the theory that mercury injection pore size is negatively correlated with mercury injection pressure. SEM detects the microstructures of materials by magnified electron microscope image directly. NMR detects the microstructures of materials by monitoring the H+ of water inside pores. Among these detecting methods, MIP damaged microstructure during microstructure detection, SEM acquires the local and surface structure of the sample only, CT is ineffective in describing the characteristics of a wide range of pore size distributions compared to NMR. NMR obtains micro-parameters, including porosity and pore size distribution directly—permeability and pore fractal dimension can also be deduced through NMR parameters.
Under the influence of industrialization, acid rain and acid wastewater affect the microstructure and mechanical properties of porous media, causing the degradation of stability and durability. In this study, the coupling effect of F–T weathering and different acidity solutions on sandstone samples is studied. Micro-structure parameters, including porosity, pore size distribution, permeability, and fractal dimensions are acquired through NMR test directly and indirectly. Their variation trends along with F–T cycles and acidity are investigated and displayed.

2. Material and Methodology

2.1. Rock Samples

In this study, porous rock is sandstone that was originally located in northern Sichuan, China, where there is seasonal F–T weathering and acid rainfall. Sandstone samples that studied in this experiment were drilled from an intact rock free from F–T weathering and acidic erosion. The sandstone was medium fine and yellow in color, and composed of Quartz (95.1%), Illite (1.48%), Montmorillonite (2.32%) and Ferric component (1.1%). The sandstone had an initial average porosity of 10.10%, tested by NMR. Rock samples were processed in cylinders with length–diameter ratios of 1:2. Samples’ diameters were 50 mm and end faces of the samples were polished according to the sample processing method proposed by International Society for Rock Mechanics (ISRM).

2.2. Acid Solution

A dilute solution of sulfuric acid was adopted in this experiment to monitor acid rain. A dilute solution of sulfuric acid was configured by concentrated sulfuric acid and distilled water. Acid solutions were set as four levels corresponding to four acidities—namely, pH = 2.8, pH = 4.2, pH = 5.6 and pH = 7.0. Among these, pH 2.8 represents the historical lowest PH of acid rain in north Sichuan, 5.6 represents the pH of critical value of acid rain in China and 7.0 represents pH of normal water in the research region. During the acid erosion, pH was tracked to reflect the acid erosion.

2.3. Freeze–Thaw Test

The F–T test was conducted in TDS-300 concrete with an F–T test machine [10,18]. This machine is highly automated with a temperature control range of −40 °C to +20 °C and a precision of ± 0.1 °C. Before the F–T test, all samples were vacuum saturated with a vacuum pressure of 0.1 MPa for 4 h, and then immersed into water for 24 h to make sure the samples were saturated [25,26]. Then, saturated samples were immersed into an acid solution and placed into the F–T test machine for F–T treatment. During the F–T treatment, the temperature range was set as −20° C to 20 °C [10,16,18,23]—both the freezing phase and the thawing phase last 4 h. Samples were taken out of the machine for other detections and measurements after every 10 F–T cycles.

2.4. Nuclear Magnetic Resonance (NMR) Test

The NMR test is based on detecting the H+ of water inside microstructures. As the H+ of water reacted, the medium describes the microstructure of rock. When the rock sample was saturated, the H+ of water saturated with pores and cracks; therefore, the H+ distribution characterized the microstructure of rock. The NMR test was conducted on the low field AniMR-150 NMR system, whose work theory and equipment parameters have been introduced in the references [25,26,27]. As the microstructure detected by NMR is based on detecting the H+ of fluid water, samples need to be saturated before the NMR test. The saturation progress was the same as mentioned above. After the samples were saturated, samples were taken out and wiped by a dry towel to clean moisture on the surface, then wrapped with plastic wrap to prevent water evaporation during the test, which may cause error. After the NMR test, porosity, permeability and the pore size distribution of samples can be acquired.

2.5. Permeability and Fractal Dimensions by NMR

2.5.1. Permeability by NMR

Permeability reflects the interconnectivity of pores within porous material, characterizing the degree of liquid permeates through porous material. Through NMR logs, permeability can be expressed by Equation (1), as follows [28,29]:
K SDR = C Φ m T 2 l m n
where K SDR is the permeability established with the SDR model. Its unit is mD, Φ is porosity obtained from NMR, T 2 l m is the logarithmic mean value of the NMR T2 distribution, which can be calculated with T2 spectrum; its unit is ms. C , m and n are statistical model parameters; their empirical values are 4, 2 and 10, respectively.

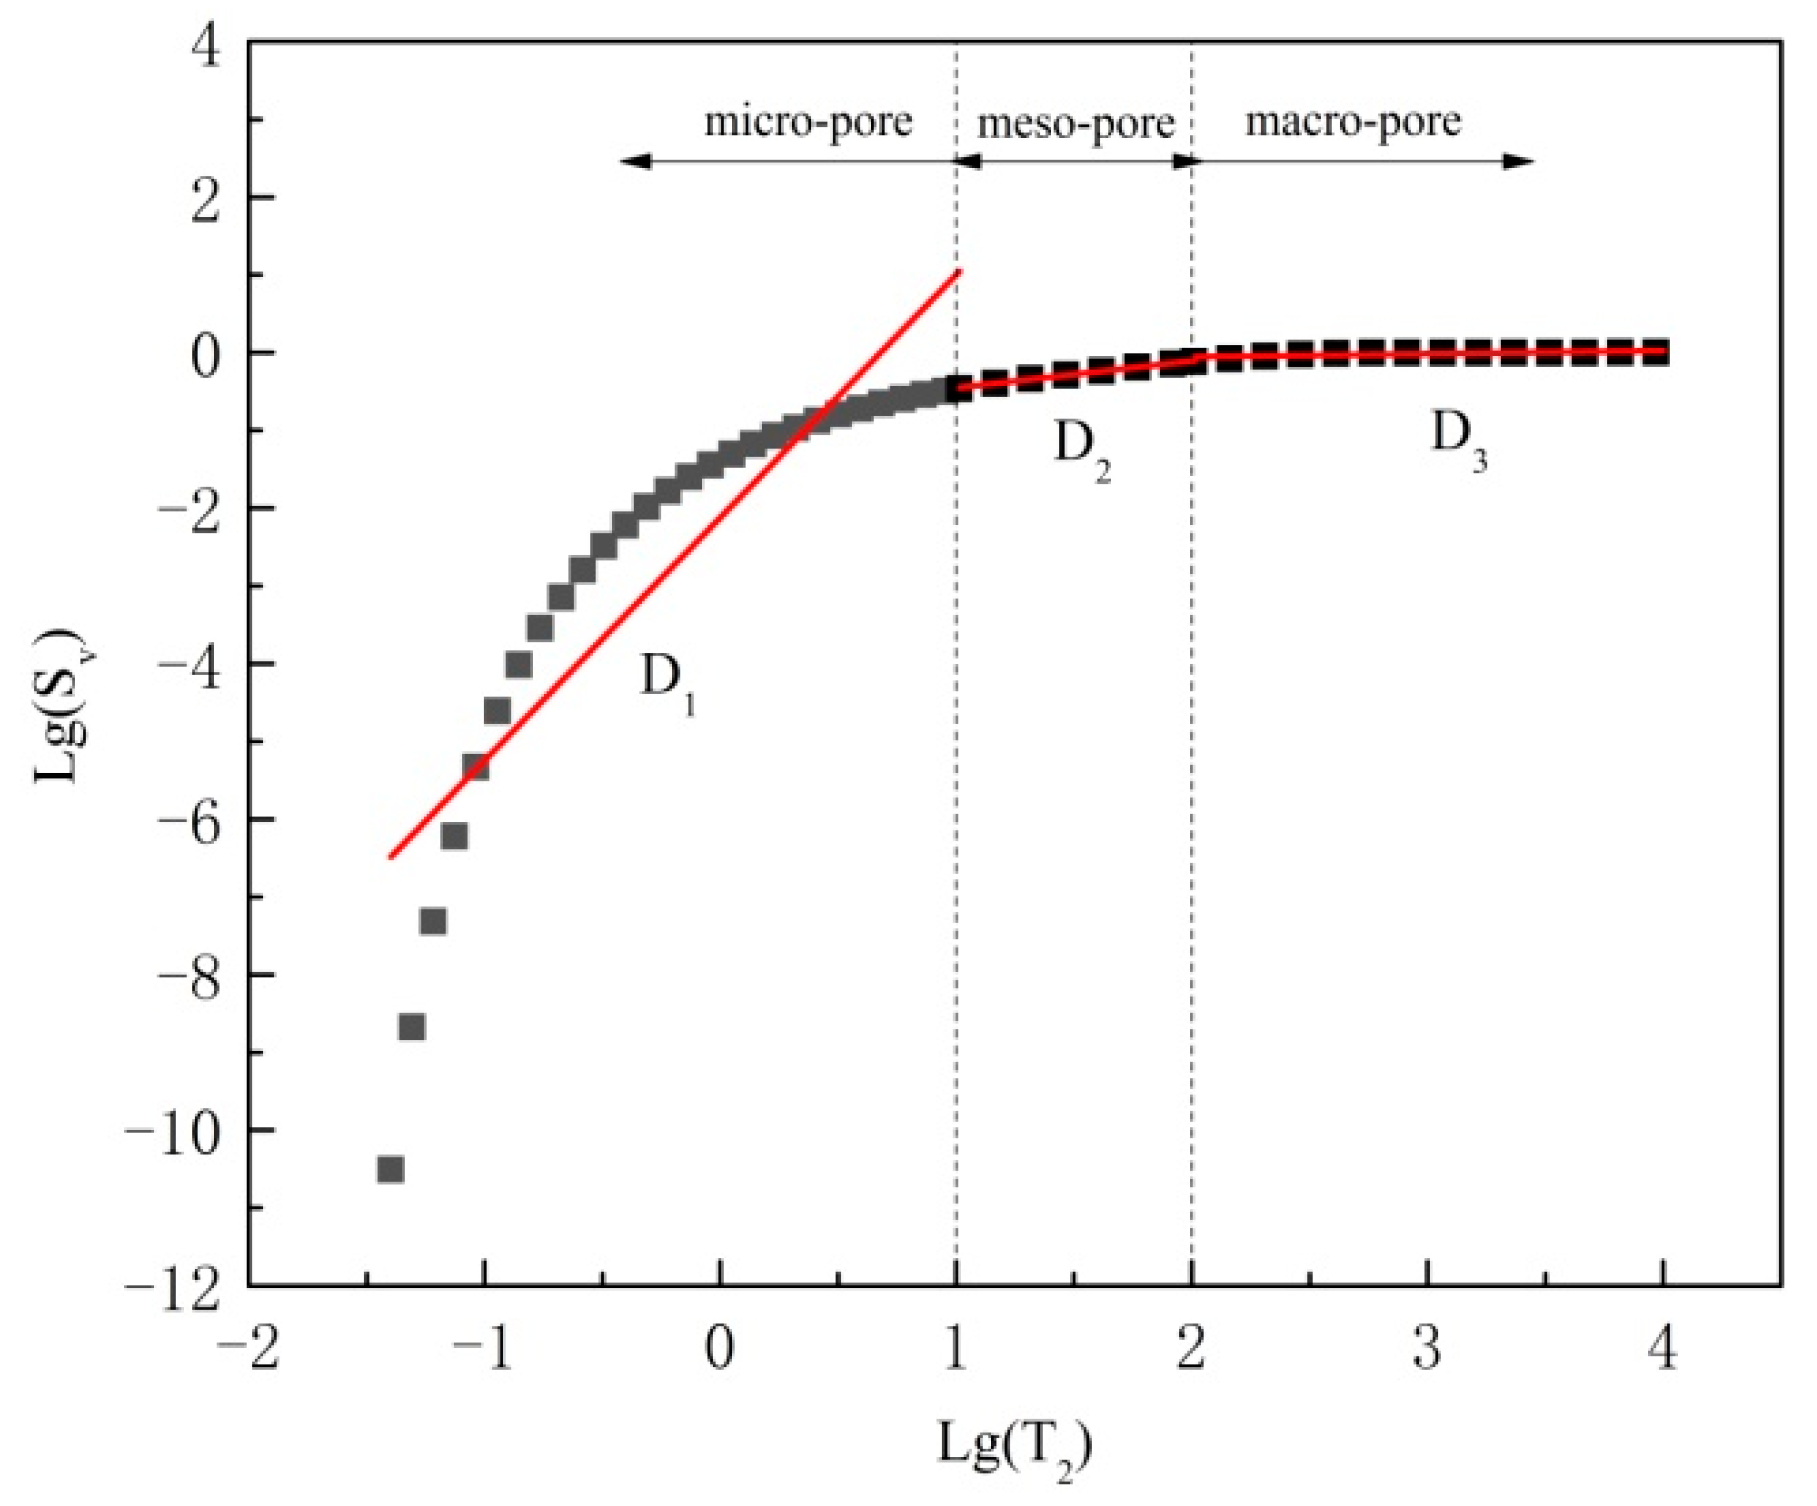
2.5.2. Fractal Dimensions by NMR

Rock materials have good self-similar characteristic. The complexity of the pore structure can be quantitatively described by fractal theory, and it has been used to analyze the micro structures of porous materials [30,31]. According to the fractal theory, the proportion of pores and fractals has a relation that can be expressed as in Equation (2) [32,33].
S V = ( r r max ) 3 D
where S V is the proportion of pores with radii smaller than r , r is pore radii, r max is the max pore radii of samples and D is the fractal dimension of samples.
As r is linear, correlated with T2 of NMR, Equation (2) can be transformed into Equation (3).
S V = ( T 2 T 2 max ) 3 D
Therefore, fractal dimension D can be calculated as Equation (4).
lg ( S V ) = ( 3 D ) lg T 2 ( 3 D ) lg T 2 max
where T 2 max is the maximal value of the NMR T2 distribution; its unit is ms.
According to Equation (4), the fractal dimension of different pores can be obtained by adjusting the range of T2. A typical plot shows the segmented fractal dimensions of sandstone used in this paper, shown as Figure 1.

3. Result and Discussion
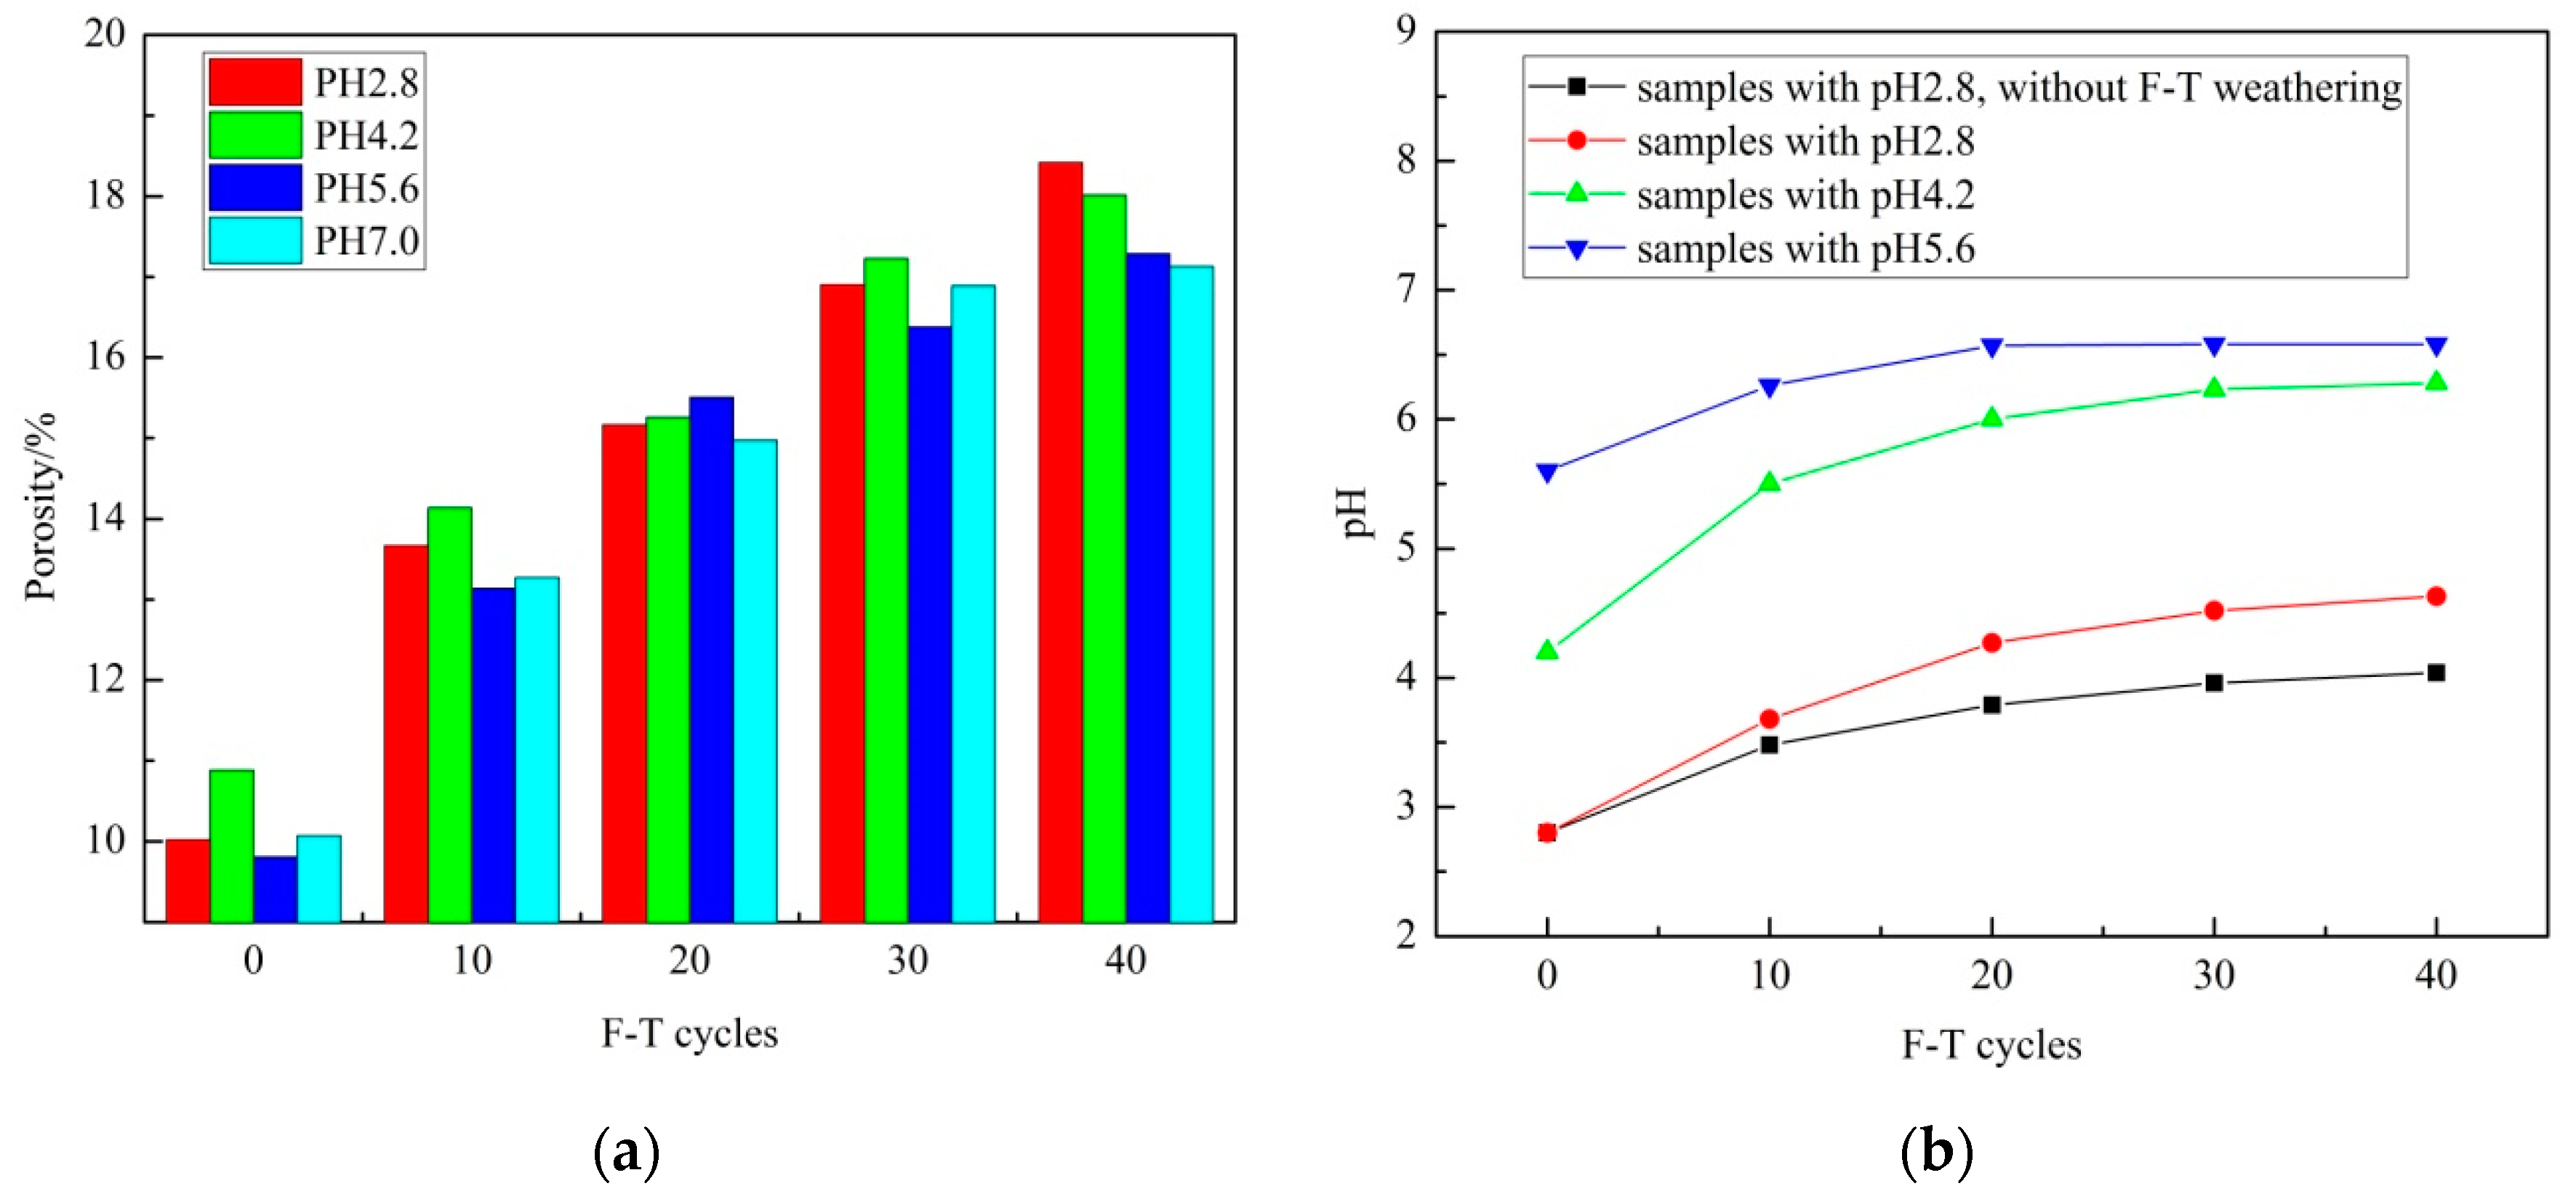
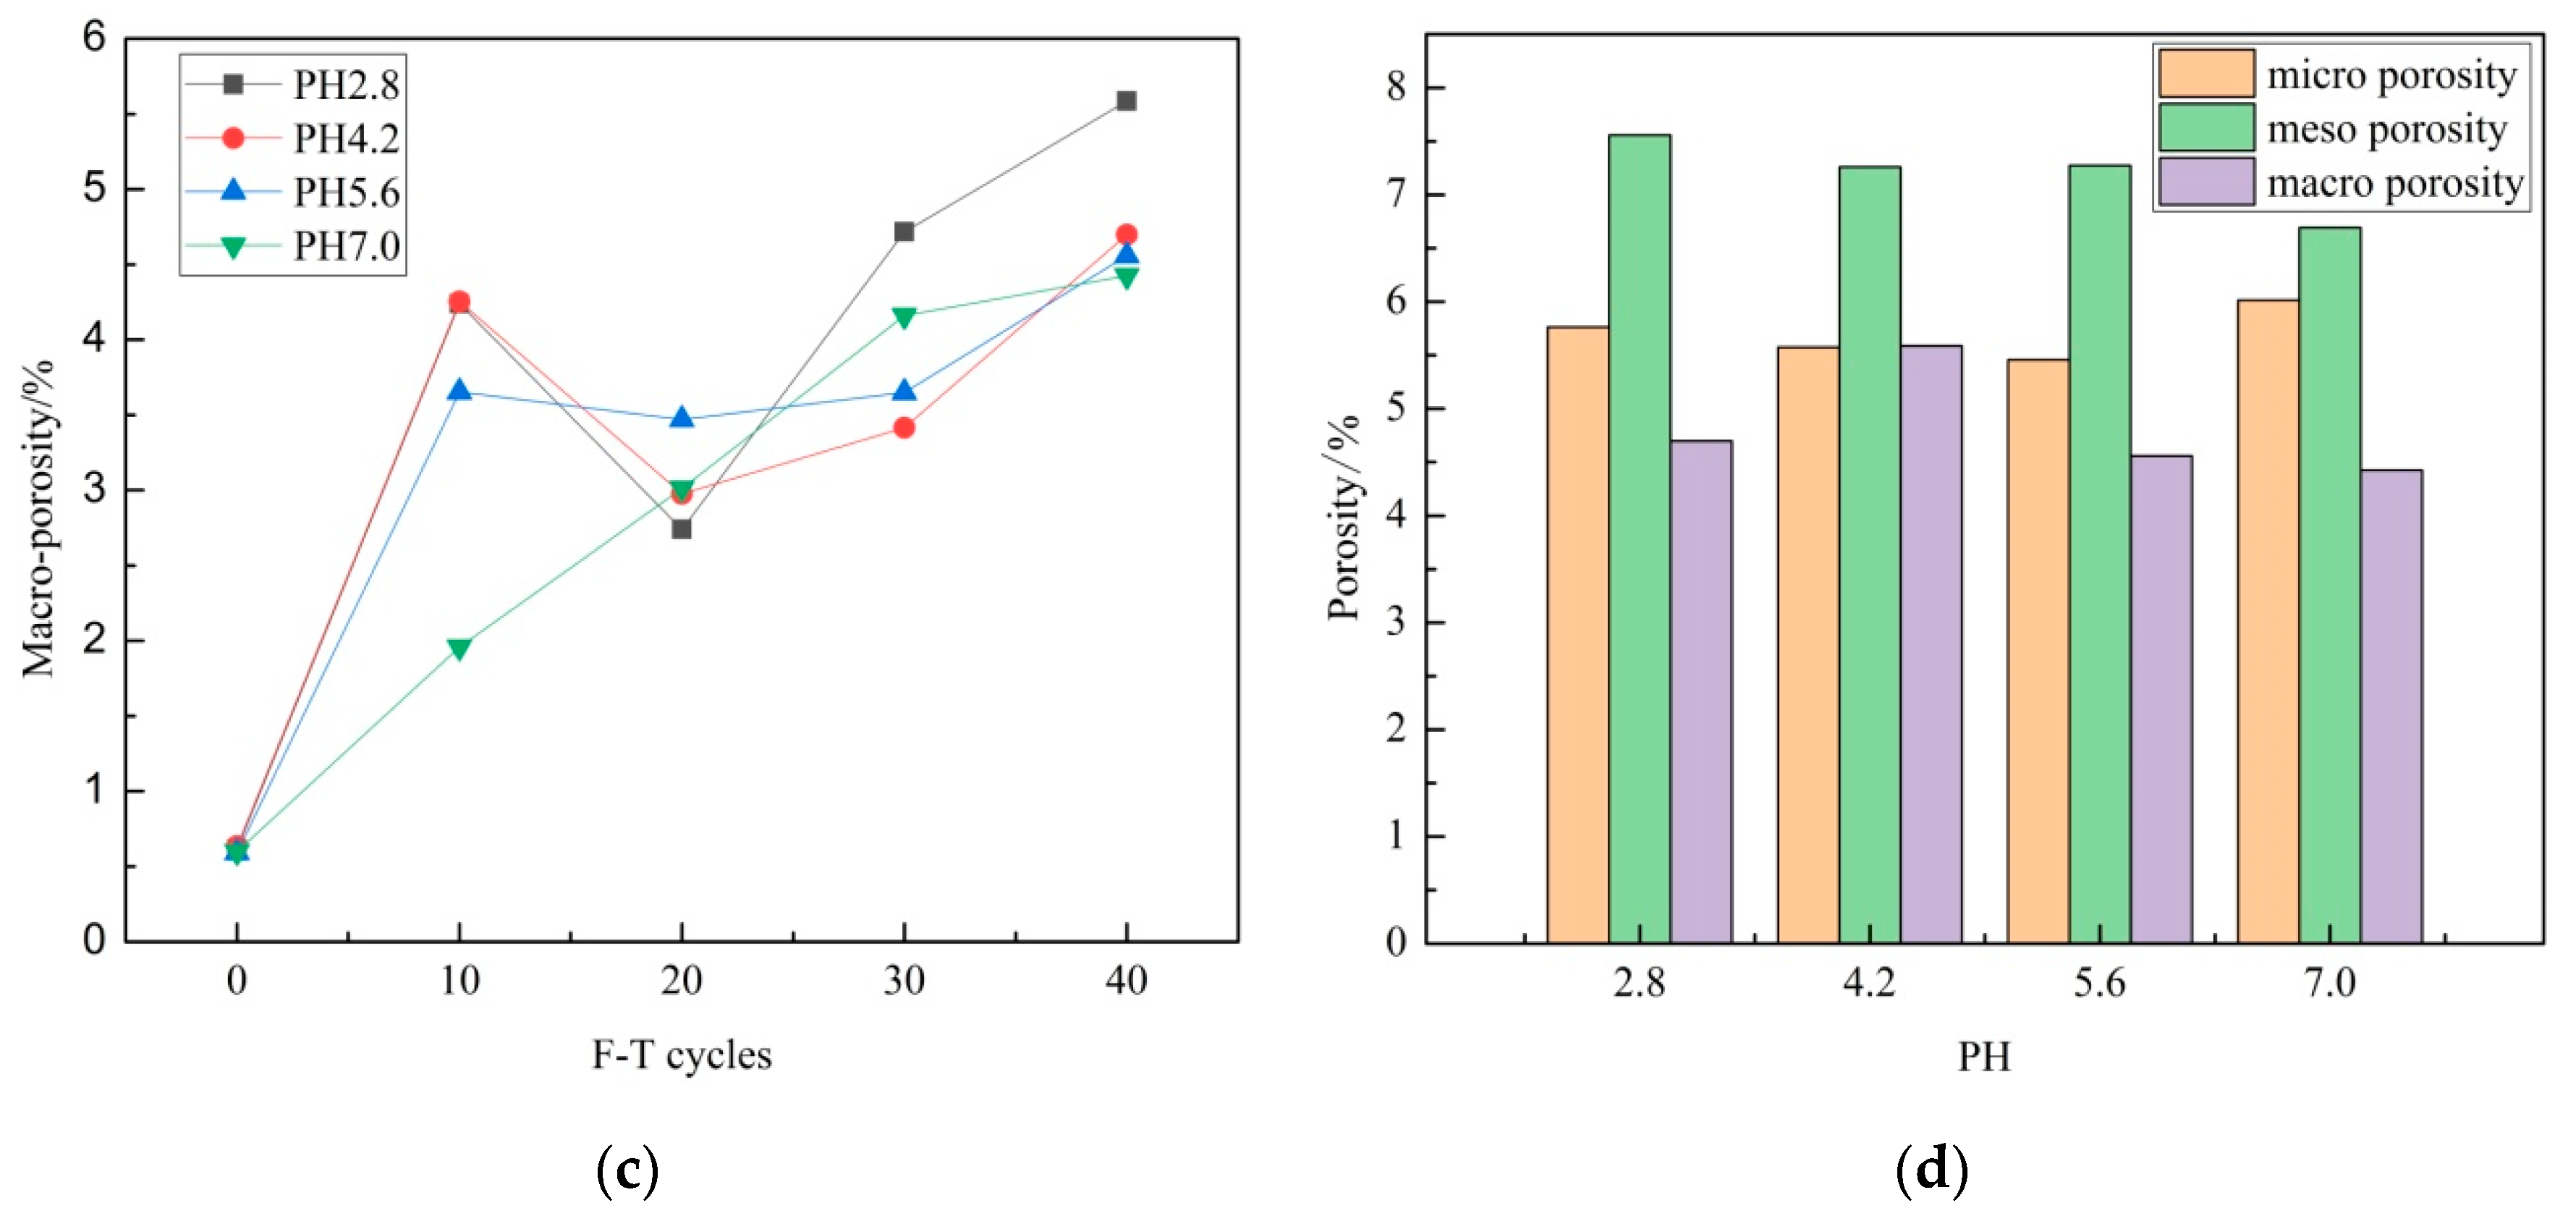
3.1. Porosity

Porosity is the ratio of total pore volume to sample volume; it represents the percentage of pore volume in the sample. The porosity of each sandstone sample is obtained from a graph, such as in Figure 2, as follows. Figure 2 is a result of sandstone samples from the NMR test. In Figure 2, T2 is linearly related to pore radii, therefore, the T2 spectrum curve represents the pore radii distribution of samples. The cumulative porosity curve is the integration of pores volume; therefore, the peak value of it represents the porosity of samples.
Figure 3a displays the porosity variation of sandstone after different F–T cycles. Figure 3a shows that the porosity of sandstone gains evident growth with F–T cycle increase. This phenomenon occurs in all acid solutions. Take samples immersed in acid solution with pH = 2.8 as an example, when the F–T cycle is 0, the porosity is 10.02%, then the porosity reaches 13.67%, 15.17%, 16.90% and 18.42% after 10, 20, 30 and 40 F–T cycles, respectively, corresponding to porosity growth rates of 36.43%, 51.37%, 68.70% and 83.83%. It can be found that the porosity grows more remarkably during 10 F–T cycles. This is mainly because the acid solution is more concentrated during 10 F–T cycles. The soluble component of sandstone, including Illite, Montmorillonite and Ferric components, dissolved faster in this period. With an F–T cycle increase, the concentration of the acid solution decreased and porosity growth rate slowed down relatively.
In terms of the effect of the acid solution on porosity growth, it has not shown a clear and consistent variation trend in the whole F–T treatment process, while the porosity growth was obviously affected by the acid solution during the 10 F–T cycles. As can be seen from Figure 3b, it records the pH of various acid solutions during the experiment and reveals that acid erosion mainly worked during the first 10 freeze–thaw cycles, as pH is exponentially related to the concentration of acid solution. As seen from Figure 3c, with the pH value goes down, the increase in porosity goes up; specifically, the porosity growth of sandstone immersed in acid solution with pH equals 2.8, 4.2, 5.6 and 7.0 under 10 F–T cycles that are 3.65%, 3.36%, 3.33% and 3.20%, respectively. Therefore, the result indicates that the coupled effect of F–T weathering and acid erosion obviously degrade the sandstone, and F–T weathering is more effective than acid erosion in the degradation.

3.2. Pore Size Distribution

According to the theory of NMR, the parameter T2 is linearly related with the pores radii. Their relationship can be expressed as Equation (5) [15,34,35,36].
r = C T 2
where r is pores radii—its unit is μm—C is the conversion coefficient between pores radii and T2. C, for most sandstones in China, is among 0.01–0.15 μm/ms [35]; C in this paper is 0.01 [36].
In terms of pore size classification, a uniform standard has not been formed, yet Li [35] classified pores into micro pores (<0.1 μm), mini pores (0.1–1 μm) meso pores (1–10 μm) and macro pores (10–100 μm). Xiao [37] divided pore sizes into small pores (<50 μm) and large pores (≥50 μm). Yan [36,38] divides sandstone into macro pores (≥1 μm), meso pores (0.1–1 μm) and mini pores (<0.1 μm). In this paper, the pore sizes of sandstone are divided into macro pores (≥1 μm), meso pores (0.1–1 μm) and micro pores (<0.1 μm). The pore size distribution of sandstone is presented as Figure 4, below.
Figure 5 displays the variation trend of three type pores of sandstone under a coupled effect of freeze–thaw weathering and acid erosion. In Figure 5, micro-porosity, meso-porosity and macro-porosity represent the porosity of micro pores, meso pores and macro pores, respectively. Figure 5a shows that micro porosity fluctuates with F–T cycle increase, which is because the coupled effect of F–T weathering and acid erosion enlarged the pore sizes of micro pores, and new micro pores were generated in this period. In Figure 5b, meso porosity displays a steady increase trend; the meso porosity rises from 4.38% to 7.26% (pH 2.8, as an example). Meso porosity is affected by two factors. One is that micro pores expend to meso pores, which increases the meso porosity. The other is that some meso pores developed to macro pores, which decreased the meso porosity. Figure 5c reveals that the macro porosity gains most remarkable growth; the meso porosity rises from 0.62% to 5.59% (pH 2.8, as an example). In Figure 5c, the macro porosity experiences a drop after 20 F–T cycles; this phenomenon can be explained by the first peel off of sandstone on the surface of the sample. Because the F–T weathering and acid erosion effect is more serious on the surface, macro pores are more distributed on the surface; when the surface peeled off, the macro porosity faces a drop. Overall, meso porosity, micro porosity and macro porosity account for the largest, second largest and lowest ratio of total porosity after 40 F–T cycles. During the experiment, macro porosity, meso porosity and micro porosity account for the largest, second largest and lowest ratio of porosity growth. It indicates that F–T weathering mainly promoted the development of macro pores and meso pores.
Figure 5d presents the porosity of samples under 40 F–T cycles in different acidic solution. It shows the ratios of porosity ranks, such as meso porosity, micro porosity and macro porosity in all acid solutions. The ratio of micro porosity decreases with the pH of solution decrease, while the ratio of meso porosity increases with the pH of solution decrease. It indicates that more micro pores are expanded to meso pores with an acidity of solution increase, and acid erosion plays major role in micro pores’ development, which leads to the decrease in micro porosity and increase in meso porosity.

3.3. Permeability

Under the coupled effect of F–T weathering and acid erosion, permeability gets a substantial increase. The permeability of sandstone under different F–T cycles and acid solutions are listed in Table 1. As for those samples immersed in different acid solutions, their permeabilities have no obvious variation trends; they just fluctuate around a level. The data in Table 1 show that permeability obviously increases with F–T cycles and the trend is similar among samples treated by different acid solutions. Take samples immersed in acid solution with pH of 2.8, for example; the permeability of sandstone gains a 2165.56% augment. To put it more precisely, the permeabilities are 79.46 × 10⁴ mD, 732.59 × 10⁻⁴ mD, 957.74 × 10⁻⁴ mD, 1415.71 × 10−4 mD and 1720.76 × 10−4 mD for samples which underwent 0, 10, 20, 30 and 40 F–T cycles, respectively.
These samples gain their most remarkable permeability growth during the first 10 F–T cycles. This can be explained from the growth trend of pore distribution shown in Figure 5. It is known that micro pores and meso pores play major roles in initial sandstone; however, macro pores account for only 0.62% of porosity. As water majorly penetrates sandstone through cracks connected by macro pores, undeveloped pore systems with few macro pores provide few water channels; therefore, the permeability of sandstone under 0 F–T cycles is small. For sandstone which underwent 10 F–T cycles, macro porosity increased from 0.62% to 4.24%; more macro pores provide more water channels, so permeability gains remarkable growth after 10 F–T cycles.

3.4. Fractal Dimensions

The fractal dimensions of porous materials reflect the self-similar structures of pores and the development degree of pore structures. Their values range from 2 to 3 [39,40]. The smaller the fractal dimension is, the stronger the homogeneity is, and the larger the fractal dimension is, the more complex and inhomogeneous the pore structure is.
In this paper, the fractal dimensions of micro pores (D1), meso pores (D2) and macro pores (D3), were analyzed, respectively, to study the fractal dimensions of sandstone more closely. Segmented fractal dimensions were calculated according to Equation (4) by the range of pore radii (T2). Fractal dimensions and correlation coefficients of sandstone under different F–T cycles and acid solutions are listed in Table 2.
Among the fractal dimensions of pores with various sizes, they show different value ranges. For micro pores, it is worth noting that their fractal dimensions range from −0.285 to 1.099, which is not within the value ranges from 2 to 3, which indicates that micro pores do not obey the fractal theory [41]. As most of the water contained inside micro pores is absorbed water and film water, their statuses are quite different from moveable water contained in meso pores and macro pores. Therefore, the small pore realm associated with very small T2 values may not be self-similar to the large pore systems and cannot be described by the fractal models in Equation (4). Therefore, fractal dimensions D2 and D3 are mainly analyzed in this paper. To display the variation trend of dimensions intuitively, the fractal dimensions of sandstone immersed in an acid solution after different F–T cycles are shown in Figure 6.
Figure 6b presents the variation trend of D2 versus F–T cycles. D2 value ranges from 2.639 to 2.738, which indicates that meso pores are complex and heterogeneous. The D2 shows an increasing trend with F–T cycles increase, while it grows slowly before 20 F–T cycles and grows fast after 20 F–T cycles. It indicates that, although the coupled effect of F–T weathering and acid erosion degraded meso pores, it did not enhance the complexity and heterogeneity of meso pores significantly within 20 cycles. After 20 F–T cycles, D2 grows faster, meso pores become more and more evident in samples, and they are more complex and heterogeneous. It is worth noting that the D2 of sandstone treated by acid solution with pH equals to 2.8 and 4.2 grow faster before 20 F–T cycles, which can be explained as acid erosion accelerating the complication and heterogeneity of samples.
As Figure 6c shows, the D3 value ranges from 2.841 to 2.979, which shows an increased trend overall, except for 20 F–T cycles. The increased trend of D3 reveals that macro pores become more complex inside sandstone with F–T cycle increase. In terms of the D3 drop, it is related to the macro porosity drop, which happened at 20 F–T cycles, shown in Figure 5c. It is caused by the first peel off of sandstone on the surface of the sample. As the macro pores are more distributed on the surface, when the surface of samples peeled off, macro pores on the surface were also eliminated; therefore, macro pores are relatively distributed homogeneously, causing the drop in D3. Dimensions of samples in different acidic solutions under 40 F–T cycles are plotted in Figure 6d to reveal the influence of acid solution on dimensions. As shown in Figure 6d, D2 and D3 increase with pH decrease, which indicates that acid erosion makes meso pores and macro pores developed and more complicated. The degree of complexity of meso pores and macro pores increases with the acidity of solution.

3.5. Relation between Parameters

3.5.1. Relation between Porosity and Permeability

Figure 7 shows the relationship between porosity and permeability of sandstone immersed in acid solution under different F–T cycles. As seen from Figure 7, porosity and permeability are exponentially correlated for sandstone immersed in solution with pH equal to 2.8, 4.2, 5.6 and 7.0. They show a strong relation with correlation coefficients of 0.967, 0.993, 0.930 and 0.965. When the porosity of sandstone is small, pores of different sizes, especially macro pores, are relatively less, and the connectivity of pores is low, while permeability stays at low level. As porosity increases, micro pores nearby combine and expand to meso pores and macro pores. Macro pores are relatively more frequent, the connectivity of pores are high, and permeability increases rapidly. Therefore, permeability increases exponentially with porosity growth.

3.5.2. Relation between Porosity and Fractal Dimensions

Figure 8 displays the relationship between porosity and fractal dimensions of sandstone immersed in acid solution under different F–T cycles. As can be seen from Figure 8, porosity is linearly correlated with fractal dimension, while the correlation coefficients are low. In Figure 8a, the correlation between porosity and meso pores fractal dimensions for sandstone immersed in solutions of pH equaling 7.0, 5.6, 4.2 and 2.8 are 0.578, 0.557, 0.866 and 0.817, respectively. It indicates that samples immersed in low acidity solution have low linear correlation between porosity and D2, while samples immersed in high acidity solution have stronger linear correlation between porosity and D2. That is because the distribution of meso pores is complicated by F–T cycles, which show rapid growth of D2, causing low linear correlation between porosity and D2. With sandstone treated by high acidity solutions, the distribution of meso pores is complicated by acidic erosion during the F–T cycles, the gap of D2 between different F–T cycles reduced and the correlation between porosity and D2 enhanced.
For the correlation between porosity and D3, their linear correlation coefficients are quite low, which indicates that there is no strong relationship between porosity and macro pores fractal dimensions. This is mainly because sandstone tends to peel off when macro pores are highly developed on its surface, resulting in D3 fluctuates in porosity.

3.5.3. Relation between Permeability and Fractal Dimensions

Figure 9 displays the relationship between porosity and permeability of sandstone immersed in acid solution under different F–T cycles. As can be seen from Figure 9a, the fractal dimension of meso pores (D2) show good linear correlation with the porosity. This means that, with the pore structure of the meso pores, it became more complex—i.e., less uniform meso pores are more likely to merge and connect and water channels are more likely to be form; therefore, permeability increases with D2. Figure 9b shows that linear correlation between porosity and fractal dimension of macro pores(D3) is not strong compared with D2. This is probably because the fractal dimension of macro pores is affected by the peeling off of the sample surface.
Based on the analysis above, it can be found that porosity has exponentially strong correlation with permeability. D2 and D3 have good linear correlation with permeability, while the correlation between porosity and fractal dimensions is not that obvious.

3.6. Discussion

The coupled effect of F–T weathering and acid erosion plays a complex role in developing the microstructure of sandstone. On the one hand, frost heaving caused by F–T weathering exerts frost heave force on pores and cracks, which drives pores and cracks to initiate and develop. On the other hand, acid erosion plays important role in developing the microstructure of sandstone. As mentioned before, sandstone adopted in this paper is composed of Quartz (95.1%), Illite (1.48%), Montmorillonite (2.32%) and Ferric component (1.1%). Ferric components are mainly made up of Fe2O3. Among these components, Illite, Montmorillonite and Fe2O3 are soluble in sulfuric acid solution—the chemical reaction is shown as follows [27]:
K x ( H 2 O ) 4 ( A l 2 x M g x ) [ S i 4 O 10 ] ( O H ) 2 + H 2 O + H + K + + M g 2 + + A l 2 O 3 2 S i O 2 2 H 2 O + H 4 S i O 4
K 1 x ( H 2 O ) x { A l 2 [ A l S i 3 O 10 ] ( O H ) 2 x ( H 2 O ) x } + H 2 O + H + K + + A l 3 + + A l 2 O 3 2 S i O 2 2 H 2 O + H 4 S i O 4
A l 2 O 3 2 S i O 2 2 H 2 O + 6 H + = 2 A l 3 + + 2 H 2 S i O 3 + 3 H 2 O
Fe 2 O 3 + 6 H + = 6 Fe 3 + + 3 H 2 O
As soluble components dissolved in the acid solution, pores and cracks expanded, which offer more space to contain water to exert the frost heave force on the microstructure. Therefore, freeze–thaw weathering and acid erosion jointly promote the development of the microstructures of sandstone.
The damage of freeze–thaw weathering accumulates as time goes on, while the damage of acid erosion declines when acid solution is consumed. As shown in Figure 3b, acid solutions are mainly consumed in the first 10 F–T cycles as the concentration of acidic solution is greatest during this period, which indicates that acid erosion mainly worked during the first 10 F–T cycles. This explains the remarkable increase in porosity and permeability during the first 10 F–T cycles, which are shown in Figure 3 and Figure 5 and Table 1.
In terms of the effect of pH on porosity increase, the phenomenon of porosity increase with pH decrease occurs during the first 10 F–T cycles. Solutions with low pH are more concentrated. Soluble components are dissolved more easily and, therefore, porosity increase grows with pH decrease during 10 F–T cycles, as shown in Figure 3c. However, acid erosion weakens with acid solutions consumed, while F–T weathering strengthen with time goes on. Therefore, porosity increase caused by F–T weathering exceeded and covered that caused by acid erosion. As a consequence, the meaningful effect of PH on the microstructure is hard to find.
Figure 10 displays the view of sandstone after different F–T cycles. As can be seen from Figure 10b, the acid erosion during the first 10 F–T cycles made the surface of sandstone coarser. When the F–T cycles come to 20, as shown in Figure 10c, the end of the sample peeled off, which may explain the drop in macro-porosity in Figure 5c. Then, the damage of sandstone deteriorated with F–T cycles adds up, as shown in Figure 10d,e. Figure 10 intuitively shows that F–T weathering contributes more to the damage and microstructure development of sandstone than acid erosion in this experiment.
However, the influence of pH on the damage and microstructure development is unclear in this paper. Based on the analysis above, it is easy to find that the influences of F–T cycles on porosity, permeability and fractal dimensions are clear, while the influence of pH on them is not that clear. This is the weak point of this paper. On the one hand, it is believed that the effect of F–T weathering covered the effect of acid erosion with time add-up. On the other hand, acid solutions are mainly consumed within the first 10 F–T cycles, while acid solutions are not supplemented. This aspect deserves further experimental investigation in the future.

4. Conclusions

In this paper, sandstone treated by a coupled effect of F–T weathering and acid erosion were tested by NMR, then microscopic characteristics, including porosity, pore size distribution, permeability, fractal dimensions and their correlation, were acquired and analyzed. The conclusions are summarized as follows.
(1)
The porosity of sandstone increases with F–T cycle increase, while the porosity increase grows with pH decrease during 10 F–T cycles. F–T weathering contributes more to porosity growth than acid erosion in this experiment.
(2)
In the experiment, macro porosity, meso porosity and micro porosity account for the largest, second and least ratio of porosity growth. Meso porosity, micro porosity and macro porosity account for the largest, second and least ratio of total porosity after 40 F–T cycles. Acid erosion plays a major role in micro pores’ development. F–T weathering plays major role in meso pores’ and macro pores’ development.
(3)
Permeability obviously increases with F–T cycle increase, while acid erosion exerts little influence on permeability increase overall. The permeability of sandstone immersed in acid solution with pH equal to 2.8 reached 1720.76 × 104 mD from the original 79.46 × 10⁻⁴ mD after 40 F–T cycles.
(4)
The fractal dimensions of meso pores (D2) range from 2.639 to 2.738, and the fractal dimensions of macro pores (D3) range from 2.841 to 2.979. D2 and D3 increase with F–T cycle increase overall, and they increase with pH decrease overall.
(5)
Porosity has an exponentially strong correlation with permeability. D2 and D3 have good linear correlation with permeability, while the correlations between porosity and fractal dimensions are not that obvious.

Author Contributions

Conceptualization, S.Y. and H.D.; methodology, S.Y. and H.D.; software, G.T.; validation, S.Y., J.D. and G.T.; formal analysis, S.Y.; investigation, J.D.; resources, J.D.; data curation, G.T.; writing—original draft preparation, S.Y.; writing—review and editing, S.Y.; visualization, G.T.; supervision, H.D.; project administration, H.D.; funding acquisition, H.D. All authors have read and agreed to the published version of the manuscript.

Funding

This work was financially supported by the National Natural Science Foundation of China under Grant number 51874352.

Conflicts of Interest

The authors declare no conflict of interest.

References

  1. Zhang, J.; Miao, L.; Yang, Z. Research on rock degradation and deterioration mechanisms and mechanical characteristics under cyclic freezing-thawing. Chin. J. Rock Mech. Eng. 2008, 27, 1688–1694. [Google Scholar]
  2. Chatterji, S. Aspects of the freezing process in a porous material–water system. Cem. Concr. Res. 1999, 29, 627–630. [Google Scholar] [CrossRef]
  3. Taber, S. The Mechanics of Frost Heaving. J. Geol. 1930, 38, 303–317. [Google Scholar] [CrossRef]
  4. Taber, S. Frost Heaving. J. Geol. 1929, 37, 428–461. [Google Scholar] [CrossRef]
  5. Yamabe, T.; Neaupane, K. Determination of some thermo-mechanical properties of Sirahama sandstone under subzero temperature condition. Int. J. Rock Mech. Min. Sci. 2001, 38, 1029–1034. [Google Scholar] [CrossRef]
  6. Zhang, H.; Yang, G. Freeze-thaw cycling and mechanical experiment and damage propagation characteristics of rock. J. China Univ. Min. Technol. 2011, 40, 140–146. [Google Scholar]
  7. Jia, H.; Xiang, W.; Tan, L.; Zhang, W.; Zeng, W.; Cao, S.; Cheng, C. Theoretical analysis of the mechanism of frost damage of sandstone and further experimental verification. Chin. J. Rock Mech. Eng. 2016, 35, 1–17. [Google Scholar]
  8. Inada, Y.; Yokota, K. Some studies of low temperature rock strength. Int. J. Rock Mech. Min. Sci. Géoméch. Abstr. 1984, 21, 145–153. [Google Scholar] [CrossRef]
  9. Feng, B.I.N. Study on Dynamic Mechanical Properties and Micro-Structure Mechanism of Rock under Freeze-Thaw Cycles; Central South University: Changsha, China, 2014. [Google Scholar]
  10. Ke, B.; Zhou, K.; Xu, C.; Deng, H.; Li, J.; Bin, F. Dynamic Mechanical Property Deterioration Model of Sandstone Caused by Freeze–Thaw Weathering. Rock Mech. Rock Eng. 2018, 51, 2791–2804. [Google Scholar] [CrossRef]
  11. Liu, C.; Deng, J.; Yu, S.; Li, P.; Lin, Y. Effect of Freezing and Thawing on Microstructure Damage and Dynamic Flexural Tension of Granite. Rock Mech. Rock Eng. 2020, 1–6. [Google Scholar] [CrossRef]
  12. Vlahou, I.; Worster, M.G. Ice growth in a spherical cavity of a porous medium. J. Glaciol. 2010, 56, 271–277. [Google Scholar] [CrossRef] [Green Version]
  13. Kranz, R.L. Crack-crack and crack-pore interactions instresses granite. Int. J. Rock Mech. Min. Sci. Geomech. Abstr. 1979, 16, 37–47. [Google Scholar] [CrossRef]
  14. Monteiro, P.J.M.; Rashed, A.I.; Bastacky, S.J.; Hayes, T.L. Ice in cementpaste as analyzed in the low-temperature scanning electron microscope. Cem. Concr. Res. 1989, 19, 306–314. [Google Scholar] [CrossRef]
  15. Li, J.; Kaunda, R.B.; Zhu, L.; Zhou, K.; Gao, F. Experimental Study of the Pore Structure Deterioration of Sandstones under Freeze-Thaw Cycles and Chemical Erosion. Adv. Civ. Eng. 2019, 2019, 9687843. [Google Scholar] [CrossRef]
  16. Ke, B.; Zhou, K.; Deng, H.; Bin, F. NMR Pore Structure and Dynamic Characteristics of Sandstone Caused by Ambient Freeze-Thaw Action. Shock. Vib. 2017, 2017, 9728630. [Google Scholar] [CrossRef] [Green Version]
  17. Ding, W.; Xu, T.; Wang, H.; Chen, J.P. Experimental study of mechanical property of limestone under coupled chemical solution and freeze-thaw process. Chin. J. Rock Mech. Eng. 2015, 34, 979–985. [Google Scholar]
  18. Tian, W. Experiment Study on Freezing-Thawing Damage Mechanism of Rock under the Condition of Coupling of Multiple Factors; Central South University: Changsha, China, 2014. [Google Scholar]
  19. Lin, Y.; Zhou, K.; Gao, R.; Li, J.; Zhang, J. Influence of Chemical Corrosion on Pore Structure and Mechanical Properties of Sandstone. Geofluids 2019, 2019, 9728630. [Google Scholar] [CrossRef]
  20. Yang, G.S.; Zhang, Q.S.; Ren, J.X. Study on the effect of freezing rate on the damage CT values of Tongchuan sandstone. Chin. J. Rock Mech. Eng. 2004, 23, 4099–4104. [Google Scholar]
  21. Yang, G.; Zhang, Q.; Pu, Y. Preliminary study on meso-damage propagation characteristics of rock under condition of freezing temperature. Chin. J. Rock Soil Mech. 2004, 25, 1409–1412. [Google Scholar]
  22. Lai, J.; Wang, G.; Wang, Z.; Chen, J.; Pang, X.; Wang, S.; Zhou, Z.; He, Z.; Qin, Z.; Fan, X. A review on pore structure characterization in tight sandstones. Earth-Science Rev. 2018, 177, 436–457. [Google Scholar] [CrossRef]
  23. Zhang, J.; Deng, H.; Taheri, A.; Ke, B.; Liu, C.-J.; Yang, X. Degradation of physical and mechanical properties of sandstone subjected to freeze-thaw cycles and chemical erosion. Cold Reg. Sci. Technol. 2018, 155, 37–46. [Google Scholar] [CrossRef]
  24. Liu, C.-J.; Deng, H.; Zhao, H.; Zhang, J. Effects of freeze-thaw treatment on the dynamic tensile strength of granite using the Brazilian test. Cold Reg. Sci. Technol. 2018, 155, 327–332. [Google Scholar] [CrossRef]
  25. Li, J.; Zhou, K.-P.; Liu, W.-J.; Deng, H.-W. NMR research on deterioration characteristics of microscopic structure of sandstones in freeze–thaw cycles. Trans. Nonferrous Met. Soc. China 2016, 26, 2997–3003. [Google Scholar] [CrossRef]
  26. Deng, H.; Yu, S.; Deng, J. Damage Characteristics of Sandstone Subjected to Coupled Effect of Freezing-Thawing Cycles and Acid Environment. Adv. Civ. Eng. 2018, 2018, 3560780. [Google Scholar] [CrossRef] [Green Version]
  27. Gao, R.; Zhou, K.; Li, J. Research of the mechanisms of backfill formation and damage. Mater. Tehnol. 2018, 52, 163–169. [Google Scholar] [CrossRef]
  28. Skjetne, T.; Southon, T.; Hafskjold, B.; Selle, O.; Svorstøl, I.; Buller, A.; Rueslåtten, H.; Brayshaw, A.; Kalam, M. Nuclear magnetic resonance studies of reservoir core plugs: A preliminary investigation of the influence of mineralogy on T1. Magn. Reson. Imaging 1991, 9, 673–679. [Google Scholar] [CrossRef]
  29. Mao, Z.-Q.; Xiao, L.; Wang, Z.-N.; Jin, Y.; Liu, X.-G.; Xie, B. Estimation of Permeability by Integrating Nuclear Magnetic Resonance (NMR) Logs with Mercury Injection Capillary Pressure (MICP) Data in Tight Gas Sands. Appl. Magn. Reson. 2012, 44, 449–468. [Google Scholar] [CrossRef]
  30. Yu, B.; Cheng, P. A fractal permeability model for bi-dispersed porous media. Int. J. Heat Mass Transf. 2002, 45, 2983–2993. [Google Scholar] [CrossRef]
  31. Guo, X.; Huang, Z.; Zhao, L.; Han, W.; Ding, C.; Sun, X.; Yan, R.; Zhang, T.; Yang, X.; Wang, R. Pore structure and multi-fractal analysis of tight sandstone using MIP, NMR and NMRC methods: A case study from the Kuqa depression, China. J. Pet. Sci. Eng. 2019, 178, 544–558. [Google Scholar] [CrossRef]
  32. Zhang, Z.; Weller, A. Fractal dimension of pore-space geometry of an Eocene sandstone formation. Geophysics 2014, 79, D377–D387. [Google Scholar] [CrossRef]
  33. Zhou, S.; Liu, D.; Cai, Y.; Yao, Y. Fractal characterization of pore–fracture in low-rank coals using a low-field NMR relaxation method. Fuel 2016, 181, 218–226. [Google Scholar] [CrossRef]
  34. Kenyon, W.E. Nuclear magnetic resonance as petro physical measurement. Int. J. Radiat. Appl. Instrum. Part E Nucl. Geophys. 1992, 6, 153–171. [Google Scholar]
  35. Li, J.; Kaunda, R.B.; Zhou, K. Experimental investigations on the effects of ambient freeze-thaw cycling on dynamic properties and rock pore structure deterioration of sandstone. Cold Reg. Sci. Technol. 2018, 154, 133–141. [Google Scholar] [CrossRef]
  36. Zhang, J.; Deng, H.; Deng, J.; Gao, R. Fractal Analysis of Pore Structure Development of Sandstone: A Nuclear Magnetic Resonance Investigation. IEEE Access 2019, 7, 47282–47293. [Google Scholar] [CrossRef]
  37. Xiao, L.Z. NMR Imaging Logging Principles and Applications; Science Press: Beijing, China, 1998. [Google Scholar]
  38. Yan, J.P.; Wen, D.N.; Li, Z.Z.; Geng, B.; Jin-Gong, C.; Qiang, L.; Yu, Y. The quantitative evaluation method of low permeable sandstone pore structure based on nuclear magnetic resonance (NMR) logging. Chin. J. Geophys. 2016, 59, 1543–1552. [Google Scholar]
  39. Giri, A.; Tarafdar, S.; Gouze, P.; Dutta, T. Fractal pore structure of sedimentary rocks: Simulation in 2-d using a relaxed bidisperse ballistic deposition model. J. Appl. Geophys. 2012, 87, 40–45. [Google Scholar] [CrossRef]
  40. Cai, J.; Yu, B.; Zou, M.; Mei, M. Fractal analysis of invasion depth of extraneous fluids in porous media. Chem. Eng. Sci. 2010, 65, 5178–5186. [Google Scholar] [CrossRef]
  41. Wang, Z.; Pan, M.; Shi, Y.; Liu, L.; Xiong, F.; Qin, Z. Fractal Analysis of Dong he tang Sandstones Using NMR Measurements. Energy Fuels 2018, 32, 2973–2982. [Google Scholar] [CrossRef]
Figure 1. A plot of lg ( S V ) versus lg T 2 of sandstone, the slope of lg ( S V ) versus lg T 2 represents the value of 3-D; D1 represents fractal dimension of micro pores, D2 represents fractal dimension of meso pores and D3 represents fractal dimension of macro pores.
Applsci 10 05699 g001
Figure 2. T2 distribution and cumulative porosity curve of sandstone.
Applsci 10 05699 g002
Figure 3. Porosity and pH after different F–T cycles: (a) porosity of sandstone after various F–T cycles under different solution, (b) pH varies with F–T cycles, (c) porosity increase of 10 F–T cycles treated sandstone immersed in solution with different pH.
Applsci 10 05699 g003aApplsci 10 05699 g003b
Figure 4. Diagram presents pore size distribution on the T2 spectrum curve.
Applsci 10 05699 g004
Figure 5. Porosity of sandstone immersed in acid solution after different F–T cycles: (a) micro-porosity; (b) meso-porosity; (c) macro-porosity; (d) porosity of samples under 40 F–T cycles in different acidic solutions.
Applsci 10 05699 g005aApplsci 10 05699 g005b
Figure 6. Segmented fractal dimensions of sandstone immersed in acid solutions after different F–T cycles: (a) micro-pore dimension D1; (b) meso-pore dimension D2; (c) macro-pore dimension D3; (d) D2 and D3 of samples in different acidic solutions under 40 F–T cycles.
Applsci 10 05699 g006
Figure 7. Correlation between porosity and permeability for sandstone immersed in different acidic solutions.
Applsci 10 05699 g007
Figure 8. Correlation between porosity and segment fractal dimensions for sandstone immersed in different acidic solution: (a) fractal dimensions D2; (b) fractal dimensions D3.
Applsci 10 05699 g008
Figure 9. Correlation between permeability and segment fractal dimensions for sandstone immersed in different acidic solutions: (a) fractal dimensions D2; (b) fractal dimensions D3.
Applsci 10 05699 g009
Figure 10. View of sandstone immersed in acid solution with pH of 2.8 after various F–T cycles: (a) 0 cycles, (b) 10 cycles, (c) 20 cycles, (d) 30 cycles, (e) 40 cycles.
Applsci 10 05699 g010
Table 1. Permeability of sandstone under different F–T cycles and acid solution.
Permeability/10−4 mDPH of Acid Solution
2.84.25.67.0
F–T cycles079.4654.9251.7843.17
10732.59429.78633.42616.06
20957.74622.90698.76654.34
301415.711083.411127.651275.99
401720.761714.751461.221657.65
Table 2. Fractal dimensions of sandstone under different F–T cycles and acid solutions.
PHF–T CyclesD1R2D2R2D3R2
2.80−0.1510.7882.6430.9982.8860.870
10−0.1570.7912.6480.9972.8930.861
200.2390.8312.6970.9982.8410.823
30−0.2750.7862.7000.9952.9400.735
40−0.0500.7722.7380.8822.9690.877
4.20−0.1540.7892.6440.9972.8880.870
10−0.1150.7882.6660.9982.8940.856
201.0990.8572.6620.9992.8640.828
30−0.2670.7842.7120.9992.9270.826
40−0.0840.7782.7170.9692.9790.987
5.60−0.1690.7932.6390.9962.8840.894
10−0.1550.7892.6450.9972.8960.861
200.0690.862.6450.9982.8640.833
30−0.2850.7882.6890.9992.9220.807
40−0.0500.7722.7380.8822.9690.877
7.00−0.1210.7892.6570.9972.8910.876
10−0.1070.7872.6480.9972.8960.861
201.0840.8642.6440.9992.8860.842
30−0.2110.782.7150.9992.9260.800
40−0.0500.7722.7380.8822.9690.877

